Chemical and Morphological Transition of Poly(acrylonitrile)/Poly(vinylidene Fluoride) Blend Nanofibers during Oxidative Stabilization and Incipient Carbonization


 , ,
, ,  ,
,  ,
,  , ,
, , 
Abstract
1. Introduction
2. Materials and Methods
2.1. Sample Preparation
2.2. Characterization Methods
3. Results
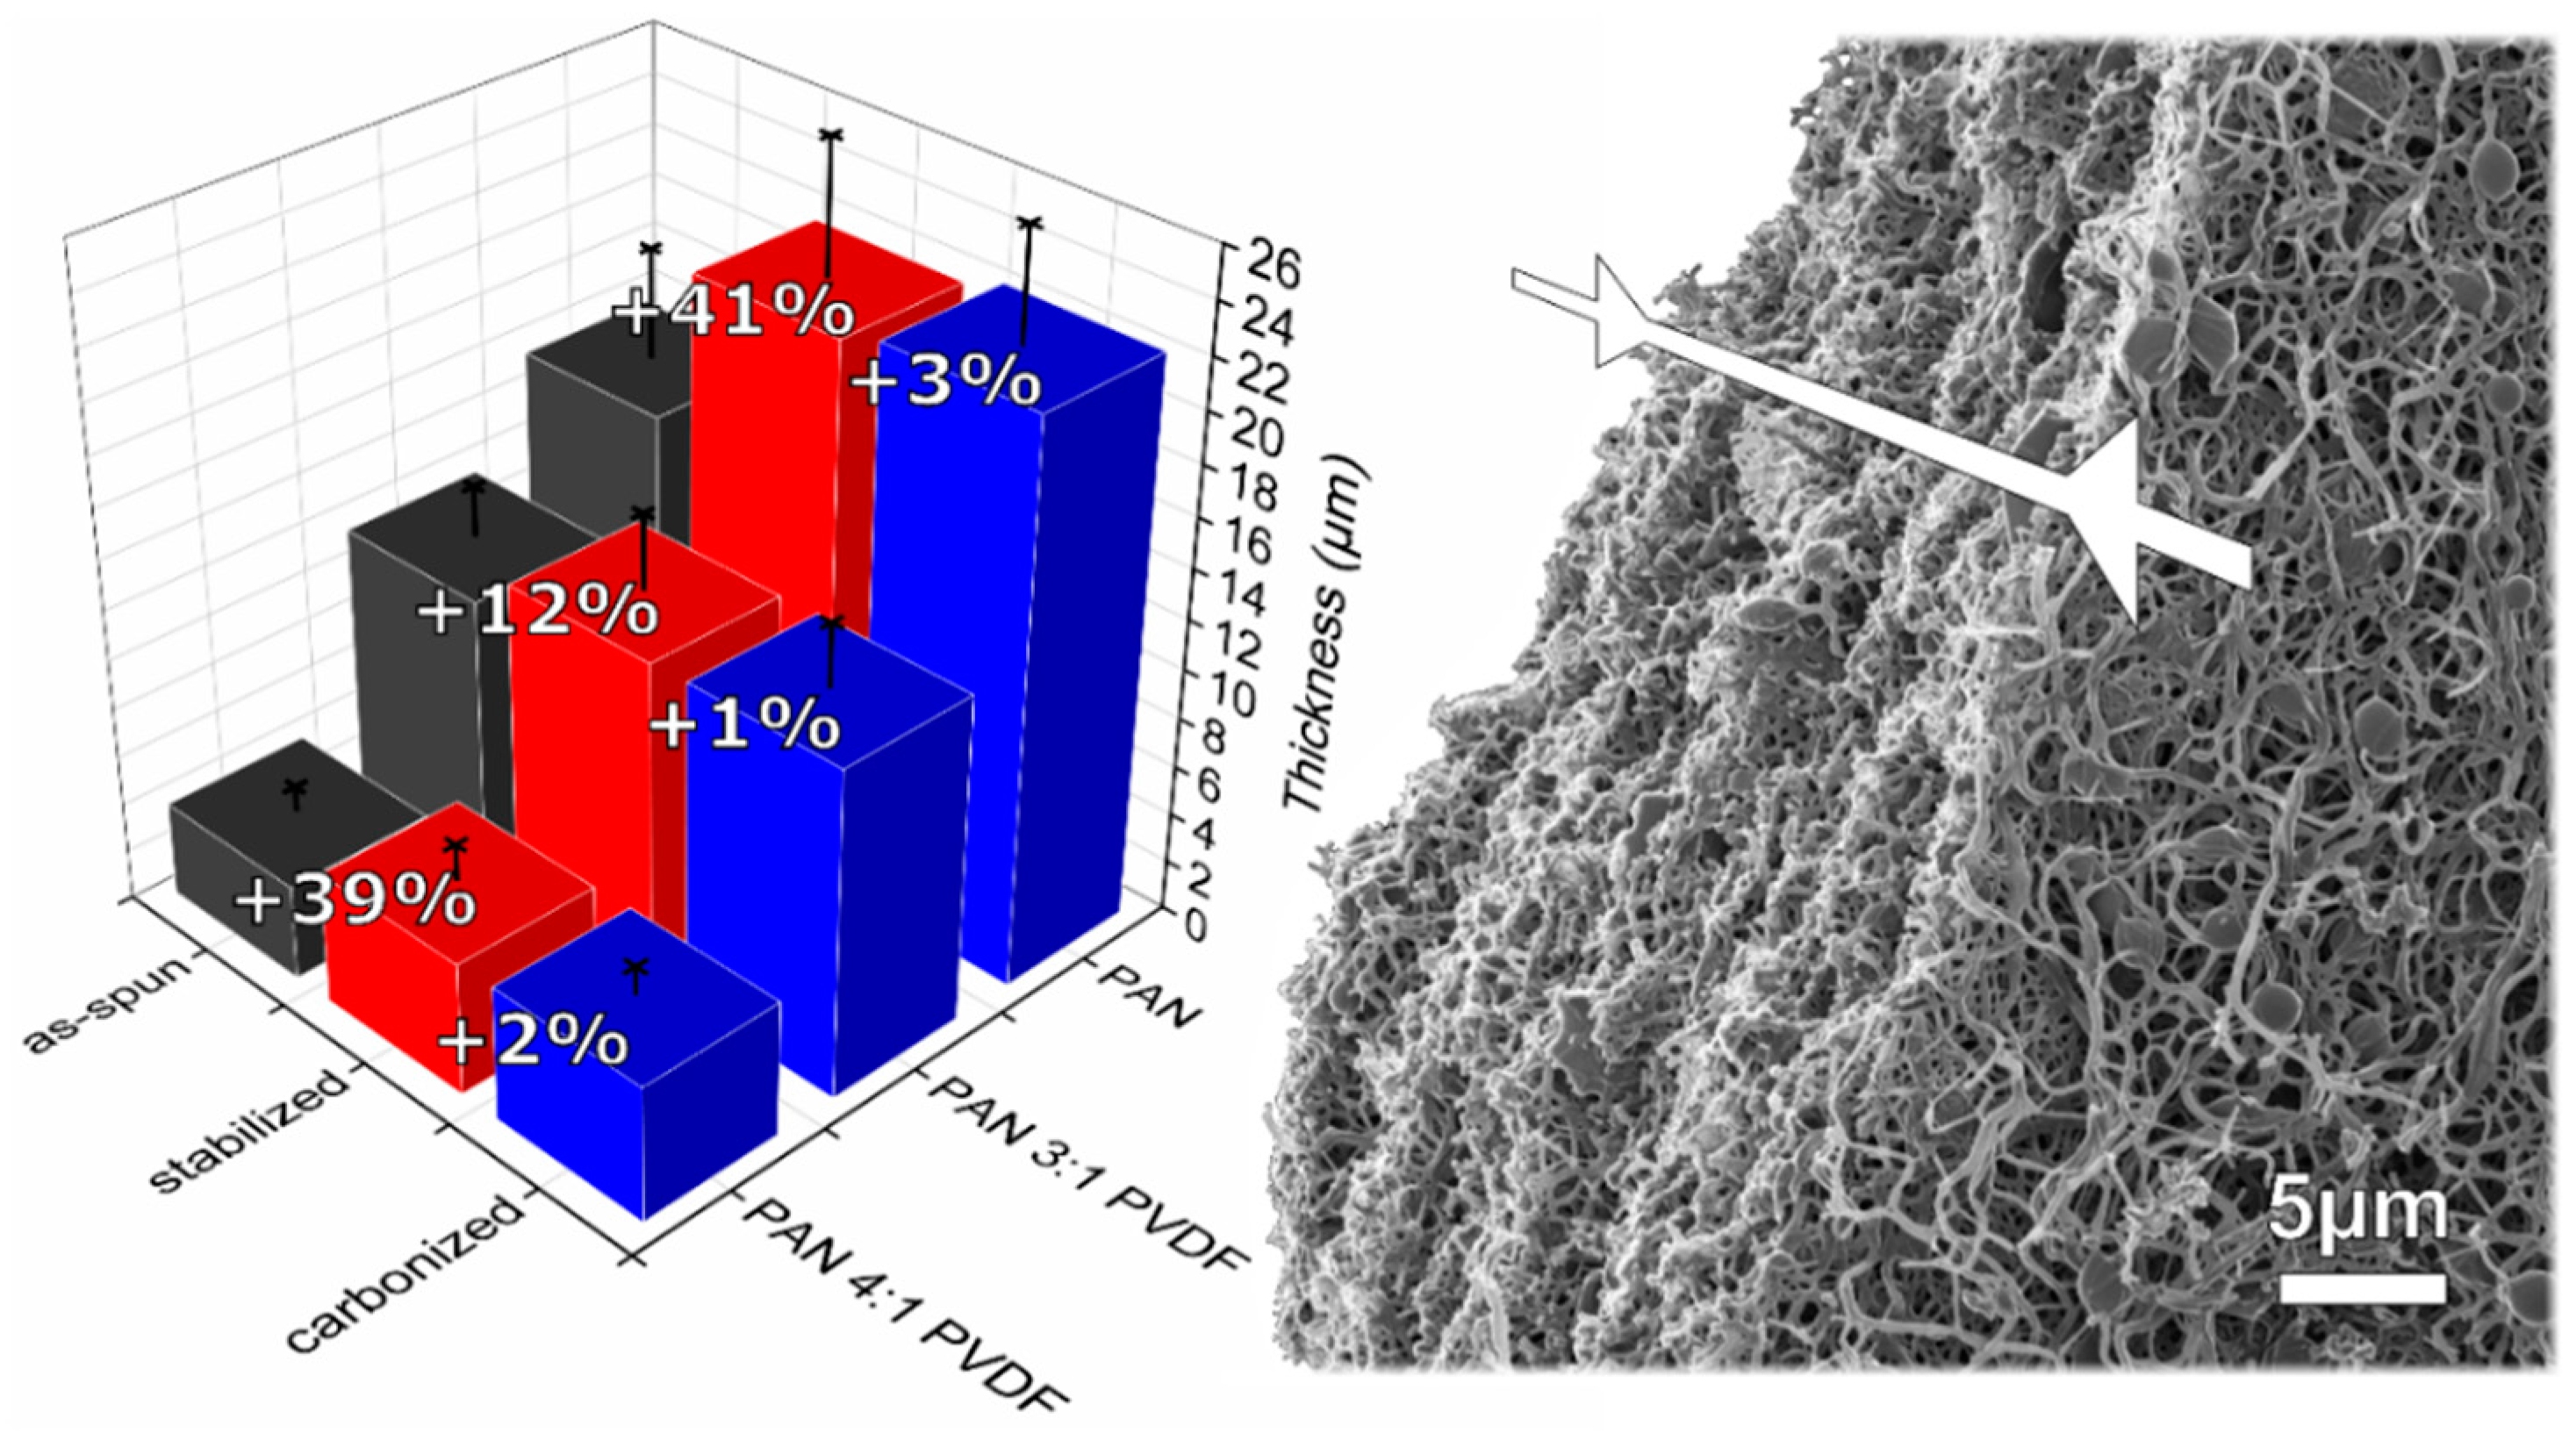
3.1. Morphology
3.2. Polymer Composition
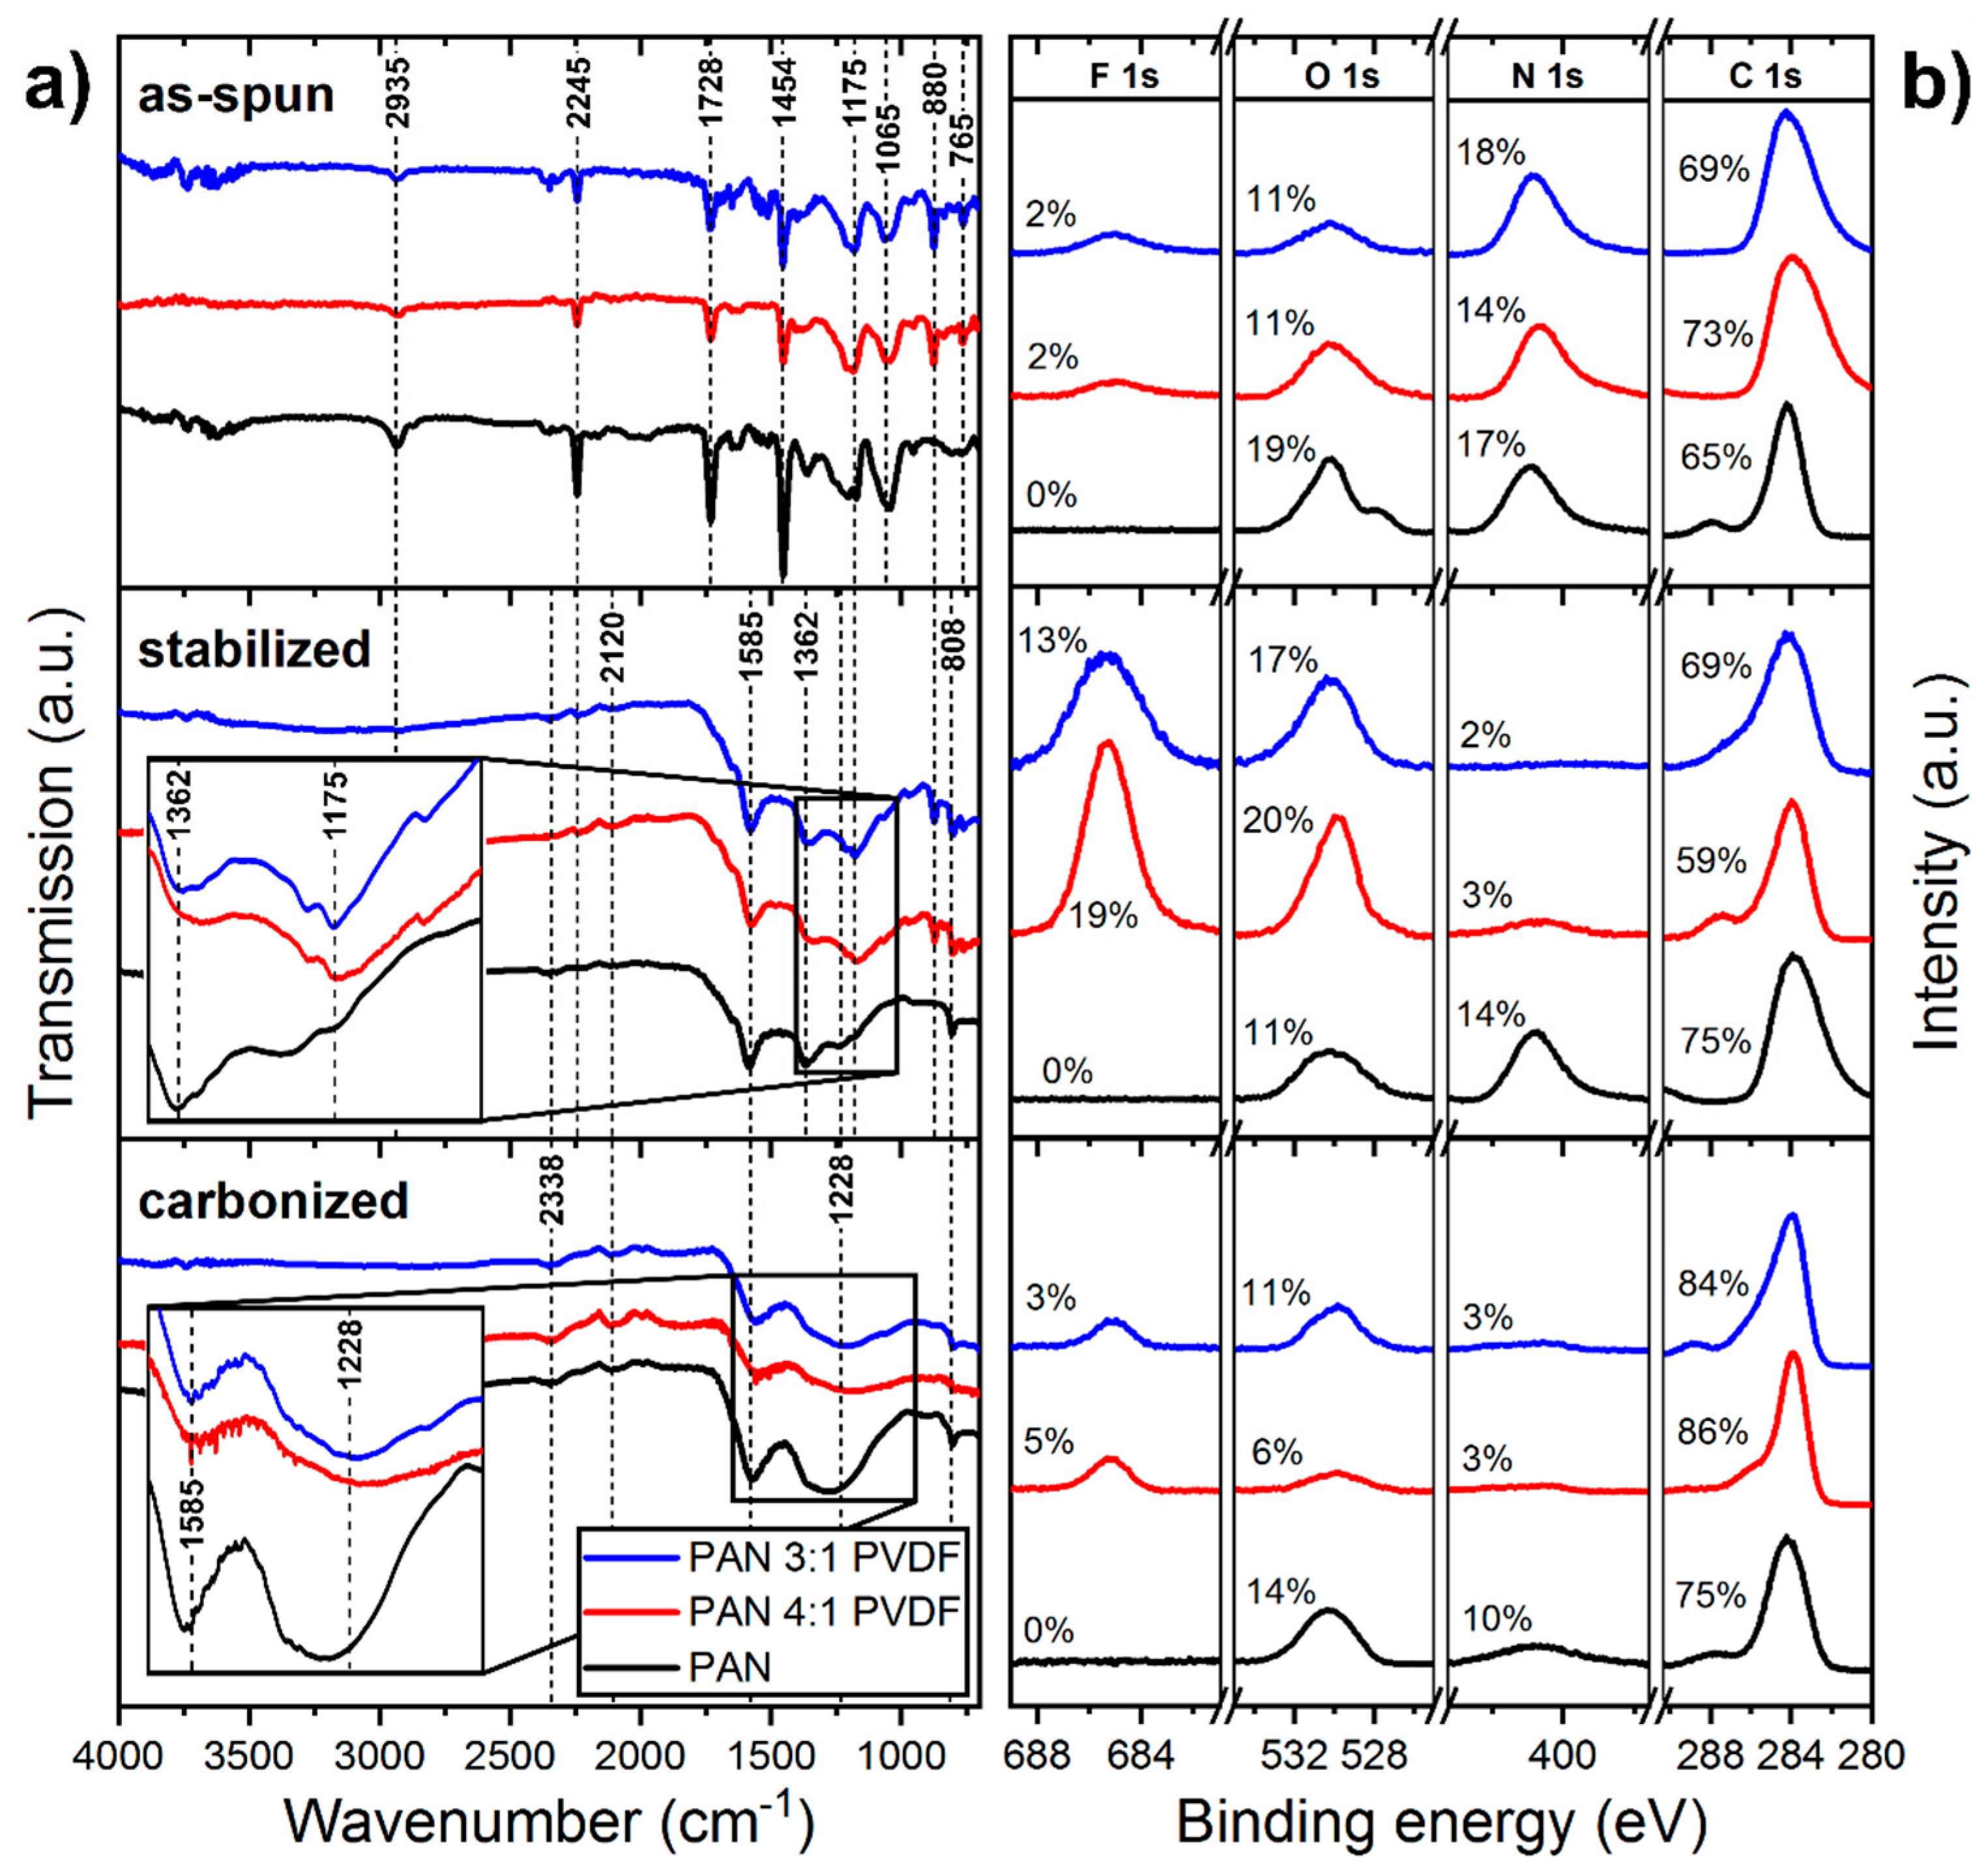
3.3. Chemical Structure
3.4. Electrical Properties
4. Conclusions
Author Contributions
Funding
Conflicts of Interest
References
- Teo, W.E.; Ramakrishna, S. A review on electrospinning design and nanofibre assemblies. Nanotechnology 2006, 17, R89. [Google Scholar] [CrossRef] [PubMed]
- Ramakrishna, S.; Fujihara, K.; Teo, W.E.; Yong, T.; Ma, Z.; Ramaseshan, R. Electrospun nanofibers: Solving global issues. Mater. Today 2006, 9, 40–50. [Google Scholar] [CrossRef]
- Huang, Z.M.; Zhang, Y.Z.; Kotaki, M.; Ramakrishna, S. A review on polymer nanofibers by electrospinning and their applications in nanocomposites. Compos. Sci. Technol. 2003, 63, 2223–2253. [Google Scholar] [CrossRef]
- Shofner, M.L.; Rodríguez-Macías, F.J.; Vaidyanathan, R.; Barrera, E.V. Single wall nanotube and vapor grown carbon fiber reinforced polymers processed by extrusion freeform fabrication. Compos. Part A Appl. Sci. 2003, 34, 1207–1217. [Google Scholar] [CrossRef]
- Sambaer, W.; Zatloukal, M.; Kimmer, D. 3D modeling of filtration process via polyurethane nanofiber based nonwoven filters prepared by electrospinning process. Chem. Eng. Sci. 2011, 66, 613–623. [Google Scholar] [CrossRef]
- Kadam, V.V.; Wang, L.; Padhye, R. Electrospun nanofibre materials to filter air pollutants—A review. J. Ind. Text. 2018, 47, 2253–2280. [Google Scholar] [CrossRef]
- Roche, R.; Yalcinkaya, F. Incorporation of PVDF nanofibre multilayers into functional structure for filtration applications. Nanomaterials 2018, 8, 771. [Google Scholar] [CrossRef] [PubMed]
- Wang, L.; Yu, Y.; Chen, P.C.; Zhang, D.W.; Chen, C.H. Electrospinning synthesis of C/Fe3O4 composite nanofibers and their application for high performance lithium-ion batteries. J. Power Sources 2008, 183, 717–723. [Google Scholar] [CrossRef]
- Viet, A.L.; Reddy, M.V.; Jose, R.; Chowdari, B.V.R.; Ramakrishna, S. Nanostructured Nb2O5 polymorphs by electrospinning for rechargeable lithium batteries. J. Phys. Chem. C 2009, 114, 664–671. [Google Scholar] [CrossRef]
- Salinas Torres, D.; Ruiz-Rosas, R.; Morallon, E.; Cazorla-Amorós, D. Strategies to enhance the performance of electrochemical capacitors based on carbon materials. Front. Mater. 2019, 6, 115. [Google Scholar] [CrossRef]
- Duarte, E.A.; Rudawski, N.G.; Quintero, P.A.; Meisel, M.W.; Nino, J.C. Electrospinning of superconducting YBCO nanowires. Supercond. Sci. Technol. 2014, 28, 015006. [Google Scholar] [CrossRef]
- Song, J.; Chen, M.; Olesen, M.B.; Wang, C.; Havelund, R.; Li, Q.; Xie, E.; Yang, R.; Bøggild, P.; Wang, C.; et al. Direct electrospinning of Ag/polyvinylpyrrolidone nanocables. Nanoscale 2011, 3, 4966–4971. [Google Scholar] [CrossRef] [PubMed]
- Sill, T.J.; von Recum, H.A. Electrospinning: Applications in drug delivery and tissue engineering. Biomaterials 2008, 29, 1989–2006. [Google Scholar] [CrossRef] [PubMed]
- Pant, B.; Park, M.; Park, S.J. Drug delivery applications of core-sheath nanofibers prepared by coaxial electrospinning: A review. Pharmaceutics 2019, 11, 305. [Google Scholar] [CrossRef]
- Trabelsi, M.; Mamun, A.; Klöcker, M.; Sabantina, L.; Großerhode, C.; Blachowicz, T.; Ehrmann, A. Increased Mechanical Properties of Carbon Nanofiber Mats for Possible Medical Applications. Fibers 2019, 7, 98. [Google Scholar] [CrossRef]
- Niu, H.; Lin, T. Fiber generators in needleless electrospinning. J. Nanomater. 2012, 2012, 12. [Google Scholar] [CrossRef]
- Sasithorn, N.; Martinová, L. Fabrication of silk nanofibres with needle and roller electrospinning methods. J. Nanomater. 2014, 2014, 140. [Google Scholar] [CrossRef]
- Yener, F.; Jirsak, O. Comparison between the needle and roller electrospinning of polyvinylbutyral. J. Nanomater. 2012, 2012, 13. [Google Scholar] [CrossRef]
- Inagaki, M.; Yang, Y.; Kang, F. Carbon nanofibers prepared via electrospinning. Adv. Mater. 2012, 24, 2547–2566. [Google Scholar] [CrossRef]
- Ji, L.; Lin, Z.; Medford, A.J.; Zhang, X. In-Situ Encapsulation of Nickel Particles in Electrospun Carbon Nanofibers and the Resultant Electrochemical Performance. Chem. Eur. J. 2009, 15, 10718–10722. [Google Scholar] [CrossRef]
- Molnár, K.; Szolnoki, B.; Toldy, A.; Vas, L.M. Thermochemical stabilization and analysis of continuously electrospun nanofibers. J. Therm. Anal. Calorim. 2014, 117, 1123–1135. [Google Scholar] [CrossRef]
- Liu, C.; Lafdi, K. Fabrication and characterization of carbon nanofibers from polyacrylonitrile/pitch blends. J. Appl. Polym. Sci. 2017, 134, 45388. [Google Scholar] [CrossRef]
- Gergin, İ.; Ismar, E.; Sarac, A.S. Oxidative stabilization of polyacrylonitrile nanofibers and carbon nanofibers containing graphene oxide (GO): A spectroscopic and electrochemical study. Beilstein J. Nanotechnol. 2017, 8, 1616–1628. [Google Scholar] [CrossRef] [PubMed]
- Sabantina, L.; Klöcker, M.; Wortmann, M.; Mirasol, J.R.; Cordero, T.; Moritzer, E.; Finsterbusch, K.; Ehrmann, A. Stabilization of polyacrylonitrile nanofiber mats obtained by needleless electrospinning using dimethyl sulfoxide as solvent. J. Ind. Text. 2019, 1528083718825315. [Google Scholar] [CrossRef]
- Sabantina, L.; Mirasol, J.R.; Cordero, T.; Finsterbusch, K.; Ehrmann, A. Investigation of needleless electrospun PAN nanofiber mats. AIP Conf. Proc. 2018, 1952, 020085. [Google Scholar]
- Wu, M.; Wang, Q.; Li, K.; Wu, Y.; Liu, H. Optimization of stabilization conditions for electrospun polyacrylonitrile nanofibers. Polym. Degrad. Stab. 2012, 97, 1511–1519. [Google Scholar] [CrossRef]
- Bashir, Z. A critical review of the stabilisation of polyacrylonitrile. Carbon 1991, 29, 1081–1090. [Google Scholar] [CrossRef]
- Dalton, S.; Heatley, F.; Budd, P.M. Thermal stabilization of polyacrylonitrile fibres. Polymer 1999, 40, 5531–5543. [Google Scholar] [CrossRef]
- Wang, P.H.; Yue, Z.R.; Liu, J. Conversion of polyacrylonitrile fibers to activated carbon fibers: Effect of activation. J. Appl. Polym. Sci. 1996, 60, 923–929. [Google Scholar] [CrossRef]
- Ko, T.H. Raman spectrum of modified PAN-based carbon fibers during graphitization. J. Appl. Polym. Sci. 1996, 59, 577–580. [Google Scholar] [CrossRef]
- Rahaman, M.S.A.; Ismail, A.F.; Mustafa, A. A review of heat treatment on polyacrylonitrile fiber. Polym. Degrad. Stab. 2007, 92, 1421–1432. [Google Scholar] [CrossRef]
- Zussman, E.; Chen, X.; Ding, W.; Calabri, L.; Dikin, D.A.; Quintana, J.P.; Ruoff, R.S. Mechanical and structural characterization of electrospun PAN-derived carbon nanofibers. Carbon 2005, 43, 2175–2185. [Google Scholar] [CrossRef]
- Arshad, S.N.; Naraghi, M.; Chasiotis, I. Strong carbon nanofibers from electrospun polyacrylonitrile. Carbon 2011, 49, 1710–1719. [Google Scholar] [CrossRef]
- Zhou, Z.; Lai, C.; Zhang, L.; Qian, Y.; Hou, H.; Reneker, D.H.; Fong, H. Development of carbon nanofibers from aligned electrospun polyacrylonitrile nanofiber bundles and characterization of their microstructural, electrical, and mechanical properties. Polymer 2009, 50, 2999–3006. [Google Scholar] [CrossRef]
- Zhang, L.; Aboagye, A.; Kelkar, A.; Lai, C.; Fong, H. A review: Carbon nanofibers from electrospun polyacrylonitrile and their applications. J. Mater. Sci. 2014, 49, 463–480. [Google Scholar] [CrossRef]
- Ji, L.; Jung, K.H.; Medford, A.J.; Zhang, X. Electrospun polyacrylonitrile fibers with dispersed Si nanoparticles and their electrochemical behaviors after carbonization. J. Mater. Chem. 2009, 19, 4992–4997. [Google Scholar] [CrossRef]
- Zhu, J.; Wei, S.; Rutman, D.; Haldolaarachchige, N.; Young, D.P.; Guo, Z. Magnetic polyacrylonitrile-Fe@FeO nanocomposite fibers-Electrospinning, stabilization and carbonization. Polymer 2011, 52, 2947–2955. [Google Scholar] [CrossRef]
- Maitra, T.; Sharma, S.; Srivastava, A.; Cho, Y.K.; Madou, M.; Sharma, A. Improved graphitization and electrical conductivity of suspended carbon nanofibers derived from carbon nanotube/polyacrylonitrile composites by directed electrospinning. Carbon 2012, 50, 1753–1761. [Google Scholar] [CrossRef]
- Chen, I.H.; Wang, C.C.; Chen, C.Y. Fabrication and characterization of magnetic cobalt ferrite/polyacrylonitrile and cobalt ferrite/carbon nanofibers by electrospinning. Carbon 2010, 48, 604–611. [Google Scholar] [CrossRef]
- Jo, E.; Yeo, J.G.; Kim, D.K.; Oh, J.S.; Hong, C.K. Preparation of well-controlled porous carbon nanofiber materials by varying the compatibility of polymer blends. Polym. Int. 2014, 63, 1471–1477. [Google Scholar] [CrossRef]
- Abeykoon, N.C.; Bonso, J.S.; Ferraris, J.P. Supercapacitor performance of carbon nanofiber electrodes derived from immiscible PAN/PMMA polymer blends. RSC Adv. 2015, 5, 19865–19873. [Google Scholar] [CrossRef]
- Ji, L.; Medford, A.J.; Zhang, X. Fabrication of carbon fibers with nanoporous morphologies from electrospun polyacrylonitrile/poly (L-lactide) blends. J. Polym. Sci. B Polym. Phys. 2009, 47, 493–503. [Google Scholar] [CrossRef]
- Ji, L.; Yao, Y.; Toprakci, O.; Lin, Z.; Liang, Y.; Shi, Q.; Medford, A.J.; Millns, C.R.; Zhang, X. Fabrication of carbon nanofiber-driven electrodes from electrospun polyacrylonitrile/polypyrrole bicomponents for high-performance rechargeable lithium-ion batteries. J. Power Sources 2010, 195, 2050–2056. [Google Scholar] [CrossRef]
- Miao, F.; Shao, C.; Li, X.; Wang, K.; Liu, Y. Flexible solid-state supercapacitors based on freestanding nitrogen-doped porous carbon nanofibers derived from electrospun polyacrylonitrile@polyaniline nanofibers. J. Mater. Chem. A 2016, 4, 4180–4187. [Google Scholar] [CrossRef]
- García-Mateos, F.J.; Ruiz Rosas, R.; Rosas, J.M.; Rodríguez-Mirasol, J.; Cordero, T. Controlling the composition, morphology, porosity and surface chemistry of lignin-based electrospun carbon materials. Front. Mater. 2019, 6, 114. [Google Scholar] [CrossRef]
- Rajzer, I.; Kwiatkowski, R.; Piekarczyk, W.; Biniaś, W.; Janicki, J. Carbon nanofibers produced from modified electrospun PAN/hydroxyapatite precursors as scaffolds for bone tissue engineering. Mater. Sci. Eng. C 2012, 32, 2562–2569. [Google Scholar] [CrossRef]
- Sun, L.L.; Zhang, Z.G.; Zhong, W.H. Fluorination deposition on carbon nanofibers by PTFE decomposition as a facile method to enhance dispersion and interaction in PVDF composites. J. Mater. Chem. 2011, 21, 944–950. [Google Scholar] [CrossRef]
- Liu, J.; Wang, S.; Yang, J.; Liao, J.; Lu, M.; Pan, H.; An, L. ZnCl2 activated electrospun carbon nanofiber for capacitive desalination. Desalination 2014, 344, 446–453. [Google Scholar] [CrossRef]
- Lai, C.C.; Lo, C.T. Plasma oxidation of electrospun carbon nanofibers as supercapacitor electrodes. RSC Adv. 2015, 5, 38868–38872. [Google Scholar] [CrossRef]
- Im, J.S.; Kang, S.C.; Lee, S.H.; Lee, Y.S. Improved gas sensing of electrospun carbon fibers based on pore structure, conductivity and surface modification. Carbon 2010, 48, 2573–2581. [Google Scholar] [CrossRef]
- Jung, J.W.; Lee, C.L.; Yu, S.; Kim, I.D. Electrospun nanofibers as a platform for advanced secondary batteries: A comprehensive review. J. Mater. Chem. A 2016, 4, 703–750. [Google Scholar] [CrossRef]
- Ji, L.; Lin, Z.; Medford, A.J.; Zhang, X. Porous carbon nanofibers from electrospun polyacrylonitrile/SiO2 composites as an energy storage material. Carbon 2009, 47, 3346–3354. [Google Scholar] [CrossRef]
- Qie, L.; Chen, W.M.; Wang, Z.H.; Shao, Q.G.; Li, X.; Yuan, L.X.; Hu, X.-L.; Zhang, W.-X.; Huan, Y.-H. Nitrogen-doped porous carbon nanofiber webs as anodes for lithium ion batteries with a superhigh capacity and rate capability. Adv. Mater. 2012, 24, 2047–2050. [Google Scholar] [CrossRef] [PubMed]
- Kim, C.; Yang, K.S.; Kojima, M.; Yoshida, K.; Kim, Y.J.; Kim, Y.A.; Endo, M. Fabrication of electrospinning-derived carbon nanofiber webs for the anode material of lithium-ion secondary batteries. Adv. Funct. Mater. 2006, 16, 2393–2397. [Google Scholar] [CrossRef]
- Chen, Y.; Li, X.; Park, K.; Song, J.; Hong, J.; Zhou, L.; Mai, Y.-W.; Huang, H.; Goodenough, J.B. Hollow carbon-nanotube/carbon-nanofiber hybrid anodes for Li-ion batteries. J. Am. Chem. Soc. 2013, 135, 16280–16283. [Google Scholar] [CrossRef]
- Yoon, S.H.; Park, C.W.; Yang, H.; Korai, Y.; Mochida, I.; Baker, R.T.K.; Rodriguez, N.M. Novel carbon nanofibers of high graphitization as anodic materials for lithium ion secondary batteries. Carbon 2004, 42, 21–32. [Google Scholar] [CrossRef]
- Na, W.; Jun, J.; Park, J.W.; Lee, G.; Jang, J. Highly porous carbon nanofibers co-doped with fluorine and nitrogen for outstanding supercapacitor performance. J. Mater. Chem. A 2017, 5, 17379–17387. [Google Scholar] [CrossRef]
- Peera, S.G.; Sahu, A.K.; Arunchander, A.; Bhat, S.D.; Karthikeyan, J.; Murugan, P. Nitrogen and fluorine co-doped graphite nanofibers as high durable oxygen reduction catalyst in acidic media for polymer electrolyte fuel cells. Carbon 2015, 93, 130–142. [Google Scholar] [CrossRef]
- Xue, M.; Chen, D.; Wang, X.; Chen, J.; Chen, G.F. Carbonized poly(vinylidene fluoride)/graphene oxide with three-dimensional multiscale-pore architecture as an advanced electrode material. J. Mater. Chem. A 2015, 3, 7715–7718. [Google Scholar] [CrossRef]
- Yang, Y.; Centrone, A.; Chen, L.; Simeon, F.; Hatton, T.A.; Rutledge, G.C. Highly porous electrospun polyvinylidene fluoride (PVDF)-based carbon fiber. Carbon 2011, 49, 3395–3403. [Google Scholar] [CrossRef]
- Kim, J.R.; Choi, S.W.; Jo, S.M.; Lee, W.S.; Kim, B.C. Electrospun PVdF-based fibrous polymer electrolytes for lithium ion polymer batteries. Electrochim. Act. 2004, 50, 69–75. [Google Scholar] [CrossRef]
- Shi, L.; Miao, C.L.; Chen, G.R.; Xu, B.; Chen, S. Effect of Fluorine Content on the Electrochemical Properties of PVDF-Derived Carbons for Lithium Ion Battery. Adv. Mater. Res. 2012, 463, 730–733. [Google Scholar] [CrossRef]
- Cao, Y.; Huang, J.; Peng, X.; Cao, D.; Galaska, A.; Qiu, S.; Liu, J.; Khan, M.A.; Young, D.P.; Ryu, J.E.; et al. Poly(vinylidene fluoride) derived fluorine-doped magnetic carbon nanoadsorbents for enhanced chromium removal. Carbon 2017, 115, 503–514. [Google Scholar] [CrossRef]
- Shiraz, M.H.A.; Zhu, H.; Liu, Y.; Sun, X.; Liu, J. Activation-free synthesis of microporous carbon from polyvinylidene fluoride as host materials for lithium-selenium batteries. J. Power Sources 2019, 438, 227059. [Google Scholar] [CrossRef]
- Gopalan, A.I.; Santhosh, P.; Manesh, K.M.; Nho, J.H.; Kim, S.H.; Hwang, C.G.; Lee, K.P. Development of electrospun PVdF–PAN membrane-based polymer electrolytes for lithium batteries. J. Membr. Sci. 2008, 325, 683–690. [Google Scholar] [CrossRef]
- Sabantina, L.; Wehlage, D.; Klöcker, M.; Mamun, A.; Grothe, T.; García-Mateos, F.J.; Rodríguez-Mirasol, J.; Cordero, T.; Finsterbusch, K.; Ehrmann, A. Stabilization of electrospun PAN/gelatin nanofiber mats for carbonization. J. Nanomater. 2018, 2018, 6131085. [Google Scholar] [CrossRef]
- Wagner, C.D.; Davis, L.E.; Zeller, M.V.; Taylor, J.A.; Raymond, R.H.; Gale, L.H. Empirical atomic sensitivity factors for quantitative analysis by electron spectroscopy for chemical analysis. Surf. Interface Anal. 1981, 3, 211–225. [Google Scholar] [CrossRef]
- Liu, T.-Y.; Lin, W.-C.; Huang, L.-Y.; Chen, S.-Y.; Yang, M.-C. Surface characteristics and hemocompatibility of PAN/PVDF blend membranes. Polym. Adv. Technol. 2005, 16, 413–419. [Google Scholar] [CrossRef]
- Sabantina, L.; Böttjer, R.; Wehlage, D.; Grothe, T.; Klöcker, M.; García-Mateos, F.J.; Rodríguez-Mirasol, J.; Cordero, T.; Ehrmann, A. Morphological study of stabilization and carbonization of polyacrylonitrile/TiO2 nanofiber mats. J. Eng. Fibers Fabr. 2019, 14, 1558925019862242. [Google Scholar] [CrossRef]
- Wortmann, M.; Frese, N.; Sabantina, L.; Petkau, R.; Kinzel, F.; Gölzhäuser, A.; Moritzer, E.; Hüsgen, B.; Ehrmann, A. New polymers for needleless electrospinning from low-toxic solvents. Nanomaterials 2019, 9, 52. [Google Scholar] [CrossRef]
- Sabantina, L.; Rodríguez-Cano, M.Á.; Klöcker, M.; García-Mateos, F.J.; Ternero-Hidalgo, J.J.; Mamun, A.; Beermann, F.; Schwakenberg, M.; Voigt, A.-L.; Rodríguez-Mirasol, J.; et al. Fixing PAN nanofiber mats during stabilization for carbonization and creating novel metal/carbon composites. Polymers 2018, 10, 735. [Google Scholar] [CrossRef] [PubMed]
- Ma, S.; Liu, J.; Liu, Q.; Liang, J.; Zhao, Y.; Fong, H. Investigation of structural conversion and size effect from stretched bundle of electrospun polyacrylonitrile copolymer nanofibers during oxidative stabilization. Mater. Des. 2016, 95, 387–397. [Google Scholar] [CrossRef]
- Wu, S.; Zhang, F.; Yu, Y.; Li, P.; Yang, X.; Lu, J.; Ryu, S. Preparation of PAN-based carbon nanofibers by hot-stretching. Compos. Interfaces 2008, 15, 671–677. [Google Scholar] [CrossRef]
- Baker, M. Reproducibility crisis? Nature 2016, 533, 353–366. [Google Scholar]
- Grothe, T.; Wehlage, D.; Böhm, T.; Remche, A.; Ehrmann, A. Needleless electrospinning of PAN nanofibre mats. Tekstilec 2017, 60, 290–295. [Google Scholar] [CrossRef]
- Zulfiqar, S.; Zulfiqar, M.; Rizvi, M.; Munir, A.; McNeill, I.C. Study of the thermal degradation of polychlorotrifluoroethylene, poly (vinylidene fluoride) and copolymers of chlorotrifluoroethylene and vinylidene fluoride. Polym. Degrad. Stab. 1994, 43, 423–430. [Google Scholar] [CrossRef]
- Ibeh, C.C. Thermoplastic Materials: Properties, Manufacturing Methods, and Applications; CRC Press: Boca Raton, FL, USA, 2011; pp. 105–107. ISBN 9781420093834. [Google Scholar]
- Sutasinpromprae, J.; Jitjaicham, S.; Nithitanakul, M.; Meechaisue, C.; Supaphol, P. Preparation and characterization of ultrafine electrospun polyacrylonitrile fibers and their subsequent pyrolysis to carbon fibers. Polym. Int. 2006, 55, 825–833. [Google Scholar] [CrossRef]
- Balard, H.; Fritz, H.; Meybeck, J. Determination of the tacticity of polyacrylonitrile and its oligomers by 13C NMR spectroscopy. Makromol. Chem. Macromol. Chem. Phys. 1977, 178, 2393–2399. [Google Scholar] [CrossRef]
- Wang, Y.; Xu, L.; Wang, M.; Pang, W.; Ge, X. Structural identification of polyacrylonitrile during thermal treatment by selective 13C labeling and solid-state 13C NMR spectroscopy. Macromolecules 2014, 47, 3901–3908. [Google Scholar] [CrossRef]
- Katoh, E.; Ogura, K.; Ando, I. An NMR Study of Poly (vinylidene fluoride) Structure by 1 H, 13 C, and 19 F Triple Resonance Method. Polym. J. 1994, 26, 1352–1359. [Google Scholar] [CrossRef]
- Maricq, M.M.; Waugh, J.S. NMR in rotating solids. J. Chem. Phys. 1979, 70, 3300–3316. [Google Scholar] [CrossRef]
- Li, J.; Su, S.; Zhou, L.; Kundrát, V.; Abbot, A.M.; Mushtaq, F.; Ouyang, D.; James, D.; Roberts, D.; Ye, H. Carbon nanowalls grown by microwave plasma enhanced chemical vapor deposition during the carbonization of polyacrylonitrile fibers. J. Appl. Phys. 2013, 113, 024313. [Google Scholar] [CrossRef]
- Yalcinkaya, F.; Siekierka, A.; Bryjak, M. Surface modification of electrospun nanofibrous membranes for oily wastewater separation. RSC Adv. 2017, 7, 56704–56712. [Google Scholar] [CrossRef]
- Bai, H.; Wang, X.; Zhou, Y.; Zhang, L. Preparation and characterization of poly (vinylidene fluoride) composite membranes blended with nano-crystalline cellulose. Progr. Nat. Sci. Mater. Int. 2012, 22, 250–257. [Google Scholar] [CrossRef]
- Kreienborg, N.M.; Merten, C. How to treat C–F stretching vibrations? A vibrational CD study on chiral fluorinated molecules. Phys. Chem. Chem. Phys. 2019, 21, 3506–3511. [Google Scholar] [CrossRef]
- Kim, M.; Hwang, S.; Yu, J.S. Novel ordered nanoporous graphitic C3N4 as a support for Pt–Ru anode catalyst in direct methanol fuel cell. J. Mater. Chem. 2007, 17, 1656–1659. [Google Scholar] [CrossRef]
- Zhang, B.; Zhang, G.; Wang, Q.; Li, C.; He, J.; An, Z. Suppression of surface charge accumulation on Al2O3-filled epoxy resin insulator under dc voltage by direct fluorination. AIP Adv. 2015, 5, 127207. [Google Scholar] [CrossRef]
- Laffont, L.; Monthioux, M.; Serin, V.; Mathur, R.B.; Guimon, C.; Guimon, M.F. An EELS study of the structural and chemical transformation of PAN polymer to solid carbon. Carbon 2004, 42, 2485–2494. [Google Scholar] [CrossRef]
- Barr, T.L.; Seal, S. Nature of the use of adventitious carbon as a binding energy standard. J. Vac. Sci. Technol. A Vac. Surf. Film. 1995, 13, 1239–1246. [Google Scholar] [CrossRef]
- Greczynski, G.; Hultman, L. C 1s peak of adventitious carbon aligns to the vacuum level: Dire consequences for materials bonding assignment by photoelectron spectroscopy. ChemPhysChem 2017, 18, 1507–1512. [Google Scholar] [CrossRef]
- Setnescu, R.; Jipa, S.; Setnescu, T.; Kappel, W.; Kobayashi, S.; Osawa, Z. IR and X-ray characterization of the ferromagnetic phase of pyrolysed polyacrylonitrile. Carbon 1999, 37, 1–6. [Google Scholar] [CrossRef]
- Berlin, J. Analysis of boron with energy dispersive x-ray spectrometry. Imaging Microsc. 2011, 13, 19–21. [Google Scholar]
- Bonanos, N.; Pissis, P.; Macdonald, J.R. Impedance Spectroscopy of Dielectrics and Electronic Conductors. In Characterization of Materials, 2nd ed.; Kaufmann, E.N., Ed.; John Wiley & Sons: Hoboken, NJ, USA, 2012; p. 1. [Google Scholar]
- Im, J.S.; Kim, S.J.; Kang, P.H.; Lee, Y.S. The improved electrical conductivity of carbon nanofibers by fluorinated MWCNTs. J. Ind. Eng. Chem. 2009, 15, 699–702. [Google Scholar] [CrossRef]
- Geng, Y.; Song, Y.; Zhong, M.; Shi, J.; Guo, Q.; Liu, L. Influence of the pitch fluoride on the electrical conductivity of the activated carbon cloth as electrodes of the supercapacitor. Mater. Lett. 2010, 64, 2673–2675. [Google Scholar] [CrossRef]
- Wang, Y.; Serrano, S.; Santiago-Aviles, J.J. Conductivity measurement of electrospun PAN-based carbon nanofiber. J. Mater. Sci. Lett. 2002, 21, 1055–1057. [Google Scholar] [CrossRef]
- Ra, E.J.; An, K.H.; Kim, K.K.; Jeong, S.Y.; Lee, Y.H. Anisotropic electrical conductivity of MWCNT/PAN nanofiber paper. Chem. Phys. Lett. 2005, 413, 188–193. [Google Scholar] [CrossRef]
- Gu, H.; Li, Y.; Li, N. Electrical Conductive and Structural Characterization of Electrospun Aligned Carbon Nanofibers Membrane. Fibers Polym. 2015, 16, 2601–2608. [Google Scholar] [CrossRef]


| Sample | Thickness d (µm) | Resistance R (MΩ) | Conductivity σ (S/m) | ||
|---|---|---|---|---|---|
| As-Spun | Stabilized | Carbonized | |||
| PAN | 15.4 ± 4.4 | 21.7 ± 5.2 | 22.3 ± 4.4 | 148 | 5.9 × 10⁻¹⁰ |
| PAN 4:1 PVDF | 3.8 ± 1.0 | 5.3 ± 1.5 | 5.4 ± 1.1 | 3.20 | 5.4 × 10⁻⁹ |
| PAN 3:1 PVDF | 11.5 ± 2.0 | 13.0 ± 3.0 | 13.1 ± 2.5 | 0.42 | 9.9 × 10⁻⁸ |
© 2020 by the authors. Licensee MDPI, Basel, Switzerland. This article is an open access article distributed under the terms and conditions of the Creative Commons Attribution (CC BY) license (http://creativecommons.org/licenses/by/4.0/).
Share and Cite
Wortmann, M.; Frese, N.; Mamun, A.; Trabelsi, M.; Keil, W.; Büker, B.; Javed, A.; Tiemann, M.; Moritzer, E.; Ehrmann, A.; et al. Chemical and Morphological Transition of Poly(acrylonitrile)/Poly(vinylidene Fluoride) Blend Nanofibers during Oxidative Stabilization and Incipient Carbonization. Nanomaterials 2020, 10, 1210. https://doi.org/10.3390/nano10061210
Wortmann M, Frese N, Mamun A, Trabelsi M, Keil W, Büker B, Javed A, Tiemann M, Moritzer E, Ehrmann A, et al. Chemical and Morphological Transition of Poly(acrylonitrile)/Poly(vinylidene Fluoride) Blend Nanofibers during Oxidative Stabilization and Incipient Carbonization. Nanomaterials. 2020; 10(6):1210. https://doi.org/10.3390/nano10061210
Chicago/Turabian StyleWortmann, Martin, Natalie Frese, Al Mamun, Marah Trabelsi, Waldemar Keil, Björn Büker, Ali Javed, Michael Tiemann, Elmar Moritzer, Andrea Ehrmann, and et al. 2020. "Chemical and Morphological Transition of Poly(acrylonitrile)/Poly(vinylidene Fluoride) Blend Nanofibers during Oxidative Stabilization and Incipient Carbonization" Nanomaterials 10, no. 6: 1210. https://doi.org/10.3390/nano10061210
APA StyleWortmann, M., Frese, N., Mamun, A., Trabelsi, M., Keil, W., Büker, B., Javed, A., Tiemann, M., Moritzer, E., Ehrmann, A., Hütten, A., Schmidt, C., Gölzhäuser, A., Hüsgen, B., & Sabantina, L. (2020). Chemical and Morphological Transition of Poly(acrylonitrile)/Poly(vinylidene Fluoride) Blend Nanofibers during Oxidative Stabilization and Incipient Carbonization. Nanomaterials, 10(6), 1210. https://doi.org/10.3390/nano10061210