Article

Studies on Sensing Properties and Mechanism of CuO Nanoparticles to H2S Gas

1
State Key Laboratory of Infrared Physics, Shanghai Institute of Technical Physics, Chinese Academy of Sciences, Shanghai 200083, China
2
School of Electronic Electrical and Communication Engineering, University of Chinese Academy of Sciences, Beijing 100049, China
3
School of Materials Science and Engineering, University of Shanghai for Science and Technology, Shanghai 200093, China
4
National Engineering Research Center for Nanotechnology, No. 28 East Jiang Chuan Road, Shanghai 200241, China
5
School of Materials Science and Engineering, Shanghai Institute of Technology, Shanghai 200235, China
6
Hangzhou Institute for Advanced Study, University of Chinese Academy of Sciences, Hangzhou 310024, China
*
Authors to whom correspondence should be addressed.
Nanomaterials 2020, 10(4), 774; https://doi.org/10.3390/nano10040774
Submission received: 24 March 2020 / Revised: 10 April 2020 / Accepted: 14 April 2020 / Published: 17 April 2020

Abstract

:
In this work, the high crystalline copper oxide (CuO) nanoparticles were fabricated by a hydrothermal method, and their structural properties were characterized by transmission electron microscopy (TEM), X-ray diffraction (XRD), and X-ray photoelectron spectroscopy (XPS). The sensing results show that CuO nanoparticles exhibit enhanced sensitivity and good selectivity for hydrogen sulfide (H2S) gas at a low temperature. There are two working mechanisms involved in the H2S sensing based on CuO nanoparticle sensors. They are the H2S oxidation mechanism and the copper sulphide (CuS) formation mechanism, respectively. The two sensing mechanisms collectively enhance the sensor’s response in the H2S sensing process. The Cu–S bonding is stable and cannot break spontaneously at a low temperature. Therefore, the CuS formation inhibits the sensor’s recovery process. Such inhibition gradually enhances as the gas concentration increases from 0.2 ppm to 5 ppm, and it becomes weaker as the operating temperature rises from 40 °C to 250 °C. The XPS results confirmed the CuS formation phenomenon, and the micro Raman spectra demonstrated that the formation of CuS bonding and its decomposition can be effectively triggered by a thermal effect. Gas-sensing mechanism analysis supplied abundant cognition for the H2S sensing phenomena based on CuO materials.

1. Introduction

Hydrogen sulfide (H2S) gas is a highly poisonous and flammable gas with a rotten egg smell, which is widely prevalent in oil, coal mines, sewage plants, and natural gas industries. It can corrupt and irritate the eyes, skin, and respiratory system at a very low concentration of 10 ppm, and even causes paralysis and death when its concentration exceeds 120 ppm [1,2]. In the past several decades, stannic oxide (SnO2) [3], molybdenum oxide (MoO3) [4], zinc oxide (ZnO) [5], α-ferric oxide (α-Fe2O3) [6], tungsten oxide (WO3) [7], etc. typical n-type oxide semiconductors have been investigated for H2S gas detection. Recently, increasing interest has been taken in gas sensors based on p-type semiconductors, such as CuO, for its chemical stability, electrochemical activity, and high electron communication features [8]. CuO colloidal particles have been prepared by Duan and exhibit outstanding room-temperature sensing properties as low as 100 ppb H2S gas, through a complicated preparation process [9]. Kim et al. worked on Pd-functionalized CuO for H2S gas sensing and the sensor showed an enhanced response with a rapid recovery despite not working at a low temperature [10]. In this paper, small-sized CuO nanoparticles were prepared using a simple and inexpensive one-step hydrothermal method, which is suitable for the industrial production. In addition, the CuO nanoparticles sensors possess the response of 4.9 ± 0.43 ppm to 5 ppm H2S at 40 °C, a fast recovery time of 54 ± 7.1 s via heating pulse modulation, and an excellent sensing selectivity, which makes the sensor a promising candidate for practical applications.
Furthermore, CuO modified n-type oxide semiconductors, such as CuO/SnO2 and CuO/WO3, also show remarkable H2S sensing properties, especially in low temperature monitoring [11,12]. Understanding the working mechanism of CuO materials sense to H2S gas is conducive to clear functionalized CuO composites in H2S detection. Until now, the two sensing mechanisms of CuO material to H2S gas are recognized. The one H2S oxidation mechanism refers to the desorption process of oxygen ions Oδ− (e.g. O2, O, and O2−) that were pre-adsorbed on the surface of CuO material [13,14,15]. The related chemical equation is shown as Equation (1).
H 2 S ( gas ) + 3 O δ ( ads ) H 2 O ( gas ) + S O 2 ( gas ) + 3 δ e
The other CuS formation mechanism involves a chemical reaction accompanied by a change in the electrical potential [16,17,18]. The spontaneous chemical reaction is demonstrated as Equation (2).
CuO ( s ) + H 2 S ( g ) CuS ( s ) + H 2 O ( g )
The amazing performances are most attributed to the chemical transformation of highly resistive p-CuO into well conducting Cu2S or CuS, which leads to a drastic decrease in resistance [10,19].
However, it is well known that the two working mechanisms are involved in CuO material to H2S gas. However, there are still many problems in mechanism cognition to be solved. For example, many studies reported that the formation of CuS decreases the electrical resistance because CuS has the metallic character [12,18,20]. However, H2S molecules react with the pre-adsorbed oxygen species, which results in an increase in electrical resistance of p-type CuO [10]. Thereupon, it is still unclear whether the two sensing mechanisms are synergistic or antagonistic to the sensor response. On the other hand, CuS cannot be oxidized to CuO completely at a low temperature since the Cu–S bonding is too strong to break and, hence, prolongs the sensor’s recovery process [21,22]. Therefore, the urgent task is to regulate the recovery process hindered by CuS formation, and to understand whether such inhibition on the recovery process is affected by the operating temperatures and gas concentrations. Herein, this work makes up for above deficiencies in the mechanism analysis. In addition, the H2S sensing performances of CuO nanoparticles are also described.

2. Experimental Scheme

All the chemicals were of an analytical grade with no further purification, and all liquid reagents were purchased from Shanghai Chemical Industrial Co. Ltd. (Shanghai, China) and test gases were purchased from Shanghai Shenkai Gas Technology Co. Ltd (Shanghai, China). The gases included H2S/N2 (10%), CO/N2 (15%), Alcohol (CAS: 64-17-5, >99.7%), Acetone (CAS: 116-09-6, >99.8%), Methyl alcohol (CAS: 67-56-1, >99.5%), Ammonia water (CAS: 1336-21-6, ≥28%), Methane (CAS: 137829-79-9, 98%), and Isopropanol (CAS: 67-63-0, 99.9%).

2.1. Synthesis of CuO Nanoparticles

CuO nanoparticles were synthesized by a typical hydrothermal method. In total, 0.5 g of copper acetate monohydrate (Cu (CH3COO)2·H2O, A.R. Aladdin, Shanghai, China) was dissolved in 180 ml alcohol (C2H5OH, A.R. Aladdin, Shanghai, China) under stirring. Then, the solution was transferred to 100 mL Teflon-lined stainless autoclaves for hydrothermal reaction at 140 °C for 4 hours. Lastly, the CuO nanoparticles were separated by centrifugation and washed with deionized water and ethanol several times to remove the remnant in the mixture. Then, they were dried at 80 °C for 2 hours in the drying oven.

2.2. Characterization of Structures and Morphologies

The morphology of CuO nanoparticles were characterized by transmission electron microscopy (TEM) with selected-area electron diffraction (SAED) (JEOL2100F, JEOL, Tokyo, Japan). The crystal structure of the samples was investigated by Powder X-ray diffraction (XRD, D/max-2600PC, Rigaku Corporation, Tokyo, Japan) with Cu Kα radiation (λ = 1.5406 Å). To analyze the chemical bonds of samples, the X-ray photoelectron spectrometer (XPS, ESCALAB 250Xi, Thermo Fisher Scientific, Waltham, MA, USA) was carried out using Al KR X-ray as the excitation source, and Raman spectra (LabRam HR800 Ev, HORIBA Jobin Yvon, Paris, France) was employed at the excitation wavelength of 532 nm.

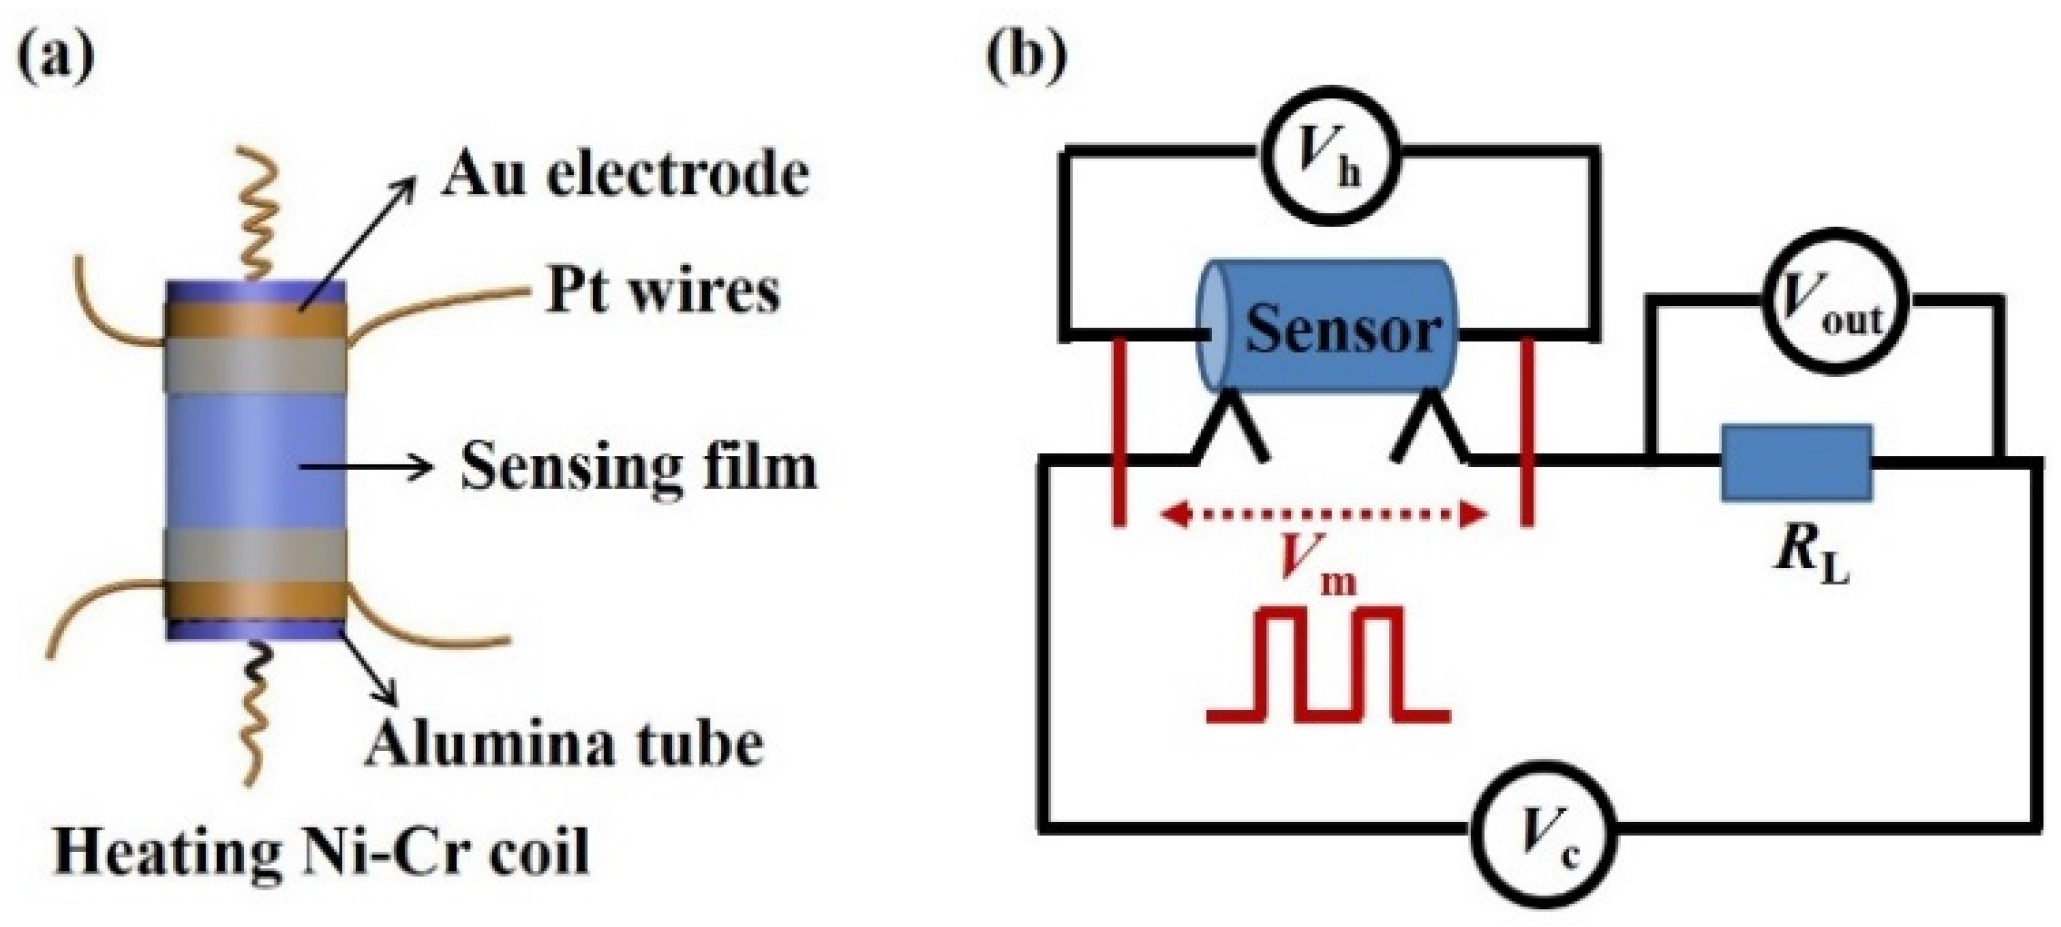
2.3. Preparation and Measurement of the Gas Sensor

The gas sensors are of a side-heating type with alumina tube structure, and the schematic diagram of the sensor element is shown in Figure 1a. A proper amount of CuO powder was uniformly coated on a ceramic tube as a sensing film layer. A Ni-Cr coil was set through the tube as a heater and the operating temperature was adjusted by the heating voltage. The gas sensing test was performed on the HW-30A system (Hanwei Electronics Co. Ltd., Zhengzhou, China).
The electronic circuit of the gas sensor is illustrated in Figure 1b. In this scenario, VC is the test voltage with a certain value of 5 V, VH is the heating voltage modulated on the Ni-Cr coil, Vm is the heating pulse voltage, Vout is the output voltage on RL, and RL is a load resistor in series with the gas sensor. With the recorded Vout values of the load resistor, the equivalent resistances of the sensor can be calculated. The response of the sensor was determined by the value of Rg/Ra. The resistance of the sensor in testing gases (Rg) was divided by that in air (Ra). The response time and recovery time, respectively, refer to the times for the sensor output to reach 90% of its saturation after injection and release of the target gas, which are indicated as T90. All the measurements were carried out under the same condition of about 40% relative humidity.

3. Results and Discussions

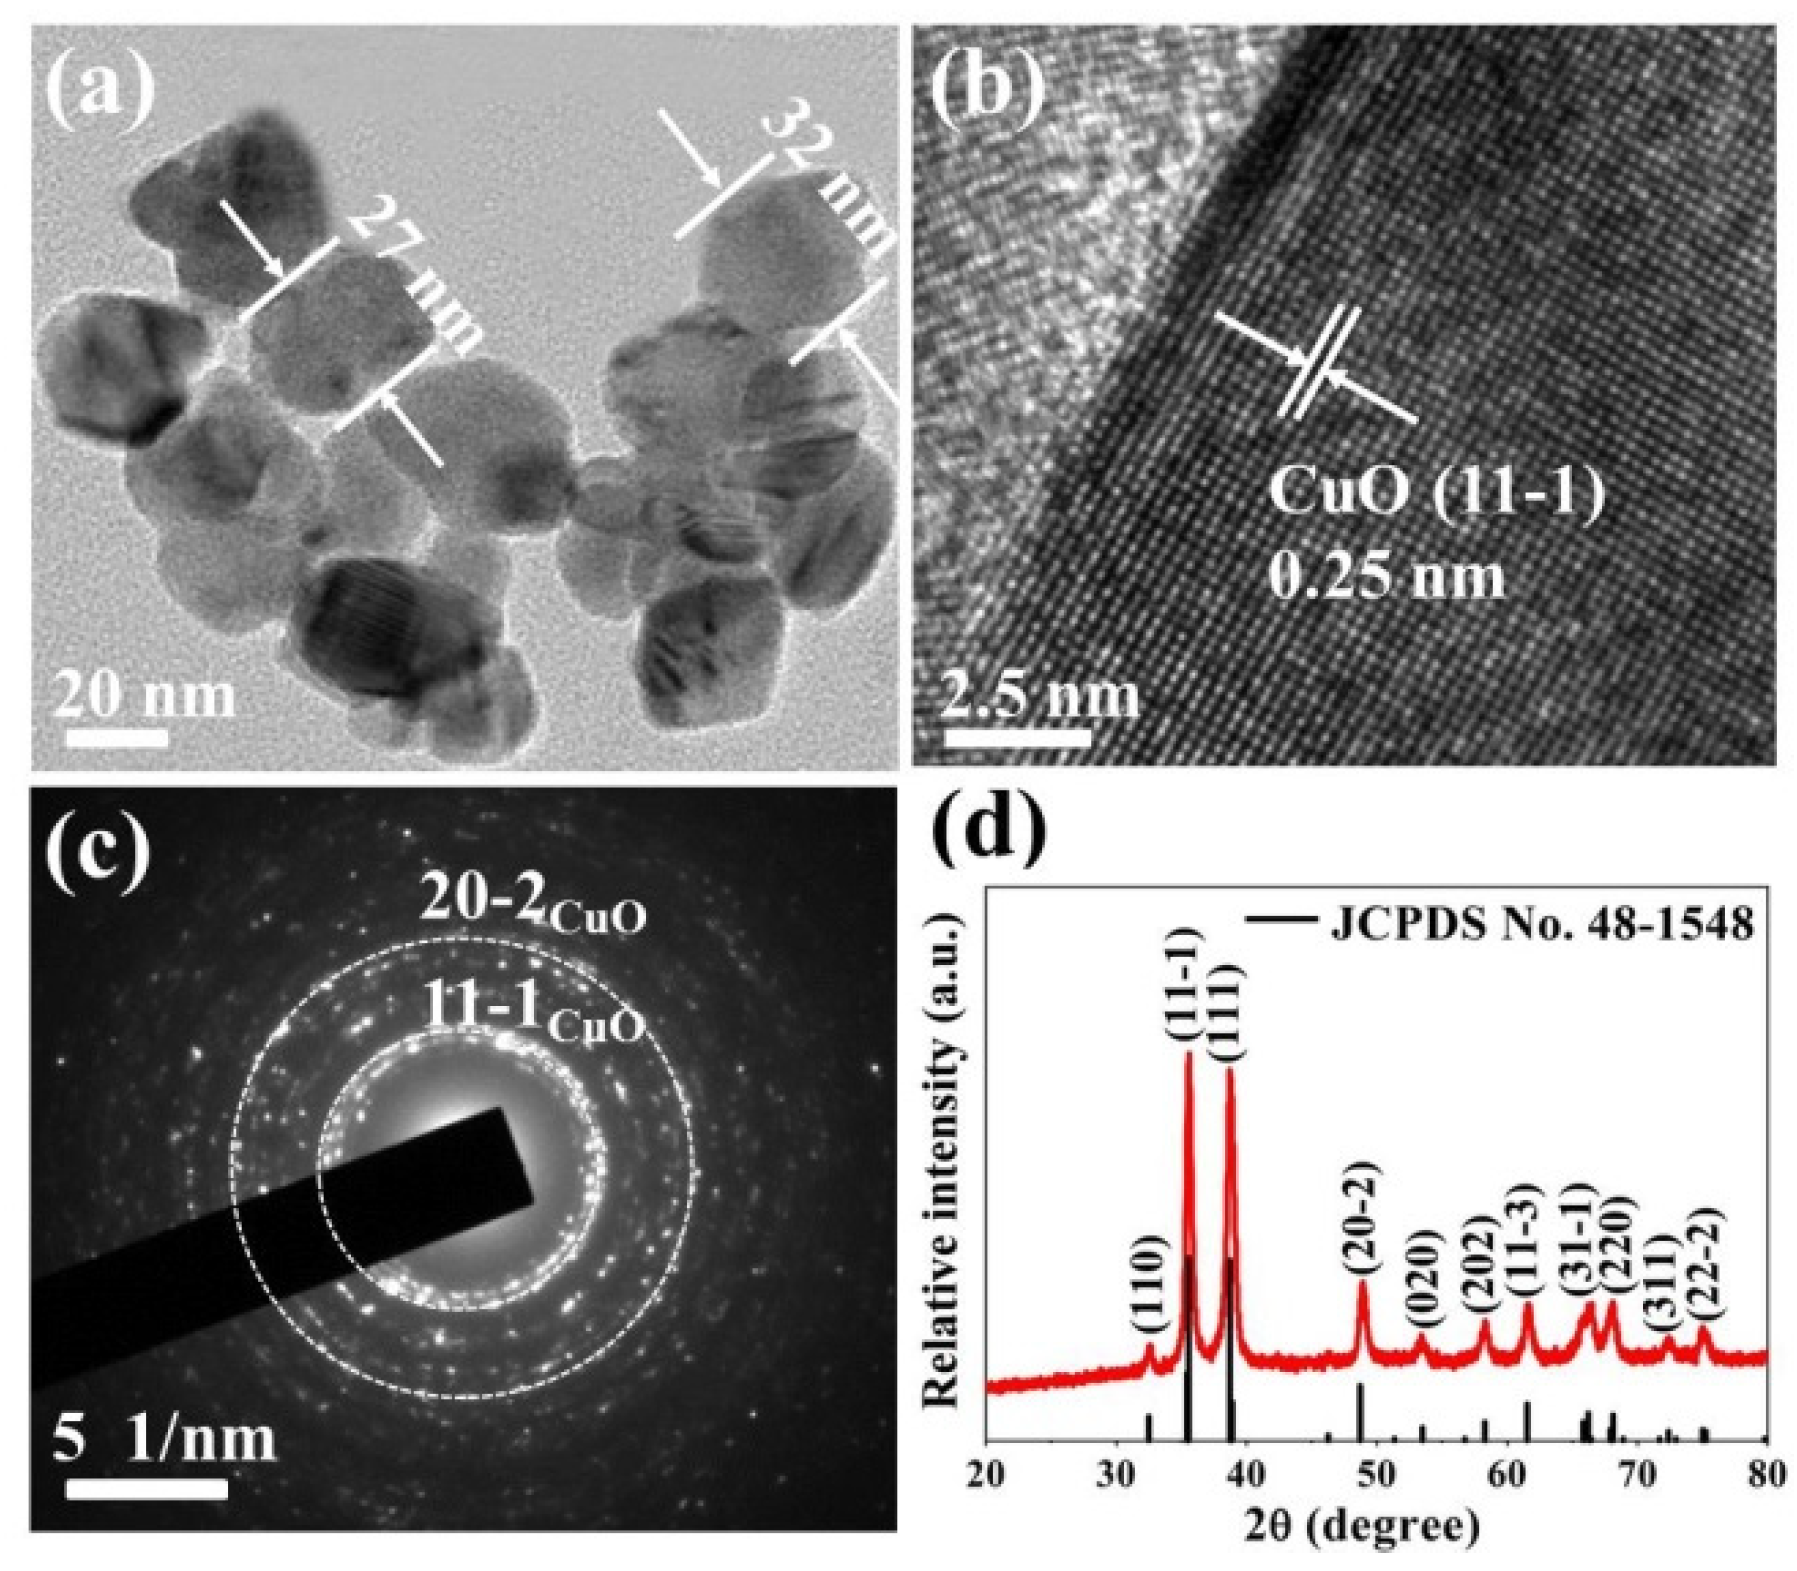
3.1. Morphological and Structural Characteristics

The phase and structural features of CuO nanoparticles were analyzed by TEM and SAED. As shown in Figure 2a, the CuO nanoparticles are extremely small and their diameters are approximately in a range of 20–46 nm with stone-like morphology. Such a small particle size is compared to twice the Debye length of CuO reported to be ~12.7 nm [23]. According to the crystal size effect, this size will make the whole grain depleted and the resistance is controlled by the CuO nanostructure itself, which results in a high response [24]. Figure 2b illustrates the high-resolution TEM (HRTEM) image of CuO nanoparticles. The lattice fringes with inter-planar spacing of 0.25 nm match well with the (11-1) plane of simple monoclinic CuO. The SAED patterns in Figure 2c clearly show the ring pattern (circles marked in a white color) mainly arising from the (11-1) and (20-2) crystal indexes of CuO structures, which implies the crystalline nature of CuO nanoparticles. Figure 2d is the corresponding XRD pattern of CuO nanoparticles. The well-defined diffraction peaks match the monoclinic structure CuO diffraction data (JCPDS card no.48-1548). The main peaks at 35.6° and 38.7° are correspond to (11-1) and (111) crystal planes of CuO, which is coincident with the HRTEM results. The average particle size of CuO nanoparticles was calculated by using the Debye-Scherrer formula [25].
D = k λ β cos 2 θ
where k is an empirical constant equal to 0.94, λ is the wavelength of X-ray radiation (1.5406 Å), β is the full width at half maximum of the diffraction peak, and θ is the angular position of the peak. The particle size is calculated to be 28 ± 2 nm. Such a value matches well with the HRTEM results. The (11-1) main crystal plane in the XRD patterns is also present in the HRTEM images.

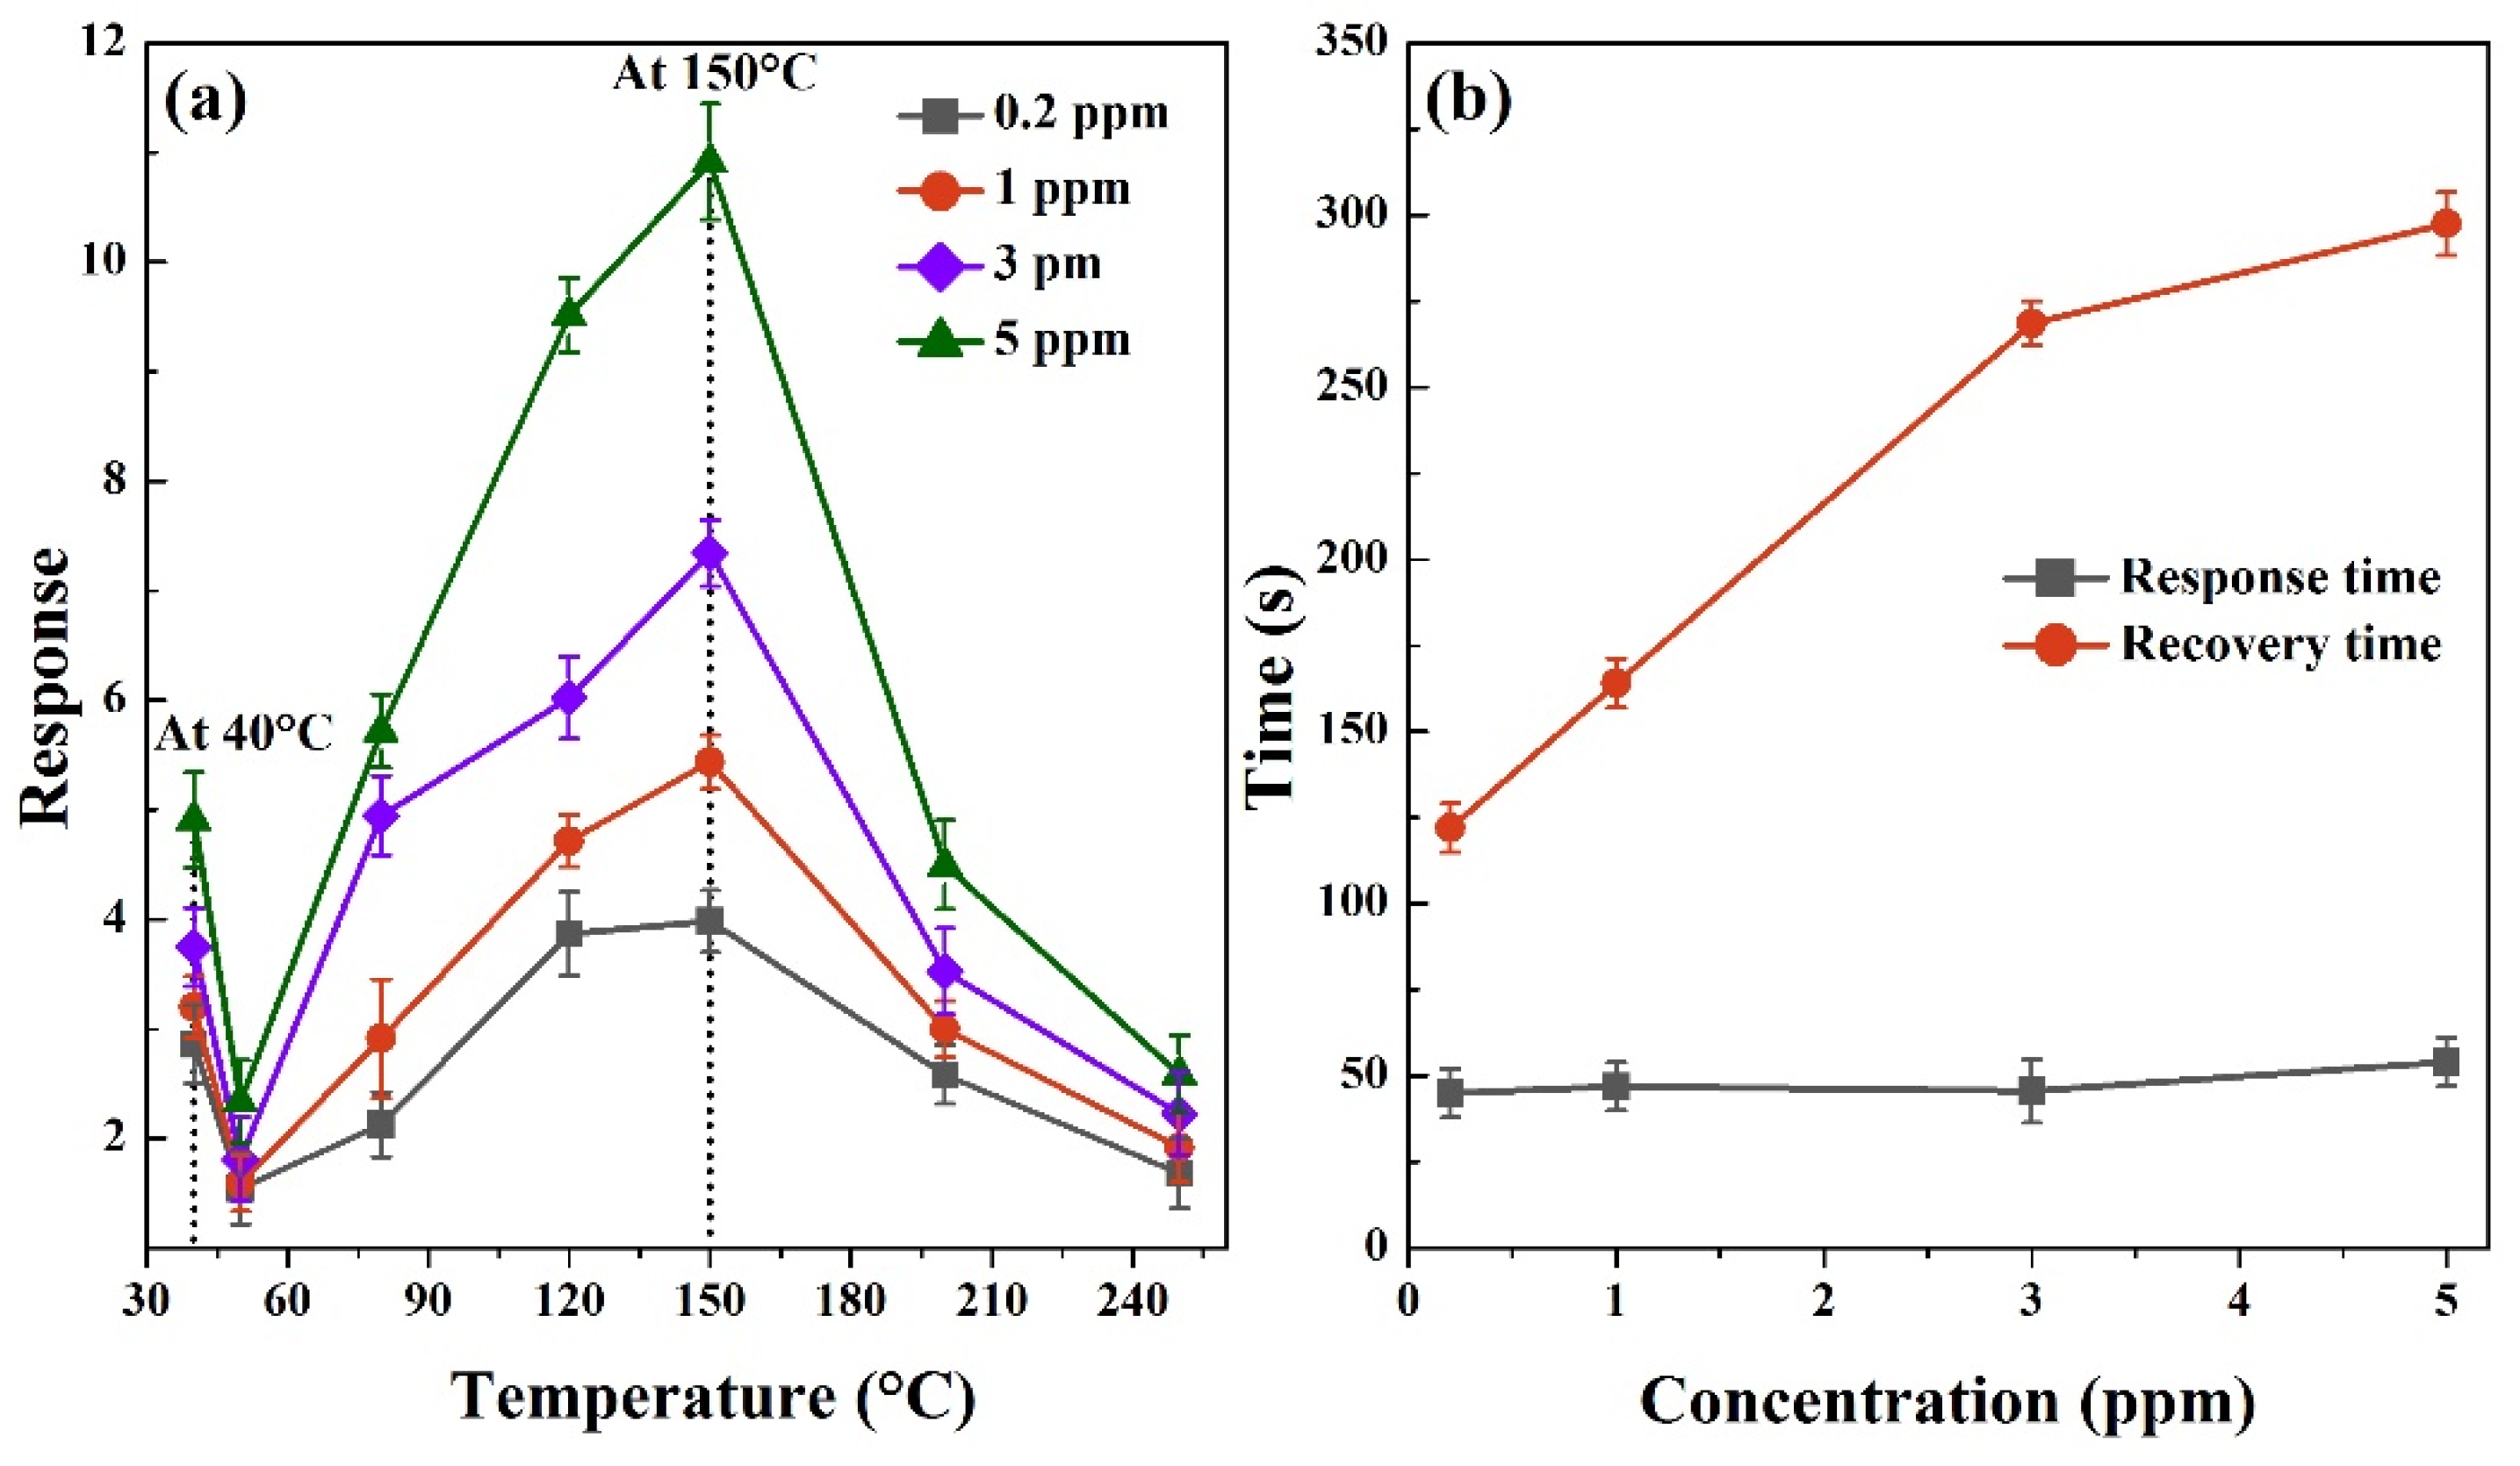
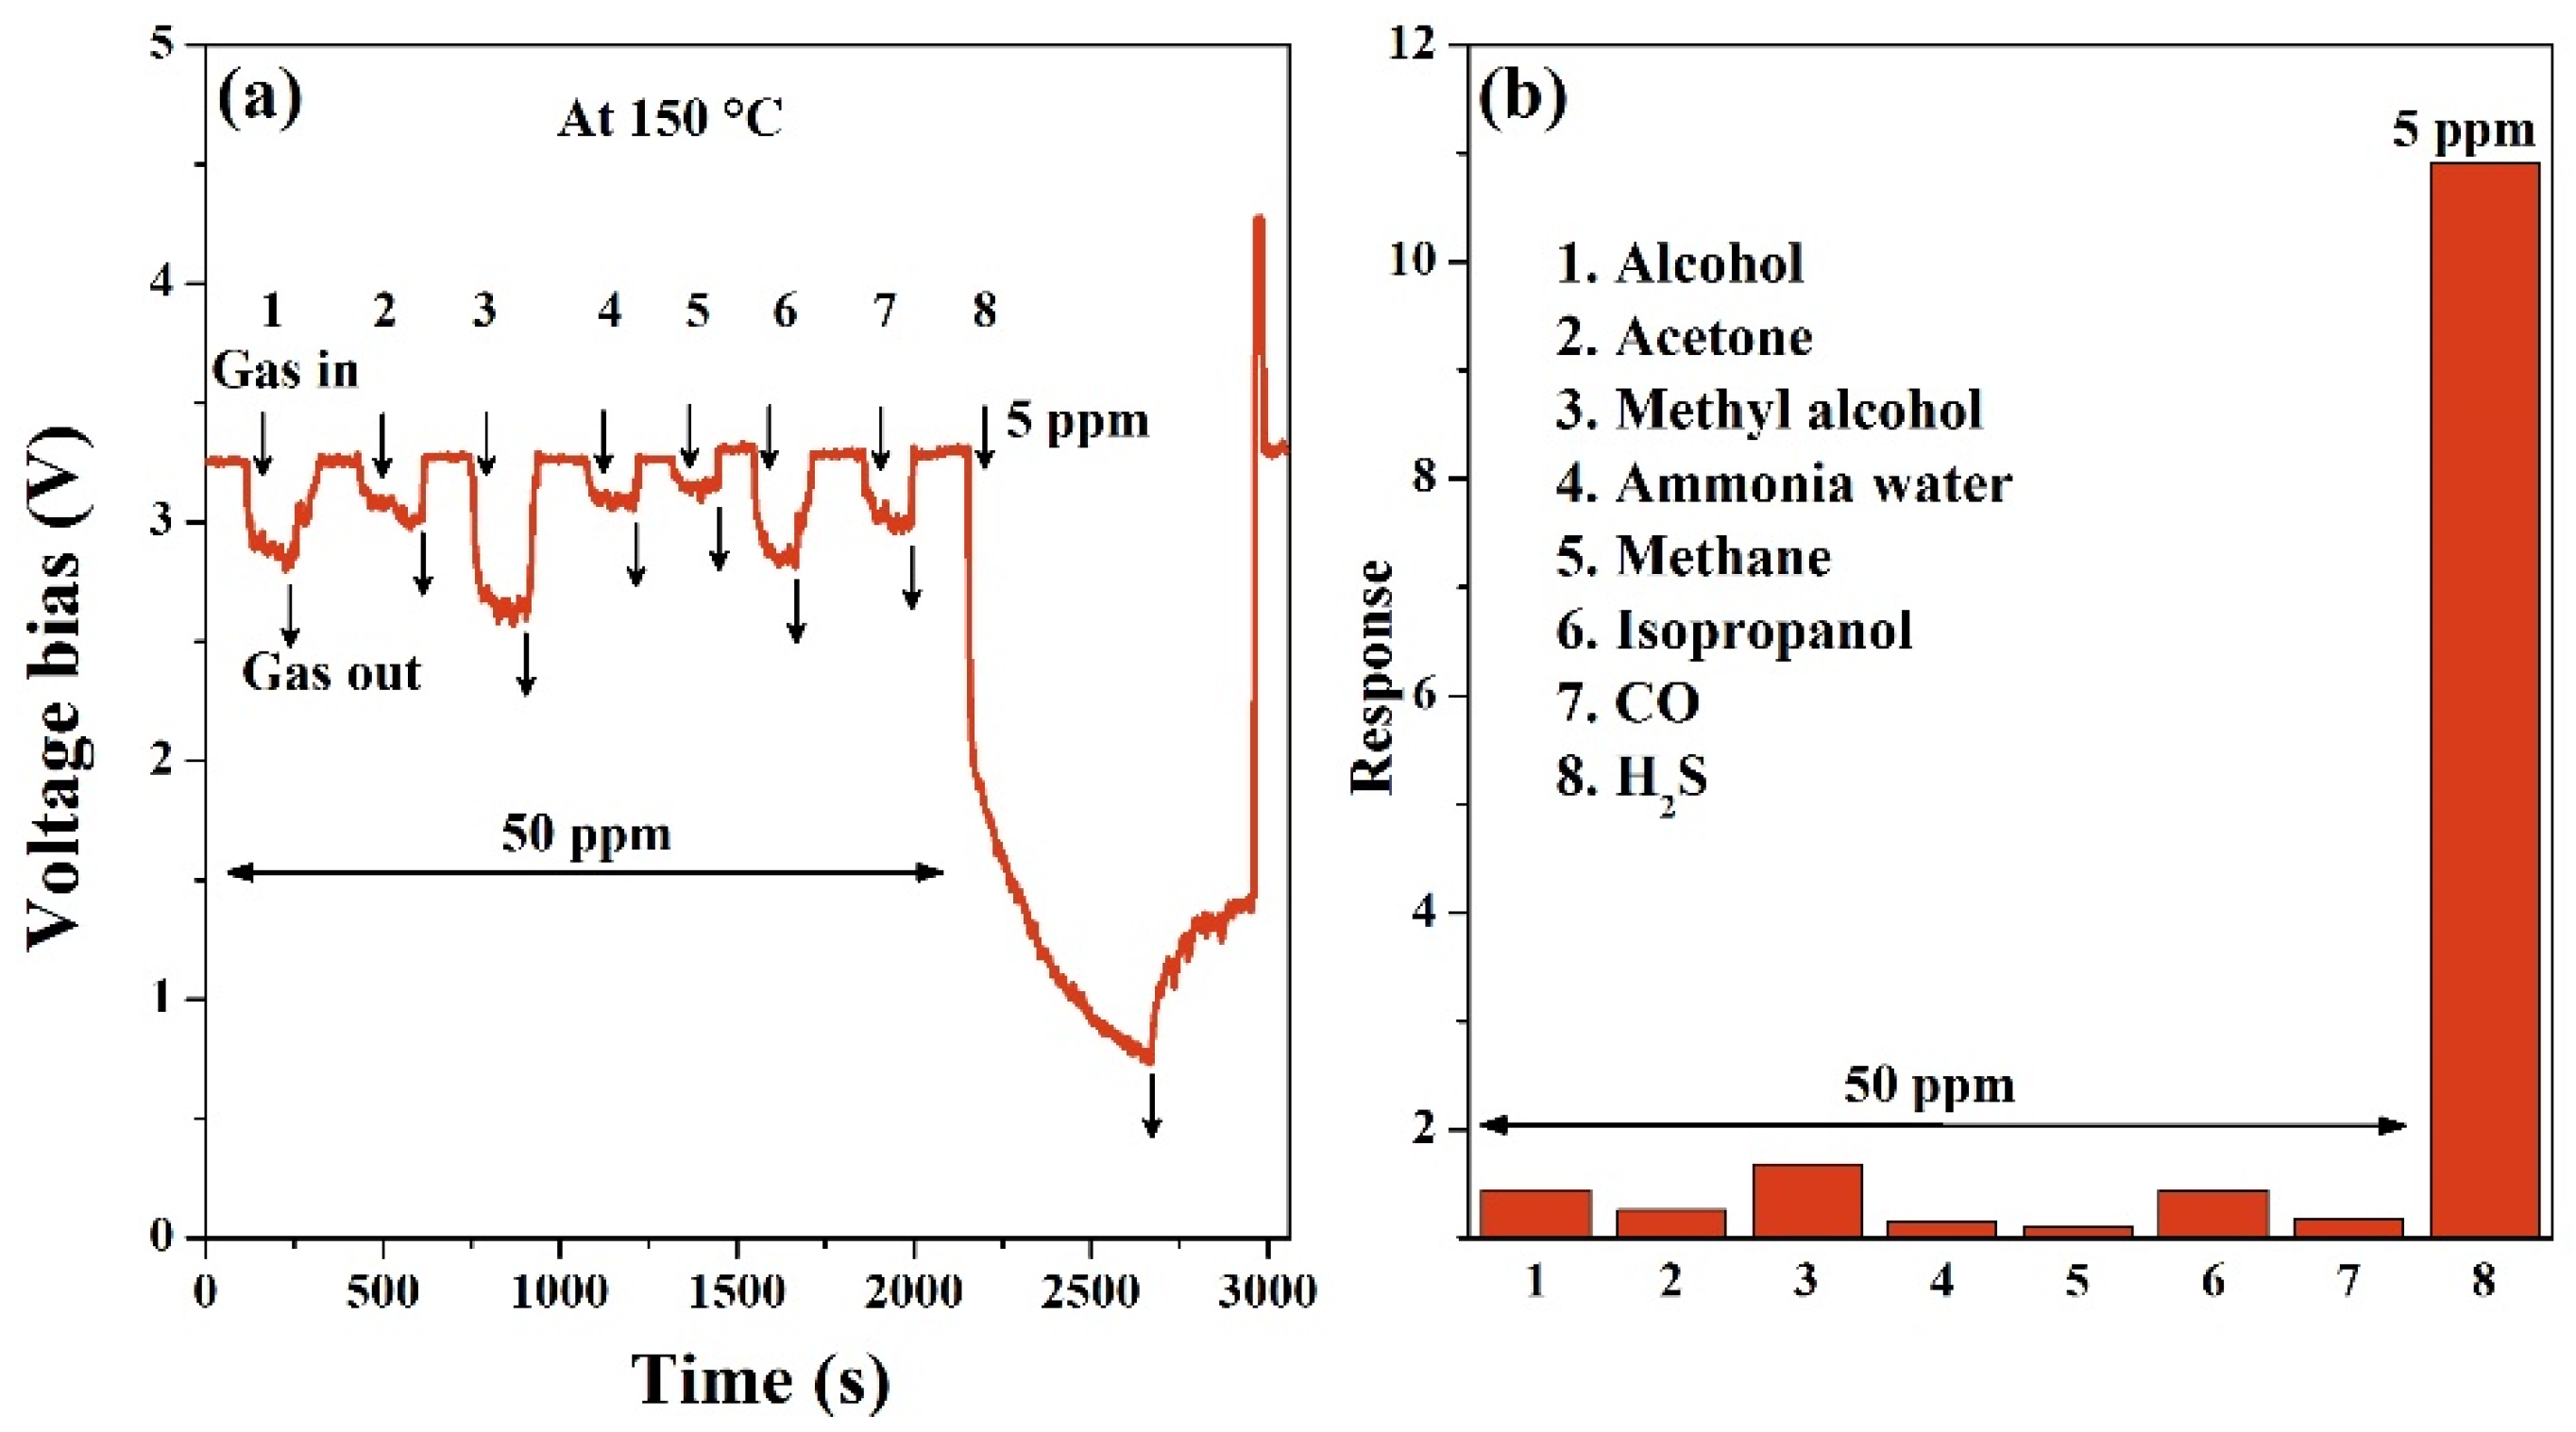
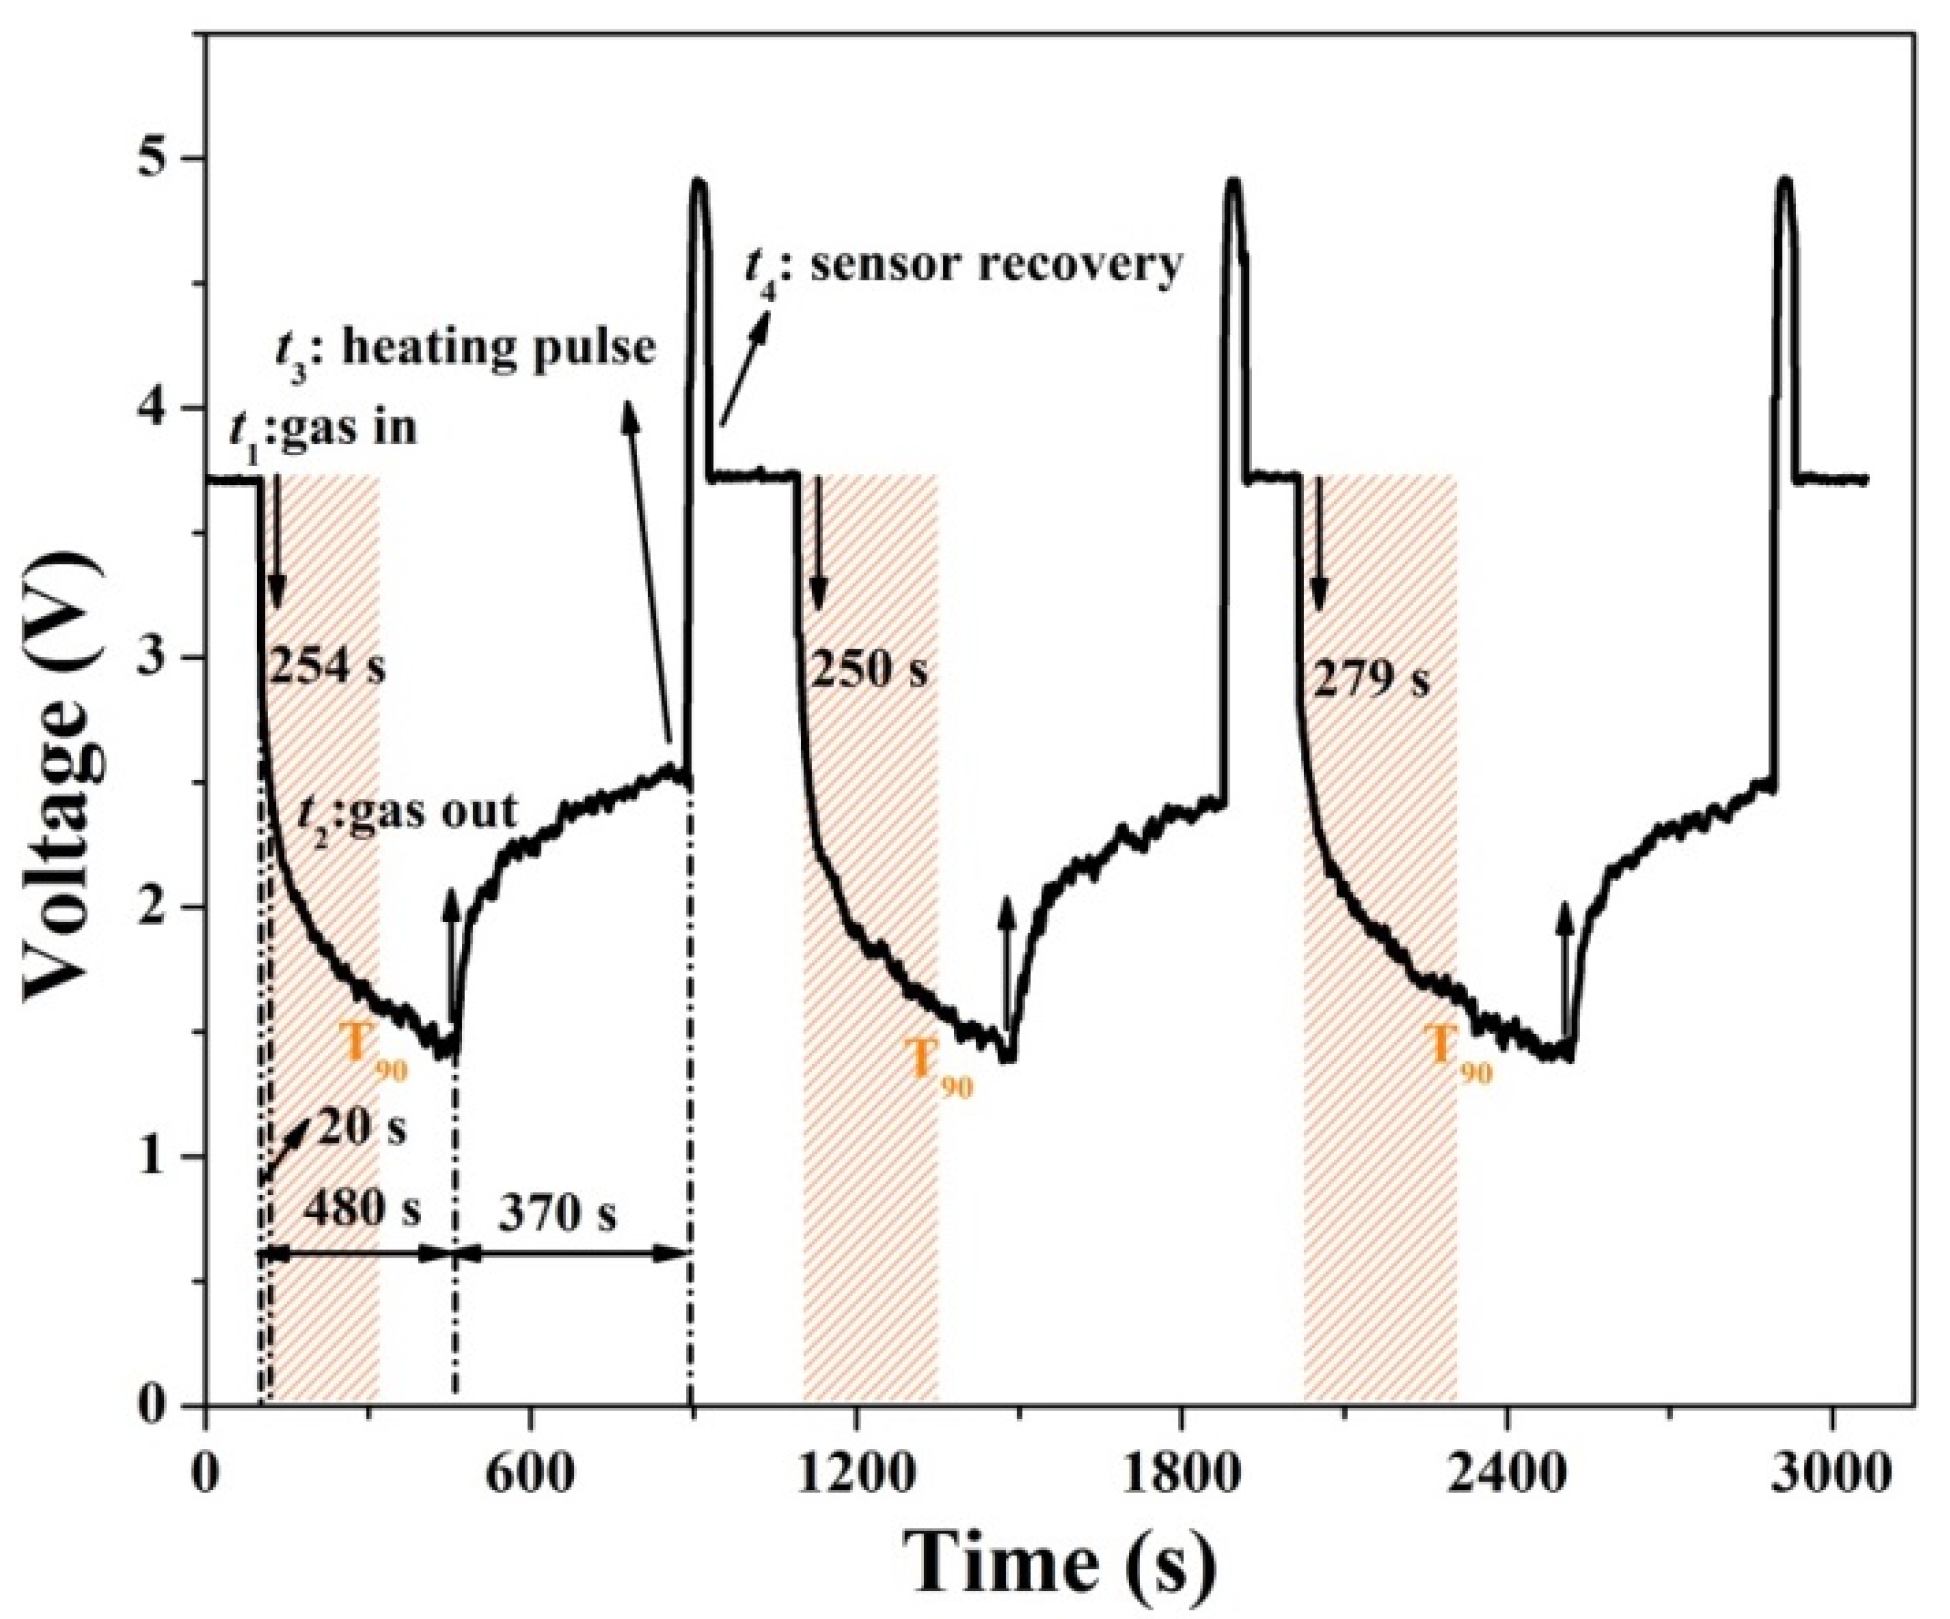
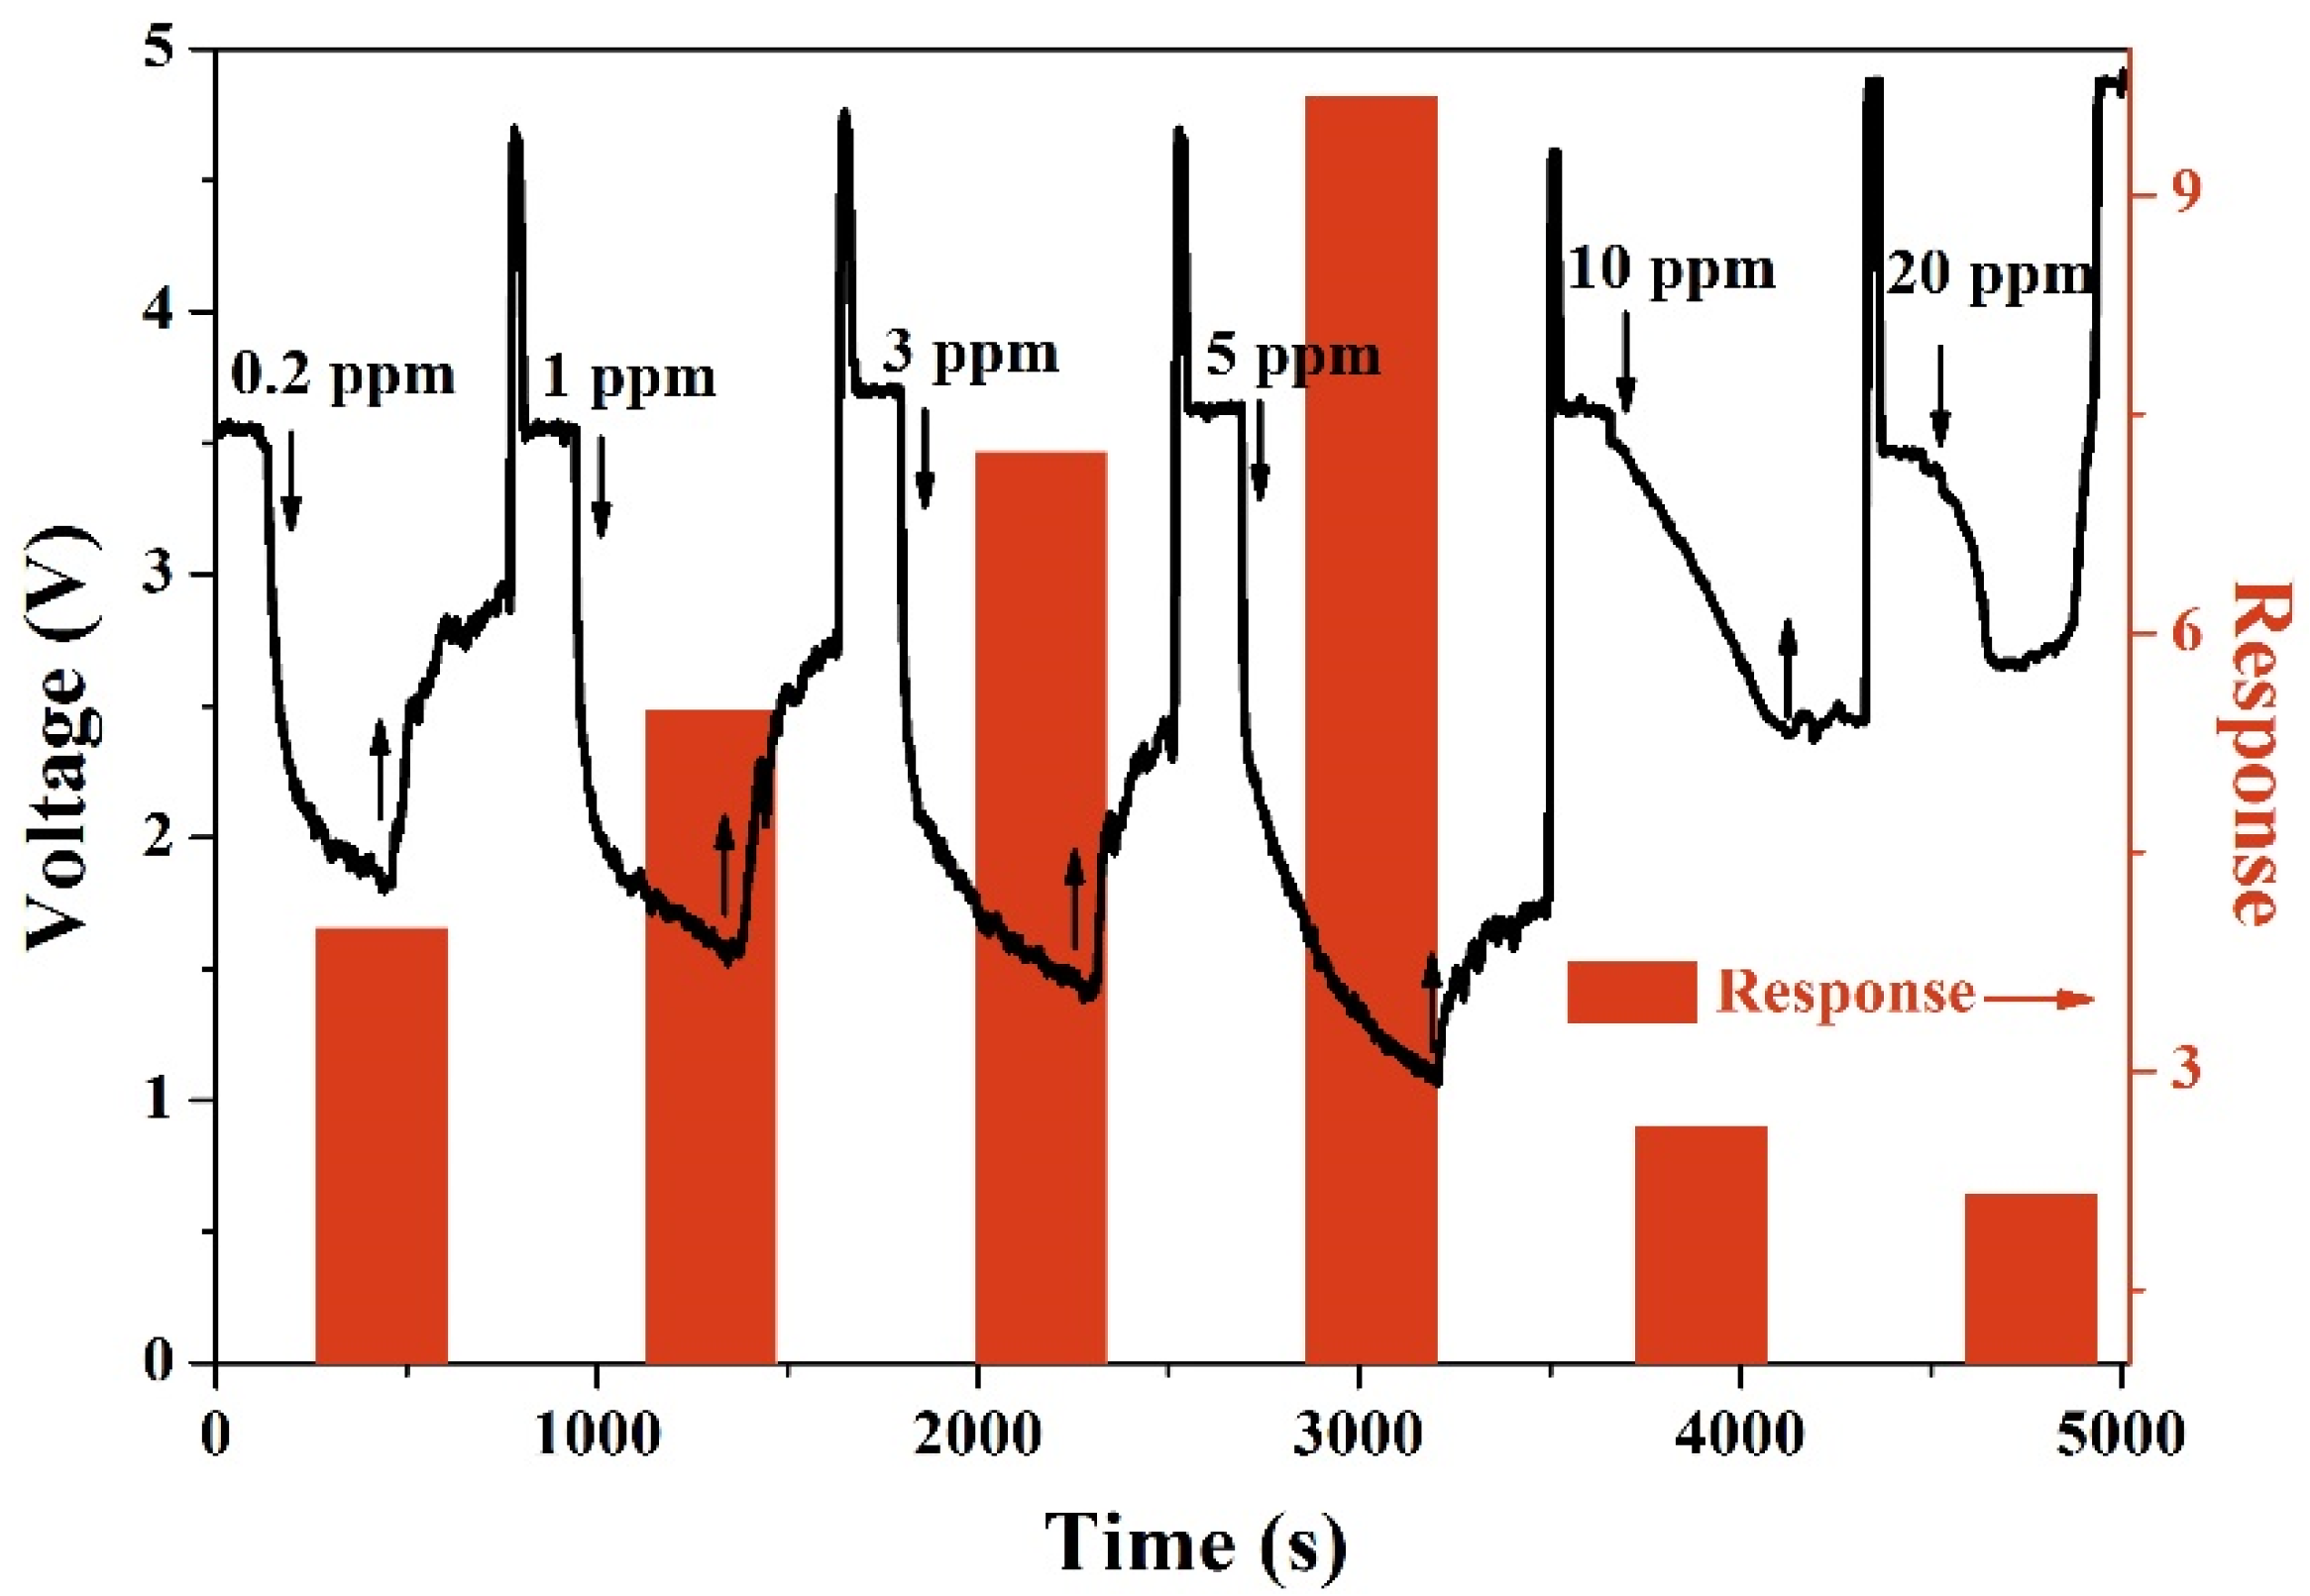
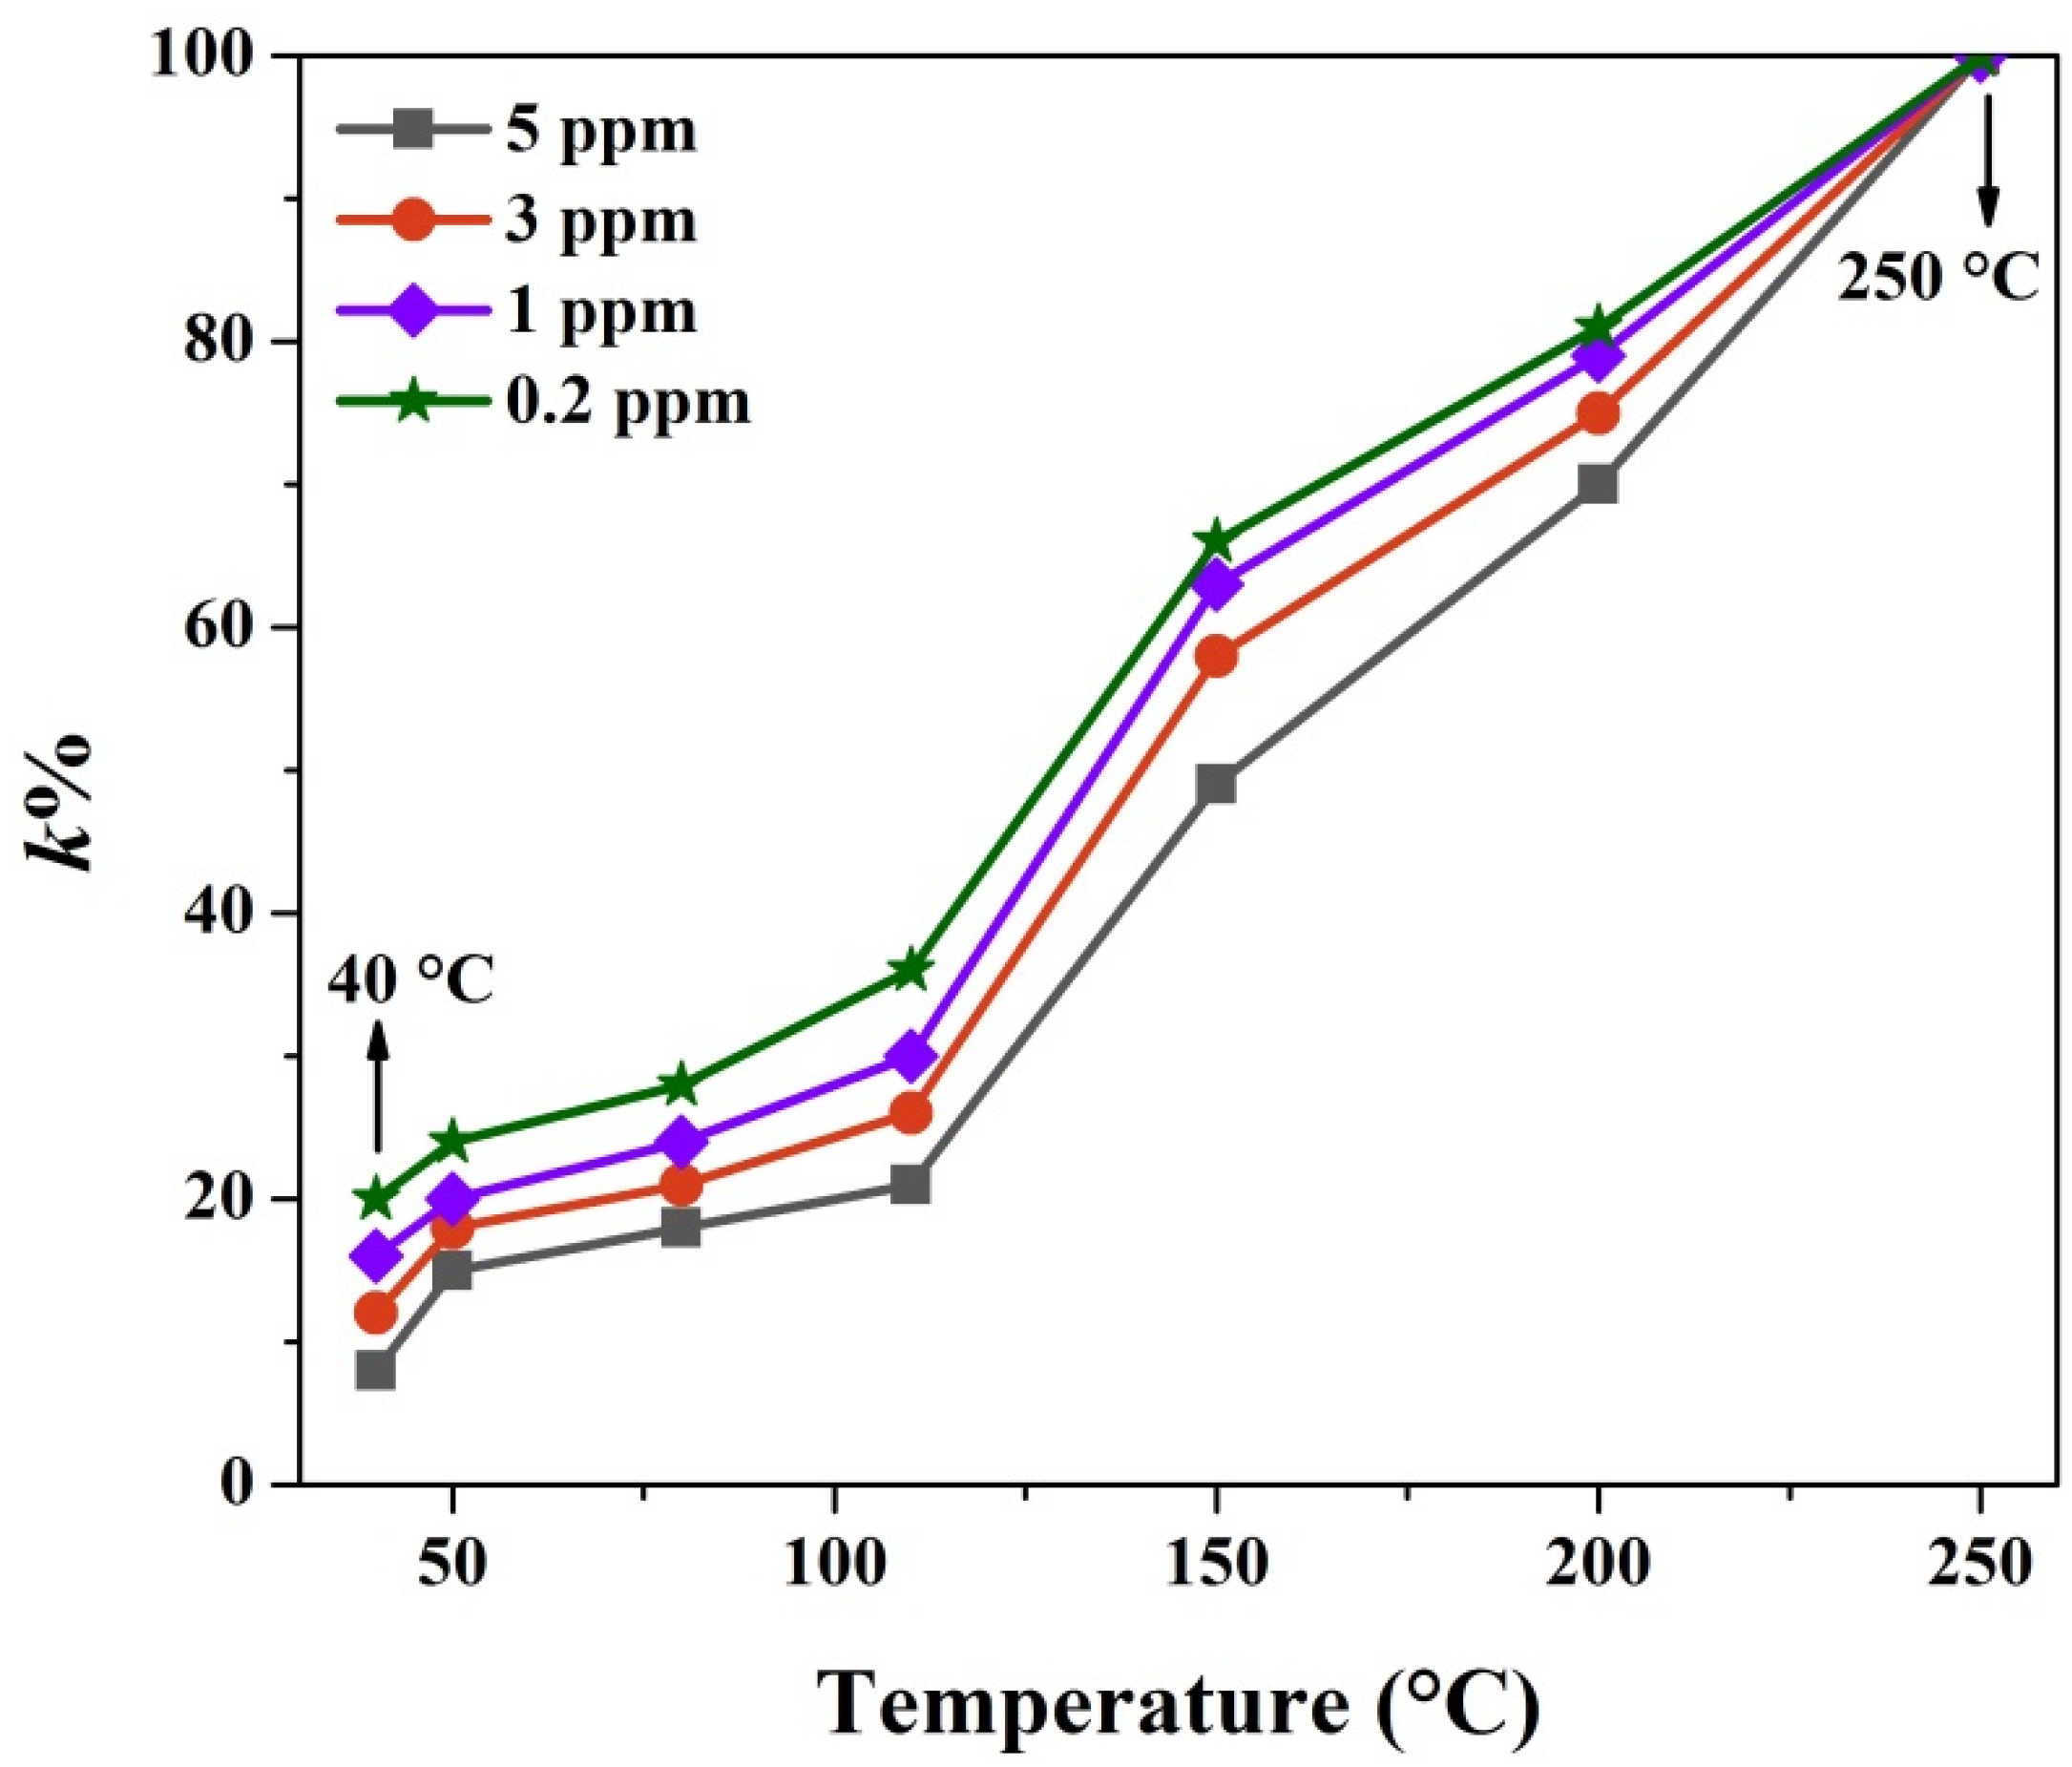
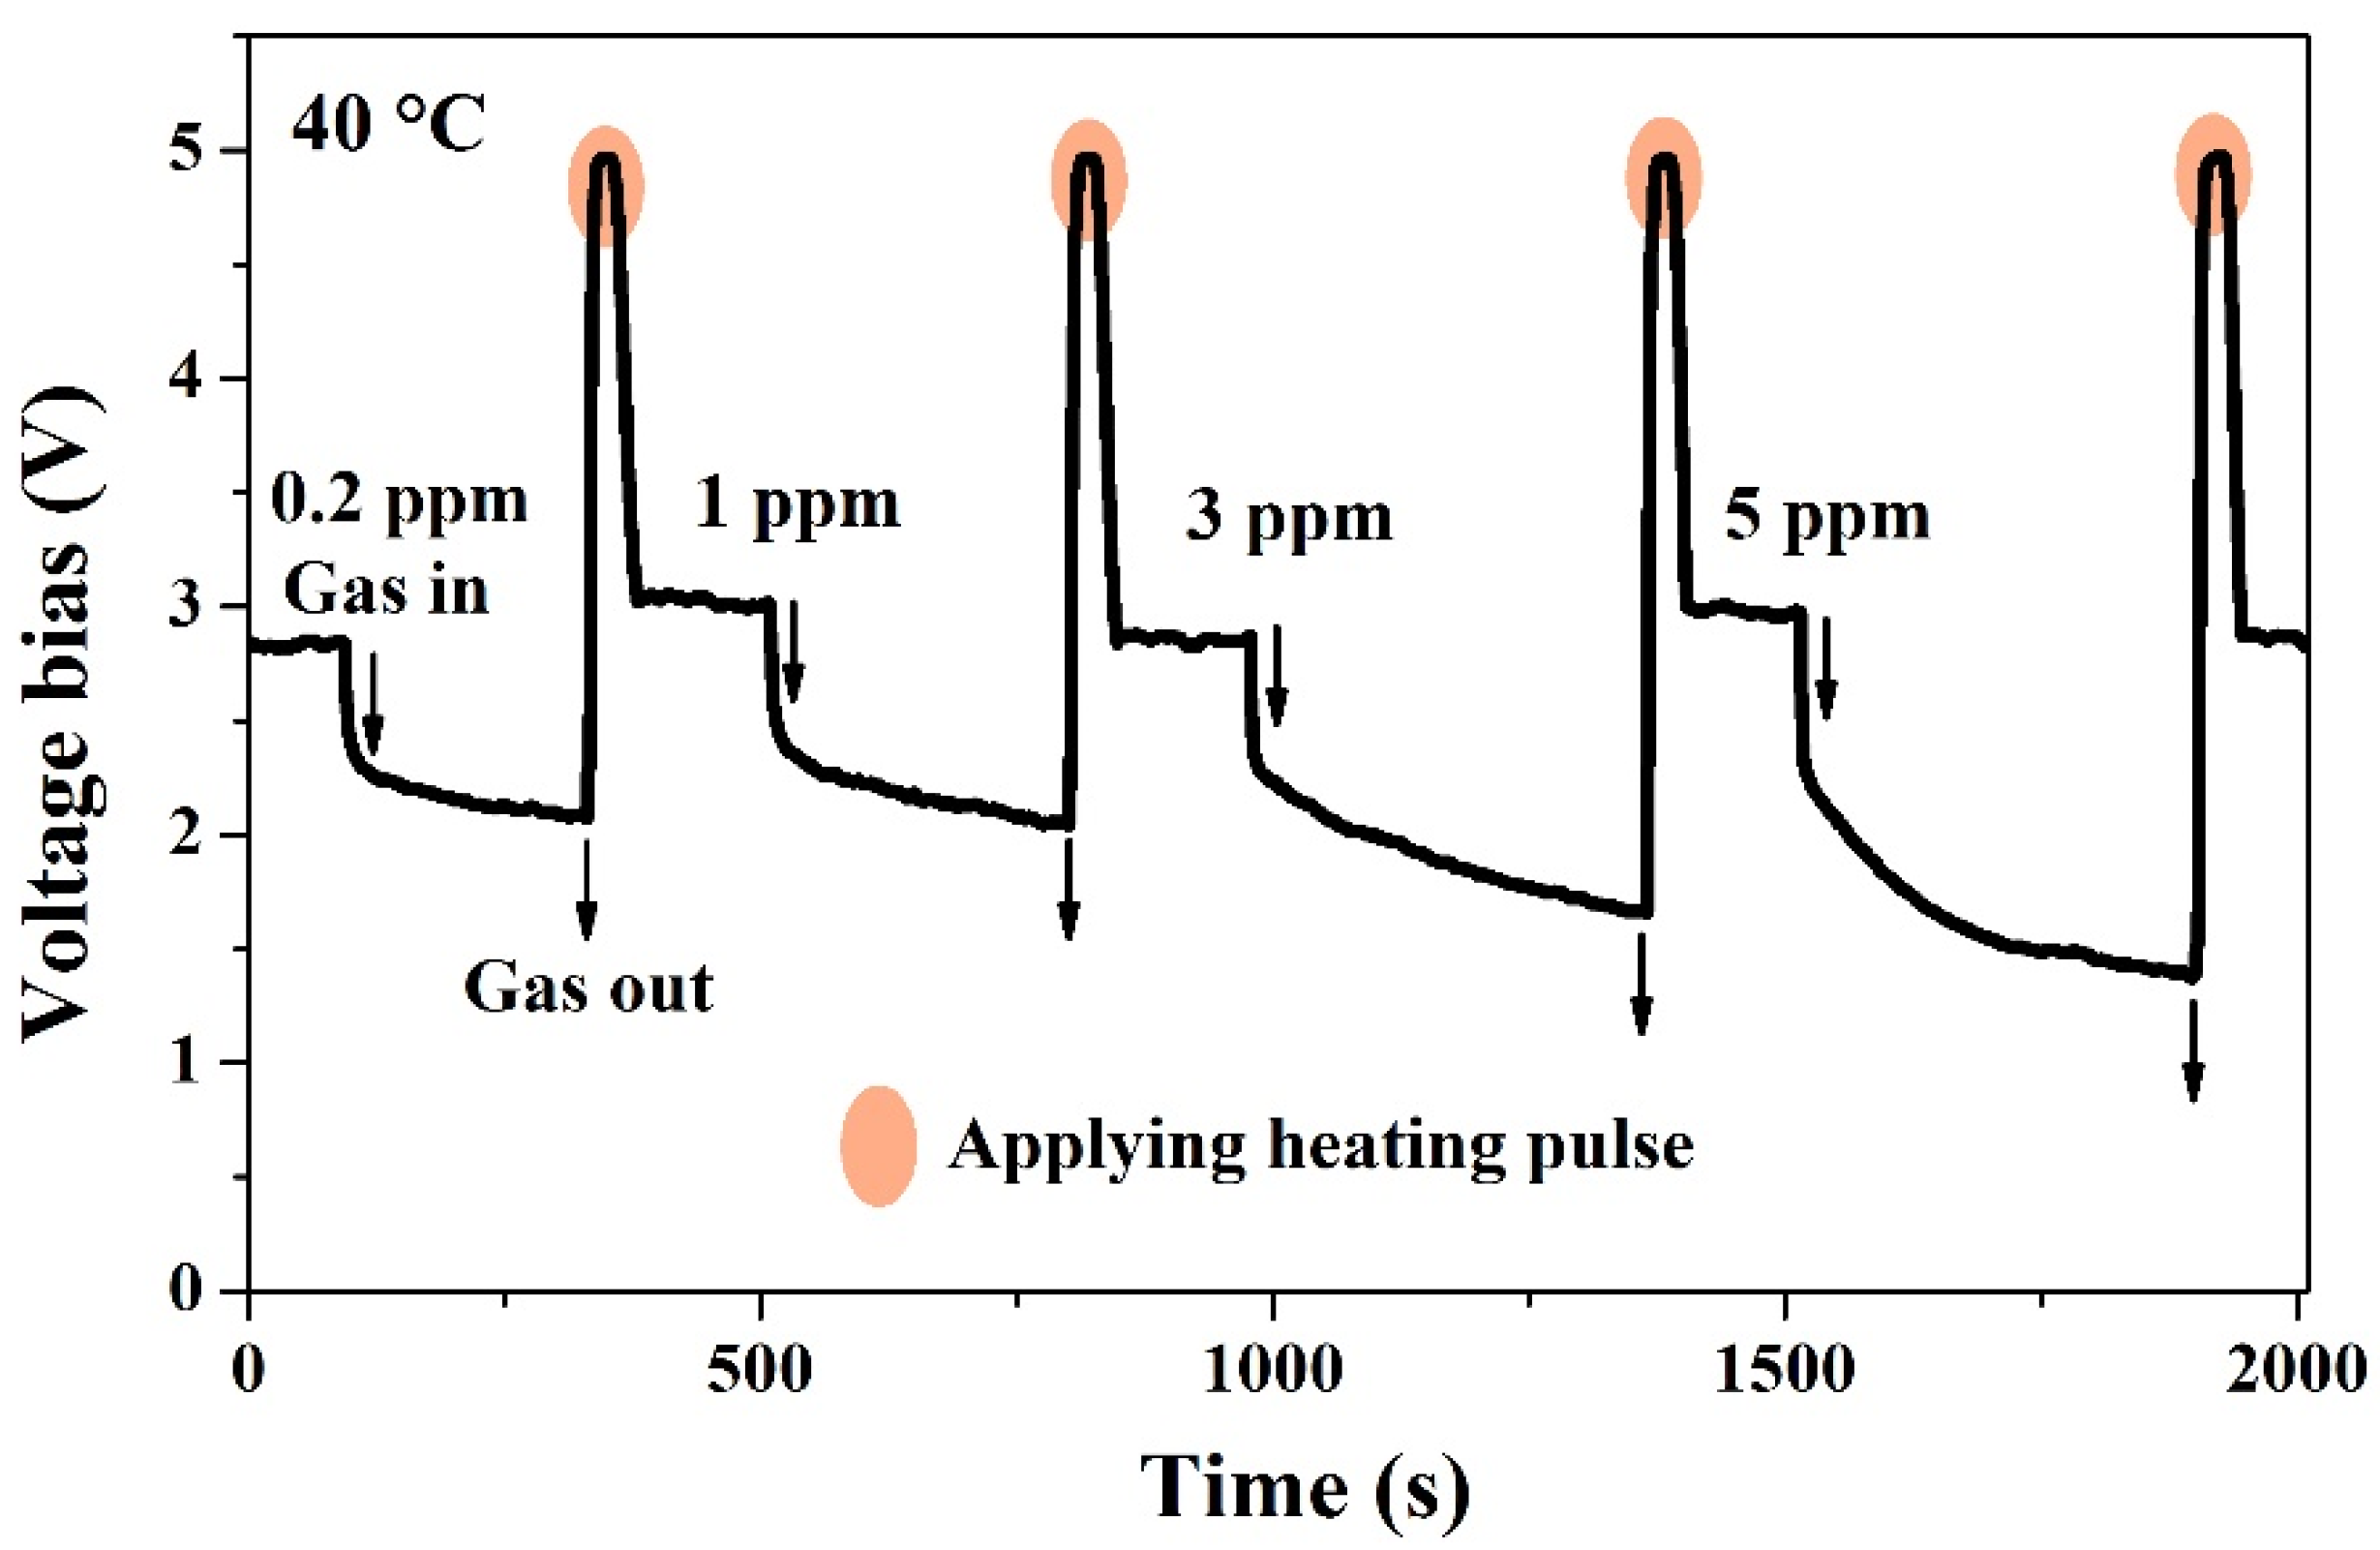
3.2. Gas Sensing Properties

Figure 3a displays the responses of CuO nanoparticles as a function of operating temperatures toward 0.2, 1, 3, and 5 ppm H2S gas. As seen, the responses exhibit the similar change trend to different H2S gas concentrations. The best working temperature is 150 °C at which the responses are 10.9 ± 0.53 and 4 ± 0.38 to 5 ppm and 0.2 ppm H2S gas, respectively. Even at 40 °C, the response reaches 4.9 ± 0.43 toward 5 ppm H2S gas and such a response is still suitable for monitoring the application. It has no doubts that the enhanced chemisorbed oxygen dominates the sensing process when the temperature is higher than 150 °C, since the Cu–S bonding decomposition can be effectively triggered by high temperature [21,22]. At a lower temperature of 40 °C, the sensing performance is mainly attributed to a CuS formation reaction. Since the oxygen adsorption and desorption process is suppressed at such a low temperature [13,14,15], its contribution to the device response is greatly diminished. The changing trend of response curves may result from the competition mode of the H2S oxidation mechanism and the CuS formation mechanism. The dynamic response processes of CuO nanoparticle sensors to various concentrations of H2S gas at 40 °C are recorded in Figure A1. Figure 3b shows the response and recovery times versus H2S concentrations at 40 °C. The response times increase form 122 ± 7.1 s to 297.5 ± 9.2 s since the H2S concentration increases from 0.2 ppm to 5 ppm. After applying a heating pulse, the recovery times decrease significantly within 54 ± 7.1 s, which indicates the rapid recovery feature at a low temperature. Our sensors have excellent sensing performance at 40 °C relative to the results reported previously, as shown in Table 1.
The selectivity of the CuO nanoparticles sensor was measured to 5 ppm H2S gas and 50 ppm other gases, including alcohol, acetone, methyl alcohol, ammonia water, isopropanol, and carbon monoxide (CO). The tested results are displayed in Figure 4. The response dynamic curve in Figure 4a illustrates that Vout drops down to the response values upon 50 ppm various gases’ exposure (marked as 1–7), and it quickly returns to the baseline value after air purging at 150 °C. For the seven gases, the CuO sensor shows the rapid response of 30 ± 2 s and fast recovery of 50 ± 3 s. However, for 5 ppm H2S gas, the sensor’s response and recovery times are longer. The response histogram in Figure 4b demonstrates that the CuO sensor is more sensitive to a low concentration H2S gas than the other high concentration gases. The prominent selectivity plays a crucial role in the practical detection of hazardous H2S gas.
The dynamic measurement is the best way to examine the response process [27,28]. Figure 5 records the repeatability dynamic response toward 3 ppm H2S gas at 150 °C. When H2S gas is injected into the test chamber at t1, the reaction occurs spontaneously between H2S and the pre-adsorbed oxygen species, according to Equation (1). Therefore, Vout initially has a sharp decrease on H2S exposure within a short time (20 s). CuS formation occurs on the surface of the CuO nanoparticles, according to Equation (2), which causes the Vout continue to drift slowly to lower values (taking 480 s for the response value). The T90 position corresponding to each response stage has been marked in Figure 5. The average response time is 261 ± 3 s after the sensors are exposed to 3 ppm H2S gas. After switching off the H2S gas at t2, the oxygen species re-adsorbs on the CuO surface, which leads to the Vout rising up to a platform and recovering at about 25% within 370 s. Next, the Vout hardly keeps rising and returns to the baseline value due to CuS formation. Once a heating pulse (350 °C, 30 s) is applied on the sensor at t3, the Vout rapidly rises up to the baseline state within 40.3 ± 2 s at t4. The instant high temperature accelerates the complete conversion of CuS back to CuO [21,23], and the correlated reaction can be expressed by Equation (4).
2 CuS + 3 O 2 ( g ) Δ 2 CuO ( s ) + 2 S O 2 ( g )
Such an operation has been successfully adopted in the previous works [10,23]. Thus, the sensor based on CuO nanoparticles presents stable and repeatable sensing properties with a heating voltage.
Furthermore, Figure 6 records the typical dynamic curves and responses on H2S concentrations ranging from 0.2 ppm to 20 ppm at 150 °C. Upon a lower concentration of H2S (0.2–5 ppm), the response is found to vary linearly with H2S concentration. Due to a rise in H2S concentration to 10 ppm, the reactions were increased and benefited from larger coverage, but the sensor’s response became weaker since the decline to Vout is smaller. This phenomenon violates the linear relationship between the response value and gas concentration. Further increasing H2S concentration to 20 ppm, the sensor’s response continues to decrease and the dynamic curve shows a unique feature. Initially, the Vout decreases slowly, which is followed by “a valley,” and increases sharply before removal of H2S gas. The device appears to be temporarily poisoned, and can only recover to the baseline state after applying multiple pulses. The performance may be attributed to the metallic CuS layer that forms on the CuO surface and the carrier flows directly from the CuS layer. Therefore, the sensor’s resistance decreases and, hence, the Vout increases. This phenomenon is consistent with the results observed by Ramgir [26]. Since the abnormal behavior occurs upon the sensor being exposed to a high concentration of H2S gas, we chose the sensor toward low concentrations of H2S gas (0.2–5 ppm) for further discussion.

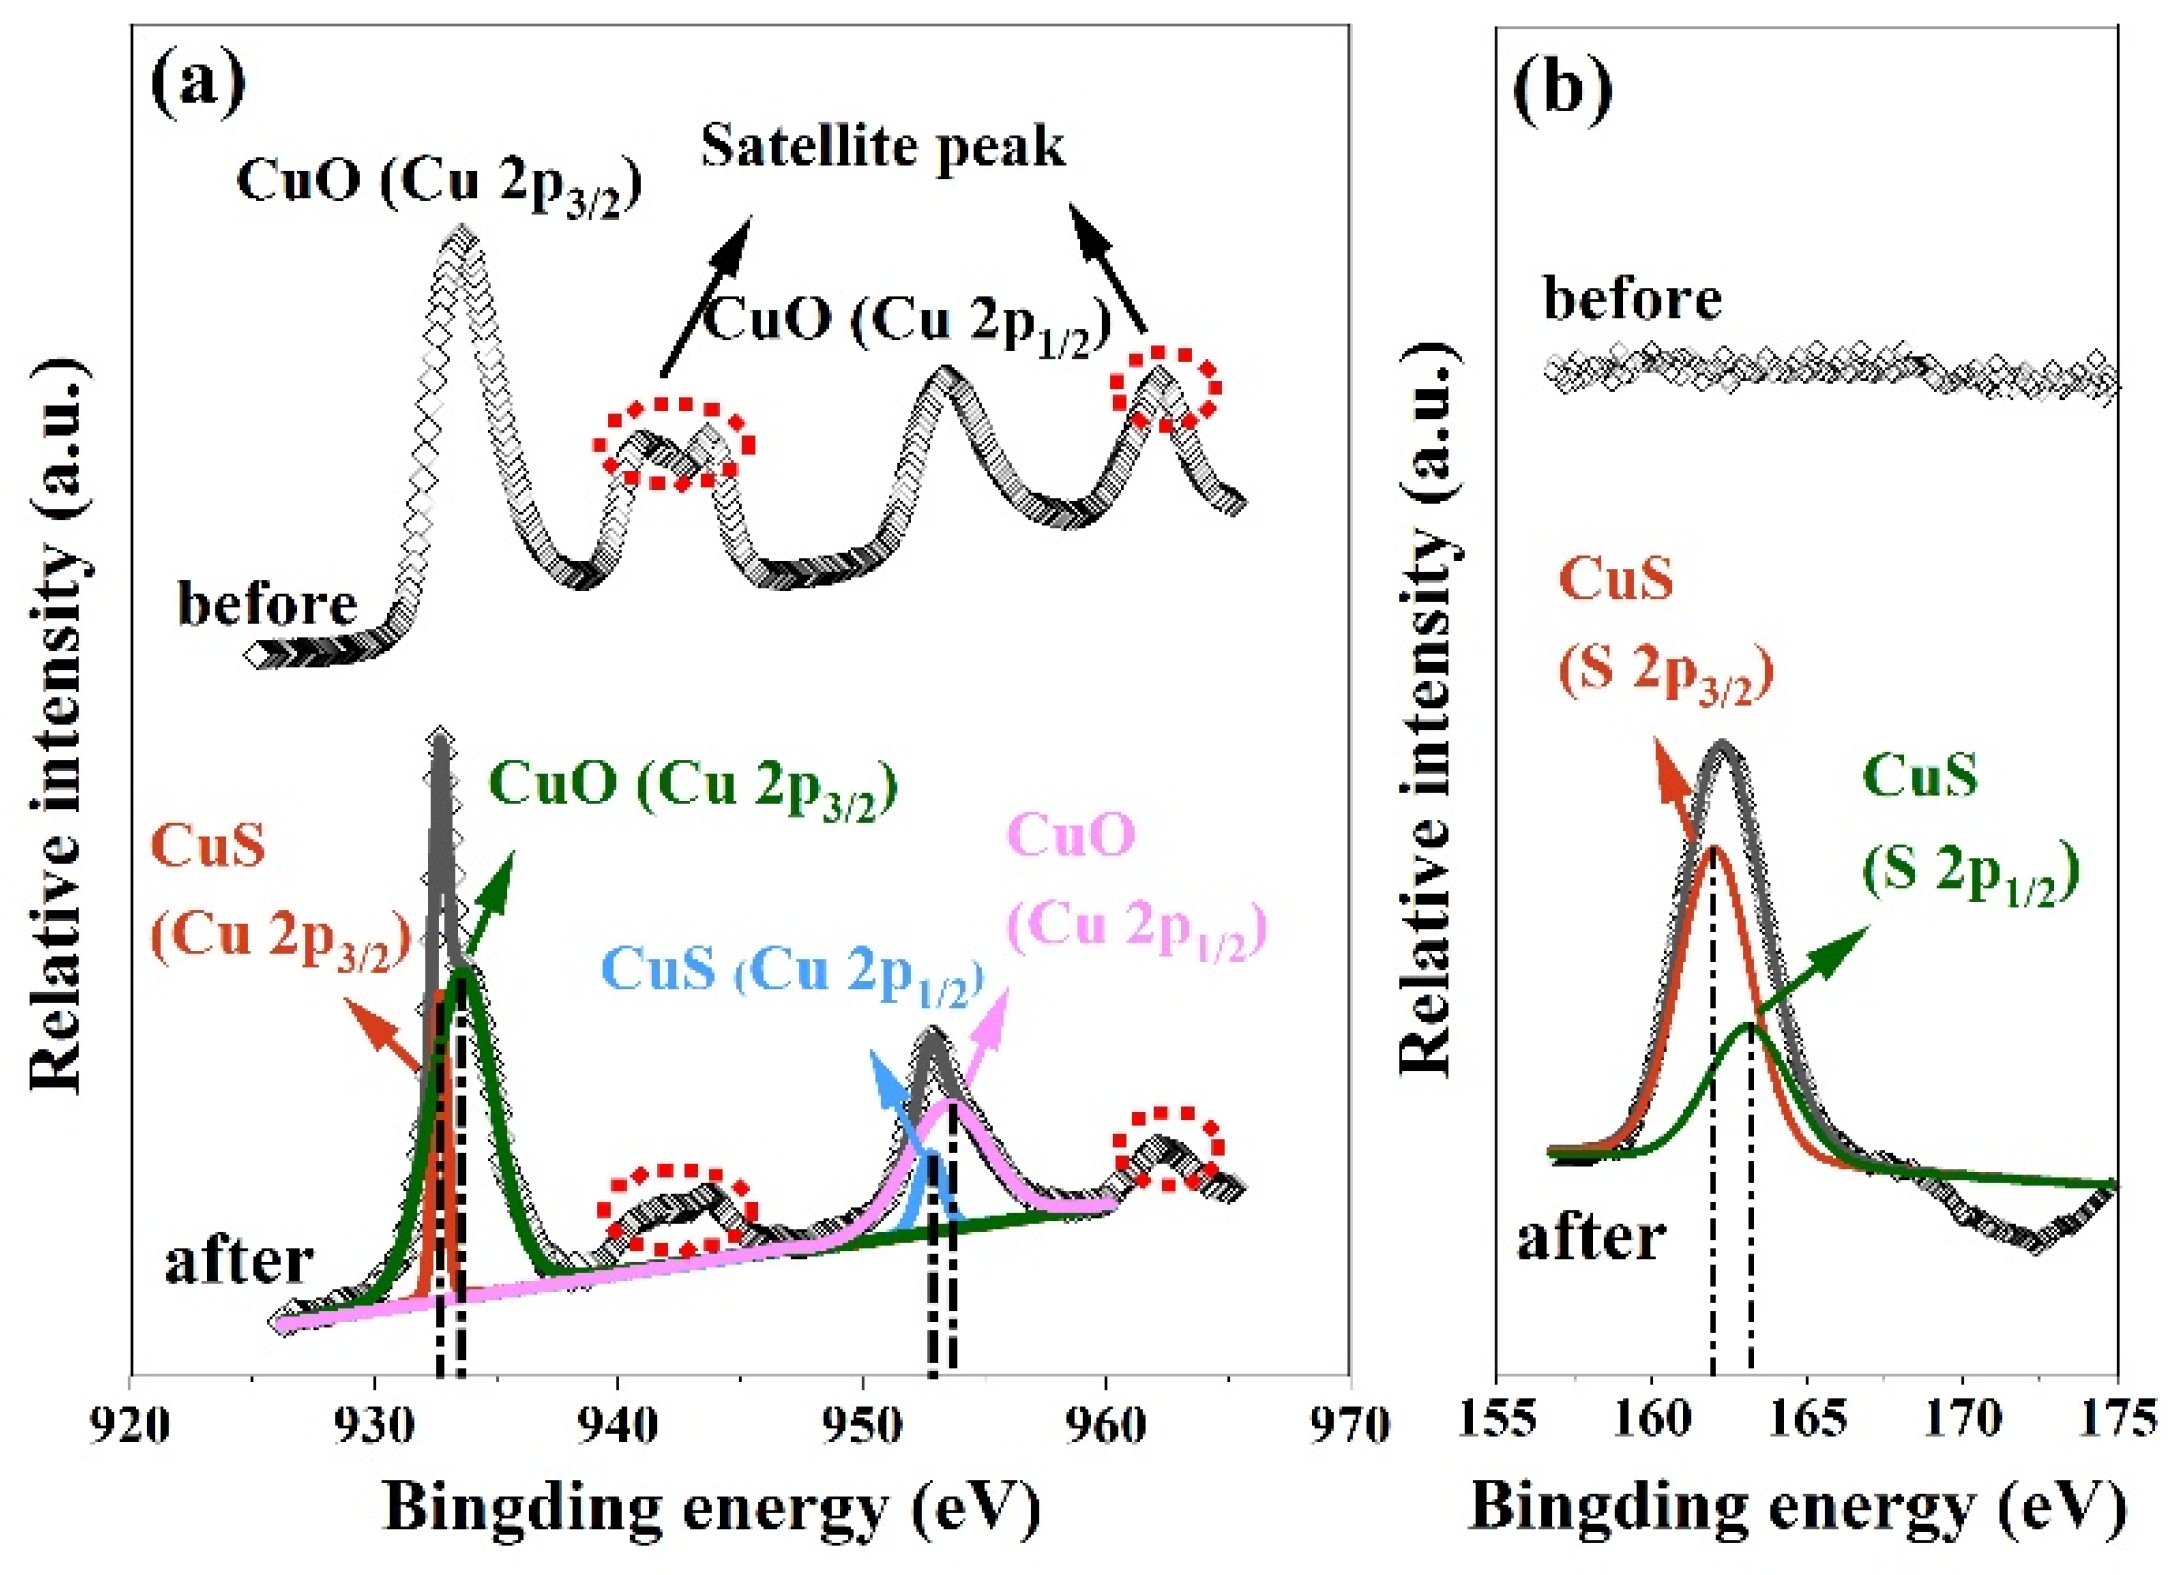
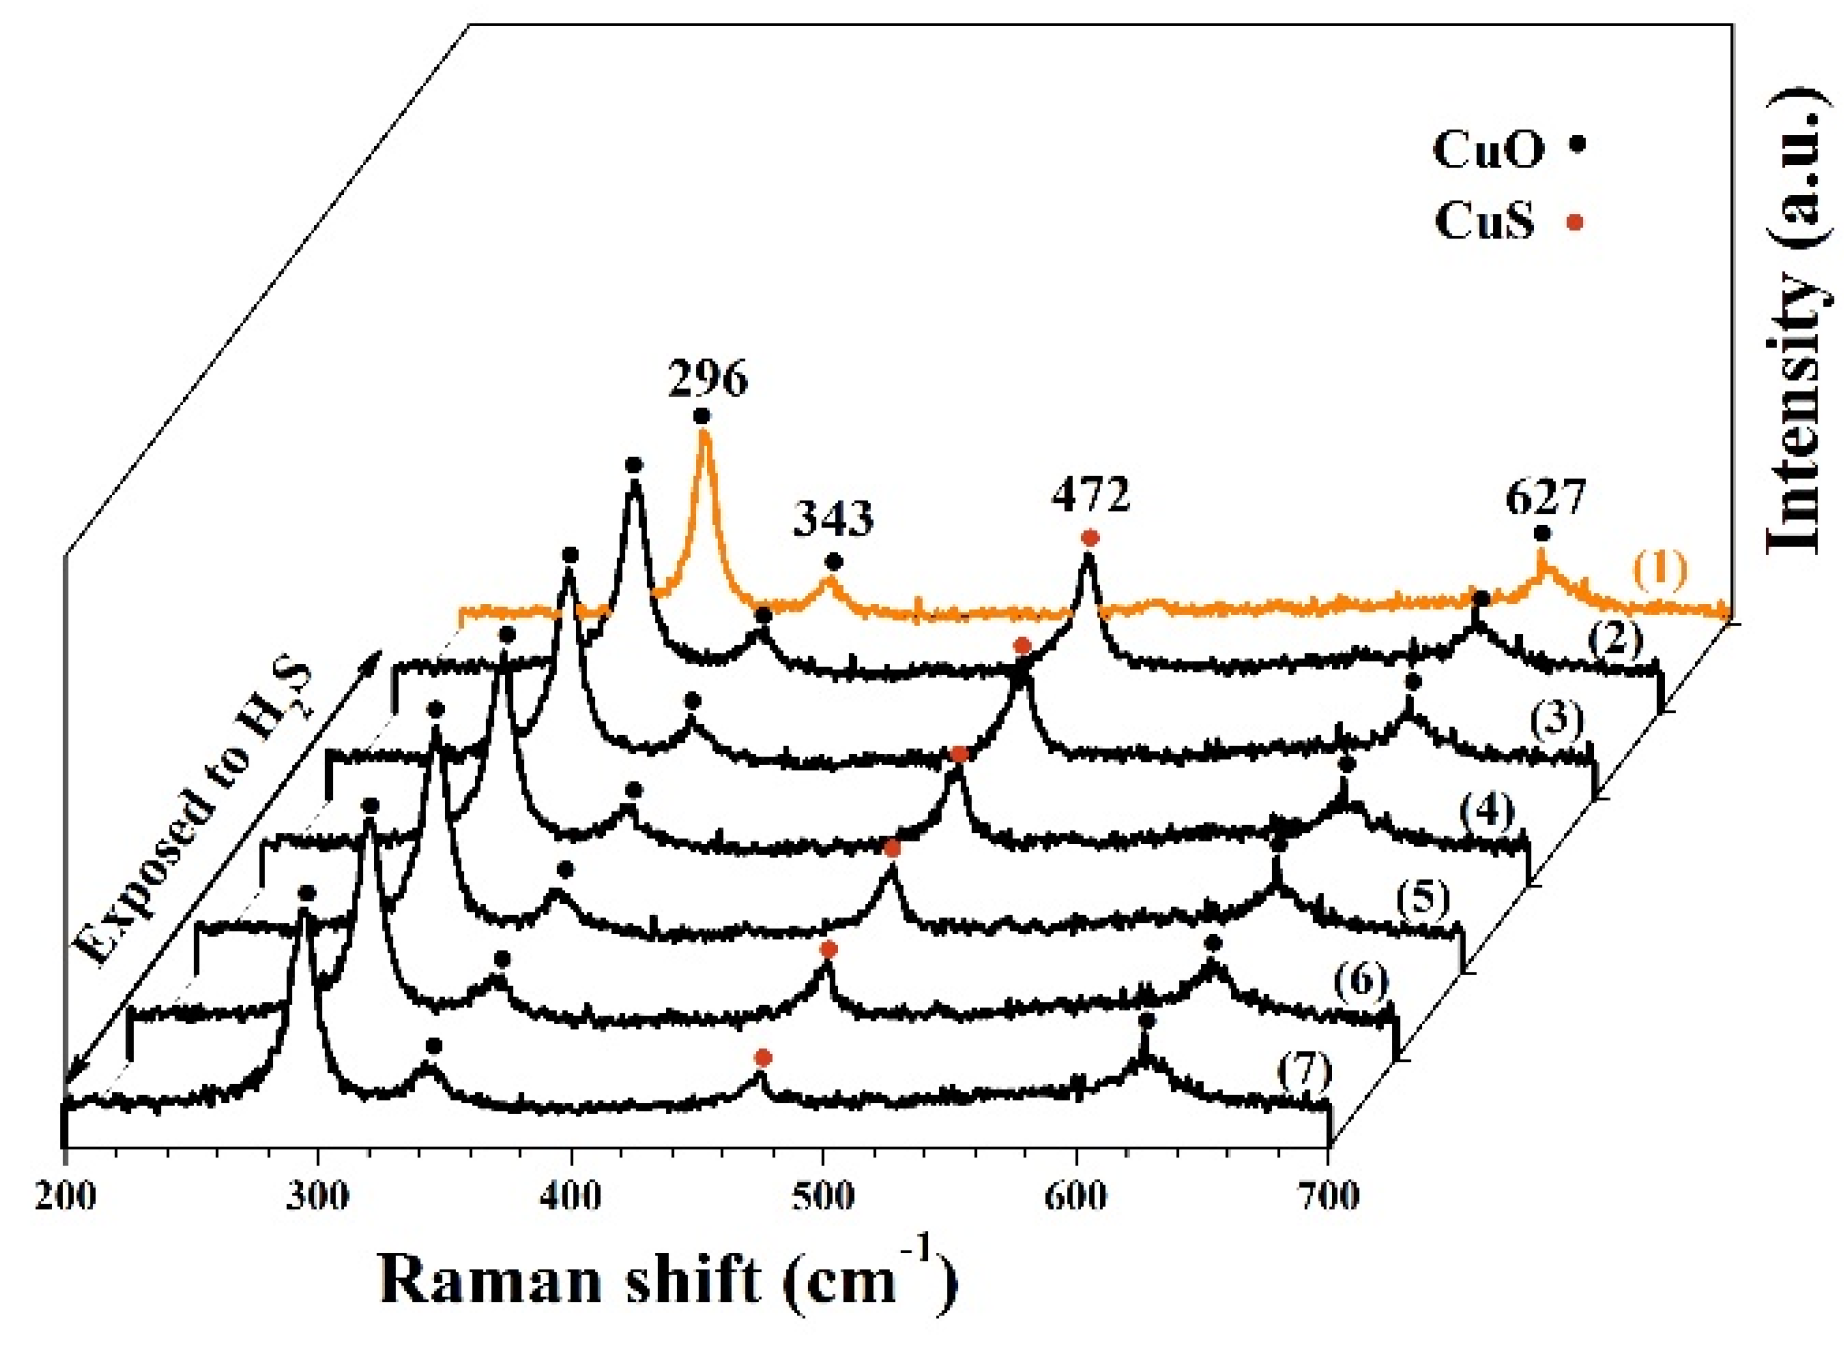
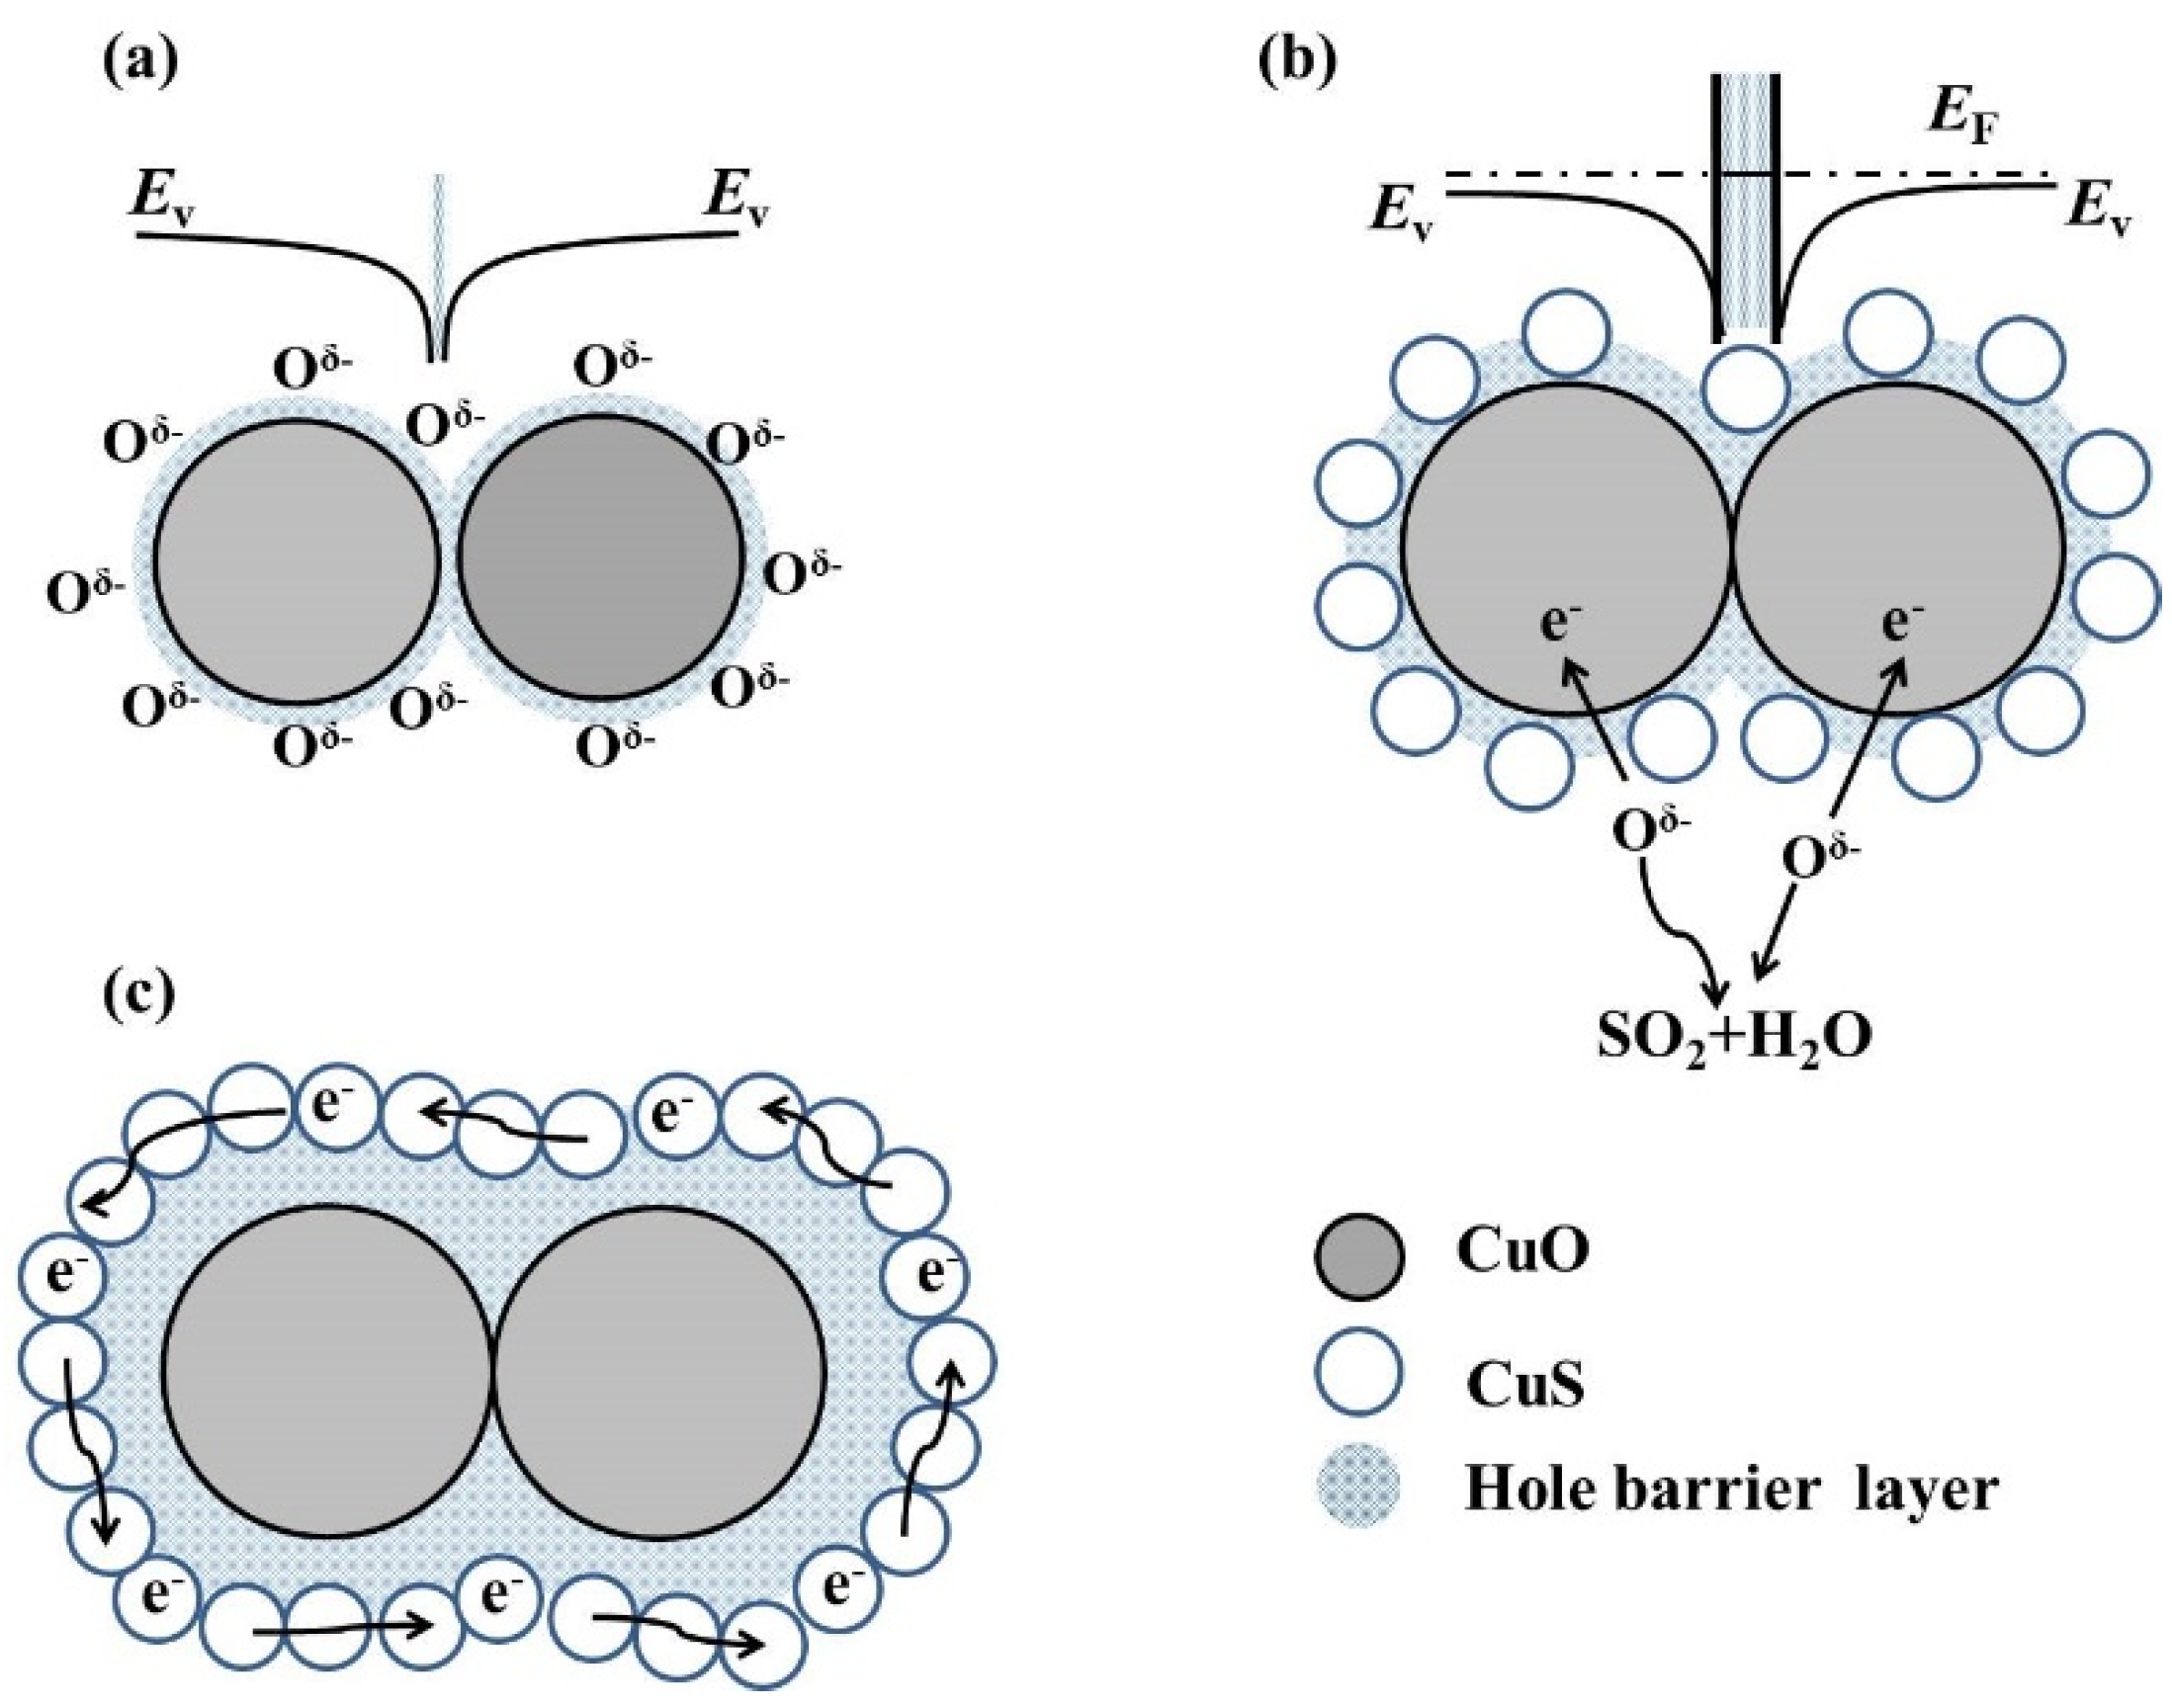
3.3. Sensing Mechanisms

To analyse the dependence of dynamic variation on the two sensing mechanisms, we chose to compare the real-time curves of CuO-based sensors to H2S gas and to CO gas, which is a reducing gas similar to H2S gas. Figure 7 presents the dynamic response in the presence and absence of 300 ppm CO and 1 ppm H2S gas. As seen in Figure 7a upon 80 °C, the Vout on RL reduces to the response value after CO gas injection at t1. It spontaneously rises up to the baseline value within 30 s after the CO gas is released at t2. Based on the previous reports [29,30,31], the sensing performance of CuO material to CO gas is mainly induced by the oxidation mechanism based on depletion theory. The dynamic performance upon the CO exposure/release process displays that the oxygen adsorption process can be completed spontaneously, since the Vout returns to the baseline state rapidly after the CO release. As shown in Figure 7b, once the CuO nanoparticles sensor is exposed to H2S gas at t1, the Vout decreases to the response value dominated by the H2S oxidation and CuS formation behaviors collectively. After being exposed with air at t2, the Vout rises to a platform within 150 s on account of the oxygen re-adsorption process. The recovery platform is defined as recovery I. This first recovery process is affected by the CuS formation since CuS covering on the CuO surface can reduce the chemically active sites for oxygen molecules’ chemisorption. Next, Vout cannot restore the baseline value due to the existence of CuS, since the Cu–S bond is too strong to break at a low temperature. Overall, CuS formation clearly hinders the recovery process of the device. After applying a heating pulse (350 °C, 30 s), Vout quickly rises up to the baseline state. The schematic illustrations related to the sensing process are present in Figure 7b. In this case, the vertical height between the response value and baseline value is marked as h, the vertical height between the response value and the recovery I is recorded as h1, and the ratio of h1/h is marked as k%, which represents the proportion of the recovery I in the whole recovery process. The smaller (greater) the ratio is, the stronger the inhibition on the device recovery process by CuS formation is.
Figure A2 depicts the dynamic curves of the sensor at different H2S concentrations and operating temperatures. To exhibit the dependence of k% values on working temperatures and gas concentration intuitively, the k% versus the two factors was shown in Figure 8. As seen, the k% decreases while increasing H2S concentrations from 0.2 ppm to 5 ppm. Such a variation indicates that the inhibition on the recovery process by CuS formation enhances with the expanded coverage of H2S molecules. In addition, the k% increases as the temperature rises from 40 °C to 250 °C. Therefore, the inhibition of CuS formation on the recovery process becomes weak. Additionally, when the temperature rises to 250 °C, the k% is approximately 100% toward different concentrations of H2S gas. This indicates that CuS formation has no effect on the sensor recovery because the high temperature facilitates the complete oxidation of CuS to CuO. The generated CuS (according to Equation (2)) was converted to CuO simultaneously (based on Equation (4)). Ultimately, the CuS formation cannot be detected since the two reactions achieve equilibrium at such a high temperature.
The XPS measurement was adopted to confirm the CuS formation, as illustrated in Figure 9a. Before exposure to H2S gas, the binding energies at 933.6 eV and 953.5 eV are due to Cu 2p3/2 and Cu 2p1/2 for CuO, and the two satellite peaks at ~943 eV and ~963 eV relate to the paramagnetic chemical state of Cu2+ [32,33]. In the case of H2S exposure, the two satellite peaks still exist. Meanwhile, the Cu 2p3/2 peak has two components at 932.7 eV and 933.6 eV, and the Cu 2p1/2 peak is due to two components at 952.8 eV and 953.5 eV, respectively. The positions of 932.7 eV and 952.8 eV are typical peaks for CuS [34,35], and the positions of 933.6 eV and 953.5 eV are corresponding to the peaks of CuO [36,37], which verifies the generation of CuO/CuS composites. Furthermore, Figure 9b explores that the S 2p peaks is absent before H2S injection, while the S 2p peak appears with two components at 162.0 eV and 163.1 eV after H2S exposure. The above positions are attributed to the S 2p1/2 and S 2p3/2 states in the metal sulfide bond [36,37], which also confirms the CuS formation. Therefore, the XPS results adequately support that CuO is partly conversed into CuS after H2S sensing.
Raman spectra were exploited to modulate the sensor’s dynamic process with temperature. All the Raman spectra were measured by 1 mW laser radiation, as displayed in Figure 10. Curve (1) is raw Raman data of CuO. There are peaks at 296, 343, and 627 cm−1 [38,39]. After exposure to H2S gas, there is a new sharp peak in 472 cm−1 in curve (2). The new peak agrees well with reported values for Cu–S bonding [40,41]. As previously discussed, a short-time heating pulse facilitates the break of Cu–S bonds and finishes the recovery process. To simulate the heating effect on CuS decomposition, the power of the laser radiation was increased from 1 mW to 8 mW to simulate the electric heating pulse. As we know, the local temperature of the area under laser irradiation could be very high. After applying the “heating pulse,” we reduced the laser energy to 1 mW again and then measured the Raman signals. With the increasing laser power, the intensity of the CuS Raman peak slowly decreases and becomes almost unobservable, as illustrated by curves (2)–(7). The micro Raman results support that high temperature facilitates the Cu–S bonding break and, hence, accelerates the sensor’s recovery process.
The sensing mechanism of CuO nanoparticles’ sensor to H2S gas is described in Figure 11. As presented in Figure 11a, many oxygen molecules in air are chemisorbed on the surfaces of tiny-grain CuO based on depletion theory. These adsorbed oxygen molecules become ionized oxygen species Oδ− by grasping free electrons from the conduction band of the CuO nanoparticles. The process of capturing electrons leads to the construction of a Schottky-barrier between the inner grains and the formation of a hole barrier layer in the near-surface region, which is analogous to the inter-granular contacts in high-porosity SnO2 [42,43]. As shown in Figure 11b and Equation (1), once the CuO nanoparticles contact each other with a low concentration of H2S gas, the chemisorbed Oδ− reacts with H2S to be transformed into H2O and SO2. Those electrons previously trapped by oxygen atoms are instantaneously released back into the conduction band of CuO [44], which leads to a decrease in carrier density and an increase in sensor’s resistance. Meanwhile, CuO is partly converted into CuS with lower work function [21,45]. Electrons flow from CuS to CuO. The hole barrier layers on the CuO surface are enhanced relative to that in air, so CuS formation behaviour further amplifies the sensor’s resistance. However, it is reported that there is a significant reduction in electrical resistance after CuO is sulfurized to CuS [18,22] because CuS has a metallic character with a good conductor and low resistance [12,20]. The different results depend on the H2S concentration. When the H2S concentration further increases, the covering region of CuS on the CuO surface grows gradually, and eventually becomes a continuous CuS covering layer that facilitates the carrier flows directly from the surface itself. This would lead to a significant reduction in the sensor’s resistance. The schematic diagram is illustrated in Figure 10c. In addition, the mechanism analysis can explain the abnormal phenomenon of devices reacting to high concentration of H2S gas, as presented in Figure 6.

4. Conclusions

CuO nanoparticles were synthesized using a facile one-step hydrothermal method. Gas sensors fabricated by CuO nanoparticles exhibit a sensitive response, good selectivity, and fast recovery to H2S gas when applying a heating pulse at the best working temperature of 150 °C. Additionally, even at 40 °C, the sensing performance is still good enough for monitoring the application. The dynamic curves upon H2S exposure/release process display the synergistic effect of H2S oxidation mechanism and CuS formation mechanism to the total response. The inhibition effect of CuS formation on the device recovery process depends on the working temperature and gas concentration. The chemical conversion of CuO to CuS was observed from the XPS results of CuO nanoparticles during H2S sensing. The CuS bond decomposition by a thermal effect was verified by Raman analysis. The results provide a feasible guidance for a deeper understanding of the response mechanism of CuO materials to H2S gas.

Author Contributions

Conceptualization, F.P. and Y.S. Methodology, F.P., W.Y., and Y.L. Validation, Y.S. and N.D. Formal analysis, F.P., M.G., and J.S. Investigation, F.P. Resources, Y.S. and N.D. Data curation, F.P. Writing—original draft preparation, F.P. Writing—review and editing, Y.S. and N.D. Visualization, F.P. Supervision, Y.S. and N.D. Project administration, Y.S. and N.D. Funding acquisition, Y.S., R.C., J.H., and N.D. All authors have read and agreed to the published version of the manuscript.

Funding

The national Key R&D Program of China (2016YFA0202200), National Natural Science Foundation of China (Grant nos. 11574335, 11933006, 51772213, 21677095, 61705248), Shanghai Science and Technology Committee (17ZR1434900), and the Frontier Science Research Project (Key Programs) of Chinese Academy of Sciences (Grant nos. QYZDJ-SSW-SLH018) funded this research.

Conflicts of Interest

The authors declare no conflict of interest.

Appendix A

Figure A1. Real-time sensing curves of the CuO sensors to H2S gas (0.2, 1, 3, and 5 ppm, as labeled) at 40 °C.
Nanomaterials 10 00774 g0a1
Figure A2. Dynamic performances on time of CuO sensor toward 0.2, 1, 3, and 5 ppm H2S gas at (a) 40 °C, (b) 80 °C, (c) 150 °C, and (d) 250 °C.
Nanomaterials 10 00774 g0a2

References

  1. Zhu, M.L.; Zhang, L.J. A Novel H2S Gas Sensor Applied to the Construction Workers During the Construction Process. Sci. Adv. Mater. 2019, 11, 143–146. [Google Scholar] [CrossRef]
  2. Meng, F.N.; Di, X.P.; Dong, H.W.; Zhang, Y.; Zhu, C.L.; Li, C.Y.; Chen, Y.J. Ppb H2S gas sensing characteristics of Cu2O/CuO sub-microspheres at low-temperature. Sensor Actuat. B Chem. 2013, 182, 197–204. [Google Scholar] [CrossRef]
  3. Patil, G.E.; Kajale, D.D.; Gaikwad, V.B.; Jain, G.H. Effect of Thickness on Nanostructured SnO2 Thin Films by Spray Pyrolysis as Highly Sensitive H2S Gas Sensor. J. Nanosci. Nanotechnol. 2012, 12, 6192–6201. [Google Scholar] [CrossRef] [PubMed]
  4. Bai, S.L.; Chen, C.; Luo, R.X.; Chen, A.F.; Li, D.Q. Synthesis of MoO3/reduced graphene oxide hybrids and mechanism of enhancing H2S sensing performances. Sensor Actuat. B Chem. 2015, 216, 113–120. [Google Scholar] [CrossRef]
  5. Kim, J.; Yong, K. Mechanism Study of ZnO Nanorod-Bundle Sensors for H2S Gas Sensing. J. Phys. Chem. C 2011, 115, 7218–7224. [Google Scholar] [CrossRef]
  6. Li, Z.J.; Huang, Y.W.; Zhang, S.C.; Chen, W.M.; Kuang, Z.; Ao, D.Y.; Liu, W.; Fu, Y.Q. A fast response & recovery H2S gas sensor based on α-Fe2O3 nanoparticles with ppb level detection limit. J. Hazard. Mater. 2015, 300, 167–174. [Google Scholar]
  7. Poongodi, S.; Kumar, P.S.; Mangalaraj, D.; Ponpandian, N.; Meena, P.; Masuda, Y.; Lee, C. Electrodeposition of WO3 nanostructured thin films for electrochromic and H2S gas sensor applications. J. Alloy. Compd. 2017, 719, 71–81. [Google Scholar] [CrossRef]
  8. Hübner, M.; Simion, C.E.; Tomescu-Stanoiu, A.; Pokhrel, S.; Bârsan, N.; Weimar, U. Influence of humidity on CO sensing with p-type CuO thick film gas sensors. Sensor Actuat. B Chem. 2011, 153, 347–353. [Google Scholar] [CrossRef]
  9. Xu, Z.K.; Luo, Y.Y.; Duan, G.T. Self-Assembly of Cu2O Monolayer Colloidal Particle Film Allows the Fabrication of CuO Sensor with Super selectivity for Hydrogen Sulfide. ACS Appl. Mater. Interfaces 2019, 11, 8164–8174. [Google Scholar] [CrossRef]
  10. Kim, H.; Jin, C.; Park, S.; Kim, S.; Lee, C. H2S gas sensing properties of bare and Pd-functionalized CuO nanorods. Sensor Actuat. B Chem. 2012, 161, 594–599. [Google Scholar] [CrossRef]
  11. Yu, W.W.; Sun, Y.; Zhang, T.N.; Zhang, K.N.; Wang, S.X.; Chen, X.; Dai, N. CuO/WO3 Hybrid Nanocubes for High-Responsivity and Fast-Recovery H2S Sensors Operated at Low Temperature. Part. Part. Syst. Char. 2016, 33, 15–20. [Google Scholar] [CrossRef]
  12. Xue, X.; Xing, L.; Chem, Y.; Shi, S.; Wang, Y.; Wang, T. Synthesis and H2S Sensing Properties of CuO−SnO2 Core/Shell PN-Junction Nanorods. J. Phys. Chem. C 2008, 112, 12157–12160. [Google Scholar] [CrossRef]
  13. Morrison, S.R. Selectivity in semiconductor gas sensors. Sensor Actuator. 1987, 12, 425–440. [Google Scholar] [CrossRef]
  14. Pizzini, S.; Butta, N.; Narducci, D.; Palladino, M. Thick film ZnO resistive gas sensors: Analysis of their kinetic behavior. J. Electrochem. Soc. 1989, 136, 1945–1948. [Google Scholar] [CrossRef]
  15. Moseley, P.T. Materials selection for semiconductor gas sensors. Sensor Actuat. B Chem. 1992, 6, 149–156. [Google Scholar] [CrossRef]
  16. Mu, C.; He, J.H. Confined conversion of CuS nanowires to CuO nanotubes by annealing-induced diffusion in nanochannels. Nanoscale Res. Lett. 2011, 6, 150. [Google Scholar] [CrossRef] [Green Version]
  17. Wang, S.H.; Huang, Q.J.; Wen, X.G.; Li, X.Y.; Yang, S.H. Thermal oxidation of Cu2S nanowires: A template method for the fabrication of mesoscopic CuxO (x = 1,2) wires. Phys. Chem. Chem. Phys. 2002, 4, 3425–3429. [Google Scholar] [CrossRef]
  18. Nie, Y.X.; Deng, P.; Zhao, Y.Y.; Wang, P.L.; Xing, L.L.; Zhang, Y.; Xue, X.Y. The conversion of PN-junction influencing the piezoelectric output of a CuO/ZnO nanoarray nanogenerator and its application as a room-temperature self-powered active H2S sensor. Nanotechnology 2014, 25, 265501. [Google Scholar] [CrossRef] [PubMed]
  19. Kim, J.; Kim, W.; Yong, K. CuO/ZnO Heterostructured Nanorods: Photochemical Synthesis and the Mechanism of H2S Gas Sensing. J. Phys. Chem. C 2012, 116, 15682–15691. [Google Scholar] [CrossRef]
  20. Wang, L.W.; Kang, Y.F.; Wang, Y.; Zhu, B.L.; Zhang, S.M.; Huang, W.P.; Wang, S.R. CuO nanoparticle decorated ZnO nanorod sensor for low-temperature H2S detection. Mat. Sci. Eng. C 2012, 32, 2079–2085. [Google Scholar] [CrossRef]
  21. Ramgir, N.S.; Goyal, C.P.; Sharma, P.K.; Goutam, U.K.; Bhattacharya, S.; Datta, N.; Kaur, M.; Debnath, A.K.; Aswal, D.K.; Gupta, S.K. Selective H2S sensing characteristics of CuO modified WO3 thin films. Sensor Actuat. B Chem. 2013, 188, 525–532. [Google Scholar] [CrossRef]
  22. Hu, X.B.; Zhu, Z.G.; Chen, C.; Wen, T.Y.; Zhao, X.L.; Xie, L.L. Highly sensitive H2S gas sensors based on Pd-doped CuO nanoflowers with low operating temperature. Sensor Actuat. B Chem. 2017, 253, 809–817. [Google Scholar] [CrossRef]
  23. Kim, J.H.; Katoch, A.; Choi, S.W.; Kim, S.S. Growth and sensing properties of networked p-CuO nanowires. Sensor Actuat. B Chem. 2015, 212, 190–195. [Google Scholar] [CrossRef]
  24. Franke, M.E.; Koplin, T.J.; Simon, U. Metal and Metal Oxide Nanoparticles in Chemiresistors: Does the Nanoscale Matter? Small 2006, 2, 36–50. [Google Scholar] [CrossRef]
  25. Christy, A.J.; Nehru, L.C.; Umadevi, M. A novel combustion method to prepare CuO nanorods and its antimicrobial and photocatalytic activities. Powder Technol. 2013, 235, 783–786. [Google Scholar] [CrossRef]
  26. Ramgir, N.S.; Ganapathi, S.K.; Kaur, M.; Datta, N.; Muthe, K.P.; Aswal, D.K.; Gupta, S.K.; Yakhmi, J.V. Sub-ppm H2S sensing at room temperature using CuO thin films. Sensor Actuat. B Chem. 2010, 151, 90–96. [Google Scholar] [CrossRef]
  27. Guo, D.M.; Cai, P.J.; Sun, J.; He, W.N.; Wu, X.H.; Zhang, T.; Wang, X.; Zhang, X.T. Reduced-graphene-oxide/metal-oxide p-n heterojunction aerogels as efficient 3D sensing frameworks for phenol detection. Carbon 2016, 99, 571–578. [Google Scholar] [CrossRef]
  28. Yang, D.; Kang, K.; Kim, D.; Li, Z.Y.; Park, I. Fabrication of heterogeneous nanomaterial array by programmable heating and chemical supply within microfluidic platform towards multiplexed gas sensing application. Sci. Rep. 2015, 5, 8149. [Google Scholar] [CrossRef] [Green Version]
  29. Liao, L.; Zhang, Z.; Yan, B.; Zheng, Z.; Bao, Q.L.; Wu, T.; Li, C.M.; Shen, Z.X.; Zhang, J.X.; Gong, H. Multifunctional CuO nanowire devices: P-type field effect transistors and CO gas sensors. Nanotechnology 2009, 20, 085203. [Google Scholar] [CrossRef] [Green Version]
  30. Zhang, G.; Liu, M. Effect of particle size and dopant on properties of SnO2-based gas sensors. Sensor Actuat. B Chem. 2000, 69, 144–152. [Google Scholar] [CrossRef]
  31. Kumar, A.; Sanger, A.; Kumar, A.; Chandra, R. Highly sensitive and selective CO gas sensor based on a hydrophobic SnO2/CuO bilayer. RSC Adv. 2016, 6, 47178–47184. [Google Scholar] [CrossRef]
  32. Xie, Y.; Xing, R.; Li, Q.; Xu, L.; Song, H. Three-dimensional ordered ZnO–CuO inverse opals toward low concentration acetone detection for exhaled breath sensing. Sensor Actuat. B Chem. 2015, 211, 255–262. [Google Scholar] [CrossRef]
  33. Li, Z.Y.; Wang, X.G.; Lin, T. Highly sensitive SnO2 nanofiber chemiresistors with a low optimal operating temperature: Synergistic effect of Cu2+/Au co-doping. J. Mater. Chem. A 2014, 2, 13655–13660. [Google Scholar] [CrossRef]
  34. Yu, J.G.; Zhang, J.; Liu, S.W. Ion-Exchange Synthesis and Enhanced Visible-Light Photoactivity of CuS/ZnS Nanocomposite Hollow Spheres. J. Phys. Chem. C 2010, 114, 13642–13649. [Google Scholar] [CrossRef]
  35. Ghijsen, J.; Tjeng, L.H.; van Elp, J.; Eskes, H.; Westerink, J.; Sawatzky, G.A.; Czyzyk, M.T. Electronic structure of Cu2O and CuO. Phys. Rev. B 1988, 38, 11322–11330. [Google Scholar] [CrossRef]
  36. Zhang, Y.C.; Qiao, T.; Hu, X.Y. A simple hydrothermal route to nanocrystalline CuS. J. Cryst. Growth. 2004, 268, 64–70. [Google Scholar] [CrossRef]
  37. Dubale, A.A.; Tamirat, A.G.; Chen, H.M.; Berhe, T.A.; Pan, C.J.; Su, W.N.; Hwang, B.J. A highly stable CuS and CuS–Pt modified Cu2O/CuO heterostructure as an efficient photocathode for the hydrogen evolution reaction. J. Mater. Chem. A 2016, 4, 2205–2216. [Google Scholar] [CrossRef]
  38. Yua, T.; Zhao, X.; Shen, Z.X.; Wu, Y.H.; Su, W.H. Investigation of individual CuO nanorods by polarized micro-Raman scattering. J. Cryst. Growth 2004, 268, 590–595. [Google Scholar] [CrossRef]
  39. Chen, X.K.; Irwin, J.C.; Franck, J.P. Evidence for a strong spin-phonon interaction in cupric oxide. Phys. Rev. B 1995, 52, R13130. [Google Scholar] [CrossRef]
  40. Minceva-Sukarovaa, B.; Najdoskia, M.; Grozdanova, I.; Chunnilallb, C.J. Raman spectra of thin solid films of some metal sulfides. J. Mol. Struct. 1997, 410, 267–270. [Google Scholar] [CrossRef]
  41. Ishii, M.; Shibata, K.; Nozaki, H. Anion Distributions and Phase Transitions in CuS1-xSex(x = 0-1) Studied by Raman Spectroscopy. J. Solid. State. Chem. 1993, 105, 504–511. [Google Scholar] [CrossRef]
  42. McAleer, J.F.; Moseley, P.T.; Norris, J.O.W.; Williams, D.E. Tin dioxide gas sensors. Part 1.—Aspects of the surface chemistry revealed by electrical conductance variations. J. Chem. Soc. Faraday Trans. 1 1987, 83, 1323–1346. [Google Scholar] [CrossRef]
  43. McAleer, J.F.; Moseley, P.T.; Norris, J.O.W.; Williams, D.E.; Tofield, B.C. Tin dioxide gas sensors. Part 2.—The role of surface additives. J. Chem. Soc. Faraday Trans. 1 1988, 84, 441–457. [Google Scholar] [CrossRef]
  44. Guan, Y.; Wang, D.W.; Zhou, X.; Sun, P.; Wang, H.Y.; Ma, J.; Lu, G.Y. Hydrothermal preparation and gas sensing properties of Zn-doped SnO2 hierarchical architectures. Sensor Actuat. B Chem. 2014, 191, 45–52. [Google Scholar] [CrossRef]
  45. Datta, N.; Ramgir, N.S.; Kumar, S.; Veerender, P.; Kaur, M.; Kailasaganapathi, S.; Debnath, A.K.; Aswal, D.K.; Gupta, S.K. Role of various interfaces of CuO/ZnO random nanowire networks in H2S sensing: An impedance and Kelvin probe analysis. Sensor Actuat. B Chem. 2014, 202, 1270–1280. [Google Scholar] [CrossRef]
Figure 1. Schematic diagrams of (a) a sensor element and (b) testing circuit of the gas sensor.
Nanomaterials 10 00774 g001
Figure 2. (a) Transmission electron microscopy (TEM) image, (b) High power transmission electron microscopy (HRTEM) image, (c) Selected-area electron diffraction (SAED) pattern, and (d) Powder X-ray diffraction (XRD) pattern of CuO nanoparticles.
Nanomaterials 10 00774 g002
Figure 3. (a) The responses of CuO nanoparticles to 0.2, 1, 3, and 5 ppm H2S gas at different temperatures. (b) Response and recovery times of the sensor toward various H2S concentrations at 40 °C.
Nanomaterials 10 00774 g003
Figure 4. (a) Dynamic curves and (b) the responses of CuO nanoparticles to various gases at 150 °C.
Nanomaterials 10 00774 g004
Figure 5. Dynamic response of CuO nanoparticles to 3 ppm H2S gas at 150 °C.
Nanomaterials 10 00774 g005
Figure 6. Real-time curves and the responses of CuO nanoparticles to varying amounts of H2S gas at 150 °C.
Nanomaterials 10 00774 g006
Figure 7. Dynamic curves of the CuO sensor toward (a) 300 ppm CO at 80 °C and (b) 1 ppm H2S at 40 °C.
Nanomaterials 10 00774 g007
Figure 8. The k% values on different operating temperatures at various H2S concentrations.
Nanomaterials 10 00774 g008
Figure 9. (a) Cu 2p spectrum and (b) S 2p spectrum of CuO nanoparticles before and after H2S sensing.
Nanomaterials 10 00774 g009
Figure 10. Raman spectra of CuO nanoparticles’ sensor measured by 1 mW laser radiation (1) exposed to air, exposed to H2S gas after being irradiated by the laser with different energies (2) 1 mW, (3) 2 mW, (4) 3 mW, (5) 4 mW, (6) 6 mW, and (7) 8 mW.
Nanomaterials 10 00774 g010
Figure 11. Schematic diagrams of the CuO nanoparticles sensor (a) in air and exposed to (b) low concentration and (c) high concentration of H2S gas.
Nanomaterials 10 00774 g011
Table 1. A comparison of H2S gas sensing performances based on CuO-based nanostructures.
MaterialsConcentration
(ppm)
TemperatureResponseResponse Time (s)Recovery Time (s)Reference
Cu2O/CuO
Cu2O
0.1
0.1
95 °C
RT
2.5
1.7
76
100
75
/
[2]
[9]
CuO thin film5RT3.5>100>4000[26]
CuO nanoparticles540 °C4.9 ± 0.43297.5 ± 9.254 ± 7.1This work

