Abstract
The determination of reversible phase transitions in the perovskite-type thermoelectric oxide Eu0.8Ca0.2TiO3–δ is fundamental, since structural changes largely affect the thermal and electrical transport properties. The phase transitions were characterized by heat capacity measurements, Rietveld refinements, and pair distribution function (PDF) analysis of the diffraction data to achieve information on the phase transition temperatures and order as well as structural changes on the local level and the long range. On the long-range scale, Eu0.8Ca0.2TiO3–δ showed a phase transition sequence during heating from cubic at 100 < T < 592 K to tetragonal and finally back to cubic at T > 846 K. The phase transition at T = 592 K (diffraction)/606 K (thermal analysis) was reversible with a very small thermal hysteresis of about 2 K. The local structure at 100 K was composed of a complex nanodomain arrangement of Amm2- and Pbnm-like local structures with different coherence lengths. Since in Eu0.8Ca0.2TiO3–δ the amount of Pbnm domains was too small to percolate, the competition of ferroelectrically distorted octahedra (Amm2 as in BaTiO3) and rigid, tilted octahedra (Pbnm as in CaTiO3) resulted in a cubic long-range structure at low temperatures.
1. Introduction
Physical and transport properties of a bulk material are controlled by the electronic band structure and the microstructure. Since the former is highly correlated with the crystal structure and composition of a material, multitechnique investigations of structure–property relations are essential in materials science [1]. Of utmost importance in thermoelectric materials is the strong interrelation of crystal structure and the phonon transport, hence the heat conductivity [2,3,4]. This is of particular interest for the thermoelectric oxides Eu1–xCaxTiO3–δ, showing an unconventional heat conduction behavior at low temperatures [5]. The crystal structure analysis of Eu0.8Ca0.2TiO3–δ, in particular, revealed a significantly larger atomic displacement parameter (ADP) compared to other members of the solid solution Eu1–xCaxTiO3–δ [6]. In parallel, the measured thermal conductivity at T ≳ 30 K was much smaller compared to pristine EuTiO3–δ. This might be related to the different crystal structures at low temperature and requires further investigations by extended crystal structure analysis on different length scales [5]. Classically, for crystal structure refinements from a powdered sample, the Rietveld method is used considering only the information provided by the Bragg reflections, while everything else is treated as background [7,8,9]. Therefore, it provides information about the long-range structure including lattice symmetry and atom positions. A method to extract additional information collected in the diffraction pattern is the analysis of the pair distribution function (PDF) [10,11]. PDF analysis is based on the Fourier transform of the total diffracted intensity, e.g., Bragg reflections along with weak oscillations in the diffracted intensity at high Q-values caused by the arrangement of the atoms on local scale. This method has been applied to various perovskite-type oxide electroceramics to study their local structures [12,13,14,15,16,17,18,19,20,21,22,23,24,25]. We recently used it to analyze deviations between local and long-range structures of the thermoelectric materials Eu1–xBaxTiO3–δ [26] and Eu1–xCaxTiO3–δ [6] at low temperatures. In solid materials, increasing the system temperature past the critical temperature Tc, typically leads to a polymorph with higher symmetry [27,28]. Classical examples for this are the tetragonal (ferroelectric) to cubic (paraelectric) phase transition in BaTiO3 (Tc = 400 K) [29] and the phase transitions in ZrO2 from monoclinic (baddeleyite) via tetragonal to cubic (fluorite-type) [28].
In this publication, we have investigated the structural changes of Eu0.8Ca0.2TiO3–δ, which revealed long-range unexpected phase transitions upon temperature increase. The symmetry first decreased from cubic to tetragonal, then the expected cubic structure was observed again above 846 K. This behavior challenges the well-established phase transition sequence of both EuTiO3 and CaTiO3 and can be better understood by having a close look at the local structure by means of PDF analysis. Eu0.8Ca0.2TiO3–δ showed a complex noncubic arrangement on the local scale, being composed of different orthorhombic nanodomains forming, on average, a cubic pattern at low temperatures (T < 592 K).
2. Materials and Methods
Eu0.8Ca0.2TiO3–δ was prepared by a soft chemistry method starting from europium (III) oxide (99.9%, Alfa Aesar, Kandel, Germany), calcium nitrate tetrahydrate (>98%, Alfa Aesar, Kandel, Germany), citric acid (99%, Sigma Aldrich, Darmstadt, Germany), titanium (IV) bis (ammonium lactate) dihydroxide (50 wt% in H2O, Sigma Aldrich, Darmstadt, Germany), and ethylene glycol (>99%, Sigma Aldrich, Darmstadt, Germany). The dried black xerogel was calcined at 753 K for 6 h in air and crystallized at 1273 K for 12 h in reducing atmosphere (5 vol.% H2 in Ar, Westfalen AG, Münster, Germany). Further details of the synthesis can be found elsewhere [6].
The heat capacity of Eu0.8Ca0.2TiO3–δ was measured on a bulk sample on a Quantum Design PPMS system (PPMS, Quantum Design Inc., San Diego, CA, USA) equipped with the thermal transport kit option in the temperature range 2 ≤ T ≤ 350 K and on a Netzsch DSC404 F1 (Netzsch Gerätebau GmbH, Selb, Germany) under reducing conditions (5 vol.% H2 in Ar) in the temperature range 300 ≤ T ≤ 973 K using a heating rate of 5 K·min−1. Synchrotron diffraction data for long-range structure analysis by Rietveld refinements were collected on ID22 of the European Synchrotron Radiation Facility (ESRF), Grenoble, France. The powdered samples were loaded into 1.0 mm quartz glass capillaries and measured at a wavelength λ of 0.354388(9) Å. The Rietveld refinements were carried out with the FullProf.2k software package (5.30, 2012, Institut Laue-Langevin, Grenoble, France) [30] and using pseudo-Voigt functions to describe the profile. The instrument’s cryostat was used to collect data between 100 and 423 K, and a hot air blower (Cyberstar, Echirolles, France) was used in the temperature range 373 ≤ T ≤ 973 K. For PDF analysis, the same sample as above was measured on ID15A [31] of ESRF at a wavelength λ of 0.1240(3) Å, using a cryostat at 100 ≤ T ≤ 300 K and a hot air blower at 373 ≤ T ≤ 973 K. Please note that the recorded temperature, when using the hot air blower, was about 10% higher than the actual temperature. Two-dimensional diffraction images were azimuthally integrated using the Python libraries FabIO and pyFAI [32,33]. Integrated intensities were corrected for incident X-ray polarization, background, Compton and fluorescence scattering, and absorption before calculating the atomic PDF, indicated as GPDF(r) [34], with a maximum value of momentum transfer Qmax = 26 Å−1, by the program GudrunX [35]. Structural models were fitted to the PDF using the program PDFGui [36].
3. Results and Discussion
3.1. Heat Capacity Analysis
A small endothermal signal at T ≈ 290 K was observed in the heat capacity measurement by a physical properties measurement system (PPMS) for EuTiO3–δ and Eu0.8Ca0.2TiO3–δ (Figure 1). For EuTiO3–δ, this signal agreed well with literature reports on the tetragonal to cubic phase transition [37,38,39,40]. However, as shown by the diffraction data analysis in Section 3.2, the same explanation cannot be valid for Eu0.8Ca0.2TiO3–δ. The exact origin of the endothermal signal at T ≈ 290 K for Eu0.8Ca0.2TiO3–δ is still unclear. From the thermal analytical characterization of, e.g., polymers, several relaxation effects were described leading to similar shaped peaks in the DSC curve [41]. Therefore, a potential explanation might be seen in the relaxation of local strain fields resulting from the short-range coexistence of domains with different symmetry [42]. In addition, for EuTiO3–δ it is known that applying high pressure leads to twinning and reflection broadening [43]. The same can happen to Eu0.8Ca0.2TiO3–δ, due to the presence of chemical pressure [6] leading to a very similar compression of the unit cell, as observed at around 3 GPa for EuTiO3–δ where twinning was observed for a EuTiO3–δ single crystal [43].
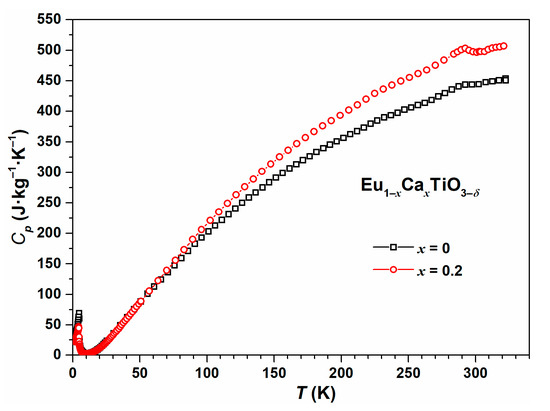
Figure 1.
Low-temperature heat capacity measurement of EuTiO3–δ (black) and Eu0.8Ca0.2TiO3–δ (red) using the physical properties measurement system (PPMS).
At lower temperatures, the heat capacity data from PPMS did not indicate any further phase transition of Eu0.8Ca0.2TiO3–δ, apart from the antiferromagnetic phase transition at very low temperature (TN = 4.4 K). For EuTiO3–δ, the antiferromagnetic phase transition was located at 4.7 K. The shift of the antiferromagnetic phase transition towards lower temperature upon partial Ca2+-substitution was expected based on the effect of chemical pressure [6].
Upon further heating using differential scanning calorimetry (DSC) in reducing atmosphere at a constant heating and cooling rate of 5 K·min−1, a reversible first-order phase transition with a small thermal hysteresis of only about 2 K was observed at 606 K (onset) (Figure 2). This is in clear contrast to the cubic long-range crystal structure observed below and required temperature-dependent diffraction experiments to clarify the origin of this phase transition.
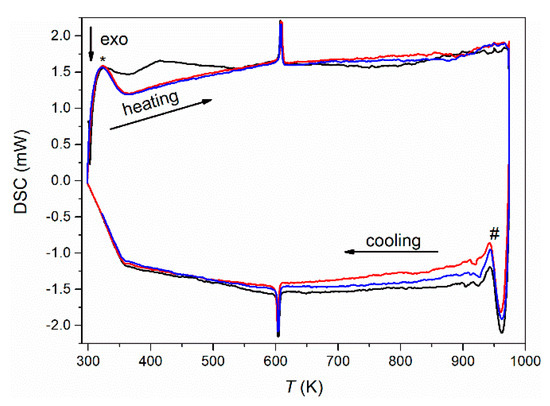
Figure 2.
Differential scanning calorimetry (DSC) measurements (first cycle: black; second cycle: red; third cycle: blue) of Eu0.8Ca0.2TiO3–δ in reducing atmosphere (5 vol% H2 in Ar) at a heating and cooling rate of 5 K·min−1. The * denotes artefacts from nonlinear heating, and # denotes artefacts by switching from heating to cooling.
3.2. Long-Range Crystal Structure Analysis
Rietveld refinements of the synchrotron diffraction data at 300 K revealed the single-phase nature of the Eu0.8Ca0.2TiO3–δ sample. A cubic structure model was able to describe the crystal structure (Figure 3a). Compared to pristine EuTiO3–δ [43], a smaller unit cell volume was observed for Eu0.8Ca0.2TiO3–δ, as expected in the presence of smaller Ca2+ [44].
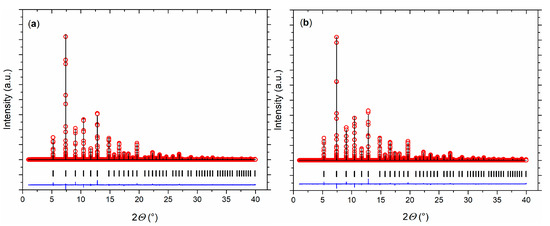
Figure 3.
Rietveld refinements of the crystal structure of Eu0.8Ca0.2TiO3–δ at (a) 300 K and (b) 100 K. Measured data (red open circles), calculated data (black line), and differential curve (blue line) are shown. The vertical ticks mark the position of the Bragg reflections.
While EuTiO3–δ showed a phase transition from cubic to tetragonal on cooling below 215 K [39], the cubic structure of Eu0.8Ca0.2TiO3–δ was maintained down to 100 K (Figure 3b, Table 1). Only a slight reflection broadening was visible in the low temperature range (FWHM (222) = 0.005934(3)° at 100 K, FWHM (222) = 0.005438(3)° at 973 K). This could suggest reflection splitting due to a lower symmetric space group, but it could not be resolved even with the current, very high resolution. The overall isotropic displacement parameter Biso showed a continuous increase with the rise in temperature from Biso = 0.18(1) Å2 at 100 K to Biso = 0.78(8) Å2 at 582 K (Figure 4a). Above 592 K, a transition to a tetragonal I4/mcm structure, characterized by a very small negative axial strain ((c − a)/(c + a) = −0.048% at 623 K, using the pseudocubic unit cell parameters) and an octahedral tilt angle ϕ of ~5.0(3)° was observed. The tetragonal structure showed a quick thermal expansion along c, so that only a small axial strain remained at higher temperatures ((c − a)/(c + a) = −0.013% at 723 K), as shown in Figure 4b. In parallel, a decreasing octahedral tilt angle was observed. The small difference in the transition temperature between diffraction and the DSC experiment can be understood by the larger heating rate in the latter case. Above 846 K, the crystal structure changed to cubic again. This second phase transition could not be clearly detected by the DSC measurements since it is a second-order phase transition, only involving the continuous lowering of the octahedral tilt of symmetry a0a0c− (using Glazer notation) [45], which is related to only a small change of the enthalpy and hence results in a weak, very broad signal, hardly detectable in DSC (Figure 2) [46]. A similar behavior can be also seen for the phase transition of EuTiO3–δ at T ≈ 290 K (Figure 1). The diffraction data confirmed the occurrence of a phase transition on heating to around 600 K, as already observed by the DSC, and the presence of a phase transition at higher temperature. However, the unusual thermal behavior required further structural analysis on the pseudocubic structure observed at low temperatures. In particular, the observation of a first order transition at 600 K, which does not require the saturation of an order parameter, points to a lower symmetry (e.g., orthorhombic) of the low temperature phase.

Table 1.
Results of Rietveld refinements of the crystal structure of Eu0.8Ca0.2TiO3–δ at 300 K and 100 K.
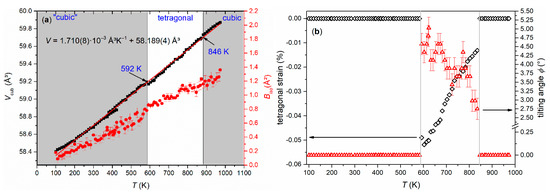
Figure 4.
(a) Temperature-dependent evolution of the cubic subcell volume V (black squares) of Eu0.8Ca0.2TiO3–δ together with the refined overall Biso values (red dots) and (b) tetragonal strain (black open diamonds) and octahedral tilt angle ϕ (red open triangles) as observed from Rietveld refinements.
3.3. Local Structure Analysis
A potential explanation of the observed phase transition sequence might be found on the local scale. To analyze the local structure at low temperature, first, a PDF analysis of the synchrotron diffraction data of Eu0.8Ca0.2TiO3–δ was carried out at 100 K (Figure 5). Apart from a reduction of the thermal broadening effects of the PDF data, analysis at 100 K offered the largest amplitude of distortion of the local perovskite structure. Initially, three distorted structure models with symmetries I4/mcm (as in EuTiO3–δ), Pbnm (as in CaTiO3), and Amm2 (as found in BaTiO3) were tested against the collected 100 K PDF data and compared with a cubic Pmm model as extracted for the long-range structure from Rietveld refinements. On local scale (r < 10 Å), the Pmm model did not accurately reproduce the G(r) function (Rw = 24.1%), as displayed in Figure 5a, whereas each of the distorted models accommodated to the local G(r) through octahedral tilting (I4/mcm), polar/antipolar cation shifts (Amm2), or both (Pbnm). Already in the range 10 ≤ r ≤ 20 Å, however, the cubic model captured almost all features of the G(r) function (Figure 5b). This implied the presence of nanodomains with lower symmetry (tetragonal or orthorhombic) and a coherence length of ~2 nm in Eu0.8Ca0.2TiO3–δ. Another observation was the fact that a close fit of the cubic model was conditional to a very high value of the isotropic O atomic displacement parameters, suggesting that the model overlooked a structural distortion of such type as active in the three lower-symmetric models tested.
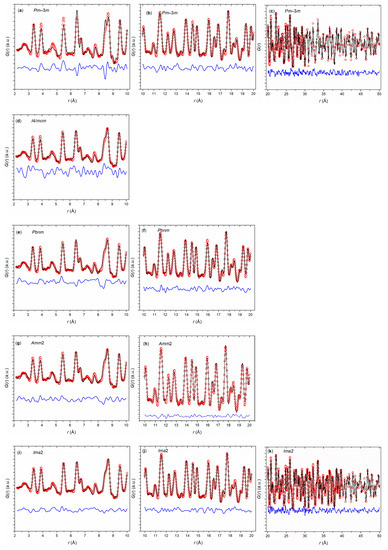
Figure 5.
G(r) functions of Eu0.8Ca0.2TiO3–δ using structural models with Pmm (a–c), I4/mcm (d), Pbnm (e–f), Amm2 (g–h), and Ima2 (i–k) symmetry.
In view of the closeness of the fits by the three distorted structures, a further model based on the Ima2 symmetry was adapted. In order to combine the distortions of the orthorhombic and tetragonal models initially tested, both shifts of Eu/Ca and Ti (along the pseudocubic (100) and (110), respectively) were allowed, along with octahedral tilting of the type a0a0c− (along the pseudocubic (001)), thus limiting the number of positional parameters to three, in addition to the orthorhombic cell parameters. This hybrid model improved the fit over the tetragonal and orthorhombic models on the local scale, (Figure 5i) as well as in successive ranges up to 50 Å (beyond which the limited instrumental resolution makes G(r) intensities unreliable; Figure 5j–k).
The fit of the 100 K data with the hybrid model revealed two main points. First, the low-temperature structure of Eu0.8Ca0.2TiO3–δ was locally distorted: (i) by a ~9° octahedral tilt; (ii) by Eu/Ca and Ti shifts of ca. 0.08 and 0.05 Å, respectively; and (iii) by a marked (~0.8% axial strain, averaged from (b − a)/(b + a) and (b − c)/(b + c)) cell elongation along the pseudocubic (100) accompanied by a smaller orthorhombic strain (~0.05%; (c − a)/(c + a)) between the other two pseudocubic axes. Second, the distortion had a limited coherence length, since with both cationic shifts, the orthorhombic strain vanished at 2–3 nm. On the mesoscopic scale, the structure retained the same octahedral tilting angle and a still sizeable axial strain (~0.3%).
The hybrid model was then tested against temperature-resolved PDF data in order to shed light on the local structure behavior across the unusual long-range phase transition. Direct observation of the temperature-dependent PDF showed no abrupt changes, leading to the conclusion that continuous, displacive changes take place throughout the 100–900 K temperature range. Fits of G(r) on the ranges 2.2 ≤ r ≤ 20 Å and 30 ≤ r ≤ 50 Å (Figure 6a,b) were carried out on these data. Clear trends emerged as a function of the temperature: (i) the cationic shifts on the local scale decreased continuously and vanished at about 450 K (Figure 6c); (ii) octahedral tilting was retained throughout the entire temperature range; (iii) axial strain decreased slightly but remained present even at the highest temperatures (Figure 6c), while the orthorhombic strain vanished around the tetragonal to cubic transition (T > 950 K; Figure 6b). Remarkably, the octahedral tilt angle was also retained on the 30–50 Å range and appeared to be temperature-independent. The orthorhombic strain, however, was markedly smaller and petered out around 450 K, together with the cationic shifts. These trends delineated a picture of local symmetry breaking with frustrated orders that evolve with temperature, which did not, however, lead to macroscopic phase changes.

Figure 6.
Pseudocubic unit cell parameters ac, bc, and cc of Eu0.8Ca0.2TiO3–δ extracted from temperature- dependent PDF analysis using Ima2 symmetry for different ranges 2 ≤ r ≤ 20 Å (a) and 20 ≤ r ≤ 50 Å (b) together with the determined orthorhombic strain (open stars). Determined shifts of the cations from the ideal position together with the axial strain based on the range 2 ≤ r ≤ 20 Å (c). The # marks deviations resulting from the change from cryostat to hot air blower.
Therefore, the cubic long-range structure of Eu0.8Ca0.2TiO3–δ at low temperatures can be taken as the signature of a frustrated order of different types of distortions with local symmetries consistent with I4/mcm, Pbnm, and Amm2. Since solid solutions with higher Ca2+ content x > 0.2 showed an orthorhombic Pbnm-type structure also on the long range [5], it seems that Eu0.8Ca0.2TiO3–δ is located below the percolation threshold for the Pbnm-like nanodomains.
4. Conclusions
The phase transition sequence in Eu0.8Ca0.2TiO3–δ observed on the long-range from cubic to tetragonal to cubic can be explained by the information obtained on its local structure. At temperatures below ~592 K, Eu0.8Ca0.2TiO3–δ is composed of two types of nanodomains, allowing for competition between Amm2-like ferroelectrical distortions of the TiO6 octahedra and Pbnm-like rotational distortions of rigid octahedra. If the number of Pbnm-like domains is small enough, as in Eu0.8Ca0.2TiO3–δ, the formation of a percolation network is no longer possible, and a long-range cubic structure is formed. Based on this, the phase transition sequence must be considered as normal starting from orthorhombic (pseudocubic on the long-range) to tetragonal and finally to cubic as the temperature increases. The observed local structure changes suggest a significant impact on the thermal transport properties of the thermoelectric oxide Eu0.8Ca0.2TiO3–δ, particularly at low temperatures.
The paper is written in memoriam of Dr. Claudio Ferrero.
Author Contributions
M.W. wrote the article with input from S.C., M.S., X.X., and A.W. X.X. prepared the material and did the thermal analysis. M.W. and M.S. collected and analyzed the Rietveld data. S.C. and M.S. collected and analyzed the PDF data. All authors have read and agreed to the published version of the manuscript.
Funding
The APC was covered by the Deutsche Forschungsgemeinschaft and Technical University of Darmstadt via the open access publication funds. The granted beam time and the financial support by ESRF during the experiment CH-5342 is highly acknowledged.
Acknowledgments
The support by Claudio Ferrero and Mauro Coduri (European Synchrotron Radiation Facility, Grenoble, France) and Tobias Kohler, Daniel Plaz, and Timo Mahnkopf during the collection of the synchrotron diffraction data is highly acknowledged. Songhak Yoon (Fraunhofer IWKS, Hanau, Germany) is thanked for the discussions on the diffraction data. The authors are grateful for the help of Konstantin Skokov (Technical University of Darmstadt, Department of Materials and Earth Sciences, Functional Materials, Darmstadt, Germany) collecting the low-temperature Cp data by PPMS.
Conflicts of Interest
The authors declare no conflict of interest.
References
- Weller, P. Solid State Chemistry and Physics; Marcel Dekker: New York, NY, USA, 1973; ISBN 0824717767. [Google Scholar]
- Yang, J.; Xi, L.; Qiu, W.; Wu, L.; Shi, X.; Chen, L.; Yang, J.; Zhang, W.; Uher, C.; Singh, D.J. On the tuning of electrical and thermal transport in thermoelectrics: An integrated theory–experiment perspective. NPJ Comput. Mater. 2016, 2, 15015. [Google Scholar] [CrossRef]
- Zhu, T.; Liu, Y.; Fu, C.; Heremans, J.P.; Snyder, J.G.; Zhao, X. Compromise and Synergy in High-Efficiency Thermoelectric Materials. Adv. Mater. 2017, 29, 1605884. [Google Scholar] [CrossRef] [PubMed]
- Toberer, E.S.; Baranowski, L.L.; Dames, C. Advances in Thermal Conductivity. Annu. Rev. Mater. Res. 2012, 42, 179–209. [Google Scholar] [CrossRef]
- Xiao, X. Thermoelectric Properties of Alkaline Earth Metal Substituted Europium Titanates; Technical University of Darmstadt: Darmstadt, Germany, 2020. [Google Scholar]
- Xiao, X.; Widenmeyer, M.; Mueller, K.; Scavini, M.; Checchia, S.; Castellano, C.; Ma, D.; Yoon, S.; Xie, W.; Starke, U.; et al. A squeeze on the perovskite structure improves the thermoelectric performance of Europium Calcium Titanates. Mater. Today Phys. 2018, 7, 96–105. [Google Scholar] [CrossRef]
- Rietveld, H.M. Line profiles of neutron powder-diffraction peaks for structure refinement. Acta Crystallogr. 2002, 22, 151–152. [Google Scholar] [CrossRef]
- Rietveld, H.M. A profile refinement method for nuclear and magnetic structures. J. Appl. Crystallogr. 2002, 2, 65–71. [Google Scholar] [CrossRef]
- Rodriguez-Carvajal, J. Recent advances in magnetic structure determination by neutron powder diffraction. Phys. B Condens. Matter 1993, 192, 55–59. [Google Scholar] [CrossRef]
- Billinge, S.J.L.; Kanatzidis, M.G. Beyond crystallography: The study of disorder, nanocrystallinity and crystallographically challenged materials with pair distribution functions. Chem. Commun. 2004, 7, 749–760. [Google Scholar] [CrossRef]
- Egami, T.; Billinge, S.J.L. Underneath the Bragg Peaks, 2nd ed.; Pergamon Press Ltd.: Oxford, UK, 2012; ISBN 9780080971339. [Google Scholar]
- Petkov, V.; Trikalitis, P.N.; Bozin, E.S.; Billinge, S.J.L.; Vogt, T.; Kanatzidis, M.G. Structure of V2O5·nH2O Xerogel Solved by the Atomic Pair Distribution Function Technique. J. Am. Chem. Soc. 2002, 124, 10157–10162. [Google Scholar] [CrossRef]
- Petkov, V.; Billinge, S.J.L.; Larson, P.; Mahanti, S.D.; Vogt, T.; Rangan, K.K.; Kanatzidis, M.G. Structure of nanocrystalline materials using atomic pair distribution function analysis: Study of LiMoS2. Phys. Rev. B 2002, 65, 92105. [Google Scholar] [CrossRef]
- Checchia, S.; Allieta, M.; Coduri, M.; Brunelli, M.; Scavini, M. Relaxor ferroeletric behavior in Sr1−xPrxTiO3. Phys. Rev. B 2016, 94, 104201. [Google Scholar] [CrossRef]
- Frandsen, B.A.; Brunelli, M.; Page, K.; Uemura, Y.J.; Staunton, J.B.; Billinge, S.J.L. Verification of Anderson Superexchange in MnO via Magnetic Pair Distribution Function Analysis and ab initio Theory. Phys. Rev. Lett. 2016, 116, 197204. [Google Scholar] [CrossRef] [PubMed]
- Bertolotti, F.; Protesescu, L.; Kovalenko, M.V.; Yakunin, S.; Cervellino, A.; Billinge, S.J.L.; Terban, M.W.; Pedersen, J.S.; Masciocchi, N.; Guagliardi, A. Coherent Nanotwins and Dynamic Disorder in Cesium Lead Halide Perovskite Nanocrystals. ACS Nano 2017, 11, 3819–3831. [Google Scholar] [CrossRef] [PubMed]
- Kong, S.; Kumar, N.; Checchia, S.; Cazorla, C.; Daniels, J. Defect-Driven Structural Distortions at the Surface of Relaxor Ferroelectrics. Adv. Funct. Mater. 2019, 29, 1900344. [Google Scholar] [CrossRef]
- Worhatch, R.J.; Kim, H.; Swainson, I.P.; Yonkeu, A.L.; Billinge, S.J.L. Study of Local Structure in Selected Organic–Inorganic Perovskites in the Pmm Phase. Chem. Mater. 2008, 20, 1272–1277. [Google Scholar] [CrossRef]
- James, A.R.; Kumar, R.; Premkumar, M.; Srinivas, K.; Radha, V.; Vithal, M.; Vijayakumar, M. Chemical synthesis, structural, thermo-physical and electrical property characterization of PLZT ceramics. J. Alloys Compd. 2010, 496, 624–627. [Google Scholar] [CrossRef]
- Ghasemifard, M.; Khorrami, G.H. The analysis of the atomic pair distribution function of PMN-based nanopowders by X-ray diffraction. Mod. Phys. Lett. B 2012, 26, 1250118. [Google Scholar] [CrossRef]
- Pourpoint, F.; Hua, X.; Middlemiss, D.S.; Adamson, P.; Wang, D.; Bruce, P.G.; Grey, C.P. New Insights into the Crystal and Electronic Structures of Li1+xV1−xO2 from Solid State NMR, Pair Distribution Function Analyses, and First Principles Calculations. Chem. Mater. 2012, 24, 2880–2893. [Google Scholar] [CrossRef]
- Farrow, C.L.; Bediako, D.K.; Surendranath, Y.; Nocera, D.G.; Billinge, S.J.L. Intermediate-Range Structure of Self-Assembled Cobalt-Based Oxygen-Evolving Catalyst. J. Am. Chem. Soc. 2013, 135, 6403–6406. [Google Scholar] [CrossRef]
- Rabuffetti, F.A.; Culver, S.P.; Lee, J.S.; Brutchey, R.L. Local structural investigation of Eu3+-doped BaTiO3 nanocrystals. Nanoscale 2014, 6, 2909–2914. [Google Scholar] [CrossRef]
- Szczecinski, R.J.; Chong, S.Y.; Chater, P.A.; Hughes, H.; Tucker, M.G.; Claridge, J.B.; Rosseinsky, M.J. Local Crystal Structure of Antiferroelectric Bi2Mn4/3Ni2/3O6 in Commensurate and Incommensurate Phases Described by Pair Distribution Function (PDF) and Reverse Monte Carlo (RMC) Modeling. Chem. Mater. 2014, 26, 2218–2232. [Google Scholar] [CrossRef] [PubMed]
- Huynh, M.; Shi, C.; Billinge, S.J.L.; Nocera, D.G. Nature of Activated Manganese Oxide for Oxygen Evolution. J. Am. Chem. Soc. 2015, 137, 14887–14904. [Google Scholar] [CrossRef] [PubMed]
- Xiao, X.; Widenmeyer, M.; Xie, W.; Zou, T.; Yoon, S.; Scavini, M.; Checchia, S.; Zhong, Z.; Hansmann, P.; Kilper, S.; et al. Tailoring the structure and thermoelectric properties of BaTiO3: Via Eu2+ substitution. Phys. Chem. Chem. Phys. 2017, 19, 13469–13480. [Google Scholar] [CrossRef] [PubMed]
- Massa, W. Kristallstrukturbestimmung, 7th ed.; Vieweg+Teubner Verlag: Wiesbaden, Germany, 2011; ISBN 978-3-8348-8211-0. [Google Scholar]
- Filatov, S.K. General concept of increasing crystal symmetry with an increase in temperature. Crystallogr. Rep. 2011, 56, 953–961. [Google Scholar] [CrossRef]
- Kanert, O.; Schulz, H.; Albers, J. Nuclear magnetic resonance study of the cubic-to-tetragonal phase transition in BaTiO3. Solid State Commun. 1994, 91, 465–469. [Google Scholar] [CrossRef]
- Rodriguez Carvajal, J. FullProf.2k, version 5.30; Institut Laue-Langevin: Grenoble, France, 2012. [Google Scholar]
- Vaughan, G.B.M.; Baker, R.; Barret, R.; Bonnefoy, J.; Buslaps, T.; Checchia, S.; Duran, D.; Fihman, F.; Got, P.; Kieffer, J.; et al. ID15A at the ESRF—A beamline for high speed operando X-ray diffraction, diffraction tomography and total scattering. J. Synchrotron Radiat. 2020, 27, 515–528. [Google Scholar] [CrossRef]
- Knudsen, E.B.; Sørensen, H.O.; Wright, J.P.; Goret, G.; Kieffer, J. FabIO: Easy access to two-dimensional X-ray detector images in Python. J. Appl. Crystallogr. 2013, 46, 537–539. [Google Scholar] [CrossRef]
- Ashiotis, G.; Deschildre, A.; Nawaz, Z.; Wright, J.P.; Karkoulis, D.; Picca, F.E.; Kieffer, J. The fast azimuthal integration Python library: pyFAI. J. Appl. Crystallogr. 2015, 48, 510–519. [Google Scholar] [CrossRef]
- Keen, D.A. A comparison of various commonly used correlation functions for describing total scattering. J. Appl. Crystallogr. 2001, 34, 172–177. [Google Scholar] [CrossRef]
- Soper, A.K. GudrunN and GudrunX: Programs for Correcting Raw Neutron and X-ray Diffraction Data to Differential Scattering Cross Section; Science & Technology Facilities Council: Swindon, UK, 2011; pp. 2011–2013. [Google Scholar]
- Farrow, C.L.; Juhas, P.; Liu, J.W.; Bryndin, D.; Božin, E.S.; Bloch, J.; Proffen, T.; Billinge, S.J.L. PDFfit2 and PDFgui: Computer programs for studying nanostructure in crystals. J. Phys. Condens. Matter 2007, 19, 335219. [Google Scholar] [CrossRef]
- Bussmann-Holder, A.; Köhler, J.; Kremer, R.K.; Law, J.M. Relation between structural instabilities in EuTiO3 and SrTiO. Phys. Rev. B 2011, 83, 212102. [Google Scholar] [CrossRef]
- Ellis, D.S.; Uchiyama, H.; Tsutsui, S.; Sugimoto, K.; Kato, K.; Ishikawa, D.; Baron, A.Q.R. Phonon softening and dispersion in EuTiO3. Phys. Rev. B 2012, 86, 220301. [Google Scholar] [CrossRef]
- Allieta, M.; Scavini, M.; Spalek, L.J.; Scagnoli, V.; Walker, H.C.; Panagopoulos, C.; Saxena, S.S.; Katsufuji, T.; Mazzoli, C. Role of intrinsic disorder in the structural phase transition of magnetoelectric EuTiO3. Phys. Rev. B Condens. Matter Mater. Phys. 2012, 85, 184107. [Google Scholar] [CrossRef]
- Goian, V.; Kamba, S.; Pacherová, O.; Drahokoupil, J.; Palatinus, L.; Dušek, M.; Rohlíček, J.; Savinov, M.; Laufek, F.; Schranz, W.; et al. Antiferrodistortive phase transition in EuTiO3. Phys. Rev. B 2012, 86, 54112. [Google Scholar] [CrossRef]
- Lamb, C. Relaxation Phenomena. In Structural Chemistry of Glasses; Elsevier: Amsterdam, The Netherlands, 2002; pp. 375–400. [Google Scholar]
- Bessas, D.; Rushchanskii, K.Z.; Kachlik, M.; Disch, S.; Gourdon, O.; Bednarcik, J.; Maca, K.; Sergueev, I.; Kamba, S.; Ležaić, M.; et al. Lattice instabilities in bulk EuTiO3. Phys. Rev. B 2013, 88, 144308. [Google Scholar] [CrossRef]
- Bessas, D.; Glazyrin, K.; Ellis, D.S.; Kantor, I.; Merkel, D.G.; Cerantola, V.; Potapkin, V.; van Smaalen, S.; Baron, A.Q.R.; Hermann, R.P. Pressure-mediated structural transitions in bulk EuTiO3. Phys. Rev. B 2018, 98, 54105. [Google Scholar] [CrossRef]
- Shannon, R.D. Revised effective ionic radii and systematic studies of interatomic distances in halides and chalcogenides. Acta Crystallogr. Sect. A 1976, 32, 751–767. [Google Scholar] [CrossRef]
- Glazer, A.M. The classification of tilted octahedra in perovskites. Acta Crystallogr. Sect. B Struct. Crystallogr. Cryst. Chem. 2002, 28, 3384–3392. [Google Scholar] [CrossRef]
- Höhne, G.W.H.; Hemminger, W.F.; Flammersheim, H.-J. Differential Scanning Calorimetry; Springer: Berlin/Heidelberg, Germany, 2003; ISBN 978-3-642-05593-5. [Google Scholar]
© 2020 by the authors. Licensee MDPI, Basel, Switzerland. This article is an open access article distributed under the terms and conditions of the Creative Commons Attribution (CC BY) license (http://creativecommons.org/licenses/by/4.0/).