Article

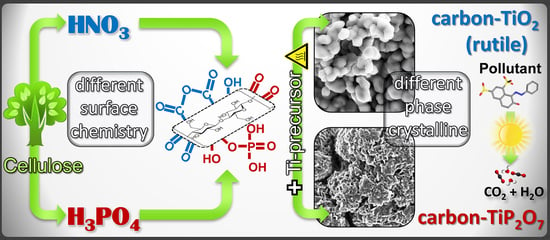
Functionalized Cellulose for the Controlled Synthesis of Novel Carbon–Ti Nanocomposites: Physicochemical and Photocatalytic Properties

by
Hesham Hamad
1,2,
Esther Bailón-García
1,
Sergio Morales-Torres
1,*,
Francisco Carrasco-Marín
1,
Agustín F. Pérez-Cadenas
1 and
Francisco J. Maldonado-Hódar
1
1
Carbon Materials Research Group, Department of Inorganic Chemistry, Faculty of Sciences, University of Granada, Avda, Fuente Nueva, s/n. ES18071 Granada, Spain
2
Fabrication Technology Department, Advanced Technology and New Materials Research Institute (ATNMRI), City of Scientific Research and Technology Applications (SRTA-City), New Borg El-Arab City 21934, Egypt
*
Author to whom correspondence should be addressed.
Nanomaterials 2020, 10(4), 729; https://doi.org/10.3390/nano10040729
Submission received: 21 March 2020 / Revised: 7 April 2020 / Accepted: 7 April 2020 / Published: 11 April 2020
(This article belongs to the Special Issue Carbon-Based Nanostructured Films)

Abstract

:
Carbon–Ti nanocomposites were prepared by a controlled two-step method using microcrystalline cellulose as a raw material. The synthesis procedure involves the solubilization of cellulose by an acid treatment (H3PO4 or HNO3) and the impregnation with the Ti precursor followed of a carbonization step at 500 or 800 °C. The type of acid treatment leads to a different functionalization of cellulose with phosphorus- or oxygen-containing surface groups, which are able to control the load, dispersion and crystalline phase of Ti during the composite preparation. Thus, phosphorus functionalities lead to amorphous carbon–Ti composites at 500 °C, while TiP2O7 crystals are formed when prepared at 800 °C. On the contrary, oxygenated groups induce the formation of TiO2 rutile at an unusually low temperature (500 °C), while an increase of carbonization temperature promotes a progressive crystal growth. The removal of Orange G (OG) azo dye in aqueous solution, as target pollutant, was used to determine the adsorptive and photocatalytic efficiencies, with all composites being more active than the benchmark TiO2 material (Degussa P25). Carbon–Ti nanocomposites with a developed micro-mesoporosity, reduced band gap and TiO2 rutile phase were the most active in the photodegradation of OG under ultraviolet irradiation.

Graphical Abstract

1. Introduction

The occurrence of organic contaminants at very low levels in different water sources, including drinking water, has emerged as a global concern. Azo dyes represent about 70% of the synthetic chemical dyes and possess a relatively stable chemical structure [1], composed by aromatic rings, which confer them with carcinogenic and mutagenic properties [2]. Thus, effluents containing this contaminant need to be treated by advanced oxidation processes (AOPs), because conventional treatments used in municipal wastewater treatment plants (MWWTPs) are not completely efficient for their removal. Heterogeneous photocatalysis has been demonstrated to be effective in the removal of pollutants from air [3] and water [4] in recent years. Most of studies are based on titanium dioxide (TiO2) because of its relatively low price and toxicity and its high stability and recyclability [5,6]. However, its practical application is severely compromised by the low quantum yield and the poor light-harvesting ability as consequence of its wide band gap (i.e., 3.2 or 3.0 eV for anatase or rutile phases, respectively) [7].
Different alternatives have been proposed to modify the band gap of TiO2, either with metals (Al, Gd, Zr, W, Ag) [8,9] or nonmetallic (S, N, P) dopants [10,11]. The recombination of photo-generated charges can be enhanced by reduction of the TiO2 particle size through the synthesis procedure [12]. One of the most interesting strategies is the development of TiO2 composites with carbon materials, due to favoring a better dispersion of TiO2 nanoparticles, reducing the TiO2 particle size, acting as photosensitizers and enhancing the light absorption and pollutant adsorption [13,14]. In this way, different types or carbon materials, from classical activated carbons [15], to nanocarbons, including xerogels, nanotubes, fullerenes or graphene derivatives, have been employed to develop efficient photocatalysts due to their excellent electronic, optical and porous properties [4,16,17].
On the other hand, suitable synthetic methods and cheap, recyclable and environmentally friendly precursors, like biopolymers, should be considered for the development of TiO2 composites [18,19,20]. In this context, cellulose is the cheapest and the most abundant renewable material obtained directly from biomass. However, most of studies deal with the immobilization of TiO2 particles on cellulose substrates, such as fabrics or fibers [21,22], and a few works were published about cellulose–TiO2 composites for water treatment [23,24,25,26,27]. Yet, to the best of our knowledge, the role of chemical functionalities of cellulose on the properties and photocatalytic performance of carbon–Ti composites has not been explored.
The aim of this work is to develop carbon–Ti composites looking for the synergism between phases using cheap, abundant and sustainable microcrystalline cellulose (MCC) raw material to increase the photo-response and adsorption capacity. The synthesis procedure, in particular the acid pretreatment of cellulose, the subsequent heteroatom-doping and the physicochemical transformations during carbonization, was optimized for the sake of improving the carbon–Ti interactions. Carbon–Ti composites were obtained by a two-step method using MCC as a carbon precursor and structure-directing agent. The synthesis procedure involves the previous MCC solution by an acid treatment with H3PO4 or HNO3 and the impregnation with the Ti precursor followed by a thermal treatment. Results showed that during the acid treatment, the cellulose chains are functionalized with phosphorus- or oxygen-containing surface groups, which are able to control the Ti loading and dispersion during impregnation and stabilize different Ti phases and structures during carbonization. The adsorptive and photocatalytic behaviors of the materials for the removal of Orange G (OG) in aqueous solution were studied and correlated with the chemical, physical and crystalline transformations achieved for each composite depending on the acid pretreatment and carbonization temperature.

2. Materials and Methods

2.1. Chemicals

Microcrystalline cellulose (MCC) and titanium (IV) isopropoxide (TTIP) were purchased from Merck (Darmstadt, Germany), while o-phosphoric acid (85% w/w), nitric acid (70% w/w) and heptane were acquired from VWR chemicals (Leuven, Belgium). Orange G (OG, C16H10N2Na2O7S2), also known as Acid Orange 10, was obtained from Acros Organics (Geel, Belgium).

2.2. Synthesis of Carbon–Ti Composites

An aqueous suspension of MCC (200 g·L−1) was prepared and stirred for 15 min at 50 °C, and then 10 mL of concentrated acid, i.e., 15.6 M HNO3 or 14.8 M H3PO4, was added dropwise and left overnight. The Ti impregnation of the MCC solution was carried out by dropping a heptane solution of TTIP (cellulose–TiO2 mass ratio = 1:6). The suspension formed was aged at 60 °C for 24 h, and then the solid was filtered, washed with DI water and acetone, dried at 120 °C in an oven and finally carbonized in a tubular furnace at 500 or 800 °C in N2 flow (100 cm3·min−1). The carbon–Ti composites were labeled as CXTiY, where “X” corresponds to the acid used, i.e., “P” or “N” for H3PO4 or HNO3, respectively, “Ti” indicates the presence of Ti phase and “Y” the carbonization temperature, i.e., “1” or “2” for 500 or 800 °C, respectively. For instance, the CNTi2 sample is a carbon–Ti composite prepared with cellulose treated with HNO3 and carbonized at 800 °C. Additionally, pure carbon materials, i.e., CN1, CN2, CP1 and CP2 samples, were also prepared as reference following a similar procedure but not adding any amount of Ti precursor.

2.3. Characterization Techniques

The morphology of materials was analyzed by scanning (AURIGA (FIB-FESEM) microscope, Carl Zeiss SMT, Oberkochen, Germany) and transmission electron microscope (HAADF FEI TITAN G2, Oberkochen, Germany). Textural characterization was carried out by physical adsorption of N2 at −196 °C using a Quantachrome Autosorb-1 equipment. The BET method and the Dubinin–Radushkevich equation were applied to determine the apparent surface area (SBET) and the micropore volume (W0), respectively. The microporous surface (Smicro) and the mean micropore width (L0) were estimated from the Stoeckli equation [28,29], while the mesopore volume (Vmeso) was calculated by applying the BJH method [30]. Prior to the N2 adsorption measurements, the samples were outgassed overnight under a dynamic vacuum of 10−6 mbar at 120 °C.
The carbonization step and TiO2 content of composites was determined by thermogravimetric (TG) analysis under N2 or air flow at 5 °C·min−1 using a Mettler-Toledo TGA/DSC1 thermal balance (Mettler-Toledo International Inc., Greifensee, Switzerland). The crystallographic phase of materials was determined by X-ray diffraction (XRD) using a Bruker D8 Advance X-ray diffractometer (Cu Kα radiation, λ = 1.541 Å, BRUKER, Rivas-Vaciamadrid, Spain). X-ray photoelectron spectroscopy (XPS) spectra of C1s, O1s, N1s, P2p and Ti2p regions were obtained on a Kratos Axis Ultra-DLD X-ray photoelectron spectrometer (Kratos Analytical Ltd., Kyoto, Japan), and ultraviolet–visible (UV/Vis) diffuse reflectance spectra (DRUV) were obtained using a double-beam UV/Vis spectrophotometer (CARY 5E from VARIAN, Markham, Canada) [31]. The pHPZC values were determined following a previously published methodology [17] and correspond to the equilibrium pH for 100 mg of the material dispersed in 5 mL of water (at 25 °C).

2.4. Photocatalytic Tests

The adsorption and photocatalytic behaviours of carbon–Ti composites were evaluated for the degradation of 10 mg·L−1 (2.21 × 10⁻⁵ mol·L−1) OG at room temperature under UV irradiation. The batch experiments were carried out using a glass cylindrical reactor with 800 mL of OG solution, using a load catalyst of 1.0 g·L−1 and a low-pressure mercury vapor lamp (TNN 15/32, 15 W, λ = 254 nm, HNG-Germany). Samples at different reaction times were withdrawn and centrifugated to separate the catalyst particles before analysis. Prior to photocatalytic tests, all materials were saturated with the OG solution in dark to remove the adsorptive contribution from the evolution of the total OG concentration. After dark phase, the initial OG concentration (C0) was adjusted again to 10 mg·L−1, and then a UV lamp was turned on, this time being considered t = 0. The concentration of OG was monitored by a UV/Vis spectrophotometer (5625 Unicam Ltd., Cambridge, UK).

3. Results and Discussion

3.1. Materials Characterization

Carbon–Ti composites were prepared after carbonization of cellulose samples impregnated with the Ti precursor. A MCC solution was first prepared by an acid treatment (i.e., HNO3 or H3PO4) to facilitate the impregnation and dispersion of the Ti phase. The carbonization processes of raw MCC (commercial) and acid-treated celluloses (CN and CP) were simulated by TG analysis under N2 flow and used as reference processes, pointing out the strong changes on the thermal stability of cellulose after HNO3 or H3PO4 pretreatments. The thermal decomposition of the raw cellulose (MCC) occurs in a single step at around 340 °C (Figure 1a), in agreement with that previously reported [32] and indicating the absence of both hemicellulose and lignin. The theoretical total carbon content is 44 wt. %, taking into account the chemical composition of cellulose (C6H10O5)n. However, the yield of carbon residue after pyrolysis is significantly lower (around 17 wt. %) because the depolymerization of the cellulose molecular structure takes place during heating and evolves carbon oxides (CO and CO2) from intermediate aldehydes and carboxylic acids, consequently decreasing the yield of carbon residues [33].
The thermal decomposition of acid-treated cellulose presents significant differences regarding the original MCC. After the HNO3 treatment, the CN sample decomposes mainly in one step, like MCC, but at a lower temperature (Figure 1a). This lower thermal stability is associated with the incorporation of new oxygen chemical functionalities, in particular carboxylic acid groups. Dehydration processes of adjacent carboxylic acid groups and/or the decomposition of these groups into CO2 occurs at temperatures below 300 °C [34]. Nevertheless, after this main decomposition step, a slow and continuous weight loss also occurs with increasing temperature, indicating the decomposition of additional oxygenated surface groups that typically evolve as CO (phenol, carbonyl or quinone) [34]. After the H3PO4 treatment, carbonization takes place clearly in two steps placed at around 200 and 700 °C. The first decomposition step may be also due to dehydration and decomposition of derivative groups of carboxylic acids and anhydrides, but the decomposition temperature range (from around 150 to 500 °C) is narrower in CP than in MCC or CN samples, indicating a more heterogeneous distribution of surface groups. The second carbonization step is associated with the reduction of phosphate groups by the organic cellulose, which increases the cellulose gasification in this temperature range. Chemical activation of H3PO4-impregnated lignocellulosic materials [35,36] is a classical method for the preparation of activated carbons, with the activation temperature depending on the nature of the raw biopolymer [37]. In the case of the CP sample, the weight loss associated with the activation process occurs at 700 °C, while, as an example, coconut activation has been reported between 400–450 °C [35]
Acid-treated cellulose samples showed an obvious yield of solid residue that was markedly greater after their impregnation with the Ti precursor (Figure 1a). The significant change in the TG profiles of carbon–Ti composites (CNTi and CPTi) regarding their corresponding supports (CN and CP) is noteworthy, denoting the formation of new bonds between the cellulose supports and the Ti precursor. At low temperature (below 200 °C), the weight loss in the CNTi sample even increases regarding CN by decomposition of organic precursors, but after that the slope of the curve strongly decreases; there is not a significant weight loss from around 600 °C, showing the thermal stabilization of the cellulose oxygenated surface groups by interaction with the Ti phases. The cellulose–Ti interactions are also observed for the CPTi sample. In this case, the first decomposition step remains more or less unchanged, but the second decomposition step is not observed, therefore indicating that the phosphate groups are not reduced by the organic cellulose phase during the thermal treatments and thus are also clearly stabilized by reactions with the Ti phase.
The inorganic content in the composites was also determined by TG, in this case by burning a small portion of each sample in air flow. Although both samples were prepared using a constant cellulose:TiO2 ratio of 1:6 by weight, the residue percentage was 63 and 74 wt. % for CNTi and CPTi, respectively. Thus, the highest residue content determined for CPTi is favored by the presence of phosphorus functionalities. The surface chemical nature and composition of Ti-impregnated cellulose and its carbon derivatives were analyzed by measurements of pHPZC and XPS (Table 1). The influence of acid treatments on pHPZC of the carbon–Ti composites is noteworthy, as CPTi samples are strongly acidic materials, while the surface chemistry for CNTi samples is close to neutrality. The highest oxygen content detected on the surface of the CPTi sample regarding the CNTi sample, together with the high phosphorus content, suggests the presence of phosphate groups. However, the Ti content of CPTi is lower than in CNTi despite the highest solid residue detected by TG, therefore indicating a different Ti distribution in the surface than in the sample bulk. During carbonization, CPTi composites undergo stronger changes than CNTi samples, increasing the carbon content and decreasing the oxygen and Ti contents (Table 1). The low N content detected in CNTi (Table 1) was removed after carbonization (CNTi2) and should not influence its catalytic performance.
The XPS results also show the interactions between the chemical groups of cellulose and the Ti phase, as well the transformations performed during carbonization. The XPS spectra of C1s, O1s and Ti2p regions for the Ti-impregnated samples before (CPTi and CNTi) and after carbonization at different temperatures (CPTi1, CPTi2 and CNTi2) are collected in Figure 2. In general, the deconvolution of the C1s region shows a main contribution at 284.6 eV associated to C–C bonds and other smaller peaks at higher binding energies (BE) due to the occurrence of oxygenated surface groups, i.e., C–O, C=O or carboxyl groups (Figure 2a,d) [36,38]. These small components are more significative in cellulose treated with HNO3 (CNTi) than in CPTi. After carbonization, the peaks due to oxygen-containing groups are maintained in CPTi1 and CPTi2 samples, while a strong decrease is observed for CNTi2 because of the weak thermal stability of carboxylic acid groups introduced by HNO3 compared to the phosphate groups detected for CPTi samples.
The O1s spectrum was deconvoluted in two components located at ~531.5 and ~533.1 eV, corresponding to double-bonded oxygen (e.g., carbonyl and carboxyl groups) and single-bonded oxygen (e.g., alcohol groups), respectively (Figure 2b,e) [39]. Moreover, Ti–O and Ti–OH bonds should contribute to both first and second peaks, respectively [40]. All these contributions also decrease after carbonization, mainly for the case of CNTi2, as observed for the C1s spectrum. The analysis of the P2p spectrum also allows to point out the interaction of Ti phases with the phosphorus-containing groups incorporated during the cellulose treatment. The P2p region can be deconvoluted in only a peak at ~133.4 eV for CPTi, while a second peak is found at ~134.7 eV after carbonization (Figure S1 of the Supplementary Materials). In general, the peaks placed at ca. 134 eV and 135 eV are usually due to phosphorus linked to carbon (C–PO3) and to pentavalent tetracoordinated phosphorus in phosphates or polyphosphates (C–O–PO3), respectively [41]. Therefore, H3PO4 treatments incorporate oxygen- and phosphorus-containing functionalities, while only oxygenated groups are detected for samples treated by HNO3.
Regarding the Ti2p region (Figure 2c,f), only a peak at 459.4 eV corresponding to Ti4+ is detected on the Ti-impregnated samples (CNTi and CPTi) and on the carbonized composites at low temperature (e.g., CPTi1). However, the spectra of both CNTi2 and CPTi2 are wider and shifted to lower BE values, showing the presence of a mixture of Ti4+ and Ti3+ and denoting the influence of the carbonization temperature on the nature of the Ti phase. Despite the certain reduction observed, the difference in BE between Ti 2p3/2 and Ti 2p1/2 components is always maintained at 5.7 eV, in agreement with TiO2 results previously reported [42].
The analysis of the XRD patterns also pointed out the different transformations of the samples as a function of the carbonization temperature in the composites (Figure 3) and, consequently, the different metal–support interactions. Thus, the absence of XRD peaks is observed for CPTi carbonized at 500 °C (CPTi1), while XRD patterns denoting a total transformation to the rutile phase can be detected in the case of CNTi1. In previous works [43,44], the carbon phase was reported to prevent both the sintering and phase transformation of the inorganic oxides in carbon/oxide composites, including TiO2, SiO2 or Al2O3/C. In this case, the phosphate groups on the cellulose support should avoid the crystal growth during carbonization at low temperatures. However, the formation of rutile at 500 °C observed for CNTi1 was not expected, taking into account that the transformation of the anatase phase to rutile normally occurs at 750 °C, although it can be induced at lower temperatures in some cases, such as by doping with metals like V5+ [45]. By increasing the carbonization temperature up to 800 °C, an increase of the rutile crystallinity is observed in CNTi2 compared to CNT1, as denoted by the narrower and more intense diffraction peaks. Therefore, XRD patterns for CNTi1 and CNTi2 samples clearly showed the presence of only rutile (JCPDS Card No. 21-1276) peaks placed at 2θ values of ~27°, ~36°, ~41°, ~44°, ~54°, ~56° and ~61°, which correspond to crystal planes of (110), (101), (200), (111), (210), (211), (220), (002) and (310) [46]. At this carbonization temperature, the CPTi2 XRD pattern showed the formation of a crystalline phase that does not correspond to any TiO2 phase, but it was indexed as cubic TiP2O7 with the space group Pa3 and 3 × 3 × 3 superstructure (JCPDS No. 38-1468) [47,48]. The formation of TiP2O7 nanocrystals is only obtained at temperatures higher than 1000 °C [49]; thereby, it should be favored by the phosphorus surface groups on the functionalized cellulose. These results are also in agreement with the TG and XPS results, which suggested the stabilization of the phosphate groups by interaction (reaction) with the Ti species with increasing temperature. In summary, the functionalities incorporated during cellulose solubilization determine the Ti phase formed in the corresponding composites. The oxygenated surface groups, namely carboxylic acid species, generated on the cellulose chains by HNO3 treatments induce the formation of rutile at low temperature, while the phosphorus groups generated by H3PO4 treatments avoid the formation of crystalline Ti phases when treated at low temperatures and the formation of TiP2O7 nanocrystals with increasing this parameter, but the reaction occurs at lower temperatures than those typically reported.
The chemical and crystalline transformations previously indicated are simultaneously accompanied by a marked change in the morphology of the samples, mainly for the CPTi carbonized derivatives. Thus, the CPTi sample carbonized at low temperature (500 °C) presents an opened structure composed of grouping sheets leading to a solid with flaky aspect (Figure 4a). When the composite is carbonized at 800 °C (CPTi2, Figure 4b), the structure becomes more compact, showing a granular aspect that corresponds to the formation of the TiP2O7 crystalline phase, according to XRD results. The morphology of CNTi1 is formed by round-shaped particles overlapping and forming an opened structure (Figure 4c). These particles should correspond to rutile crystals identified by XRD (Figure 3). The composite carbonized at 800 °C (CNTi2) also presents a denser surface than CNTi1 by sintering, and the crystallites now show sharp edges on clearly cubic structures due to the mentioned crystal growth (Figure 4d).
The energy dispersive X-ray (EDX) spectrum corroborates the presence of C–O–P–Ti in the CPTi composite (Figure 5a). High resolution transmission electron microscopy (HRTEM) micrographs of CPTi1 (Figure 5b) shows the formation of ultrathin carbon layers, in which a homogeneous distribution of Ti is deposited throughout the composite, as confirmed by mapping (Figure 5c). After carbonization at 800 °C, the formation of needle-shaped structures, more or less aggregated, are also observed, together with the large carbon flakes previously described (Figure 5d,e). These flat and transparent carbon structures were also previously observed after sulfuric acid hydrolysis and carbonization of Eucalyptus kraft pulp [50]. Filaments, aggregates of films, can be developed depending on the thermal treatments of cellulose nanocrystals, although the mechanism of formation of these nanostructures is still unclear. It seems to be related with the H-bonding interactions in each media and the transformations during carbonization.
The different morphologies observed for the carbon–Ti composites influence their porosity, which was analyzed by N2 adsorption–desorption isotherms (Figure 6). The shape of the isotherms already points out the different porosity of the samples. When comparing the isotherms of pure carbon samples (Figure 6a) and their corresponding composites (Figure 6b), a different porous texture due to the interactions and transformations between phases is clearly visible. Thus, the porosity of the CP sample carbonized at 500 °C (i.e., CP1) is quite poor (i.e., SBET = 17 m2·g−1), while CP2, carbonized at 800 °C, presents a high surface area (i.e., SBET = 552 m2·g−1), associated to the microporosity developed during the activation processes by the reduction of the phosphate groups at ~700 °C, as previously observed by TG. In fact, CP2 is mainly microporous, as denoted by its type-I adsorption isotherm (Figure 6a). On contrary, the CN1 sample, pretreated in nitric acid and carbonized at low temperature, showed a higher porosity than CP1 (i.e., SBET = 226 vs. 17 m2·g−1, respectively), due to the evolution of low-stability oxygenated surface groups. However, the porosity and surface area of CN samples decrease after increasing carbonization temperature with a progressive micropore widening (L0, Table 1). CN1 and CN2 samples showed type-II adsorption isotherms.
After Ti precursor impregnation, both CNTi1 and CNTi2 showed type-IV adsorption isotherms characteristic of micro-mesoporous materials, while mainly type-II isotherms were obtained for both CPTi1 and CPTi2. These samples showed a similar microporosity (W0, Table 2) and surface area (Smicro, Table 2), in contrast to the previous nonimpregnated samples (e.g., CP1 and CP2), which corroborates that the interaction of the carbon with the Ti phase avoids the reduction of the phosphate groups. Nevertheless, a certain delay in the desorption branch of both CPTi1 and CPTi2 samples also denotes a hysteresis cycle associated to N2 condensation. In all composites, the shape of the isotherm is maintained while increasing the carbonization temperature, but the total porosity and BET surface areas increase (Table 2). These increases are due to a larger weight loss and, on the other hand, to the progressive sintering and crystal growth of the Ti phase (Figure 4 and Figure 5) leading to narrow pores where N2 condensates during the porosity filling. CNTi derivative samples mainly present a developed micropore structure that strongly favors high surface area values compared to those for the CPTi ones. In addition, CNTi2 presented the largest development of porosity, with sintering favoring the formation of mesopores (Vmeso, Table 2) from macropores or interparticle voids present in the sample obtained at lower carbonization temperature. Porosity, namely mesoporosity (Vmeso), is favored in the carbon–Ti composites in regard to their pure carbon materials, an evolution directly related to the transformations of the Ti phase being established.
The optical properties of the carbon–Ti composites were analyzed using UV/Vis diffuse reflectance (DRUV) spectroscopy. All reflectance spectra (Figure 7a) recorded were converted to equivalent absorption Kubelka–Munk (K-M) units (Figure 7b) and the band gap (Eg) was determined from the plots of (F(R) × hν)n vs. E by extrapolating the slope to a = 0 according to the procedure previously reported [4,51,52]. The band gap for all composites synthesized from cellulose decreased in regard to the value determined for P25, which was used as reference material (Figure 7b). CNTi samples, with rutile as active phase, presented Eg values at ~2.4 eV regardless of the carbonization temperature; this value of band gap was significantly lower than 3.0 eV, corresponding to the pure rutile phase. Analogously, the strong influence of the carbonization temperature on the crystalline and morphological properties previously discussed for CPTi composites does not produce a significant change in the profile of their corresponding spectra; consequently, similar band gap values, at ~3.0 eV, are obtained (Figure 7b) for CPTi1 and CPTi2. However, these values are also significantly smaller than the band gap of 3.5 eV reported in the bibliography for the TiP2O7 phase [52]. Thus, a clear influence of the functionalized cellulose on the semiconductor properties of both series of composites is evidenced. On the other hand, the carbonization temperature did not markedly influence the band gap values of the carbon–Ti composites, despite presenting different physicochemical properties. Different effects can contribute to the similar band gap values observed. For instance, with increasing carbonization temperature, the formation of Ti3+ species were pointed out by XPS, which can contribute to the bad gap narrowing. However, this also progressively increases the crystal size of the composites, which evidently favors the electron–hole recombination. Otherwise, the low band gaps determined for all composites should significantly improve their photocatalytic efficiency compared to the pure TiO2 materials, such as P25.

3.2. Removal of Orange G (OG) Azo Dye

The adsorptive and photocatalytic performance of the carbon–Ti composites was analyzed for the removal of OG, a textile dye typically present in industrial wastewater and used as target molecule, following the procedure described in our previous works with other semiconductors [4,53]. Firstly, all samples were saturated for 4 h using a concentrated OG solution in dark experiments, which allows to analyze the interactions of pollutants with the sample surface but also avoids the contribution of the adsorption process on the OG removal during the subsequent photocatalytic degradation experiment. The initial adsorption kinetic curves for pure carbon materials and the corresponding composites are shown in Figure 8a,b, respectively.
The analysis of OG-adsorptive performance of the pure carbon materials allowed a direct relationship between the OG removal and the micropore volume (W0, Table 2) of the samples to be established. The high micropore development in CP2 allows the complete removal of OG in solution in only 25 min, while CP1 (with the lowest W0) leads to the worst adsorptive behavior (Figure 8a). In the case of CN materials, the OG-adsorption capacity decreases as carbonization temperature increases due to a micropore destruction, probably by widening (Table 2). For the case of composites, CPTi2 also showed a better performance than CPTi1, although the microporosity of both samples is quite similar (Figure 8b). The increased microporosity with the carbonization temperature explains the better OG-adsorptive performance of CNTi2 compared to CNTi1 (Figure 8b). In these composites, the mesoporosity also increased with the carbonization temperature, which can favor the accessibility and adsorptive performance of the samples. The fast adsorption processes of the CPTi2 composite could be favored by chemical interactions of the carbon surface with the dye in solution. The beneficial effect on the dye adsorption of phosphate doping in Ti structures was previously reported [29,54] as due to the modification of the electrostatic interactions. Nevertheless, the best final performance of CNTi samples confirms the importance of a developed porosity in the interactions with the pollutant.
Once the carbon–Ti composites were saturated with the OG solution, the photocatalytic performance of the composites was studied (Figure 8c), with the best efficiency being observed for the CNTi1 sample. In the CNTi composite series, the catalytic activity decreases with increasing carbonization temperature, despite the higher porosity and similar band gap values of CNTi2. A similar influence of the carbonization temperature on the catalytic activity can be described for CPTi1 and CPTi2 composites. However, all carbon–Ti composites present a better performance than the reference TiO2 photocatalyst (P25), reaching total OG removal in 40–60 min. The activity order follows the sequence CNTi > CPTi > P25, in agreement with the evolution of the band gap values. This fact should be associated with the increasing crystallinity of the rutile or TiP2O7 phases and confirms the importance of the particle size in the interaction with the support and the electron–hole recombination processes. The reaction pathway for the photodegradation of the azo-dye acid Orange 7 in TiO2 suspensions was studied by Stylidi et al. [55], reporting that the mineralization to CO2 occurs with the formation of aromatic and aliphatic acids as intermediates. In previous works [4,53], we have pointed out that the photocatalytic experiments carried out using C–Ti or C–Zr composites produce the mineralization of the dye to CO2. In the current work, a similar behavior was observed; no intermediates were expected in solution after reaction, because the TOC analysis of the samples decreased in accordance with the OG removal. However, the study of the reaction mechanism should be better investigated in future works considering the stability of the most active photocatalysts during consecutive reaction cycles. The best photocatalytic performance of the CNTi1 sample seems to be related to an adequate porous texture, the narrow band gap associated to the rutile phase in combination with the carbon support and an intermediate particle size. In the case of the CPTi1 composite, the low surface area can be compensated by the favorable role of phosphate groups on the adsorption and a very small particle size (not detectable by XRD). Therefore, this study demonstrates the possibility to enhance the photocatalytic activity of TiO2 by preparing composites from biopolymers, like cellulose, through an easy procedure, highlighting the importance of the cellulose pretreatment conditions on the final properties and catalytic performance. Even so, the developed photocatalysts presented a good activity compared to other materials reported in literature (Table 3).

4. Conclusions

Cheap and sustainable carbon–Ti composites with improved adsorptive and photocatalytic performances were obtained using cellulose as raw material. The oxygen- and phosphorus-containing surface groups generated on the cellulose chains during the acid solubilization of the microcrystalline structure determine the interactions with the Ti precursor during impregnation and the transformations of both cellulose and Ti phases during thermal treatments. Thus, the chemical nature and physicochemical properties of the active phases can be fitted by adjusting the surface chemistry and carbonization temperature.
Phosphorus functionalities, phosphate groups in particular, avoid crystal growth when composites are carbonized at low temperature (500 °C), while oxygen functionalities favor the transformation of anatase nanocrystals into rutile phase. With increased carbonization temperature (800 °C), Ti precursors react with the phosphate surface groups, forming TiP2O7 nanocrystals; sintering is also favored, and Ti+4 is partially reduced to Ti+3. These interactions with the carbon phase produce a significant narrowing of the band gap regarding rutile or TiP2O7 pure phases. The combination of a developed porosity and surface area, a narrow band gap and small crystal size favor the dye adsorption and prevent the electron–hole recombination, consequently enhancing the dye mineralization in all carbon–Ti composites compared to that of the commercial P25.

Supplementary Materials

The following are available online at https://www.mdpi.com/2079-4991/10/4/729/s1: Figure S1: High-resolution XPS spectra of the P2p region for Ti-impregnated cellulose derivatives and their corresponding carbonized composites.

Author Contributions

Conceptualization, F.J.M.-H., A.F.P.-C. and F.C.-M.; investigation, H.H. and E.B.-G.; writing—original draft preparation, F.J.M.-H. and S.M.-T.; writing—review and editing, H.H., F.C.-M. and A.F.P.-C.; supervision, F.J.M.-H., A.F.P.-C., F.C.-M. and S.M.-T.; funding acquisition, A.F.P.-C., F.C.-M. and F.J.M-H. All authors have read and agreed to the published version of the manuscript.

Funding

This work was financially supported by the Spanish Projects ref. RTI2018-099224-B-I00 from ERDF/Ministry of Science, Innovation and Universities—State Research Agency and Junta de Andalucía - Grant ref. RMN-172.

Acknowledgments

H.H. gratefully thanks a predoctoral fellowship from Erasmus Mundus (Al-Idrisi II). E.B.-G. is grateful to MINECO for her postdoctoral fellowship (FJCI-2015-23769). S.M.-T. acknowledges the financial support from the University of Granada (Reincorporación Plan Propio). “Unidad de Excelencia Química Aplicada a Biomedicina y Medioambiente” of the University of Granada (UEQ - UGR) is gratefully acknowledged for the technical assistance.

Conflicts of Interest

The authors declare no conflict of interest.

References

  1. Cai, M.-Q.; Zhu, Y.-Z.; Wei, Z.-S.; Hu, J.-Q.; Pan, S.-D.; Xiao, R.-Y.; Dong, C.-Y.; Jin, M.-C. Rapid decolorization of dye Orange G by microwave enhanced Fenton-like reaction with delafossite-type CuFeO2. Sci. Total Environ. 2017, 580, 966–973. [Google Scholar] [CrossRef] [PubMed]
  2. Yu, F.; Chen, J.; Chen, L.; Huai, J.; Gong, W.; Yuan, Z.; Wang, J.; Ma, J. Magnetic carbon nanotubes synthesis by Fenton’s reagent method and their potential application for removal of azo dye from aqueous solution. J. Colloid Interface Sci. 2012, 378, 175–183. [Google Scholar] [CrossRef]
  3. Nath, R.K.; Zain, M.F.M.; Jamil, M. An environment-friendly solution for indoor air purification by using renewable photocatalysts in concrete: A review. Renew. Sust. Energ. Rev. 2016, 62, 1184–1194. [Google Scholar] [CrossRef]
  4. Bailón-García, E.; Elmouwahidi, A.; Álvarez, M.A.; Carrasco-Marín, F.; Pérez-Cadenas, A.F.; Maldonado-Hódar, F.J. New carbon xerogel-TiO2 composites with high performance as visible-light photocatalysts for dye mineralization. Appl. Catal. B-Environ. 2017, 201, 29–40. [Google Scholar] [CrossRef]
  5. Fujishima, A.; Honda, K. Electrochemical photolysis of water at a semiconductor electrode. Nature 1972, 238, 37. [Google Scholar] [CrossRef] [PubMed]
  6. Pelaez, M.; Nolan, N.T.; Pillai, S.C.; Seery, M.K.; Falaras, P.; Kontos, A.G.; Dunlop, P.S.M.; Hamilton, J.W.J.; Byrne, J.A.; O’Shea, K.; et al. A review on the visible light active titanium dioxide photocatalysts for environmental applications. Appl. Catal. B-Environ. 2012, 125, 331–349. [Google Scholar] [CrossRef] [Green Version]
  7. Pastrana-Martínez, L.M.; Morales-Torres, S.; Likodimos, V.; Figueiredo, J.L.; Faria, J.L.; Falaras, P.; Silva, A.M.T. Advanced nanostructured photocatalysts based on reduced graphene oxide-TiO2 composites for degradation of diphenhydramine pharmaceutical and methyl orange dye. Appl. Catal. B-Environ. 2012, 123–124, 241–256. [Google Scholar]
  8. Zhang, W.; Liu, Y.; Pei, X.; Chen, X. Effects of indium doping on properties of xIn-0.1%Gd-TiO2 photocatalyst synthesized by sol-gel method. J. Phys. Chem. Solids 2017, 104, 45–51. [Google Scholar] [CrossRef]
  9. Iliev, V.; Tomova, D.; Bilyarska, L. Promoting the oxidative removal rate of 2,4-dichlorophenoxyacetic acid on gold-doped WO3/TiO2/reduced graphene oxide photocatalysts under UV light irradiation. J. Photochem. Photobiol. A 2018, 351, 69–77. [Google Scholar] [CrossRef]
  10. Huang, W.C.; Ting, J.-M. Novel nitrogen-doped anatase TiO2 mesoporous bead photocatalysts for enhanced visible light response. Ceram. Int. 2017, 43, 9992–9997. [Google Scholar] [CrossRef]
  11. Brindha, A.; Sivakumar, T. Visible active N, S co-doped TiO2/graphene photocatalysts for the degradation of hazardous dyes. J. Photochem. Photobiol. A 2017, 340, 46–156. [Google Scholar] [CrossRef]
  12. Seri-Levy, A.; Samuel, J.; Farin, D.; Avnir, D. Photoprocesses on Fractal Surfaces. In Studies in Surface Science and Catalysis; Anpo, M., Matsuura, T., Eds.; Elsevier: Amsterdam, The Netherlands, 1989; Volume 47, pp. 353–374. [Google Scholar]
  13. Leary, R.; Westwood, A. Carbonaceous nanomaterials for the enhancement of TiO2 photocatalysis. Carbon 2011, 49, 741–772. [Google Scholar] [CrossRef]
  14. Morales-Torres, S.; Pastrana-Martínez, L.M.; Figueiredo, J.L.; Faria, J.L.; Silva, A.M.T. Design of graphene-based TiO2 photocatalysts-a review. Environ. Sci. Pollut. Res. Int. 2012, 19, 3676–3687. [Google Scholar] [CrossRef] [PubMed]
  15. Li Puma, G.; Bono, A.; Krishnaiah, D.; Collin, J.G. Preparation of titanium dioxide photocatalyst loaded onto activated carbon support using chemical vapor deposition: A review paper. J. Hazard. Mater. 2008, 157, 209–219. [Google Scholar] [CrossRef]
  16. Silva, C.G.; Faria, J.L. Photocatalytic oxidation of benzene derivatives in aqueous suspensions: Synergic effect induced by the introduction of carbon nanotubes in a TiO2 matrix. Appl. Catal. B 2010, 101, 81–89. [Google Scholar] [CrossRef]
  17. Morales-Torres, S.; Pastrana-Martínez, L.M.; Figueiredo, J.L.; Faria, J.L.; Silva, A.M.T. Graphene oxide-P25 photocatalysts for degradation of diphenhydramine pharmaceutical and methyl orange dye. Appl. Surf. Sci. 2013, 275, 361–368. [Google Scholar] [CrossRef]
  18. Rus, A.Z.M. Biopolymers for superhydrophobic photocatalytic coatings. In Biopolymers and Biotech Admixtures for Eco-Efficient Construction Materials; Pacheco-Torgal, F., Ivanov, V., Karak, N., Jonkers, H., Eds.; Elsevier: Amsterdam, The Netherlands, 2016; pp. 421–447. [Google Scholar]
  19. Ananpattarachai, J.; Kajitvichyanukul, P. Enhancement of chromium removal efficiency on adsorption and photocatalytic reduction using a bio-catalyst, titania-impregnated chitosan/xylan hybrid film. J. Cleaner Prod. 2016, 130, 126–136. [Google Scholar] [CrossRef]
  20. Mohamed, M.A.; Mutalib, M.A.; Hir, Z.A.M.; Zain, M.F.M.; Mohamad, A.B.; Minggu, L.J.; Awang, N.A.; Salleh, W.N.W. An overview on cellulose-based material in tailoring bio-hybrid nanostructured photocatalysts for water treatment and renewable energy applications. Int. J. Biol. Macromol. 2017, 103, 1232–1256. [Google Scholar] [CrossRef]
  21. Ortelli, S.; Blosi, M.; Albonetti, S.; Vaccari, A.; Dondi, M.; Costa, A.L. TiO2 based nano-photocatalysis immobilized on cellulose substrates. J. Photochem. Photobiol. A 2014, 276, 58–64. [Google Scholar] [CrossRef]
  22. Jallouli, N.; Elghniji, K.; Trabelsi, H.; Ksibi, M. Photocatalytic degradation of paracetamol on TiO2 nanoparticles and TiO2/cellulosic fiber under UV and sunlight irradiation. Arabian J. Chem. 2017, 10, S3640–S3645. [Google Scholar] [CrossRef] [Green Version]
  23. Morawski, A.W.; Kusiak-Nejman, E.; Przepiórski, J.; Kordala, R.; Pernak, J. Cellulose-TiO2 nanocomposite with enhanced UV–Vis light absorption. Cellulose 2013, 20, 1293–1300. [Google Scholar] [CrossRef] [Green Version]
  24. Thomas, M.; Naikoo, G.A.; Sheikh, M.U.D.; Bano, M.; Khan, F. Effective photocatalytic degradation of Congo red dye using alginate/carboxymethyl cellulose/TiO2 nanocomposite hydrogel under direct sunlight irradiation. J. Photochem. Photobiol. A 2016, 327, 33–43. [Google Scholar] [CrossRef]
  25. Garusinghe, U.M.; Raghuwanshi, V.S.; Batchelor, W.; Garnier, G. Water Resistant Cellulose—Titanium Dioxide Composites for Photocatalysis. Sci. Rep. 2018, 8, 2306. [Google Scholar] [CrossRef] [PubMed] [Green Version]
  26. Hamad, H.; Bailón-García, E.; Morales-Torres, S.; Carrasco-Marín, F.; Pérez-Cadenas, A.F.; Maldonado-Hódar, F.J. Physicochemical properties of new cellulose-TiO2 composites for the removal of water pollutants: Developing specific interactions and performances by cellulose functionalization. J. Environ. Chem. Eng. 2018, 6, 5032–5041. [Google Scholar] [CrossRef]
  27. Habibi, S.; Jamshidi, M. Sol–gel synthesis of carbon-doped TiO2 nanoparticles based on microcrystalline cellulose for efficient photocatalytic degradation of methylene blue under visible light. Environ. Technol. 2019, 1, 1–15. [Google Scholar] [CrossRef]
  28. Stoeckli, F. Porosity in Carbons. Characterization and Applications; Arnold: London, UK, 1995. [Google Scholar]
  29. Bansal, R.C.; Donnet, J.B.; Stoeckli, F. Active Carbon; Marcel Dekker: New York, NY, USA, 1988. [Google Scholar]
  30. Barrett, E.P.; Joyner, L.G.; Halenda, P.P. The determination of pore volume and area distributions in porous substances. I. computations from nitrogen isotherms. J. Am. Chem. Soc. 1951, 73, 373–380. [Google Scholar] [CrossRef]
  31. Hamad, H.; Bailón-García, E.; Maldonado-Hódar, F.J.; Pérez-Cadenas, A.F.; Carrasco-Marín, F.; Morales-Torres, S. Synthesis of TixOy nanocrystals in mild synthesis conditions for the degradation of pollutants under solar light. Appl. Catal. B. 2019, 241, 385–392. [Google Scholar] [CrossRef]
  32. Miranda, M.I.G.; Bica, C.I.D.; Nachtigall, S.M.B.; Rehman, N.; Rosa, S.M.L. Kinetical thermal degradation study of maize straw and soybean hull celluloses by simultaneous DSC–TGA and MDSC techniques. Thermochim. Acta 2013, 565, 65–71. [Google Scholar] [CrossRef]
  33. Dumanlı, A.G.; Windle, A.H. Carbon fibres from cellulosic precursors: A review. J. Mater. Sci. 2012, 47, 4236–4250. [Google Scholar] [CrossRef]
  34. Figueiredo, J.L.; Pereira, M.F.R.; Freitas, M.M.A.; Órfão, J.J.M. Modification of the surface chemistry of activated carbons. Carbon 1999, 37, 1379–1389. [Google Scholar] [CrossRef]
  35. Prauchner, M.J.; Rodríguez-Reinoso, F. Chemical versus physical activation of coconut shell: A comparative study. Microporous Mesoporous Mater. 2012, 152, 163–171. [Google Scholar] [CrossRef]
  36. Elmouwahidi, A.; Bailón-García, E.; Pérez-Cadenas, A.F.; Maldonado-Hódar, F.J.; Carrasco-Marín, F. Activated carbons from KOH and H3PO4-activation of olive residues and its application as supercapacitor electrodes. Electrochim. Acta 2017, 229, 219–228. [Google Scholar] [CrossRef]
  37. Guo, Y.; Rockstraw, D.A. Physical and chemical properties of carbons synthesized from xylan, cellulose, and Kraft lignin by H3PO4 activation. Carbon 2006, 44, 1464–1475. [Google Scholar] [CrossRef]
  38. Vivo-Vilches, J.F.; Bailón-García, E.; Pérez-Cadenas, A.F.; Carrasco-Marín, F.; Maldonado-Hódar, F.J. Tailoring the surface chemistry and porosity of activated carbons: Evidence of reorganization and mobility of oxygenated surface groups. Carbon 2014, 68, 520–530. [Google Scholar] [CrossRef]
  39. Pastrana-Martínez, L.M.; Morales-Torres, S.; Likodimos, V.; Falaras, P.; Figueiredo, J.L.; Faria, J.L.; Silva, A.M.T. Role of oxygen functionalities on the synthesis of photocatalytically active graphene–TiO2 composites. Appl. Catal. B-Environ. 2014, 158–159, 329–340. [Google Scholar]
  40. Mohamed, M.A.; Wan Salleh, W.N.; Jaafar, J.; Rosmi, M.S.; Hir, Z.A.M.; Abd Mutalib, M.; Ismail, A.F.; Tanemura, M. Carbon as amorphous shell and interstitial dopant in mesoporous rutile TiO2: Bio-template assisted sol-gel synthesis and photocatalytic activity. Appl. Surf. Sci. 2017, 393, 46–59. [Google Scholar] [CrossRef]
  41. Rosas, J.M.; Bedia, J.; Rodríguez-Mirasol, J.; Cordero, T. HEMP-derived activated carbon fibers by chemical activation with phosphoric acid. Fuel 2009, 88, 19–26. [Google Scholar] [CrossRef]
  42. Luo, L.; Yang, Y.; Xiao, M.; Bian, L.; Yuan, B.; Liu, Y.; Jiang, F.; Pan, X. A novel biotemplated synthesis of TiO2/wood charcoal composites for synergistic removal of bisphenol A by adsorption and photocatalytic degradation. Chem. Eng. J. 2015, 262, 1275–1283. [Google Scholar] [CrossRef]
  43. Moreno-Castilla, C.; Maldonado-Hodar, F.J. Synthesis and surface characteristics of silica- and alumina-carbon composite xerogels. Phys. Chem. Chem. Phys. 2000, 2, 4818–4822. [Google Scholar] [CrossRef]
  44. Moreno-Castilla, C.; Maldonado-Hódar, F.J.; Carrasco-Marín, F.; Rodríguez-Castellón, E. Surface Characteristics of Titania/Carbon Composite Aerogels. Langmuir 2002, 18, 2295–2299. [Google Scholar] [CrossRef]
  45. Khatun, N.; Anita; Rajput, P.; Bhattacharya, D.; Jha, S.N.; Biring, S.; Sen, S. Anatase to rutile phase transition promoted by vanadium substitution in TiO2: A structural, vibrational and optoelectronic study. Ceram. Int. 2017, 43, 14128–14134. [Google Scholar] [CrossRef]
  46. Li, W.; Liang, R.; Hu, A.; Huang, Z.; Zhou, Y.N. Generation of oxygen vacancies in visible light activated one-dimensional iodine TiO2 photocatalysts. RSC Adv. 2014, 4, 36959–36966. [Google Scholar] [CrossRef]
  47. Muto, A.; Ida, K.; Bhaskar, T.; Uddin, M.A.; Takashima, S.; Hirai, T.; Sakata, Y. Preparation of novel TiP2O7 carbon composite using ion-exchanged resin (C467) and evaluation for photocatalytic decomposition of 2-propanol. Appl. Catal. A-Gen. 2004, 260, 163–168. [Google Scholar] [CrossRef]
  48. Sun, Y.; Gai, L.; Zhou, Y.; Zuo, X.; Zhou, J.; Jiang, H. Polyhierarchically structured TiP2O7/C microparticles with enhanced electrochemical performance for lithium-ion batteries. CrystEngComm 2014, 16, 10681–10691. [Google Scholar] [CrossRef]
  49. Patoux, S.; Masquelier, C. Lithium insertion into titanium phosphates, silicates, and sulfates. Chem. Mater. 2002, 14, 5057–5068. [Google Scholar] [CrossRef]
  50. Da Silva Souza, D.R.; de Mesquita, J.P.; Lago, R.M.; Caminhas, L.D.; Pereira, F.V. Cellulose nanocrystals: A versatile precursor for the preparation of different carbon structures and luminescent carbon dots. Ind. Crop. Prod. 2016, 93, 121–128. [Google Scholar] [CrossRef]
  51. López, R.; Gómez, R. Band-gap energy estimation from diffuse reflectance measurements on sol–gel and commercial TiO2: A comparative study. J. Sol-Gel Sci. Technol. 2012, 61, 1–7. [Google Scholar] [CrossRef]
  52. Meng, X.; Hao, M.; Shi, J.; Cao, Z.; He, W.; Gao, Y.; Liu, J.; Li, Z. Novel visible light response Ag3PO4/TiP2O7 composite photocatalyst with low Ag consumption. Adv. Powder Technol. 2017, 28, 1047–1053. [Google Scholar] [CrossRef]
  53. Bailón-García, E.; Elmouwahidi, A.; Carrasco-Marín, F.; Pérez-Cadenas, A.F.; Maldonado-Hódar, F.J. Development of Carbon-ZrO2 composites with high performance as visible-light photocatalysts. Appl. Catal. B-Environ. 2017, 217, 540–550. [Google Scholar] [CrossRef]
  54. Jose, M.; Harsha, N.; Suhailath, K.; Mohamed, A.P.; Shukla, S. Hydrogen phosphate anions modified hydrogen titanate nanotubes for methylene blue adsorption from aqueous solution: Validating novel method of predicting adsorption capacity. J. Environ. Chem. Eng. 2016, 4, 1295–1307. [Google Scholar] [CrossRef]
  55. Stylidi, M.; Kondarides, D.I.; Verykios, X.E. Pathways of solar light-induced photocatalytic degradation of azo dyes in aqueous TiO2 suspensions. Appl. Catal., B 2003, 40, 271–286. [Google Scholar] [CrossRef]
  56. Lachheb, H.; Puzenat, E.; Houas, A.; Ksibi, M.; Elaloui, E.; Guillard, C.; Herrmann, J.-M. Photocatalytic degradation of various types of dyes (Alizarin S, Crocein Orange G, Methyl Red, Congo Red, Methylene Blue) in water by UV-irradiated titania. Appl. Catal., B 2002, 39, 75–90. [Google Scholar] [CrossRef]
  57. Sun, J.; Wang, X.; Sun, J.; Sun, R.; Sun, S.; Qiao, L. Photocatalytic degradation and kinetics of Orange G using nano-sized Sn(IV)/TiO2/AC photocatalyst. J. Mol. Catal. A-Chem. 2006, 260, 241–246. [Google Scholar] [CrossRef]
  58. Khataee, A.R.; Pons, M.N.; Zahraa, O. Photocatalytic degradation of three azo dyes using immobilized TiO2 nanoparticles on glass plates activated by UV light irradiation: Influence of dye molecular structure. J. Hazard. Mater. 2009, 168, 451–457. [Google Scholar] [CrossRef]
  59. Jagadale, T.; Kulkarni, M.; Pravarthana, D.; Ramadan, W.; Thakur, P. Photocatalytic degradation of azo dyes using Au:TiO2, γ-Fe2O3:TiO2 functional nanosystems. J. Nanosci. Nanotechnol. 2012, 12, 928–936. [Google Scholar] [CrossRef]
  60. Hemalatha, K.; Ette, P.M.; Madras, G.; Ramesha, K. Visible light assisted photocatalytic degradation of organic dyes on TiO2–CNT nanocomposites. J. Sol-Gel Sci. Technol. 2015, 73, 72–82. [Google Scholar] [CrossRef]
  61. Li, Y.-N.; Chen, Z.-Y.; Wang, M.-Q.; Zhang, L.-Z.; Bao, S.-J. Interface engineered construction of porous g-C3N4/TiO2 heterostructure for enhanced photocatalysis of organic pollutants. Appl. Surf. Sci. 2018, 440, 229–236. [Google Scholar] [CrossRef]
  62. Anshuman, A.; Saremi-Yarahmadi, S.; Vaidhyanathan, B. Enhanced catalytic performance of reduced graphene oxide–TiO2 hybrids for efficient water treatment using microwave irradiation. RSC Adv. 2018, 8, 7709–7715. [Google Scholar] [CrossRef] [Green Version]
Figure 1. (a) Thermogravimetric (TG) profiles under N2 flow for microcrystalline cellulose (MCC) and acid-treated cellulose samples before (solid lines) and after Ti impregnation (dash lines); (b) Differential thermogravimetric (DTG) profiles under N2 flow for MCC, CN and CP.
Nanomaterials 10 00729 g001
Figure 2. High-resolution XPS spectra of the C1s (a,d), O1s (b,e) and Ti2p (c,f) regions for Ti-impregnated cellulose derivatives and their corresponding carbonized composites.
Nanomaterials 10 00729 g002
Figure 3. X-ray diffraction (XRD) patterns of the carbon–Ti composites (R = rutile, P = TiP2O7).
Nanomaterials 10 00729 g003
Figure 4. Scanning electron microscopy (SEM) images of the carbon–Ti composites prepared by cellulose treatment with phosphoric acid (a,b), or nitric acid (c,d).
Nanomaterials 10 00729 g004
Figure 5. High resolution transmission electron microscopy (HRTEM) characterization of CPTi composites: (a) energy dispersive X-ray (EDX) analysis, (b,d,e) micrographs and (c) Ti-mapping.
Nanomaterials 10 00729 g005
Figure 6. N2 adsorption–desorption isotherms of (a) the pure carbon materials and (b) the carbon–Ti composites.
Nanomaterials 10 00729 g006
Figure 7. (a) UV/Vis diffuse reflectance spectra (DRUV) of P25 and different carbon–Ti composites. (b) Plot of transformed Kubelka–Munk units as a function of the energy of light (inset: determination of the band gap).
Nanomaterials 10 00729 g007
Figure 8. Removal of Orange G (OG) from water solution by (a) adsorption using pure carbon materials and (b) adsorption and (c) photocatalysis using carbon–Ti composites.
Nanomaterials 10 00729 g008
Table 1. Surface composition of Ti-impregnated cellulose and its carbon derivatives determined by X-ray photoelectron spectroscopy (XPS) and measurements of pHPZC.
SamplepHPZC (±0.2)Atomic Content (±0.1 wt. %)
CONPTi
CPTin.d.8.547.3-26.817.4
CPTi12.722.042.7-21.913.4
CPTi22.827.336.4-22.813.5
CNTin.d.18.736.21.2-43.9
CNTi26.516.435.4--48.2
n.d. = not determined.
Table 2. Textural characteristics of the carbon–Ti composites.
SampleSBET
(±5 m2·g−1)
Smicro
(±5 m2·g−1)
L0
(±0.1 nm)
W0
(±0.01 cm3·g−1)
Vmeso
(±0.01 cm3·g−1)
CP117202.20.010.02
CP25526241.50.220.07
CN12262531.50.090.06
CN21151221.70.040.06
CPTi128351.40.010.27
CPTi230481.80.020.35
CNTi11241411.60.050.13
CNTi23193601.50.130.34
Table 3. Removal of OG obtained by photocatalysis using different TiO2-based materials.
MaterialOG ConcentrationIrradiation SourceRemoval (%) Reference
TiO2
(Degussa P25)
84.2 μM,
2.5 g/L catalyst
UV high-pressure mercury lamp100%,
120 min
[56]
Sn(IV)/TiO2/AC110.5 μM,
12.5 g/L catalyst
UV high-pressure mercury light99.1%,
60 min
[57]
TiO2 (99% anatase) on glass plates66.3 μM UV lamp
(λ = 365 nm)
100%,
130 min
[58]
Au–TiO225 μMUV low-pressure mercury lamp100%,
60 min
[59]
10%CNT–TiO2110.5 μM,
1 g/L catalyst
Metal halide lamp + cut-off filter (λ > 400 nm)100%,
120 min
[60]
CX–TiO255.3 μM,
1 g/L catalyst
Vis TeptoLux 2.0 lamp90%,
400 min
[4]
g-C3N4–TiO2200 μM, 0.5 g/LSimulated solar light
(Xe Lamp)
82%,
10 min
[61]
rGO–TiO210 μMMicrowave irradiation 88%,
20 min
[62]
CNTi122 μM, 1.0 g/LUV low-pressure mercury lamp99%,
40 min
This work
CPTi122 μM, 1.0 g/LUV low-pressure mercury lamp100%,
40 min
This work
TiO2
(Degussa P25)
22 μM, 1.0 g/LUV low-pressure mercury lamp79%,
40 min
This work
AC = activated carbon; CNT = carbon nanotubes; CX = carbon xerogel; rGO = reduced graphene oxide.

