A Method for Quantitative Determination of Biofilm Viability


Abstract
:
1. Introduction
2. Theory
 Where
Where  is the initial number of bacteria,
  is the specific growth rate, and the time for the bacterial population to double (i.e., the generation time) is given by
  .
. is the amount of metabolite produced per bacterium per unit of time, then
 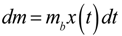 is the amount of metabolite produced in the time interval dt at time t. In order to calculate the accumulated amount of metabolite at time t we integrate dm:
 where v is the integration variable. If the
  (i.e., the bacterial population is constant), then Equation (2) simplifies to
 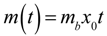 as expected (this can be proved by taking the Maclaurin series of
  before setting in Equation (2)).
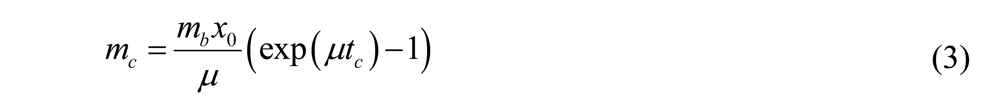
 , it takes a starting amount of bacteria,
  , to produce the required amount of metabolite,
  :
:
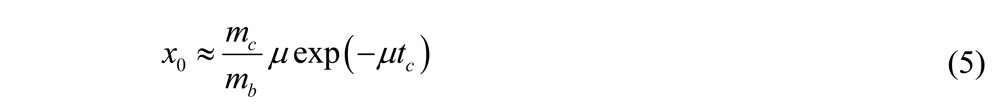
 solving for gives
 for
for  ,
,
 :
:
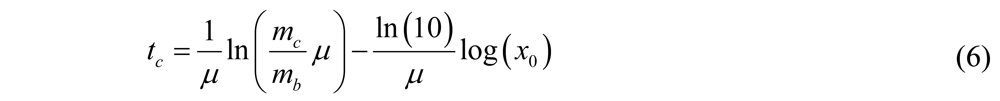 as a function of
  we find that the slope of the line corresponds to the inverse of the specific growth rate of the bacteria. This plot corresponds to the standard curves that are used to calibrate metabolic viability assays; different known starting concentrations of bacteria are placed in the assay and the times for the required amount of metabolite to be produced are recorded and plotted against the starting concentrations of bacteria. In fact, if we look at standard curves that have been produced in other studies with viability assays incorporating indicators such as phenol red or resazurin [14,19], we can observe the logarithmic relationship between time and initial bacterial concentration as indicated by Equation (6). there is an exponential relationship between the amount of metabolite required to produce a signal and the corresponding time for values of
  . Thus, if a series of assays containing the same initial amount of biofilm are performed using different volumes (i.e., varying ), a plot of versus
  can be made and the specific growth rate can be extracted from the slope of the line for values of :
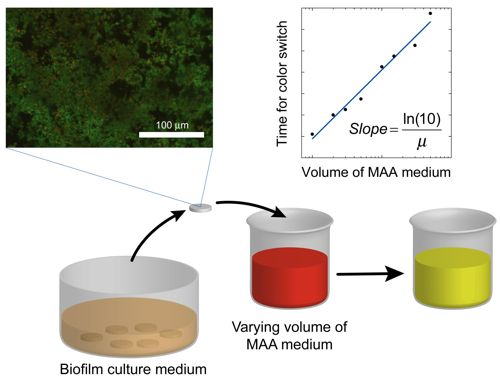
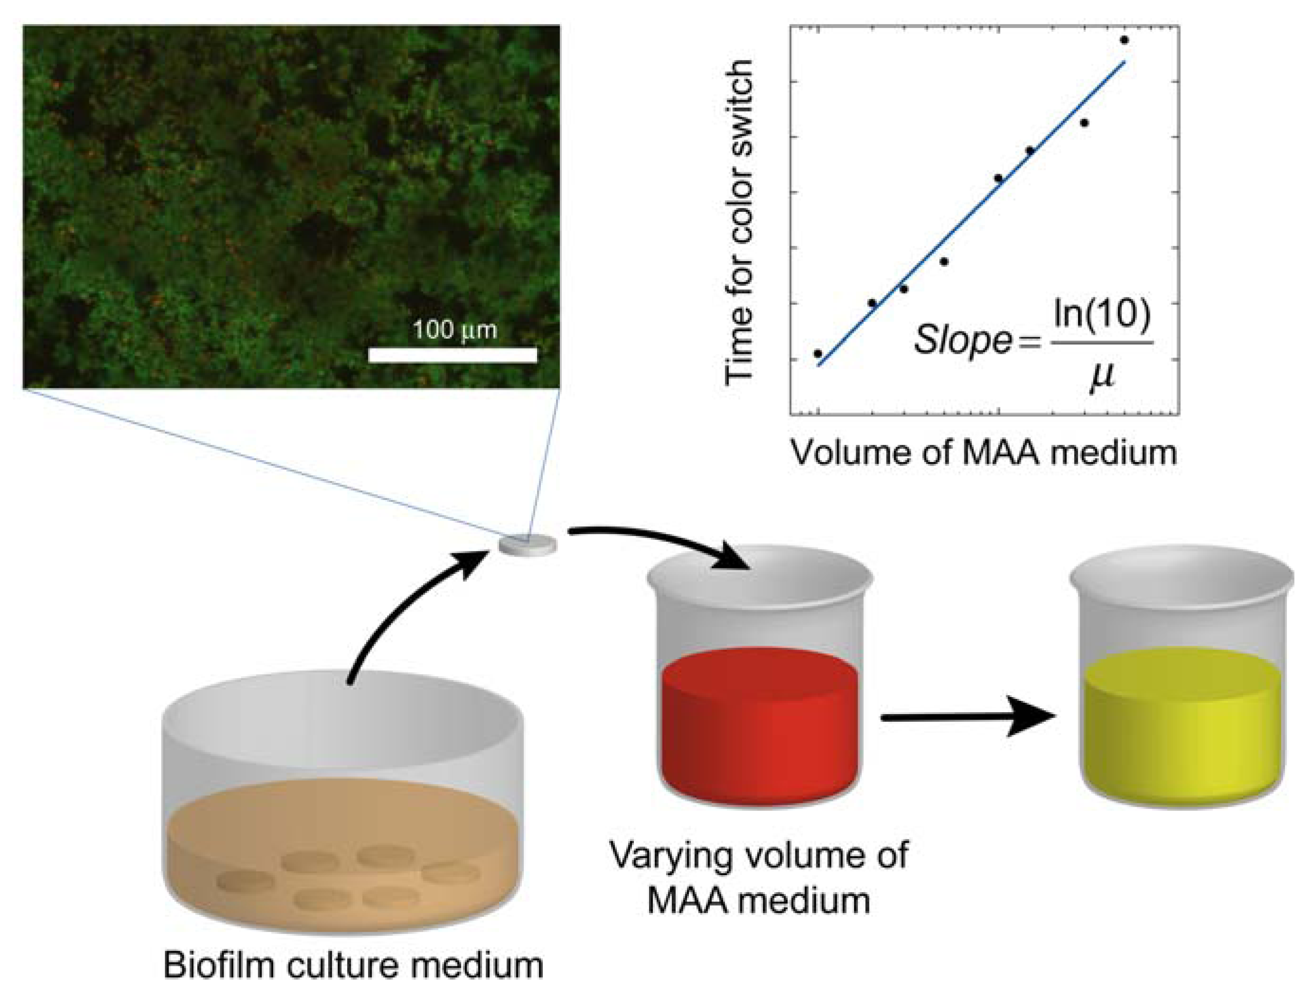
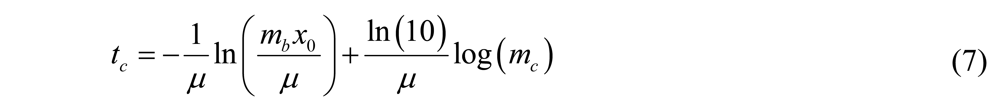 where the slope = ln(10)/μ. Once the specific growth rate is known, this information can be used to calibrate the results from antibacterial testing on the biofilm and thus quantitatively determine the log reduction. A schematic overview of the method alternative in which the volume of the assay media is varied is displayed in Figure 1.
3. Experimental Section
3.1. Bacterial Culture Media and Biofilm Preparation
3.2. Specific Growth Rate of Planktonic S. mutans by OD Measurements
3.3. Metabolic Activity Assay (MAA)
3.4. Specific Growth Rate of Planktonic S. mutans by MAA Measurements
= 5 × 10⁵ cfu for all assays) in assay volumes ranging from 3 to 200 mL.3.5. Standard Curves of Biofilm S. Mutans by MAA Measurements
4. Results and Discussion
4.1. Specific Growth Rate of Planktonic S. mutans by OD Measurements

4.2. Specific Growth Rate of Planktonic S. Mutans by MAA Measurements
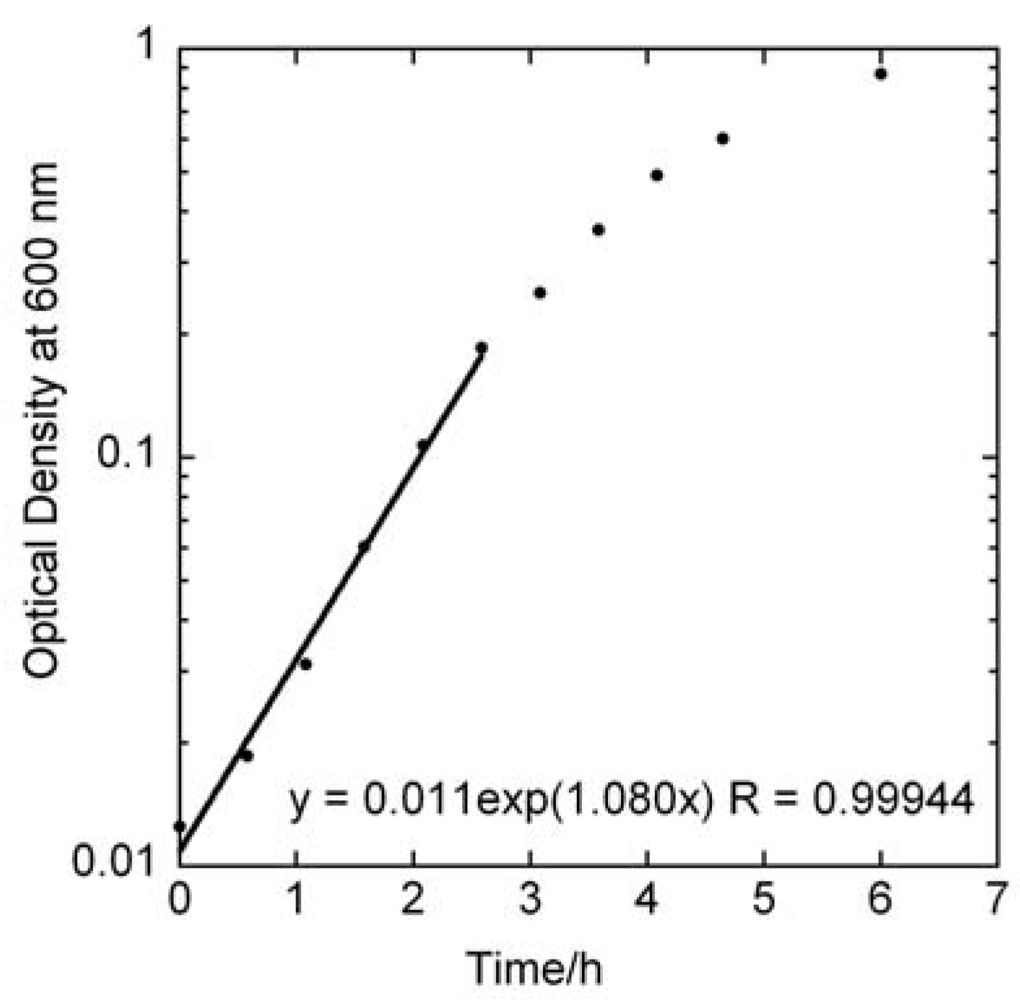
versus curve would remain unchanged. However, it is likely that these assumptions would not hold if too high of an initial concentrations of bacteria were used. From Figure 2 we can observe that the growth rate of the bacteria changes above OD values of about 0.2, which corresponds to a bacterial concentration of approximately 2 × 10⁸ cfu/ml. The highest initial concentration of bacteria used in Figure 3a was 108 cfu/ml. Indeed, viability assay standard curves in several other studies [14,17,18,19] show such a log-linear relationship between the initial planktonic bacterial population and the time for a metabolic indicator to reach a certain level. In the MAA the dynamic range is very good as it shows an exponential relationship over seven orders of magnitude of initial bacterial concentration. versus line. Figure 3b displays a series of ten MAA performed on planktonic S. mutans in assay volumes ranging from 3 to 200 ml in which the starting concentration of bacteria was identical in all tests. A logarithmic curve fit to the data and using Equation (7) gives μ = 1.08 h−1 in excellent agreement with both Figure 2 and Figure 3a.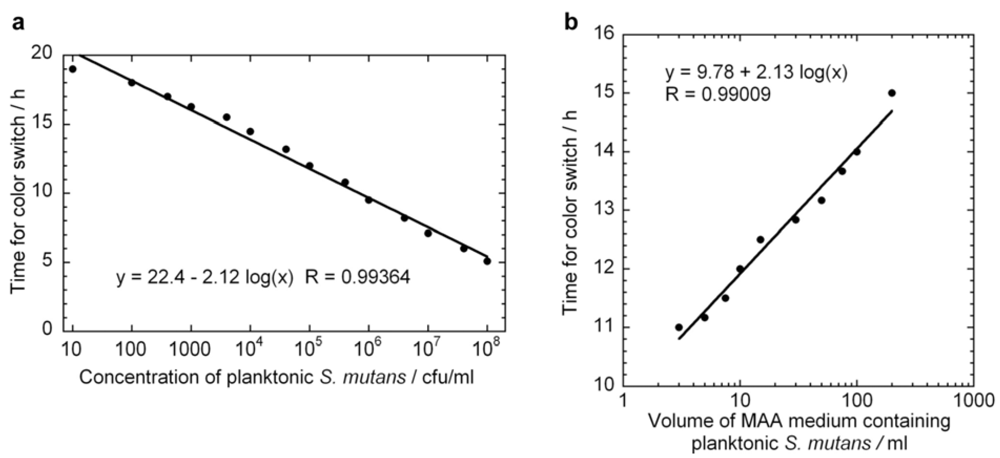
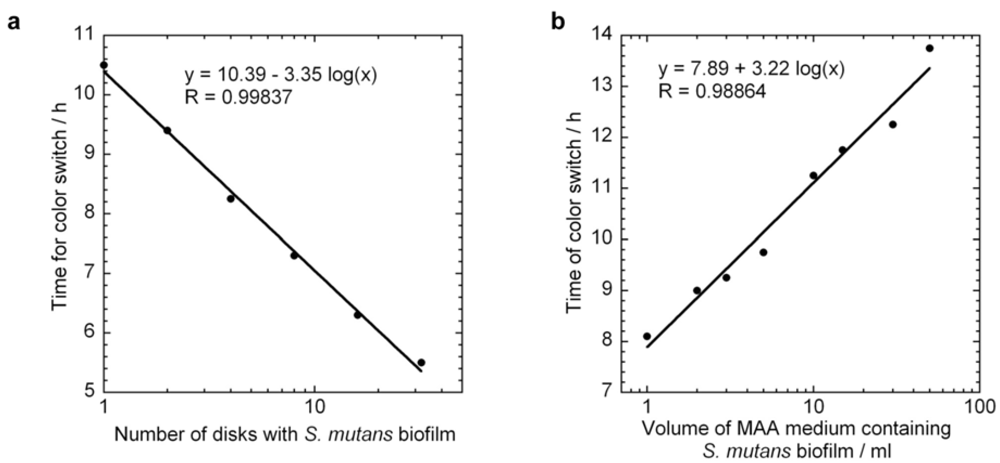
4.3. Standard Curves and Specific Growth Rate of Biofilm S. Mutans by MAA Measurements
5. Conclusions
Conflict of Interest
Acknowledgments
References
- Davey, M.E.; O’Toole, G.A. Microbial biofilms: From ecology to molecular genetics. Microbiol. Mol. Biol. Rev. 2000, 64, 847–867. [Google Scholar] [CrossRef]
- Kolenbrander, P.E.; Palmer, R.J.; Periasamy, S.; Jakubovics, N.S. Oral multispecies biofilm development and the key role of cell-cell distance. Nat. Rev. Microbiol. 2010, 8, 471–480. [Google Scholar] [CrossRef]
- Sutherland, I.W. The biofilm matrix—An immobilized but dynamic microbial environment. Trends Microbiol. 2001, 9, 222–227. [Google Scholar] [CrossRef]
- Mah, T.F.C.; O’Toole, G.A. Mechanisms of biofilm resistance to antimicrobial agents. Trends Microbiol. 2001, 9, 34–39. [Google Scholar] [CrossRef]
- Stewart, P.S.; Costerton, J.W. Antibiotic resistance of bacteria in biofilms. Lancet 2001, 358, 135–138. [Google Scholar]
- Roberts, M.E.; Stewart, P.S. Modeling antibiotic tolerance in biofilms by accounting for nutrient limitation. Antimicrob. Agents Chemother. 2004, 48, 48–52. [Google Scholar]
- Ito, A.; Taniuchi, A.; May, T.; Kawata, K.; Okabe, S. Increased antibiotic resistance of escherichia coli in mature biofilms. Appl. Environ. Microbiol. 2009, 75, 4093–4100. [Google Scholar]
- Konig, C.; Schwank, S.; Blaser, J. Factors compromising antibiotic activity against biofilms of Staphylococcus epidermidis. Eur. J. Clin. Microbiol. Infect. Dis. 2001, 20, 20–26. [Google Scholar]
- Matsumoto-Nakano, M.; Kuramitsu, H.K. Role of bacteriocin immunity proteins in the antimicrobial sensitivity of Streptococcus mutans. J. Bacteriol. 2006, 188, 8095–8102. [Google Scholar] [CrossRef]
- Ceri, H.; Olson, M.E.; Stremick, C.; Read, R.R.; Morck, D.; Buret, A. The calgary biofilm device: New technology for rapid determination of antibiotic susceptibilities of bacterial biofilms. J. Clin. Microbiol. 1999, 37, 1771–1776. [Google Scholar]
- Berney, M.; Hammes, F.; Bosshard, F.; Weilenmann, H.U.; Egli, T. Assessment and interpretation of bacterial viability by using the LIVE/DEAD baclight kit in combination with flow cytometry. Appl. Environ. Microbiol. 2007, 73, 3283–3290. [Google Scholar] [CrossRef]
- O’Brien, J.; Pognan, F. Investigation of the alamar blue (resazurin) fluorescent dye for the assessment of mammalian cell cytotoxicity. Toxicology 2001, 164, 132–132. [Google Scholar]
- Pettit, R.K.; Weber, C.A.; Kean, M.J.; Hoffmann, H.; Pettit, G.R.; Tan, R.; Franks, K.S.; Horton, M.L. Microplate alamar blue assay for Staphylococcus epidermidis biofilm susceptibility testing. Antimicrob. Agents Chemother. 2005, 49, 2612–2617. [Google Scholar]
- Mariscal, A.; Lopez-Gigosos, R.M.; Carnero-Varo, M.; Fernandez-Crehuet, J. Fluorescent assay based on resazurin for detection of activity of disinfectants against bacterial biofilm. Appl. Microbiol. Biotechnol. 2009, 82, 773–783. [Google Scholar] [CrossRef]
- Honraet, K.; Goetghebeur, E.; Nelis, H.J. Comparison of three assays for the quantification of candida biomass in suspension and CDC reactor grown biofilms. J. Microbiol. Methods 2005, 63, 287–295. [Google Scholar] [CrossRef]
- Prieto, B.; Silva, B.; Lantes, O. Biofilm quantification on stone surfaces: comparison of various methods. Sci. Total Environ. 2004, 333, 1–7. [Google Scholar] [CrossRef]
- Peeters, E.; Nelis, H.J.; Coenye, T. Comparison of multiple methods for quantification of microbial biofilms grown in microtiter plates. J. Microbiol. Meth. 2008, 72, 157–165. [Google Scholar] [CrossRef]
- Berlutti, F.; Rosso, F.; Bosso, P.; Giansanti, F.; Ajello, M.; De Rosa, A.; Farina, E.; Antonini, G.; Valenti, P. Quantitative evaluation of bacteria adherent to polyelectrolyte HEMA-based hydrogels. J. Biomed. Mater. Res. A 2003, 67A, 18–25. [Google Scholar] [CrossRef]
- Pantanella, F.; Valenti, P.; Frioni, A.; Natalizi, T.; Coltella, L.; Berlutti, F. Biotimer assay, a new method for counting Staphylococcus spp. in biofilm without sample manipulation applied to evaluate antibiotic susceptibility of biofilm. J. Microbiol. Methods 2008, 75, 478–484. [Google Scholar] [CrossRef]
- Donlan, R.M. Biofilm formation: A clinically relevant microbiological process. Clin. Infect. Dis. 2001, 33, 1387–1392. [Google Scholar] [CrossRef]
- Donlan, R.M.; Costerton, J.W. Biofilms: Survival mechanisms of clinically relevant microorganisms. Clin. Microbiol. Rev. 2002, 15, 167–193. [Google Scholar] [CrossRef]
- Sandberg, M.E.; Schellmann, D.; Brunhofer, G.; Erker, T.; Busygin, I.; Leino, R.; Vuorela, P.M.; Fallarero, A. Pros and cons of using resazurin staining for quantification of viable Staphylococcus aureus biofilms in a screening assay. J. Microbiol. Methods 2009, 78, 104–106. [Google Scholar] [CrossRef]
- Brohede, U.; Forsgren, J.; Roos, S.; Mihranyan, A.; Engqvist, H.; Strømme, M. Multifunctional implant coatings providing possibilities for fast antibiotics loading with subsequent slow release. J. Mater. Sci. Mater. Med. 2009, 20, 1859–1867. [Google Scholar] [CrossRef]
- Forsgren, J.; Brohede, U.; Mihranyan, A.; Engqvist, H.; Strømme, M. Fast loading, slow release—A new strategy for incorporating antibiotics to hydroxyapatite. Key Eng. Mater. 2009, 396–398, 523–526. [Google Scholar] [CrossRef]
- Welch, K.; Cai, Y.; Engqvist, H.; Strømme, M. Dental adhesives with bioactive and on-demand bactericidal properties. Dent. Mater. 2010, 26, 491–499. [Google Scholar] [CrossRef]
- Banas, J.A. Virulence properties of Streptococcus mutans. Front. Biosci. 2004, 9, 1267–1277. [Google Scholar] [CrossRef]
- Merritt, J.; Qi, F.; Goodman, S.D.; Anderson, M.H.; Shi, W. Mutation of luxS affects biofilm formation in Streptococcus mutans. Infect. Immun. 2003, 71, 1972–1979. [Google Scholar]
- Kaewsrichan, J.; Teanpaisan, R.; Kongprasertkit, L.; Chuchom, T. Ion-paired RP-HPLC for determining fermentation end products of Streptococcus mutans grown under different conditions. Scienceasia 2008, 34, 193–198. [Google Scholar]
© 2012 by the authors; licensee MDPI, Basel, Switzerland. This article is an open access article distributed under the terms and conditions of the Creative Commons Attribution license (http://creativecommons.org/licenses/by/3.0/).
Share and Cite
Welch, K.; Cai, Y.; Strømme, M. A Method for Quantitative Determination of Biofilm Viability. J. Funct. Biomater. 2012, 3, 418-431. https://doi.org/10.3390/jfb3020418
Welch K, Cai Y, Strømme M. A Method for Quantitative Determination of Biofilm Viability. Journal of Functional Biomaterials. 2012; 3(2):418-431. https://doi.org/10.3390/jfb3020418
Chicago/Turabian StyleWelch, Ken, Yanling Cai, and Maria Strømme. 2012. "A Method for Quantitative Determination of Biofilm Viability" Journal of Functional Biomaterials 3, no. 2: 418-431. https://doi.org/10.3390/jfb3020418
APA StyleWelch, K., Cai, Y., & Strømme, M. (2012). A Method for Quantitative Determination of Biofilm Viability. Journal of Functional Biomaterials, 3(2), 418-431. https://doi.org/10.3390/jfb3020418