Tracking with (Un)Certainty

 , ,
, , 
Abstract
1. Introduction
1.1. Elo Rating System
- is the new rating after the event.
- is the pre-event rating.
- K is the rating point value of a single game score.
- W is the actual game score, each win counting 1, each draw .
- is the expected game score based on .
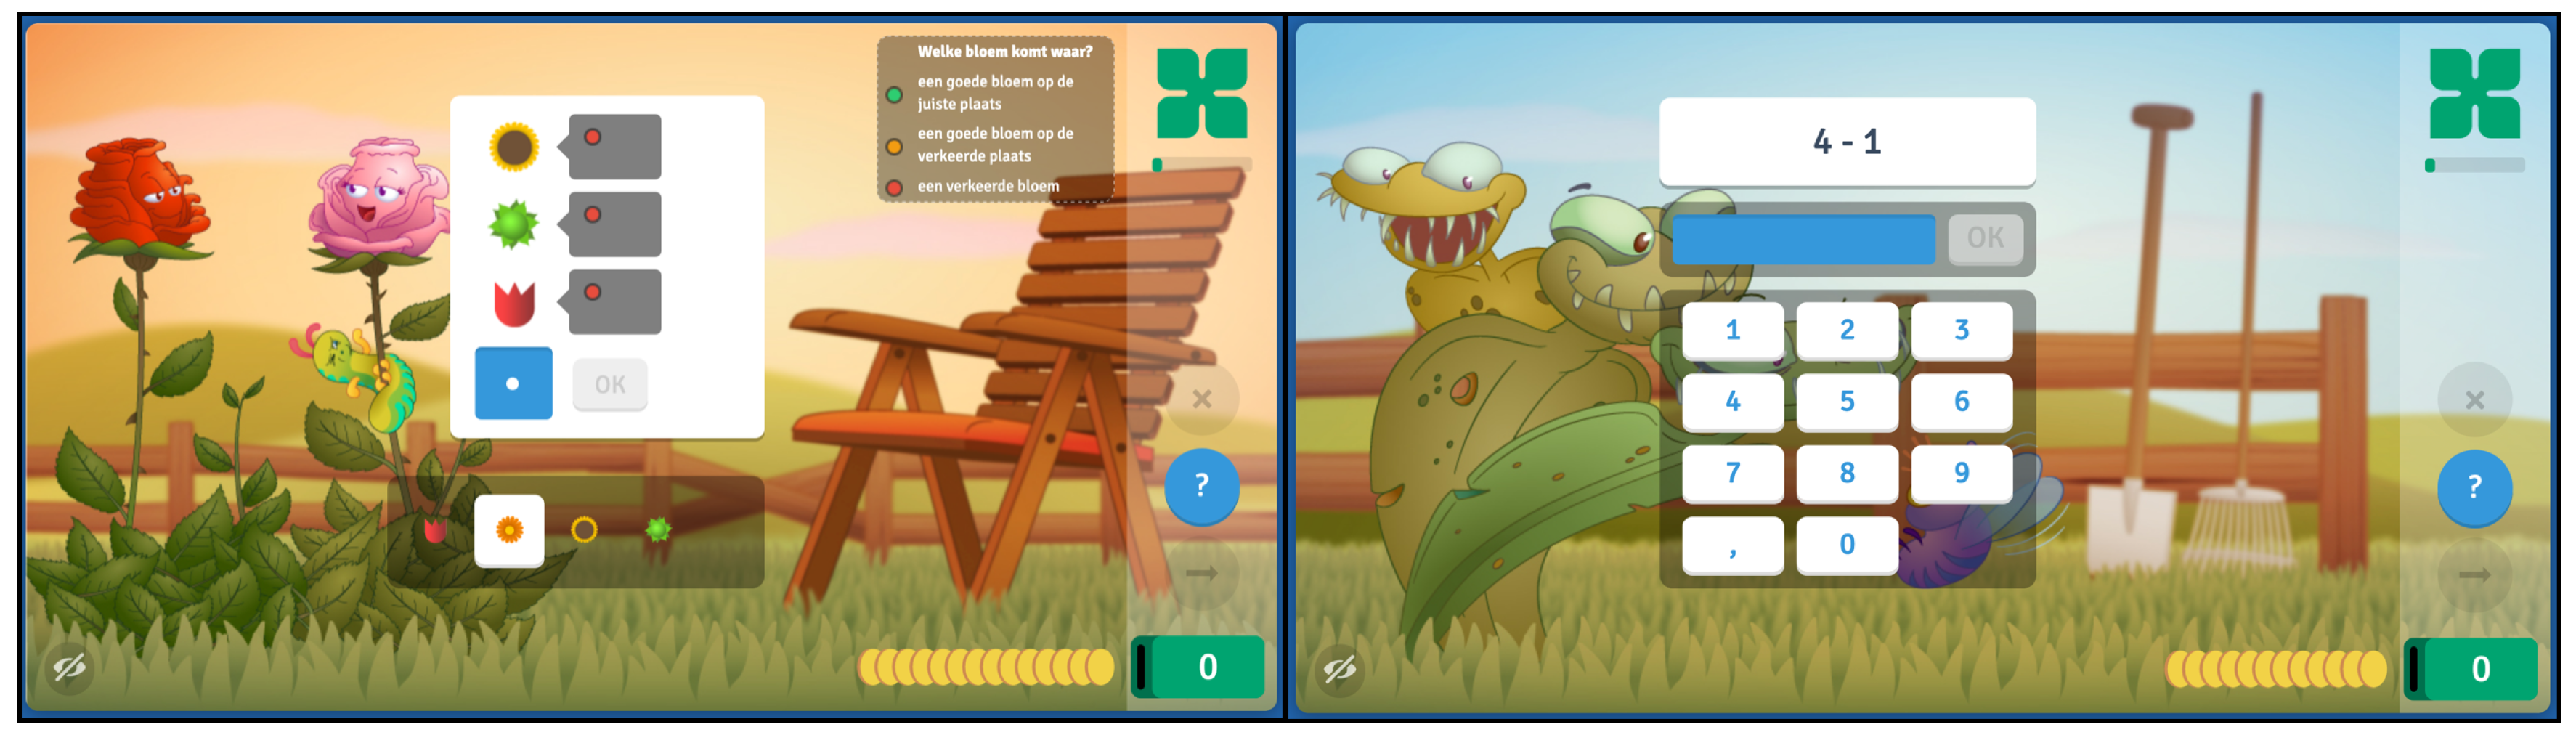
1.2. Math Garden
1.3. Research with Math Garden
1.4. Challenges in Elo Rating Systems
1.5. Alternatives to Elo Rating Systems
1.6. Three Problems in Rating Systems
1.7. Outline
2. Methods
2.1. The Urnings Algorithm
| Algorithm 1: Game of Chance |
| repeat until return |
| Algorithm 2: Game of Chance with Urnings |
| repeat until return |
2.2. Simulation Setup
3. Results
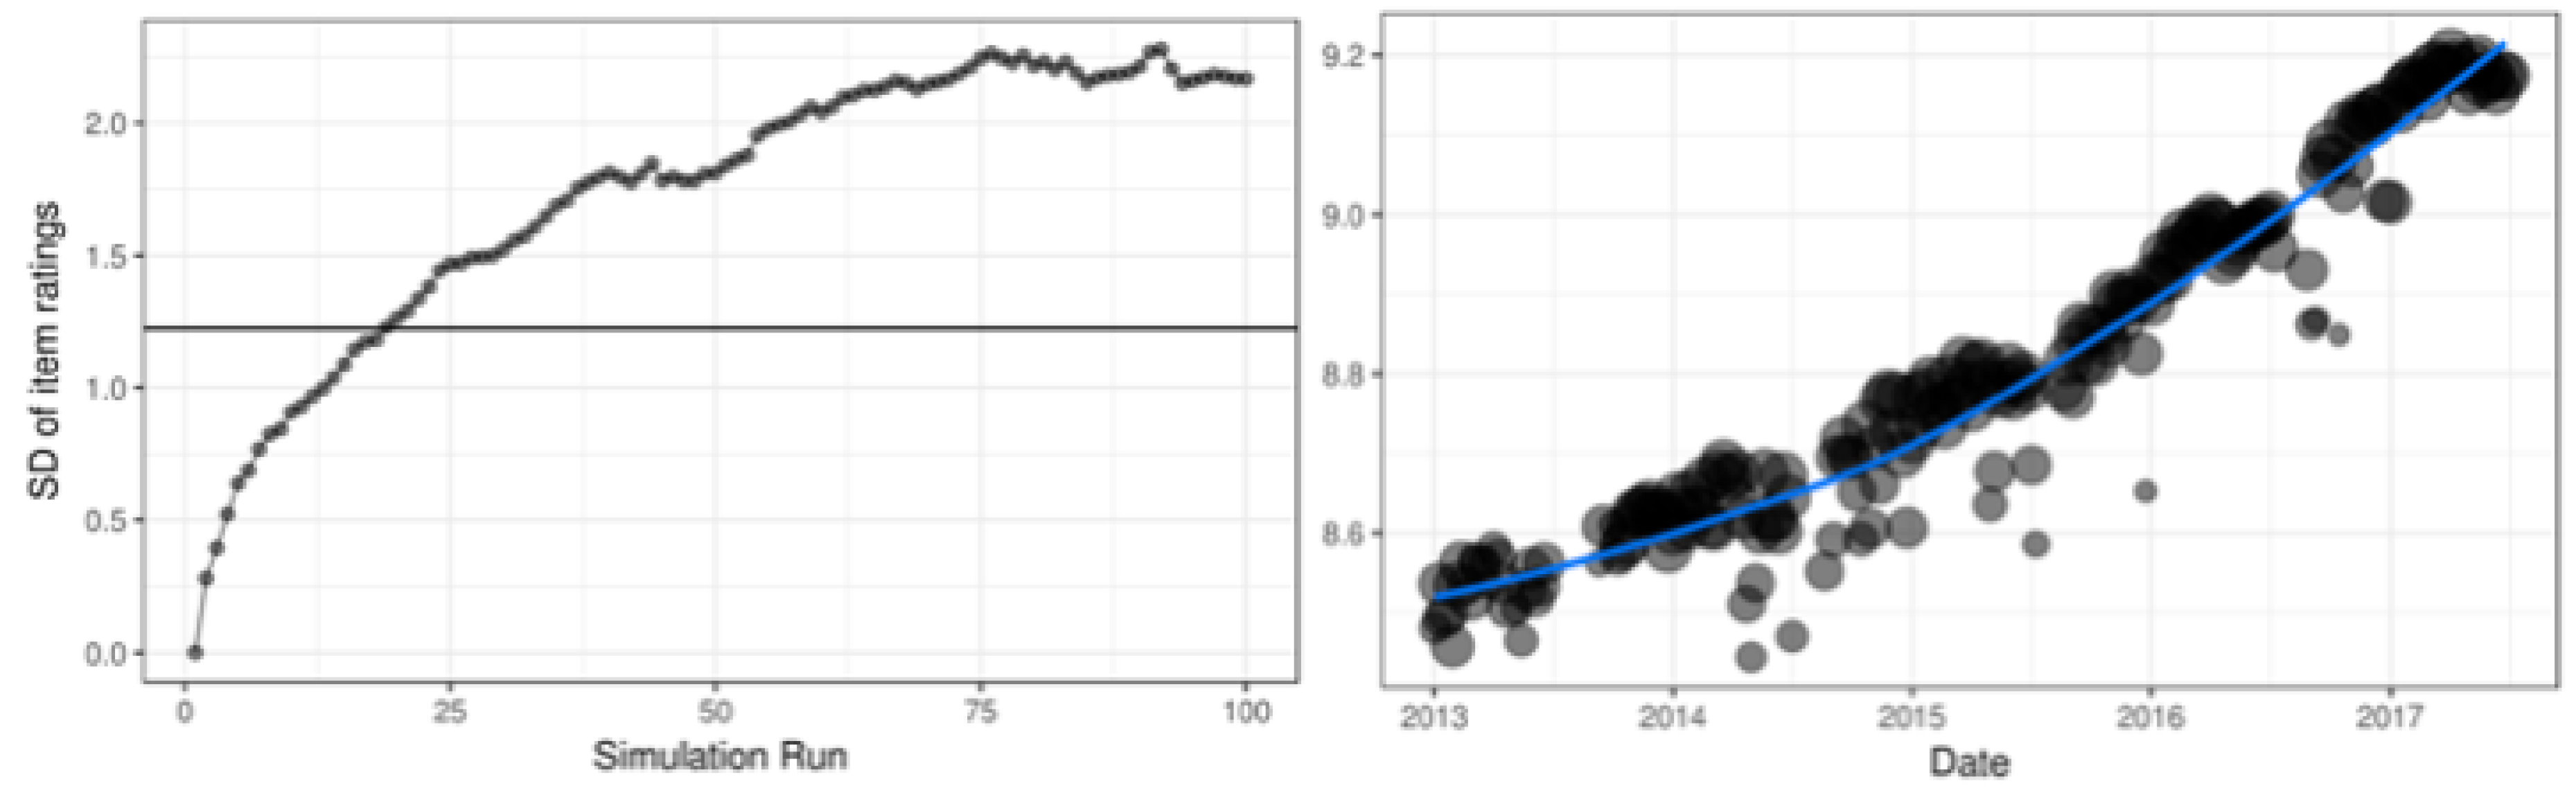
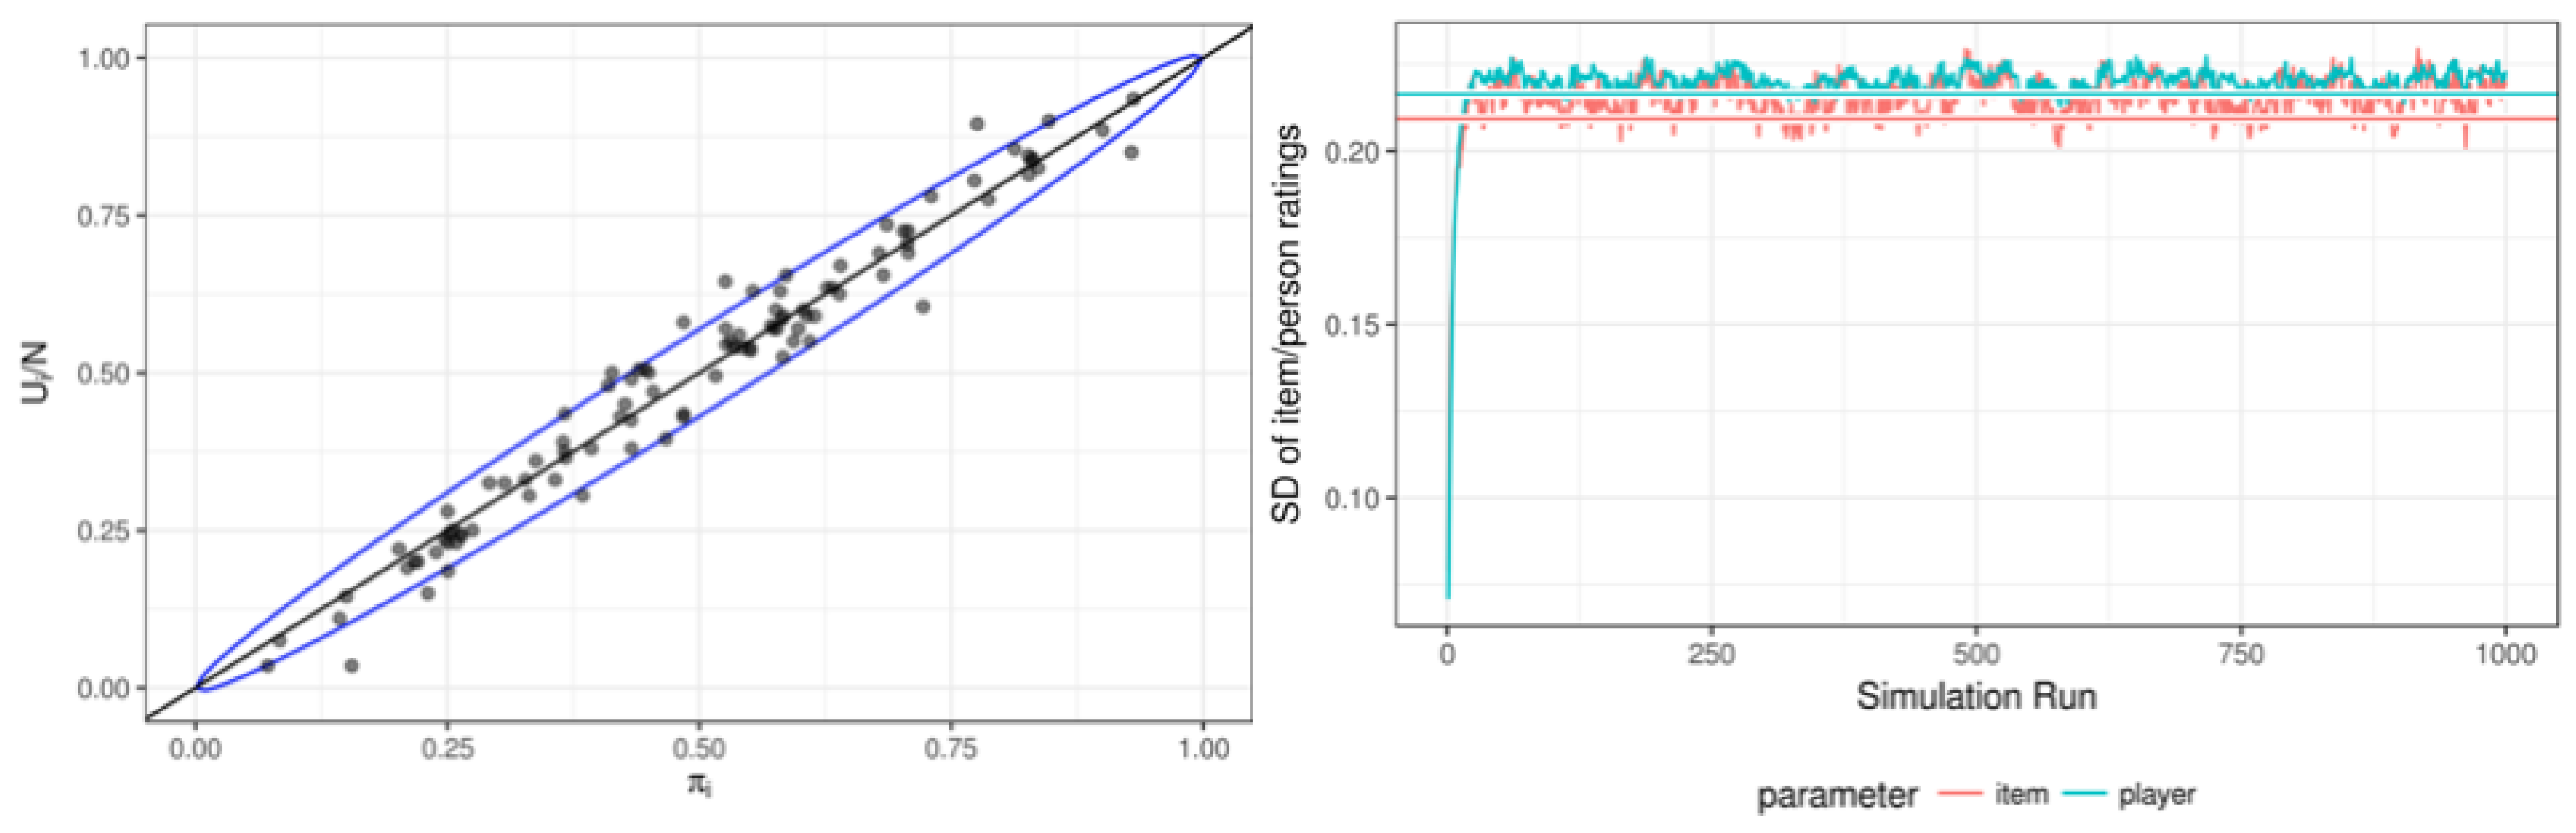
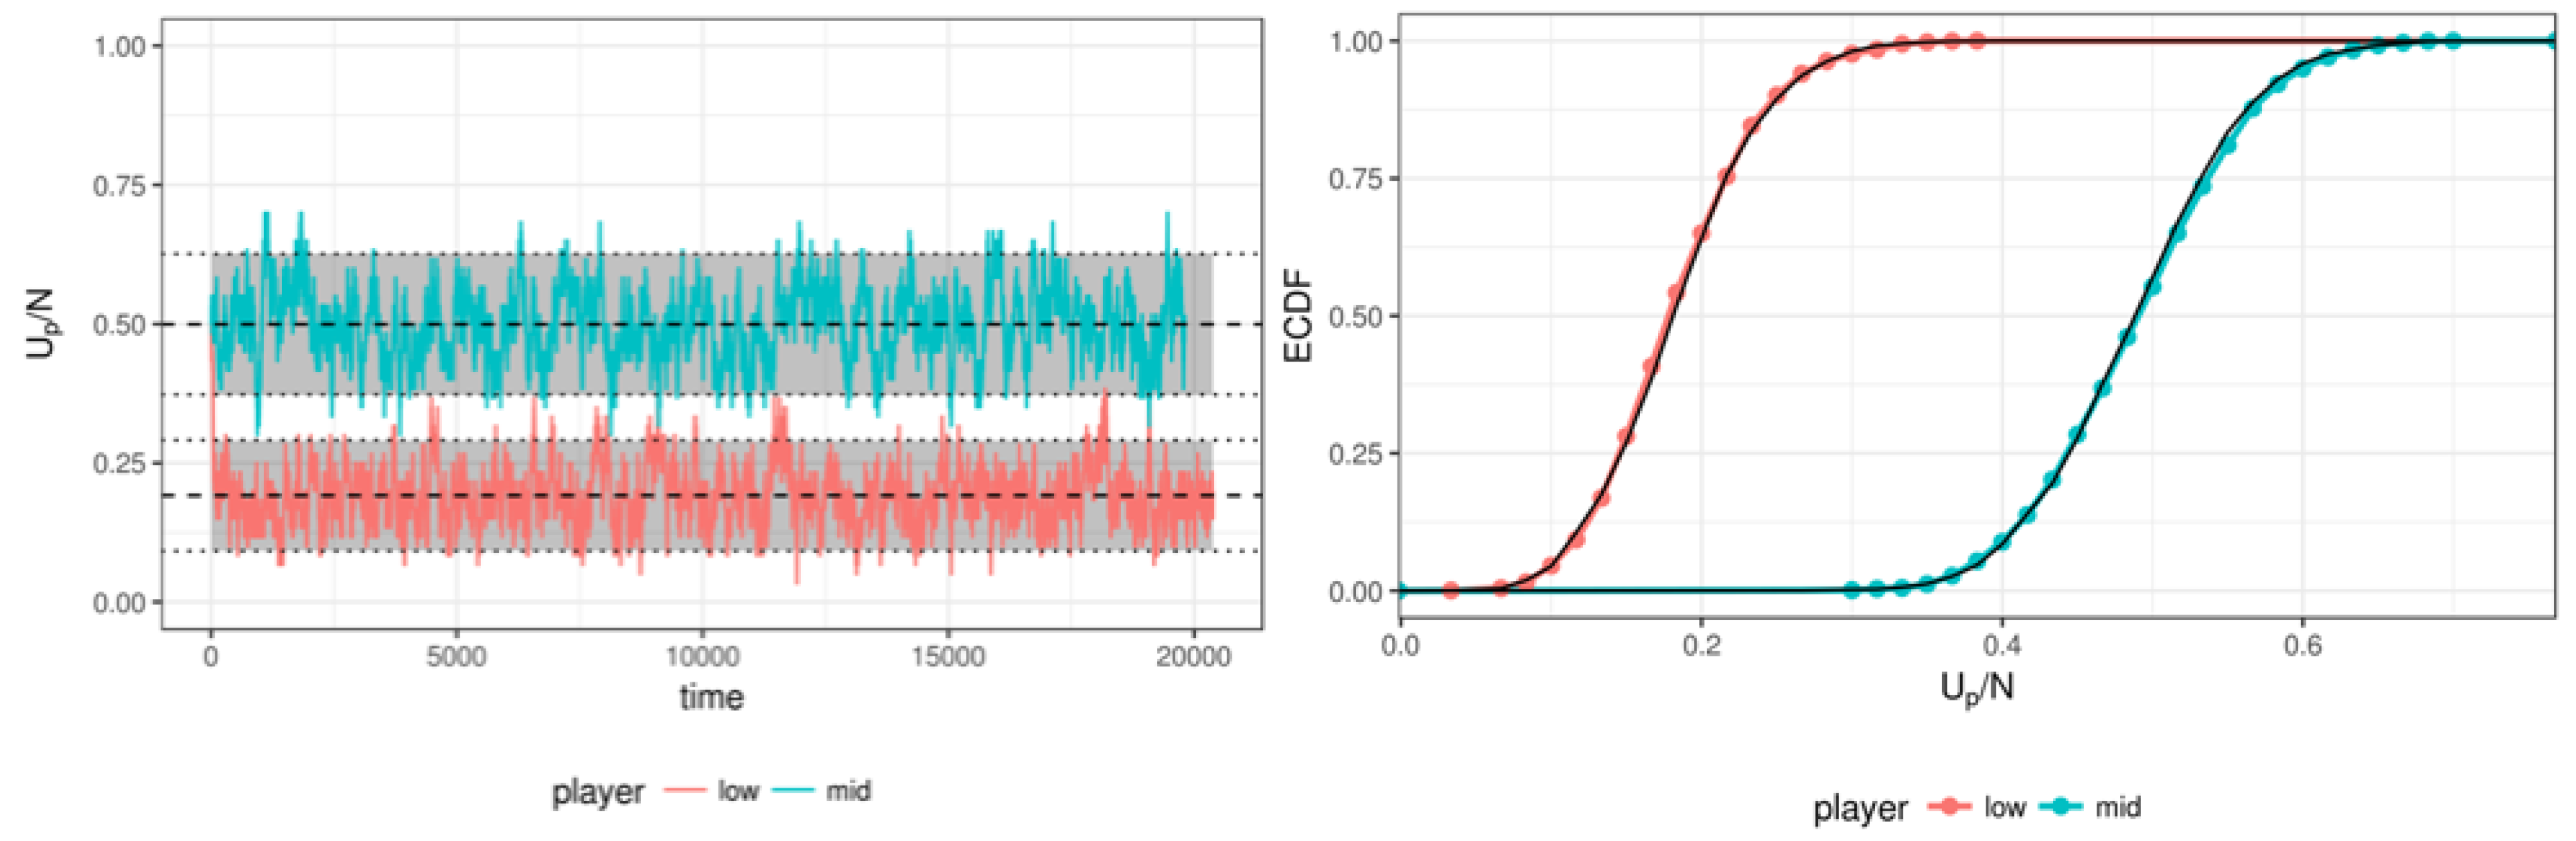
3.1. Simulation Results
3.2. Real Data Example: Math Garden
3.2.1. Description of the Data
3.2.2. Results
4. Discussion
Author Contributions
Funding
Conflicts of Interest
Abbreviations
| ERS | Elo Rating System |
| CAL | Computer Adaptive Learning |
| BKT | Bayesian Knowledge Tracing |
| IRT | Item Response Theory |
Appendix A. Illustration of the MH-Step

References
- Abbakumov, Dmitry, Piet Desmet, and Wim Van den Noortgate. 2018. Measuring growth in students’ proficiency in MOOCs: Two component dynamic extensions for the Rasch model. Behavior Research Methods. [Google Scholar] [CrossRef]
- Batchelder, William H., and Neil J. Bershad. 1979. The statistical analysis of a Thurstonian model for rating chess players. Journal of Mathematical Psychology 19: 39–60. [Google Scholar] [CrossRef]
- Brinkhuis, Matthieu J. S. 2014. Tracking Educational Progress. Ph.D. Thesis, University of Amsterdam, Amsterdam, The Netherlands. [Google Scholar]
- Brinkhuis, Matthieu J. S., and Gunter Maris. 2008. Student monitoring using chess ratings. Paper presented at the 23rd International Workshop on Statistical Modelling, Basque, Spain, July 19–24, vol. 23, pp. 137–42. [Google Scholar]
- Brinkhuis, Matthieu J. S., and Gunter Maris. 2009. Dynamic Parameter Estimation in Student Monitoring Systems. Report 09-01. Arnhem: Measurement and Research Department. [Google Scholar]
- Brinkhuis, Matthieu J. S., and Gunter Maris. 2010. Adaptive Estimation: How to Hit a Moving Target. Report 10-01. Arnhem: Measurement and Research Department. [Google Scholar]
- Brinkhuis, Matthieu J. S., and Gunter Maris. 2019a. Dynamic estimation in the extended marginal Rasch model with an application to mathematical computer-adaptive practice. British Journal of Mathematical and Statistical Psychology. [Google Scholar] [CrossRef]
- Brinkhuis, Matthieu J. S., and Gunter Maris. 2019b. Tracking Ability: Defining Trackers for Measuring Educational Progress. In Theoretical and Practical Advances in Computer-Based Educational Measurement. Edited by Bernard P. Veldkamp and Cor Sluijter. Berlin: Methodology of Educational Measurement and Assessment, Springer International Publishing, chp. 8. pp. 161–73. [Google Scholar] [CrossRef]
- Brinkhuis, Matthieu. J. S., Marjan Bakker, and Gunter Maris. 2015. Filtering data for detecting differential development. Journal of Educational Measurement 52: 319–38. [Google Scholar] [CrossRef]
- Brinkhuis, Matthieu J. S., Alexander O. Savi, Frederik Coomans, Abe D. Hofman, Han L. J. van der Maas, and Gunter Maris. 2018. Learning As It Happens: A Decade of Analyzing and Shaping a Large-Scale Online Learning System. Journal of Learning Analytics 5: 29–46. [Google Scholar] [CrossRef]
- Chib, Siddhartha, and Edward Greenberg. 1995. Understanding the Metropolis-Hastings algorithm. The American Statistician 49: 327–35. [Google Scholar] [CrossRef]
- de Bree, Elise, Sanne van der Ven, and Han L. J. van der Maas. 2017. The voice of Holland: Allograph production in written Dutch past tense inflection. Language Learning and Development 13: 215–40. [Google Scholar] [CrossRef]
- Deonovic, Benjamin, Michael Yudelson, Maria Bolsinova, Meirav Attali, and Gunter Maris. 2018. Learning meets assessment. Behaviormetrika 45: 457–74. [Google Scholar] [CrossRef]
- Elo, Arpad E. 1978. The Rating of Chess Players, Past and Present. London: B. T. Batsford, Ltd. [Google Scholar]
- Gierasimczuk, Nina, Han L. J. van der Maas, and Maartje E. J. Raijmakers. 2013. An analytic tableaux model for deductive mastermind empirically tested with a massively used online learning system. Journal of Logic, Language and Information 22: 297–314. [Google Scholar] [CrossRef]
- Glickman, Mark E. 2001. Dynamic Paired Comparison Models with Stochastic Variances. Journal of Applied Statistics 28: 673–89. [Google Scholar] [CrossRef]
- Herbrich, Ralf, Tom Minka, and Thore Graepel. 2006. TrueSkill: A Bayesian Skill Rating System. In Advances in Neural Information Processing Systems. Edited by Bernhard Schölkopf, John Platt and T. Hoffman. Cambridge: MIT Press; vol. 19, pp. 569–76. [Google Scholar]
- Hofman, Abe D., Ingmar Visser, Brenda R. J. Jansen, and Han L. J. van der Maas. 2015. The balance-scale task revisited: A comparison of statistical models for rule-based and information-integration theories of proportional reasoning. PLoS ONE 10: e0136449. [Google Scholar] [CrossRef]
- Hofman, Abe D., Ingmar Visser, Brenda R. J. Jansen, Maarten Marsman, and Han L. J. van der Maas. 2018a. Fast and slow strategies in multiplication. Learning and Individual Differences 68: 30–40. [Google Scholar] [CrossRef]
- Hofman, Abe D., Rogier A. Kievit, Claire E. Stevenson, Dylan Molenaar, Ingmar Visser, and Han L. J. van der Maas. 2018b. The Dynamics of the Development of Mathematics Skills: A Comparison of Theories of Developing Intelligence. Available online: https://osf.io/xa2ft/ (accessed on 22 March 2018). [CrossRef]
- Hofman, Abe D., Brenda R. J. Jansen, Susanne M. M. de Mooij, Claire E. Stevenson, and Han L. J. van der Maas. 2018c. A solution to the measurement problem in the idiographic approach using computer adaptive practicing. Journal of Intelligence 6: 14. [Google Scholar] [CrossRef]
- Jansen, Brenda R. J., Abe D. Hofman, Marthe Straatemeier, Bianca M. C. W. van Bers, Maartje E. J. Raijmakers, and Han L. J. van der Maas. 2014. The role of pattern recognition in children’s exact enumeration of small numbers. British Journal of Developmental Psychology 32: 178–94. [Google Scholar] [CrossRef] [PubMed]
- Jansen, Brenda R., Abe D. Hofman, Alexander O. Savi, Ingmar Visser, and Han L. J. van der Maas. 2016. Self-adapting the success rate when practicing math. Learning and Individual Differences 51: 1–10. [Google Scholar] [CrossRef]
- Klinkenberg, Sharon, Marthe Straatemeier, and Han L. J. van der Maas. 2011. Computer adaptive practice of Maths ability using a new item response model for on the fly ability and difficulty estimation. Computers & Education 57: 1813–24. [Google Scholar] [CrossRef]
- Maris, Gunter, and Han L. J. Van der Maas. 2012. Speed-accuracy response models: Scoring rules based on response time and accuracy. Psychometrika 77: 615–33. [Google Scholar] [CrossRef]
- Maris, Gunter, Maria Bolsinova, Abe D. Hofman, Han L. J. van der Maas, and Matthieu J. S. Brinkhuis. 2020. Urnings: A Rating System. Available online: https://osf.io/nep6a/ (accessed on 14 January 2020).
- Minka, Tom, Ryan Cleven, and Yordan Zaykov. 2018. TrueSkill 2: An improved Bayesian skill rating system. Technical Report. Available online: https://www.microsoft.com/en-us/research/uploads/prod/2018/03/trueskill2.pdf (accessed on 22 March 2018).
- Papoušek, Jan, Vít Stanislav, and Radek Pelánek. 2016. Evaluation of an adaptive practice system for learning geography facts. Paper presented at the Sixth International Conference on Learning Analytics & Knowledge, Edinburgh, UK, April 25–29; pp. 134–42. [Google Scholar]
- Park, Jung Yeon, Seang-Hwane Joo, Frederik Cornillie, Han L. van der Maas, and Wim Van den Noortgate. 2018. An explanatory item response theory method for alleviating the cold-start problem in adaptive learning environments. Behavior Research Methods 51: 1–15. [Google Scholar] [CrossRef] [PubMed]
- Pelánek, Radek, Jan Papoušek, Jiri Řihák, Vit Stanislav, and Juraj Nižnan. 2017. Elo-based learner modeling for the adaptive practice of facts. User Modeling and User-Adapted Interaction 27: 89–118. [Google Scholar] [CrossRef]
- Savi, Alexander O., Han L. J. van der Maas, and Gunter Maris. 2018. The Wiring of Intelligence. Perspectives on Psychological Science 14: 1034–61. [Google Scholar] [CrossRef]
- Siegler, Robert S. 1976. Three aspects of cognitive development. Cognitive Psychology 8: 481–520. [Google Scholar] [CrossRef]
- Straatemeier, Marthe. 2014. Math Garden: A New Educational and Scientific Instrument. Ph.D. Thesis, University of Amsterdam, Amsterdam, The Netherlands. [Google Scholar]
- Van Den Bergh, Mattis, Abe D. Hofman, Verena D. Schmittmann, and Han L. J. Van Der Maas. 2015. Tracing the development of typewriting skills in an adaptive e-learning environment. Perceptual and Motor Skills 121: 727–45. [Google Scholar] [CrossRef]
- van der Maas, Han L. J., and Enkhbold Nyamsuren. 2017. Cognitive analysis of educational games: The number game. Topics in Cognitive Science 9: 395–412. [Google Scholar] [CrossRef]
- van der Maas, Han L. J., Connor V. Dolan, Raoul P. P. P. Grasman, Jelte M. Wicherts, Hilde M. Huizenga, and Maartje E. J. Raijmakers. 2006. A dynamical model of general intelligence: the positive manifold of intelligence by mutualism. Psychological Review 113: 842. [Google Scholar] [CrossRef] [PubMed]
- van der Ven, Sanne H. G., Marthe Straatemeier, Brenda R. J. Jansen, Sharon Klinkenberg, and Han L. J. van der Maas. 2015. Learning multiplication: An integrated analysis of the multiplication ability of primary school children and the difficulty of single digit and multidigit multiplication problems. Learning and Individual Differences 43: 48–62. [Google Scholar] [CrossRef]
- van der Ven, Sanne H. G., Jonathan D. Klaiber, and Han L. J. van der Maas. 2017. Four and twenty blackbirds: How transcoding ability mediates the relationship between visuospatial working memory and math in a language with inversion. Educational Psychology 37: 487–505. [Google Scholar] [CrossRef][Green Version]
| 1. | see Deonovic et al. (2018) for a description of the relation between IRT and BKT. |
| 2. | In international chess competitions, this is also recognized, the FIDE handbook describes how rating drift should be monitored in article 10, https://www.fide.com/fide/handbook.html?id=197&view=article. |
| 3. | The interested reader can find the simulation code in the following OSF project: https://osf.io/8wgvb/. |
| 4. | This is lower than for the persons, but not inconsistent with the 95% confidence interval since there are only 100 items. |
| 5. | In comparing observed and expected rating distributions, the proper error distribution is added to the expected ratings, see for example (Brinkhuis 2014). |
| 6. | The interested reader can find the code to estimate the Urnings algorithm in this OSF project: https://osf.io/8wgvb/ and access to the data can be acquired by contacting the first author. |


© 2020 by the authors. Licensee MDPI, Basel, Switzerland. This article is an open access article distributed under the terms and conditions of the Creative Commons Attribution (CC BY) license (http://creativecommons.org/licenses/by/4.0/).
Share and Cite
Hofman, A.D.; Brinkhuis, M.J.S.; Bolsinova, M.; Klaiber, J.; Maris, G.; van der Maas, H.L.J. Tracking with (Un)Certainty. J. Intell. 2020, 8, 10. https://doi.org/10.3390/jintelligence8010010
Hofman AD, Brinkhuis MJS, Bolsinova M, Klaiber J, Maris G, van der Maas HLJ. Tracking with (Un)Certainty. Journal of Intelligence. 2020; 8(1):10. https://doi.org/10.3390/jintelligence8010010
Chicago/Turabian StyleHofman, Abe D., Matthieu J. S. Brinkhuis, Maria Bolsinova, Jonathan Klaiber, Gunter Maris, and Han L. J. van der Maas. 2020. "Tracking with (Un)Certainty" Journal of Intelligence 8, no. 1: 10. https://doi.org/10.3390/jintelligence8010010
APA StyleHofman, A. D., Brinkhuis, M. J. S., Bolsinova, M., Klaiber, J., Maris, G., & van der Maas, H. L. J. (2020). Tracking with (Un)Certainty. Journal of Intelligence, 8(1), 10. https://doi.org/10.3390/jintelligence8010010