Article

The Sternberg Triarchic Abilities Test (Level-H) is a Measure of g

1
Advanced Medical & Dental Institute, Universiti Sains Malaysia, Bandar Putra Bertam, Kepala Batas 13200, Pulau Pinang, Malaysia
2
Case Western Reserve University, 10900 Euclid Avenue, Cleveland, OH 44106, USA
*
Author to whom correspondence should be addressed.
These authors contributed equally to this work.
J. Intell. 2014, 2(3), 56-67; https://doi.org/10.3390/jintelligence2030056
Submission received: 15 January 2014 / Revised: 20 May 2014 / Accepted: 12 June 2014 / Published: 9 July 2014

Abstract

:
Although the consensus in the field of human intelligence holds that a unitary factor (g) accounts for the majority of the variance among individuals, there are still some who argue that intelligence is composed of separate abilities and individual differences across abilities in combination are what constitutes intelligence. In keeping with the latter theoretical support, the Sternberg Triarchic Abilities Test (STAT) is an intelligence test that is designed to measure three distinct types of intelligence: analytical, practical, and creative. Several analyses were conducted to establish whether or not the triarchic model is empirically supported, or if a unitary construct is the best explanation of individual differences on this test. Exploratory and confirmatory factor analyses indicate that a g model is the best explanation for the data.

1. Introduction

A decade has gone by since the debate about the validity of Sternberg’s Triarchic Ability Test (STAT) [1,2,3]. Although the general consensus in the field of intelligence is that intelligence is best represented by a unitary factor, g [4], and that g is best modeled as a hierarchical construct [5], the notion that intelligence is multi-faceted or that multiple intelligence exist still pervades the field [6,7,8,9]. Specifically, the STAT Level H is still used to assess the three separate abilities—analytical, creative and practical—and research in the field of education maintains interest in the abilities proposed by Sternberg [6,8,10].
According to Sternberg [11], analytical intelligence involves analyzing, evaluating, judging, comparing and contrasting information in an abstract manner. This type of intelligence is typically used in academic settings and is usually what is accounted for by g. Creative intelligence is measured by problems that assess how well an individual copes with relative novelty. Practical intelligence involves application of an individual’s abilities to the kinds of problems that arise in daily life by adapting to, shaping and selecting the environment [11]. Sternberg states that practical intelligence is a better predictor of successful academic and occupational outcome in life than standard IQ tests and other cognitive tests that are primarily measures of g. Sternberg has published several studies supporting the effectiveness of assessing practical intelligence [11,12,13], but Gottfredson’s [2] critique finds his evidence lacking. Koke and Vernon [14] found mixed evidence for Sternberg’s view of intelligence [11]. Sternberg holds that g is a narrow construct comprised primarily of academic ability; however, IQ tests predict school grades and job performance equally well [15]. In his evaluation of Sternberg’s theory, Hunt [16] suggests that Sternberg has expanded the construct of crystallized intelligence [17] with his assessments of practical intelligence that are essentially accumulated knowledge in specific and relevant contexts. Additionally, he applauds Sternberg’s efforts in advocating ability assessment as part of educational and skill training [16].
Sternberg and his colleagues [13] performed a confirmatory factor analysis on STAT Level H [18], and concluded that a second-order factor model based on the triarchic theory of intelligence best fitted the empirical data obtained from three international samples. Though they admitted that the model was “far from perfect”, they were confident that their results supported the notion that intelligence consisted of analytical, creative and practical abilities [13]. Testing several different path models including a g model, a model with nine individual subtests, three content factors and triarchic factors, Sternberg [13] concluded that the triarchic model provided the best fit. Although they used path models that were specific to triarchic theory, they only tested one alternative non-triarchic g model, which may have been unrealistically restrictive. Furthermore, one of the co-authors in the Sternberg et al. study [13], J. Hautamäki believed that the results from the Finnish population could also be interpreted with a single higher-order factor [19].
The current study was designed to replicate the primary methods used in the study by Sternberg and colleagues [13]: namely confirmatory factor analysis of data from American college students. In addition, academic outcome measures such as grade point average (GPA) and college entrance exams (ACT/SAT) were included in selected confirmatory factor analysis models to determine the predictive validity of the STAT. Sternberg [20] himself admitted that there was no published test as of then that truly measured the triarchic abilities. He and his colleagues [21] mentioned that the multiple-choice version of the STAT failed to measure three separate abilities, but there were still studies [6,8,9] besides Sternberg’s work that employed this version to study analytical, creative and practical abilities. Therefore, the analyses in this study aim to establish that the STAT Level H [18] in actuality measures a unitary factor model.

2. Methods

2.1. Participants

Three hundred fifty-six undergraduate students (110 males, 246 females) enrolled in psychology classes at two universities volunteered to participate. University 1 (n = 246) was a private research university with a small undergraduate enrollment. University 2 (n = 110) was a state university with open enrollment and a larger undergraduate population. Most of the students were enrolled in general psychology courses (n = 335) and were first semester freshmen (n = 245). All participants were given research participation credit or extra credit for the psychology class in which they were enrolled at the time.

2.2. Materials

A study questionnaire was administered to all participants and sections included demographic questions, evaluation and outcome questions. All variables, such as GPA and ACT or SAT score, were self-reported. After completing the questionnaire, participants were given the Sternberg Triarchic Abilities Test (STAT), Level H [18]. The STAT includes nine sections designed to assess three types of intelligence: analytical, creative and practical. It consists of 36 questions, all of which are multiple-choice.

2.3. Procedure

Students enrolled in general psychology at University 1 were invited to participate for research participation credit via an email announcement. The email contained instructions and a link to the website that contained the questionnaire. Students from University 2 signed up to participate in the study on a sheet posted on the psychology department bulletin board and reported to the computer lab at the appointed time. The entire questionnaire took approximately 1.5 h to complete, and the STAT itself took approximately 1 h to complete.

2.4. Statistical Procedure

Data collected from the study were analyzed for correlational values among all variables before subjecting them to a principal component analysis to extract the common variance among all variables. The extracted common variance was then correlated with the main variables GPA, ACT/SAT (ACT scores were converted to SAT scores following the ACT-SAT concordance from the ACT website), scores from STAT total, analytical, creative, practical, verbal, quantitative and figural. Subsequently, confirmatory factor analyses were conducted to determine the model that best describes the data and predicts academic achievement.

3. Results

3.1. Descriptive Statistics

Thirteen participants did not answer more than 16 questions on the STAT test, and their scores were dropped from the analysis; the total sample size was 343. Table 1 lists the characteristics of the participants in terms of academic achievement.
Table 1. Sample characteristics of the two populations used in the study—University 1 is a private research university and University 2 is a state university with open enrollment. GPA: grade point average; ACT: American College Testing; SAT: Scholastic Aptitude Test.
High School GPACollege GPAACT/SAT
University 1University 2University 1University 2University 1University 2
N231104626422890
Mean3.883.323.263.0013121021
SD0.320.640.510.72138171
Skew−0.53−1.01−0.75−0.62−0.930.12
Kurtosis2.370.680.04−0.203.81−0.70
Minimum2.401.401.901.30530600
Maximum4.854.384.004.0016001350

3.2. Reliability

The total score on the STAT was found to be statistically reliable, with overall good internal consistency (α = 0.85 using Cronbach’s Alpha). Only the analytical subtest was found to be statistically reliable (α = 0.70), while the creative and practical subtests were below the cut-off value for acceptable reliability (α = 0.60 and 0.66, respectively).
We also checked the internal consistency of the verbal, quantitative and figural content items in the STAT. The quantitative items had a good reliability index (α = 0.83). The verbal (α = 0.51) and figural (α = 0.57) items had poor statistical reliability.

3.3. Correlations.

Pearson product moment correlations were calculated to explore the relationships among the STAT scores (total as well as each of the three parts), performance on the SAT or ACT, and high school and college GPA. Only reported ACT/SAT scores and GPA were included in the correlations. As presented in Table 2, correlations between the total STAT score and each of the subtests, as well as the correlations between each of the subtests were high. The correlations between the STAT, ACT/SAT, and GPA were modest. Note that a majority of the students (n = 217) did not report college GPA because they were in their first semester of college. Preliminary analysis did not show any significant gender differences in the outcomes of the variables used in the study.
Table 2. Correlation matrix for all variables.
Measure (N)12345678910MeanSD
1.High School GPA (335) 3.710.51
2.College GPA (126)0.46 ** 3.130.64
3.ACT/SAT (318)0.52 **0.39 ** 1230198
4.STAT total (343)0.45 **0.31 **0.67 ** 19.746.73
5.STAT Analytical (343)0.40 **0.32 **0.64 **0.88 ** 6.702.78
6.STAT Creative (343)0.35 **0.29 **0.47 **0.83 **0.60 ** 6.372.49
7.STAT Practical (343)0.39 **0.19 *0.59 **0.86 **0.64 **0.57 ** 6.672.58
8.STAT Verbal (343)0.33 **0.34 **0.51 **0.77 **0.68 **0.63 **0.68 ** 7.402.26
9.STAT Quantitative (343)0.44 **0.25 **0.63 **0.90 **0.81 **0.75 **0.76 **0.55 ** 7.183.41
10.STAT Figural (343)0.31 **0.19 *0.49 **0.80 **0.69 **0.68 **0.69 **0.44 **0.58 **5.162.40
Skew−1.59−0.82−0.72−0.05−0.10−0.04−0.20−0.36−0.260.31
Kurtosis3.800.290.20−1.01−1.12−0.76−0.82−0.42−1.12−0.49
** p < 0.01; * p < 0.05; N: number of subjects; GPA: grade point average; ACT: American College Testing; SAT: Scholastic Aptitude Test; STAT: Sternberg Triarchic Abilities Test.

3.4. Principal Component Analysis.

A principal component analysis was conducted to determine the positive manifold of the STAT in the current sample. An unrotated principal components factor analysis indicated that the first factor accounted for 17.7% of the variance. The first factor from the unrotated principal component was then used as an index of g and correlated with the various variables. Table 3 showed that the g index highly correlated with the three STAT subtests and suggested almost a perfect linear relationship with STAT total score.
Table 3. Correlations between g as indicated by the first unrotated factor from principal component analysis and the various variables included in the study.
Measureg
High School GPA0.47 **
College GPA0.31 **
ACT/SAT0.68 **
STAT Total 0.98 **
STAT Analytical 0.87 **
STAT Creative 0.80 **
STAT Practical 0.85 **
STAT Verbal 0.71 **
STAT Quantitative 0.95 **
STAT Figural 0.74 **
** p < 0.01; GPA: grade point average; ACT: American College Testing; SAT: Scholastic Aptitude Test; STAT: Sternberg Triarchic Abilities Test.
It is also noted that the items with quantitative content in the STAT are also almost perfectly correlated with the g index. Combined with the observation of the high correlation between these items and the STAT total score (r = 0.90) and the high reliability of the quantitative items (α = 0.83), we discuss in Section 4 the possibility to reduce or fine-tune the STAT Level-H to just the quantitative items.

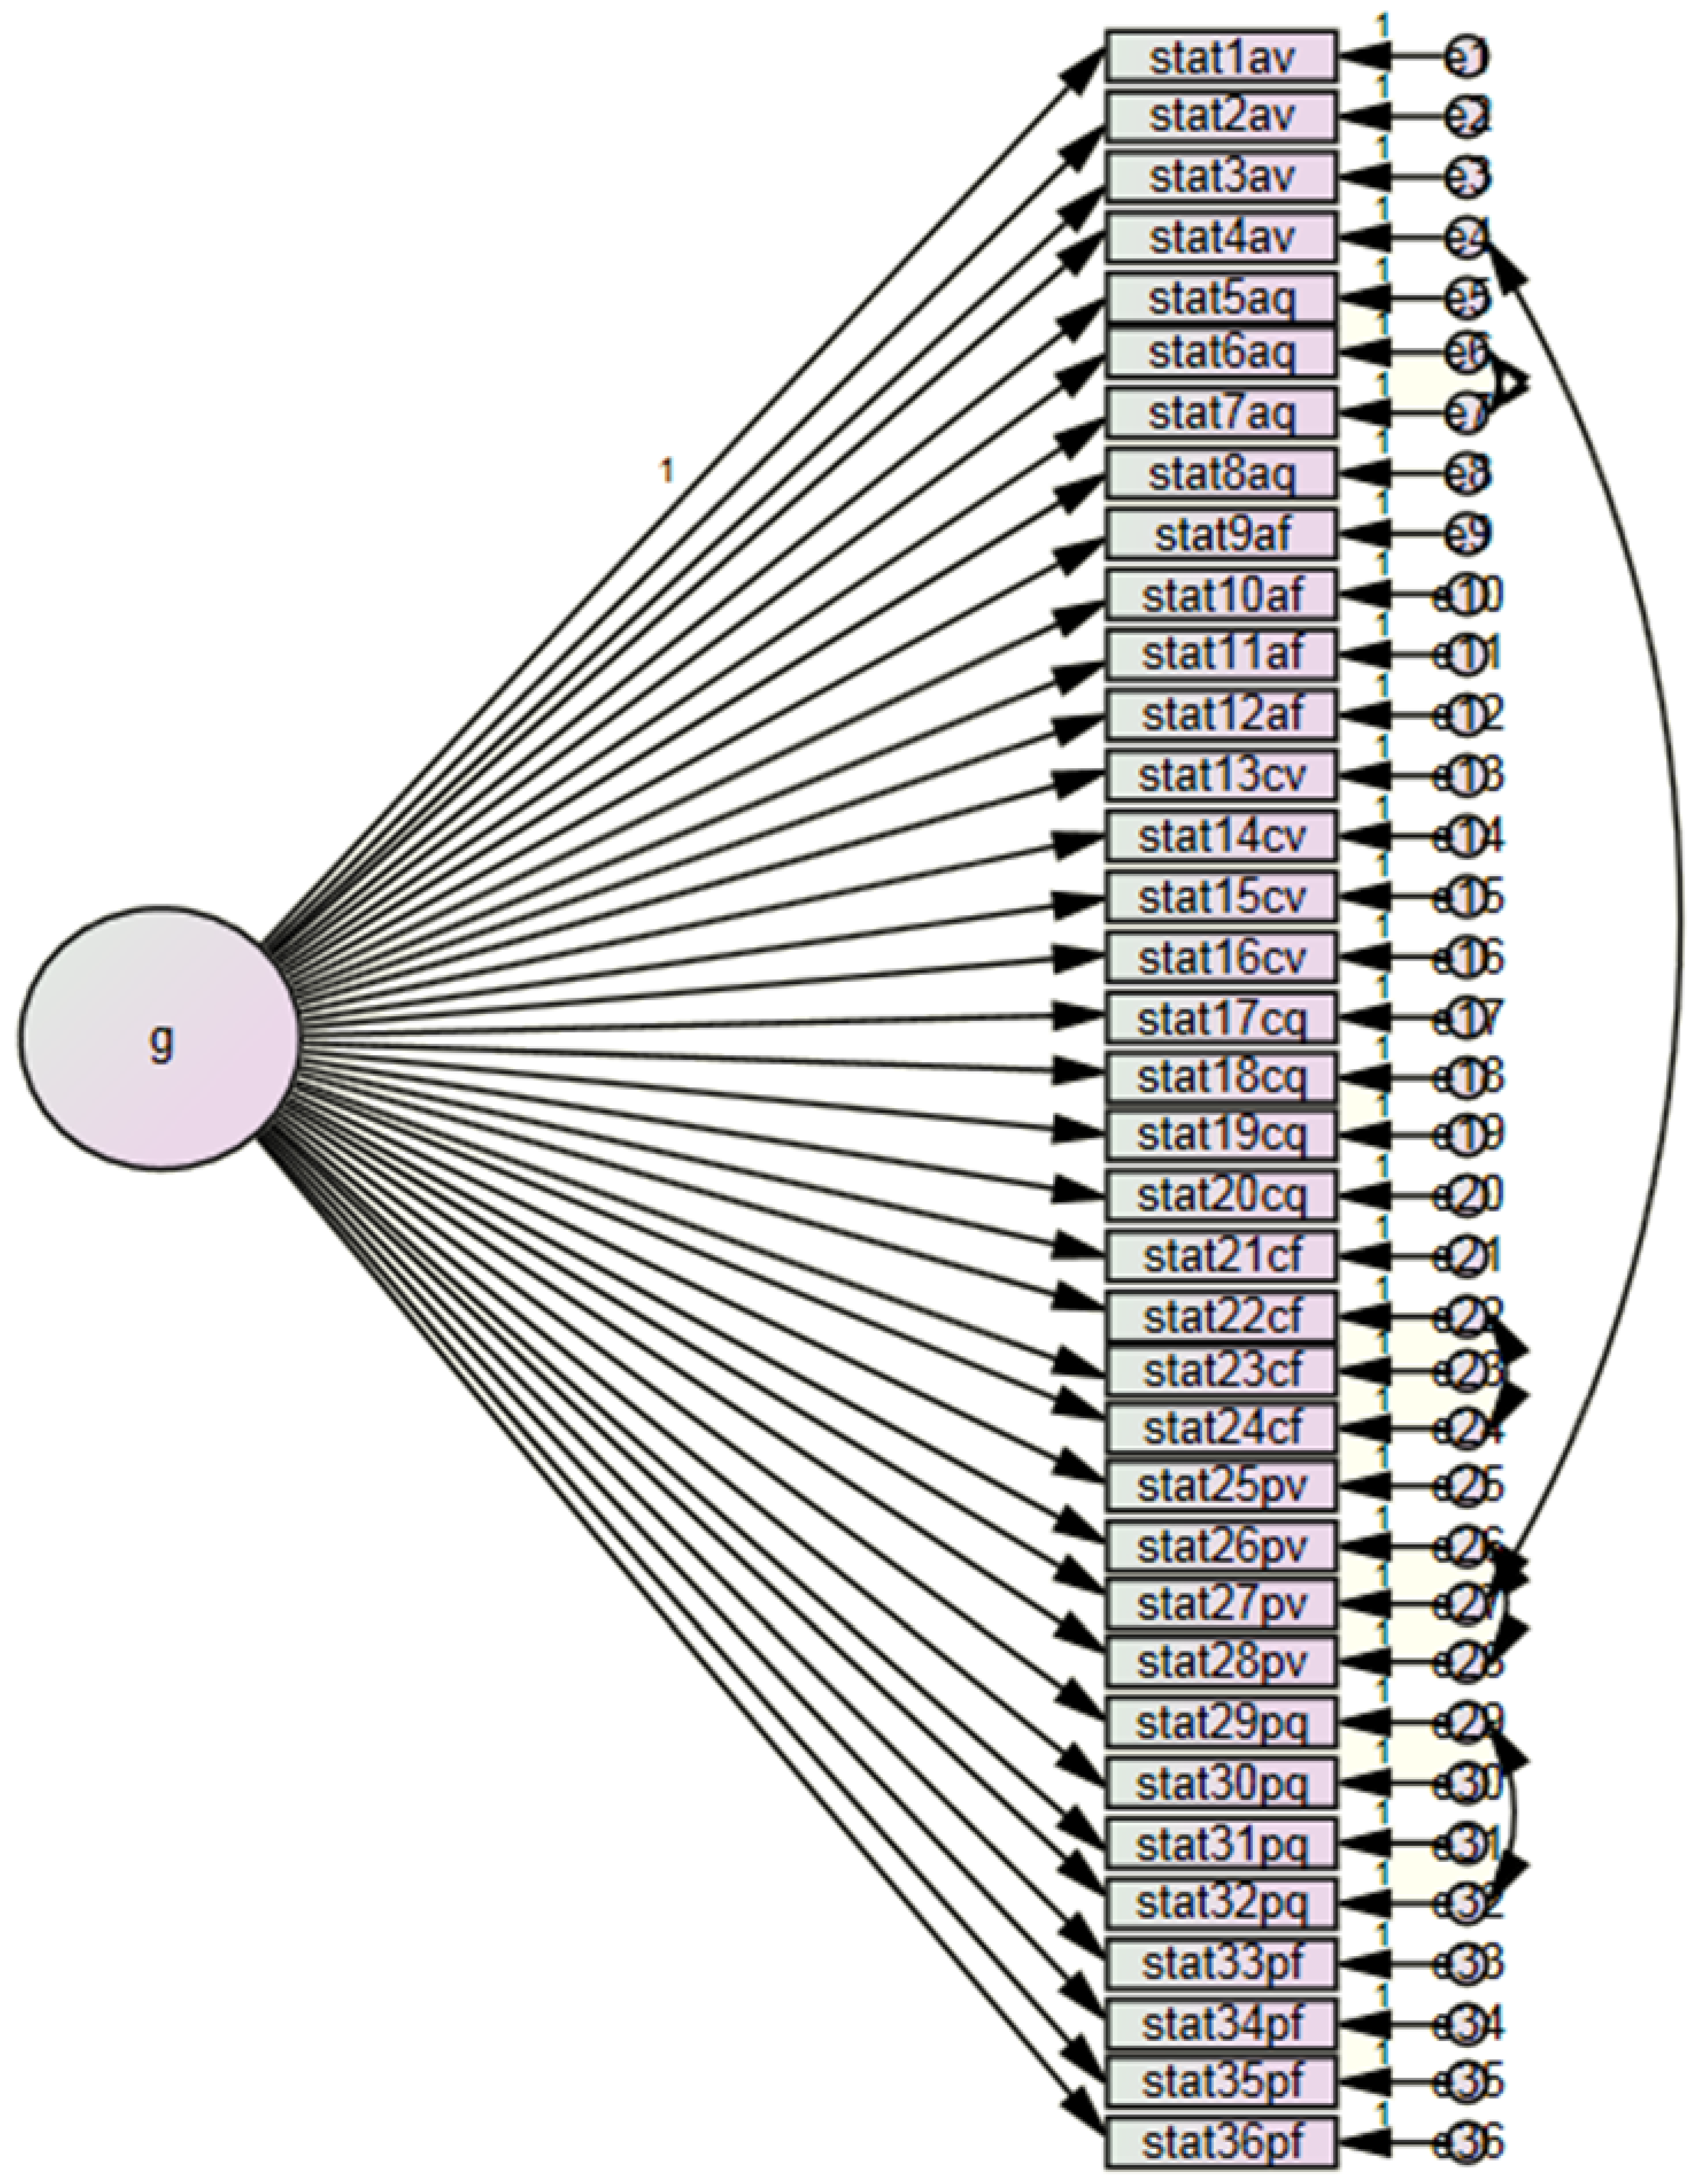
3.5. Confirmatory Factor Analysis (CFA)

A series of confirmatory factor analyses were conducted to test the fit of the models tested in Sternberg et al. [13]. The first model was a g model with only one general factor. This model was the most parsimonious, and was the model that Sternberg considered too simplistic. The second model included analytic, creative, and practical first order factors. Each of these factors contains all 12 items with the verbal, quantitative and figural contents that tested for the respective ability. This was the simplest triarchic model tested. The third model contained the first order verbal, quantitative, and figural factors. These factors therefore lump the analytic, creative and practical items according to its content. This model reproduced factors that have been traditionally found to reliably emerge from factor analyses of many different intelligence test batteries [22,23,24]. The fourth model tested was a nine-factor model, with the questions broken down into specific categories (i.e., analytic-verbal, creative-quantitative, practical-figural, etc.) and these nine factors were forced to be independent. This model tested whether the specific question categories accounted for the most variance. The next three models all had second order factors and nine first order factors with one testing a second order g factor (Model 5), one testing the triarchic factors (Model 6), and one testing the traditional verbal, quantitative, figural factors (Model 7). The eighth model was a hierarchical g model, with nine first order factors, three second order factors, and one third order factor. The final model (Figure 1) was a modification of the g model. Using the modification indices from the first g model, error terms for items that had the largest parameter change were allowed to covary one at a time until the best fit was obtained. Illustrations of the models described above are provided in supplementary figures S1 to S7.
Figure 1. Path model with one first order factor, g (general intelligence) and error variances (e) allowed to covary.
Jintelligence 02 00056 g001
Since some of the models tested in this section are non-nested models, model fitness is evaluated based on the following criteria: a good model fit will have Confirmatory Fit Indices (CFI) and Tucker-Lewis Index (TLI) values higher than 0.90, as well as Root Mean Square Error of Approximation (RMSEA) values lower than 0.05 [25].
Chi-square (χ2) statistics are reported as descriptive index of fit. Smaller values of χ2 indicate better fit; however, significant p-values (p < 0.05) are undesirable in model testing unlike hypothesis testing. Hence, χ2 values are not used in evaluating model fitness but values obtained from CFI, TLI and RMSEA.
The results were similar to the findings of Sternberg et al. [13] in that the fit was highly similar across all nine models tested (see Table 4), but overall, the models tested in the current study better fit the data than those tested by Sternberg et al. [13]. To compare model fits across non-nested models, the Bayesian Information Criteria (BIC) and Aikake’s Information Criterion (AIC) were used to determine if one model provided a significantly better fit over another. A difference of 10 is considered to be clear evidence in favor of the model with the more negative BIC [22]. The final model (Figure 1) was the best fitting model (BIC = 1112.8) for the data collected.
Table 4. Fit indices for the estimated models.
ModelCMINDFpAICBICRMSEACFITLI
Model 1: g771.5594<0.0005915.51191.80.030.890.88
Model 2:
ACP factors
740.0591<0.0005890.01177.80.030.910.90
Model 3:
VQF factors
738.7591<0.0005888.71176.60.030.910.90
Model 4:
9 factors
1483.3594<0.00051627.31903.60.050.460.43
Model 5:
g hierarchical 9 factors
692.1585<0.0005854.11165.00.020.930.93
Model 6:
ACP hierarchical 9 factors
691.6582<0.0005859.61182.00.020.930.93
Model 7:
VQF hierarchical 9 factors
674.1582<0.0005842.11164.40.020.940.94
Model 8: g hierarchical ACP factors691.6582<0.0005859.61181.90.020.930.93
Model 9: Modified g model663.3589<0.0005817.31112.80.020.950.95
CMIN: Chi-Square value; DF: degrees of freedom; AIC: Aikake’s Information Criterion; BIC: Bayesian Information Criteria; RMSEA: Root Mean Square Error of Approximation; CFI: Comparative Fit Indices; TLI: Tucker-Lewis Index.
Three models were tested using structural equation modeling to see which one best predicted performance on the ACT/SAT and GPA—the strictly triarchic model (Model 2), the hierarchical g model with Analytical, Creative and Practical as first order factors (Model 8) and the modified g model (Model 9/Final Model). These models were selected to compare the triarchic model proposed by Sternberg and the unitary intelligence model. The human intelligence literature has established a strong connection between academic achievement and intelligence [26]. Using ACT/SAT scores and GPA as outcome variables, we tested the three models to determine which model best predicted academic achievement. As the Aikake’s Information Criterion (AIC) values in Table 5 indicated, the modified g model had the best fit, as lower AIC values suggest a better fit [27]. All three models explained the most variance in the ACT/SAT scores (Table 6).
Table 5. Fit indices for models predicting academic achievement.
ModelCMINDFpAICRMSEACFITLI
Model 2: ACP factors916.2696<0.00051162.20.030.890.88
Model 8: g hierarchical ACP factors945.0700<0.00051183.00.030.880.86
Final Model: Modified g model873.3698<0.00051115.30.030.910.90
CMIN: Chi-Square value; DF: degrees of freedom; AIC: Aikake’s Information Criterion; BIC: Bayesian Information Criteria; RMSEA: Root Mean Square Error of Approximation; CFI: Comparative Fit Indices; TLI: Tucker-Lewis Index.
Table 6. Variances (multiple squared correlations) explained for ACT/SAT scores and grade point averages (GPA) by three models.
ModelMultiple Squared Correlations
ACT/SAT scoresCollege GPAHigh School GPa
Model 2: ACP factors0.770.220.30
Model 8: g hierarchical ACP factors0.610.150.20
Final Model: Modified g model0.580.140.20

4. Discussion

Several analyses including correlation, exploratory and confirmatory factor analysis as well as structural equation modeling were conducted in order to gain a better understanding of the STAT and the implications of Sternberg’s triarchic model. None of the analyses supported the triarchic model and all of the results indicated that the STAT Level-H may mainly be a measure of g.
As seen in Table 2, the correlations between the STAT total score and the subtests were high, ranging from 0.80–0.90, as were the correlations between each of the subtests. These results suggested that the subtests were not independent of one another and contrary to what Sternberg et al. [13] have claimed. The correlations in the present study were very similar to the results found by Sternberg and the Rainbow Project Collaborators [21], who used a revised version of the STAT. The modest positive correlations, ranging from 0.37 to 0.62, between the STAT, ACT/SAT, and GPA were consistent with other intelligence tests, which were good predictors of school performance. The high correlation between STAT and ACT/SAT was particularly of interest because Frey and Detterman [28] claimed that the SAT was mainly a test of g, which provided additional support that STAT was a good measure of g.
Sternberg [11] claimed that the Analytic score should be closely related to g, and that all three scores should be independent but the multiple choice format of the STAT would lead to weak correlations among these scores. There were no indications in the present data that the Analytic score was more closely related to g than the other two scores; moreover, all three subtests were highly correlated with g and with one another, thus refuting Sternberg’s claims that they were independent factors.
An examination of the first unrotated principal component that emerged from the exploratory factor analysis supported a general factor theory of intelligence. Principal component analysis (PCA) was essentially data reduction, and the analysis in this study showed that all 36 items could be reduced to one general factor. The pattern suggested that the STAT appeared to be a measure of g. Because the data did not reduce to three factors, these results do not support the triarchic model. Not only did total STAT scores correlate highly with the first factor extracted from PCA, but the items with quantitative content in the STAT are also almost perfectly correlated with this factor, which we refer to as the g index. Combined with the observation of the high correlation between these items and the STAT total score (r = 0.90) and the high reliability of the quantitative items (α = 0.83), we suggest that perhaps the STAT Level-H could be reduced to just the quantitative items. This shortened 12-item test from the original 36-item test could be used as a quick assessment for a reliable measure or indicator of academic achievement or general intellectual ability. We acknowledge that the shortened test may be no different than a math test, and there are studies providing support for the strong relationship between intelligence, executive functions, working memory and math achievement [29,30].
Several path models were analyzed in an attempt to replicate the findings of Sternberg et al. [13] and of the models run by them previously, the best fitting model was the model in which there were nine first order factors and three second order factors. This triarchic model was the model that Sternberg found to be the best fit. However, in the present study when a few highly correlated items were allowed to co-vary in the g model, it became the model that best fit the data. The results from this path model suggested that the g model was the best explanation for the data in the present study. By allowing unaccounted for variance in the error terms for highly related items to co-vary, the g model was greatly improved. It was also important to note that the hierarchical model that included the nine first order factors with the verbal, quantitative, and figural second order factors was a better fit than the model using the hierarchical triarchic factors. There was a BIC difference of 20 favoring the hierarchical content model, and this suggested that content factors may be more important in intelligence differentiation. This finding was in line with the results of Johnson and Bouchard [22,23,24]. They found that intelligence was best described as a four-strata hierarchical model with broad abilities (verbal, perceptual, and image rotation) on stratum III rather than a model of fluid and crystallized abilities. The categories in their research were closely related to the verbal, quantitative, and figural categories in the present study.
All of the analyses in the present study suggested that a g model was the best fit for the data collected. The present study had an advantage over the previous research by Sternberg et al. [13] because it combined two distinct and more varied populations of students in the analysis, whereas Sternberg and his colleagues used only gifted students in their study. Students at a small private college as well as students at a larger state university with open enrollment failed to show that the STAT measured three different abilities, rather than one general ability. The additional analyses that extended the Sternberg et al. [13] study supported the g model. This suggested that either the theory was faulty or the test itself did not measure the three distinct types of intelligence proposed by Sternberg.
The STAT Level-H has been around for about 20 years and is still being used to assess triarchic abilities—analytical, creative and practical. However, there was no evidence found in the present study to support the triarchic model of intelligence. The best explanation appeared to be that the test reflected one general factor of intelligence.

Author Contributions

The first and second authors were responsible for data analysis and writing the paper under the supervision of the third author. The second author collected data published in this paper. The third author contributed to the experimental design of the study.

Conflicts of Interest

The authors declare no conflict of interest

References

  1. Brody, N. Construct validity of the sternberg triarchic abilities test: Comment and analysis. Intelligence 2003, 31, 319–329. [Google Scholar] [CrossRef]
  2. Gottfredson, L.S. Dissecting practical intelligence theory: Its claims and evidence. Intelligence 2003, 31, 343–397. [Google Scholar] [CrossRef]
  3. Sternberg, R.J. Our research program validating the triarchic theory of successful intelligence: Reply to Gottfredson. Intelligence 2003, 31, 399–410. [Google Scholar] [CrossRef]
  4. Jensen, A.R. The g Factor: The Science of Mental Ability; Praeger: Westport, CT, USA, 1998. [Google Scholar]
  5. Deary, I.J. Human intelligence differences: A recent history. Trends Cognit. Sci. 2001, 5, 127–130. [Google Scholar] [CrossRef]
  6. Zhang, L.F. Do age and gender make a difference in the relationship between intellectual styles and abilities? Eur. J. Psychol. Educ. 2010, 25, 87–103. [Google Scholar] [CrossRef] [Green Version]
  7. Von Stumm, S.; Chamorro-Premuzic, T.; Furnham, A. Decomposing self-estimates of intelligence: Structure and sex differences across 12 nations. Br. J. Psychol. 2009, 100, 429–442. [Google Scholar] [CrossRef]
  8. Zhang, L.F. Revisiting the predictive power of thinking styles for academic performance. J. Psychol: Interdiscip. Appl. 2004, 138, 351–370. [Google Scholar] [CrossRef]
  9. Salekin, R.T.; Neumann, C.S.; Leistico, A.M.; Zalot, A.A. Psychopathy in youth and intelligence: An investigation of Cleckley’s hypothesis. J. Clin. Child Adolesc. Psychol. 2004, 33, 731–742. [Google Scholar] [CrossRef]
  10. Naderi, H.; Abdullah, R.; Hamid, T.A.; Sharir, J. Intelligence, creativity and gender as predictors of academic achievement among undergraduate students. J. Am. Sci. 2009, 5, 8–19. [Google Scholar]
  11. Sternberg, R.J. Successful intelligence: Finding a balance. Trends Cognit. Sci. 1999, 3, 436–442. [Google Scholar] [CrossRef]
  12. Sternberg, R.J.; Forsythe, G.B.; Hedlund, J.; Horvath, J.A.; Wagner, R.K. Practical Intelligence in Everyday Life; University Press: Cambridge, NY, USA, 2000. [Google Scholar]
  13. Sternberg, R.J.; Castejón, J.L.; Prieto, M.D.; Hautamäki, J.; Grigorenko, E.L. Confirmatory factor analysis of the Sternberg Triarchic Abilities Test in three international samples: An empirical test of the Triarchic Theory of Intelligence. Eur. J. Psychol. Assess. 2001, 17, 1–16. [Google Scholar] [CrossRef]
  14. Koke, L.C.; Vernon, P.A. The Sternberg Triarchic Abilities Test (STAT) as a measure of academic achivement and general intelligence. Pers. Individ. Differ. 2003, 35, 1803–1807. [Google Scholar] [CrossRef]
  15. Hunt, E. Will we be Smart Enough? A Cognitive Analysis of the Coming Workforce; Russell Sage: New York, NY, USA, 1995. [Google Scholar]
  16. Hunt, E. Human Intelligence; Cambridge University Press: New York, NY, USA, 2011. [Google Scholar]
  17. Cattell, R.B. Theory of fluid and crystallized intelligence: A critical experiment. J. Educ. Psychol. 1963, 54, 1–22. [Google Scholar] [CrossRef]
  18. Sternberg, R.J. Sternberg Triarchic Abilities Test (Modified), Level H, 1993.
  19. Carlstedt, B.; Gustafsson, J.; Hautamäki, J. Intelligence–Theory, Research and Testing in the Nordic Countries. In International Handbook of Intelligence; Sternberg, R.J., Ed.; Cambridge University Press: New York, NY, USA, 2004; pp. 49–78. [Google Scholar]
  20. Sternberg, R.J. North American Approaches to Intelligence. In International Handbook of Intelligence; Sternberg, R.J., Ed.; Cambridge University Press: New York, NY, USA, 2004. [Google Scholar]
  21. Sternberg, R.J.; Collaborators, T.R.P. The rainbow project: Enhancing the SAT through assessments of analytical, practical, and creative skills. Intelligence 2006, 34, 321–350. [Google Scholar] [CrossRef]
  22. Johnson, W.; Bouchard, T.J. The structure of human intelligence: It is verbal, perceptual, and image rotation (VPR), not fluid and crystallizd. Intelligence 2005, 33, 393–416. [Google Scholar] [CrossRef]
  23. Johnson, W.; Bouchard, T.J. Constructive replication of the visual-perception-image rotation model in Thurstone’s (1941) battery of 60 tests of mental ability. Intelligence 2005, 33, 417–430. [Google Scholar] [CrossRef]
  24. Johnson, W.; te Nijenhuis, J.; Bouchard, T.J. Replication of the hierarchical visual-perceptual-image rotation model in de Wolff and Buiten’s (1963) battery of 46 tests of mental ability. Intelligence 2007, 35, 69–81. [Google Scholar] [CrossRef]
  25. Hu, L.T.; Bentler, P.M. Cutoff criteria for fit indices in covariance structure analysis: Conventional criteria vs. new alternatives. Struct. Eq. Model. 1999, 6, 1–55. [Google Scholar]
  26. Deary, I.J.; Strand, S.; Smith, P.; Fernandes, C. Intelligence and educational achievement. Intelligence 2007, 35, 13–21. [Google Scholar]
  27. Hu, L.T.; Bentler, P.M. Evaluating Model Fit. In Structural Equation Modeling: Concepts, Issues, and Applications; Hoyle, R.H., Ed.; Sage: Thousand Oaks, CA, USA, 1995; pp. 76–99. [Google Scholar]
  28. Frey, M.C.; Detterman, D.K. Scholastic assessment or g? The relationship between the scholastic assessment test and general cognitive ability. Psychol. Sci. 2004, 15, 373–378. [Google Scholar] [CrossRef]
  29. Bull, R.; Lee, K. Executive functioning and mathematics achievement. Child Dev. Perspect. 2014, 8, 6. [Google Scholar] [CrossRef]
  30. Giofre, D.; Mammarella, I.C.; Cornoldi, C. The relationship among geometry, working memory, and intelligence in children. J. Exp. Child Psychol. 2014, 123, 112–128. [Google Scholar] [CrossRef]

