Planning, Cognitive Reflection, Inter-Temporal Choice, and Risky Choice in Chess Players: An Expertise Approach


Abstract
1. Introduction
Overview of the Present Study
2. Methods
2.1. Participants
2.2. Material
2.3. Statistical Analysis
3. Results
4. Discussion
Author Contributions
Funding
Institutional Review Board Statement
Informed Consent Statement
Data Availability Statement
Acknowledgments
Conflicts of Interest
Appendix A
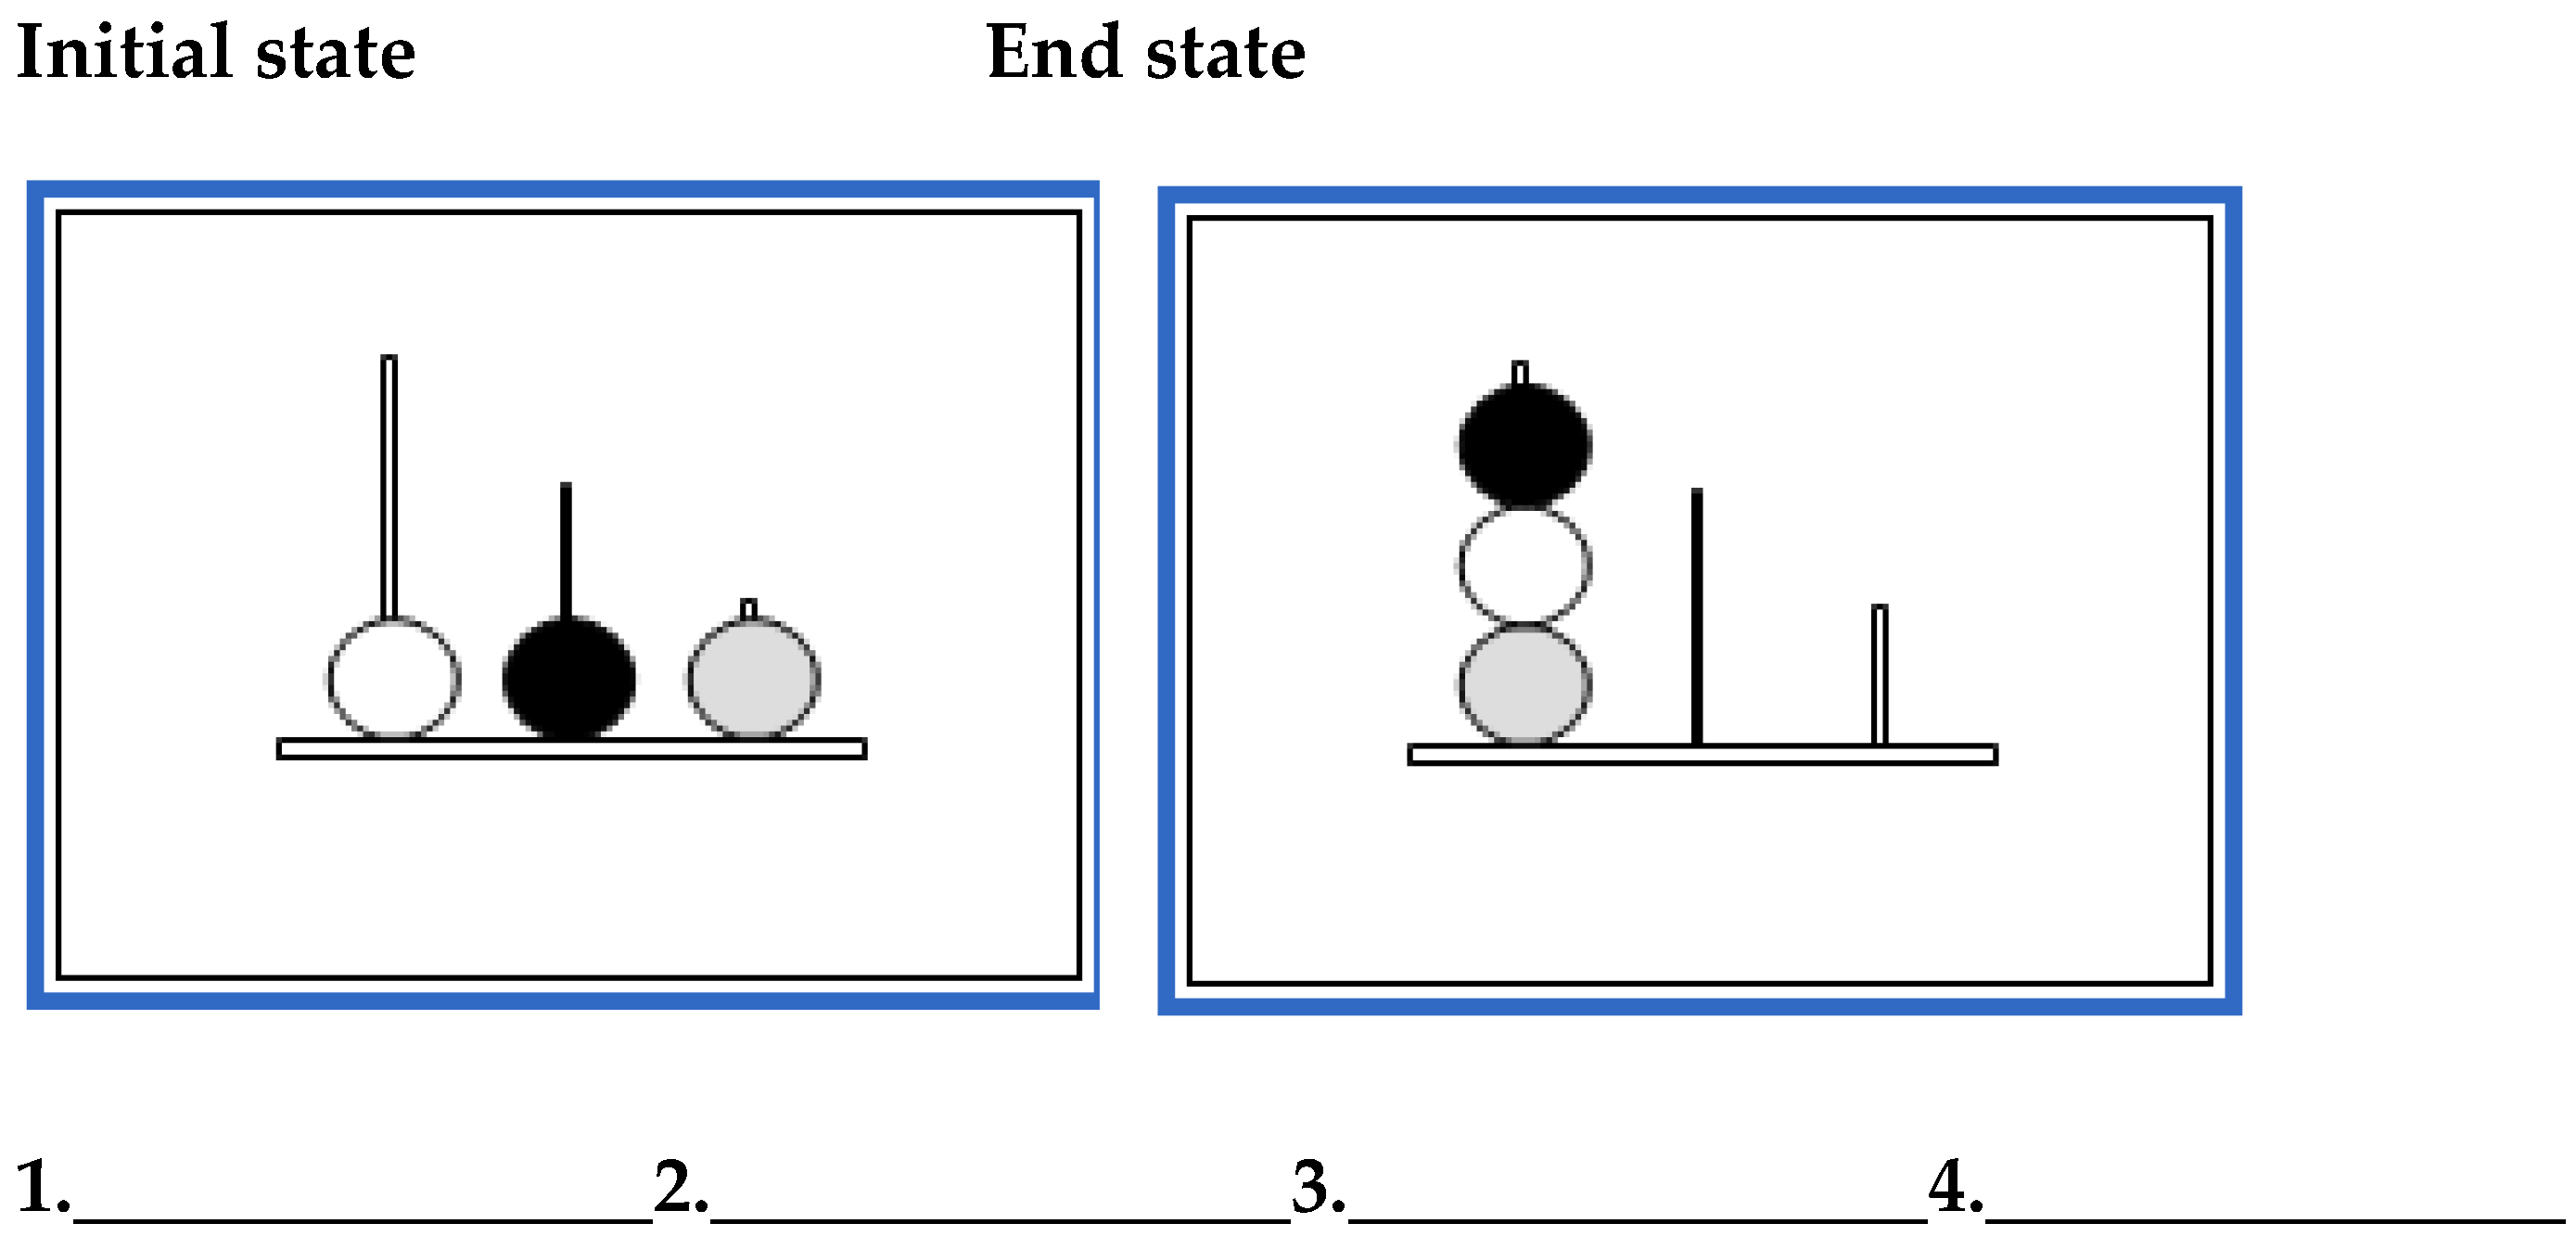
- Tower of London
- You can move one ball at a time.
- A ball cannot move when there is another ball on top of it.
- There can be a maximum of three balls in the left peg, a maximum of two balls in the middle peg, and a maximum of one ball in the right peg.
- The black ball is referred to as B; the grey ball is referred to as G; and the white ball is referred to as W.
- The left peg is referred to as 1; the middle peg is referred to as 2, and the right peg is referred to as 3.
- Write down each movement indicating the name of the ball that moves and then the number of the peg to which the ball will move.
- Problem 1. Number of Moves for the Solution: 4
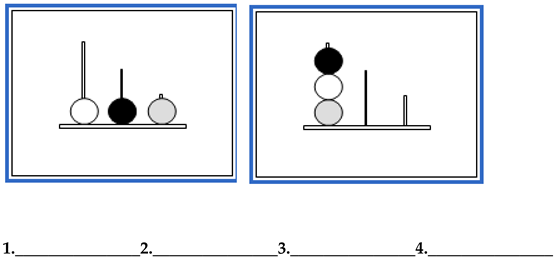
- Problem 2. Number of Moves for the Solution: 4
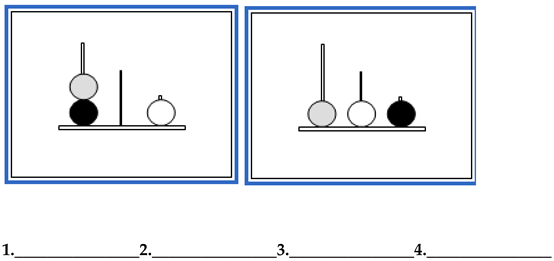
- Problem 3. Number of Moves for the Solution: 5
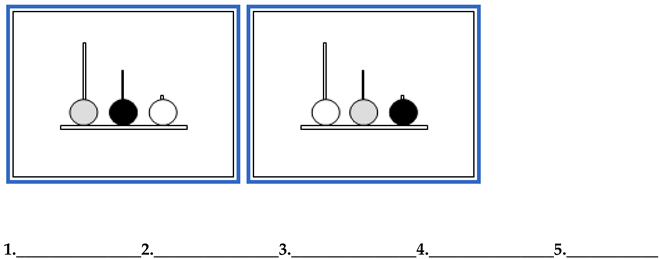
- Problem 4. Number of Moves for the Solution: 6
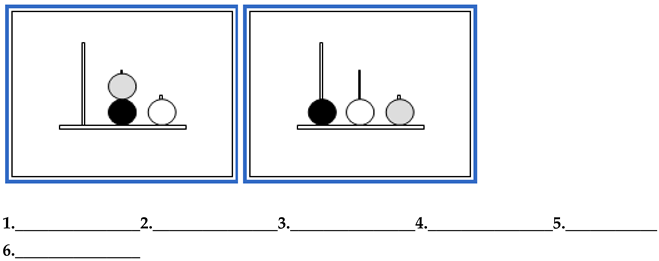
- Problem 5. Number of Moves for the Solution: 7

- Cognitive Reflection Test (Frederick 2005)
- (1)
- A bat and a ball cost $1.10 in total. The bat costs $1.00 more than the ball. How much does the ball cost? _____ cents
- (2)
- If it takes 5 machines 5 min to make 5 widgets, how long would it take 100 machines to make 100 widgets? _____ minutes
- (3)
- In a lake, there is a patch of lily pads. Every day, the patch doubles in size. If it takes 48 days for the patch to cover the entire lake, how long would it take for the patch to cover half of the lake? _____ days
- Intertemporal Choice
- (1)
- (a) Receive $3400 this month, or (b) receive $3800 the following month.
- (2)
- (a) Receive $100 now, or (b) receive $140 in a year.
- (3)
- (a) Receive $100 now, or (b) receive $1100 in 10 years.
- Risky Choice
- (4)
- (a) Receive $1000 for certain or (b) Having a 90% chance of receiving $5000.
- (5)
- (a) Receive $100 for certain or (b) Having a 75% chance of receiving $200.
- (6)
- (a) Receive $100 for certain or (b) Having a 75% chance of receiving $150.
- (7)
- (a) Receive $500 for certain or (b) Having a 15% chance of receiving $1,000,000
- (8)
- (a) Receive $100 for certain or (b) Having a 25% chance of receiving $200.
- (9)
- (a) Receive $5 for certain or (b) Having a 4% chance of receiving $80.
- (10)
- (a) Lose $100 for certain or (b) Having a 75% chance of losing $200.
- (11)
- (a) Lose $50 for certain or (b) Having a 10% chance of losing $800.
- (12)
- (a) Lose $100 for certain or (b) Having a 3% chance of losing $7000.
Appendix B. Calculation of Expected Value in Risky Choice, with the Option with Highest Expected Value in Bold
- (4)
- (a) 1 × $1000 = $1000 or (b) .90 × $5000 = $4500.
- (5)
- (a) 1 × $100 = $100 or (b) .75 × $200 = $150
- (6)
- (a) 1 × $100 = $100 or (b) .75 × $150 = $112.5.
- (7)
- (a) 1 × $500 = $500 or (b) .15 × $1,000,000 = $150,000
- (8)
- (a) 1 × $100 = $100 or (b) .25 × $200 = $50.
- (9)
- (a) 1 × $5 = $5 or (b) .04 × $80 = $3.2.
- (10)
- (a) 1 × −$100 = −$100 or (b) .75 × −$200 = −$150.
- (11)
- (a) 1 × −$50 = −$50 or (b) .10 × −$800 = −$80.
- (12)
- (a) 1 × −$100 = −$100 or (b) .03 × −$7000 = −$210.
Appendix C

| Chess Players | Non-Chess Players | ||||||||
|---|---|---|---|---|---|---|---|---|---|
| M | SD | 95% CI (LB) | 95% CI (UB) | M | SD | 95% CI (LB) | 95% CI (UB) | BF10 | |
| Age | 27.8 | 9.704 | 27 | 6.069 | 0.297 | ||||
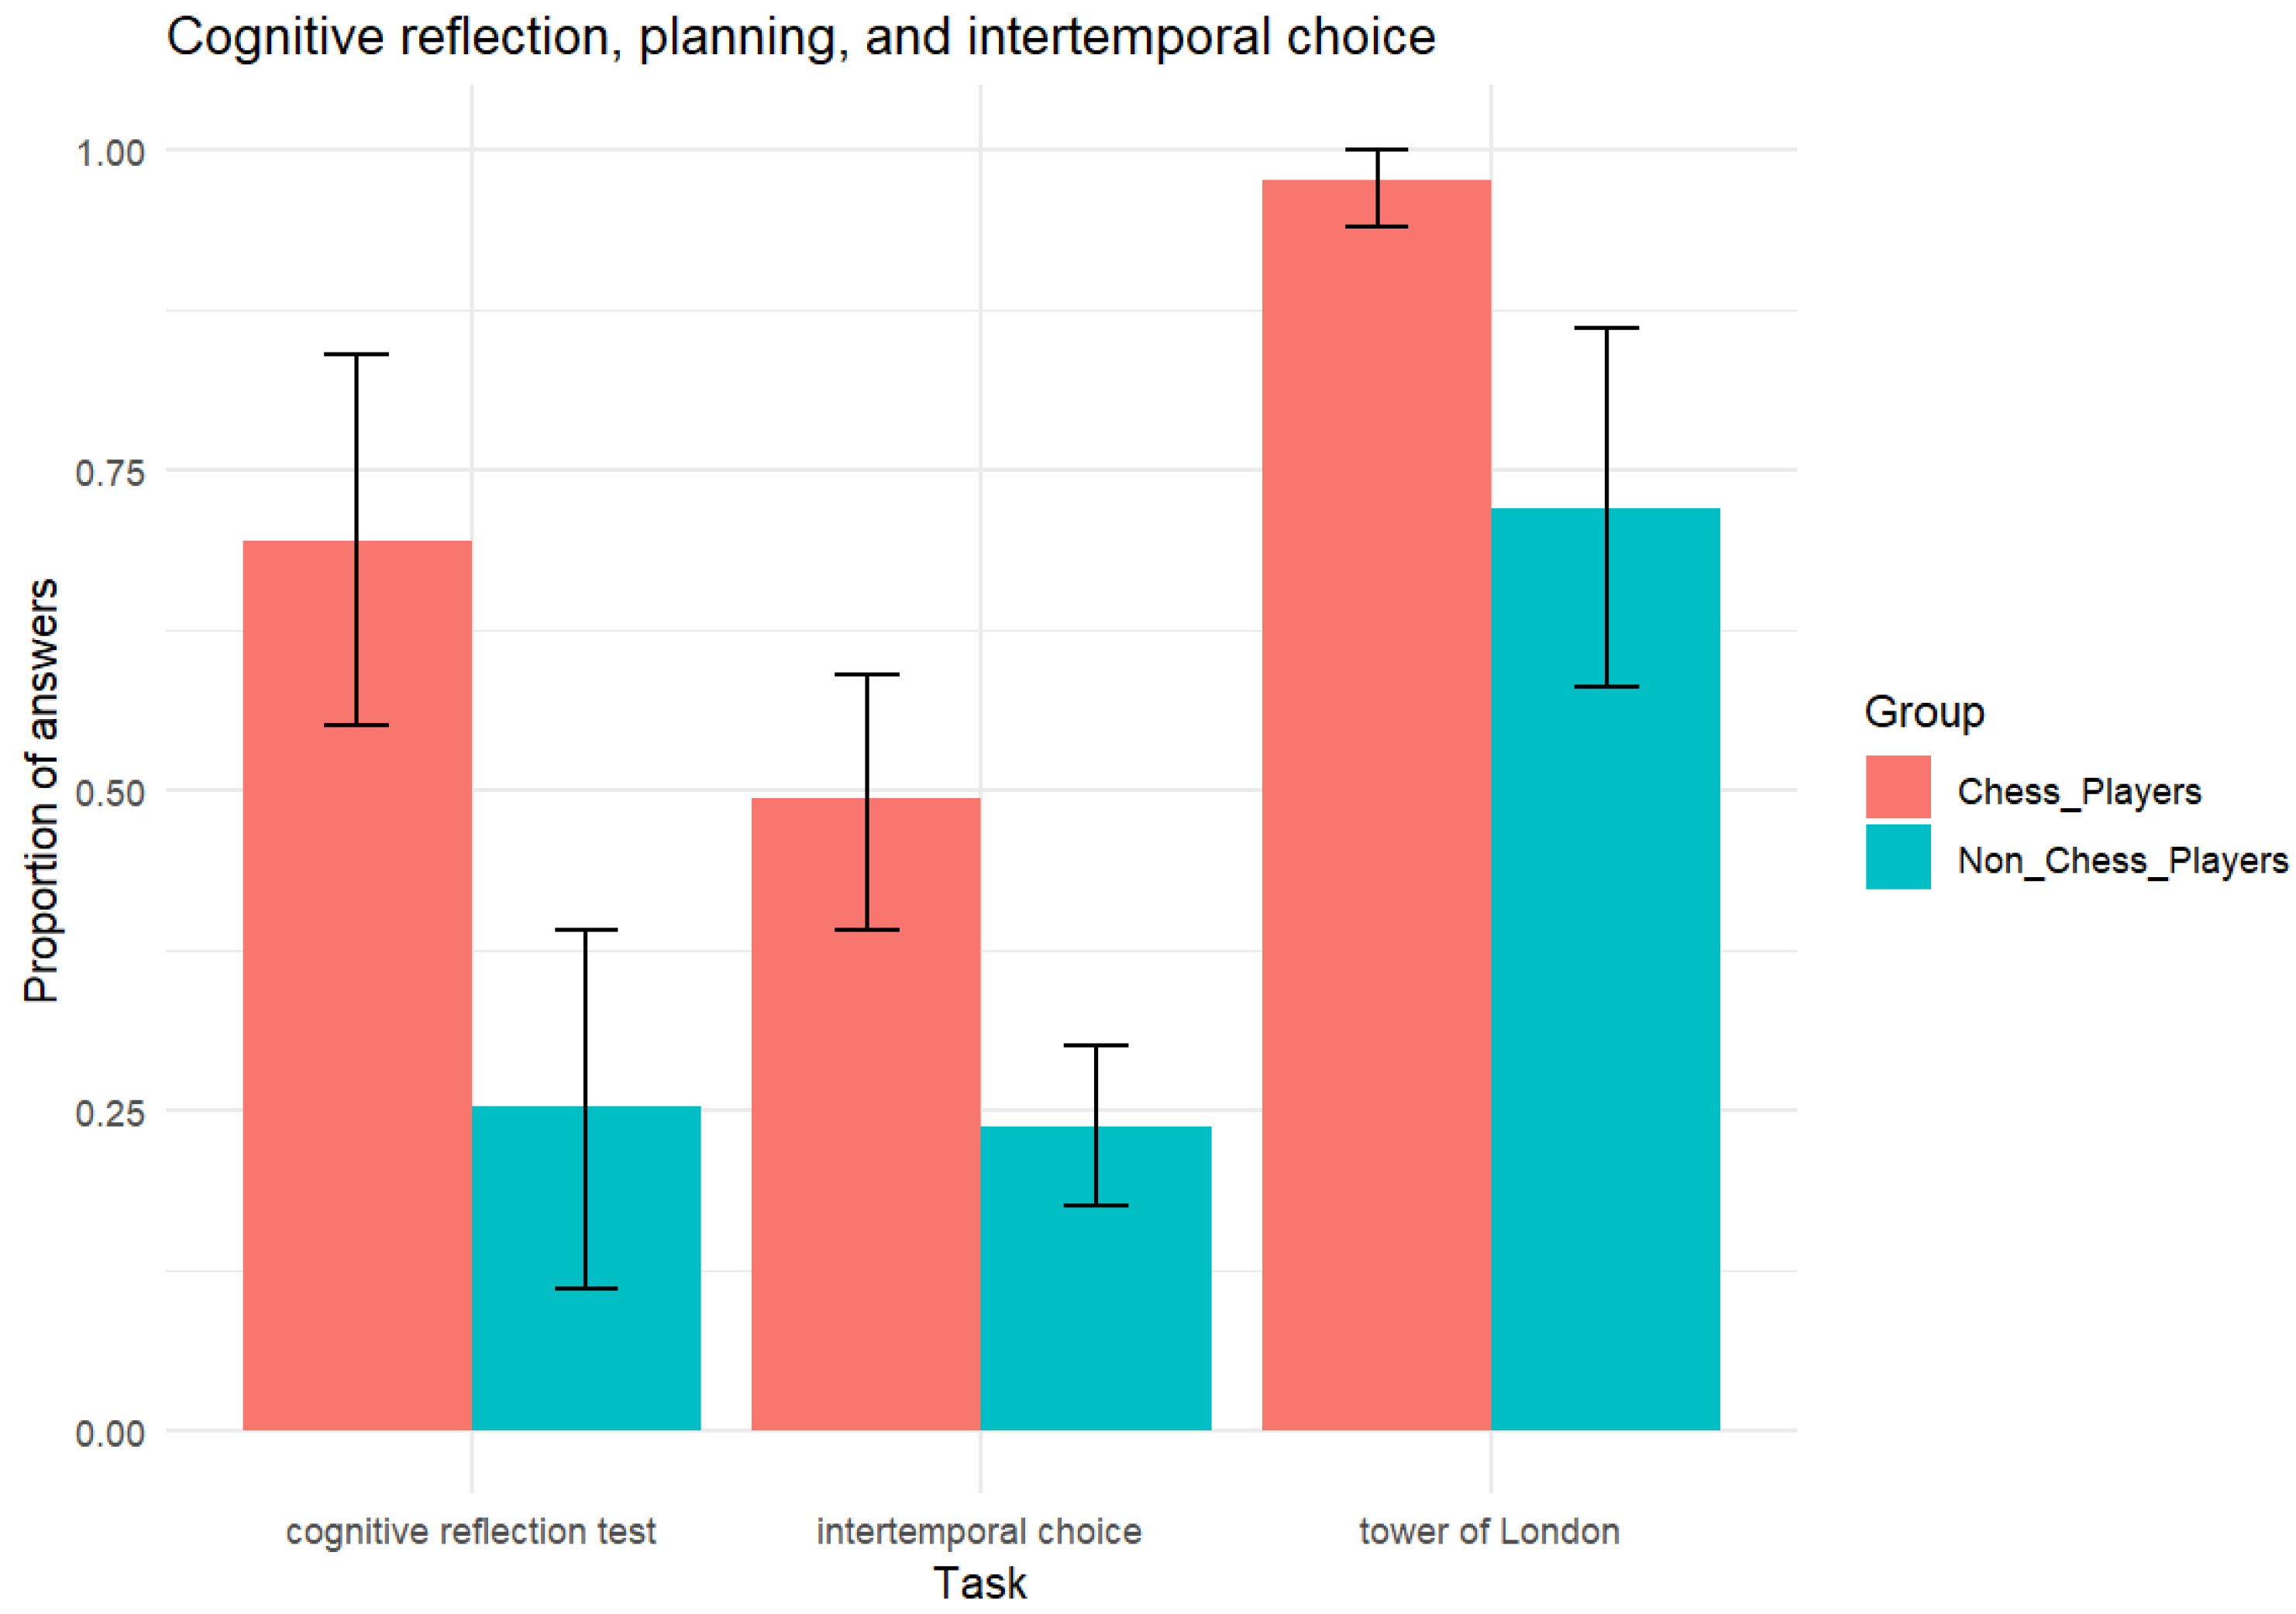
| TOL | 0.976 | 0.066 | 0.949 | 1.003 | 0.72 | 0.342 | 0.579 | 0.861 | 96.474 |
| CRT | 0.694 | 0.346 | 0.551 | 0.837 | 0.252 | 0.337 | 0.113 | 0.392 | 1114 |
| ITC | 0.493 | 0.24 | 0.394 | 0.592 | 0.238 | 0.151 | 0.175 | 0.3 | 901.1 |
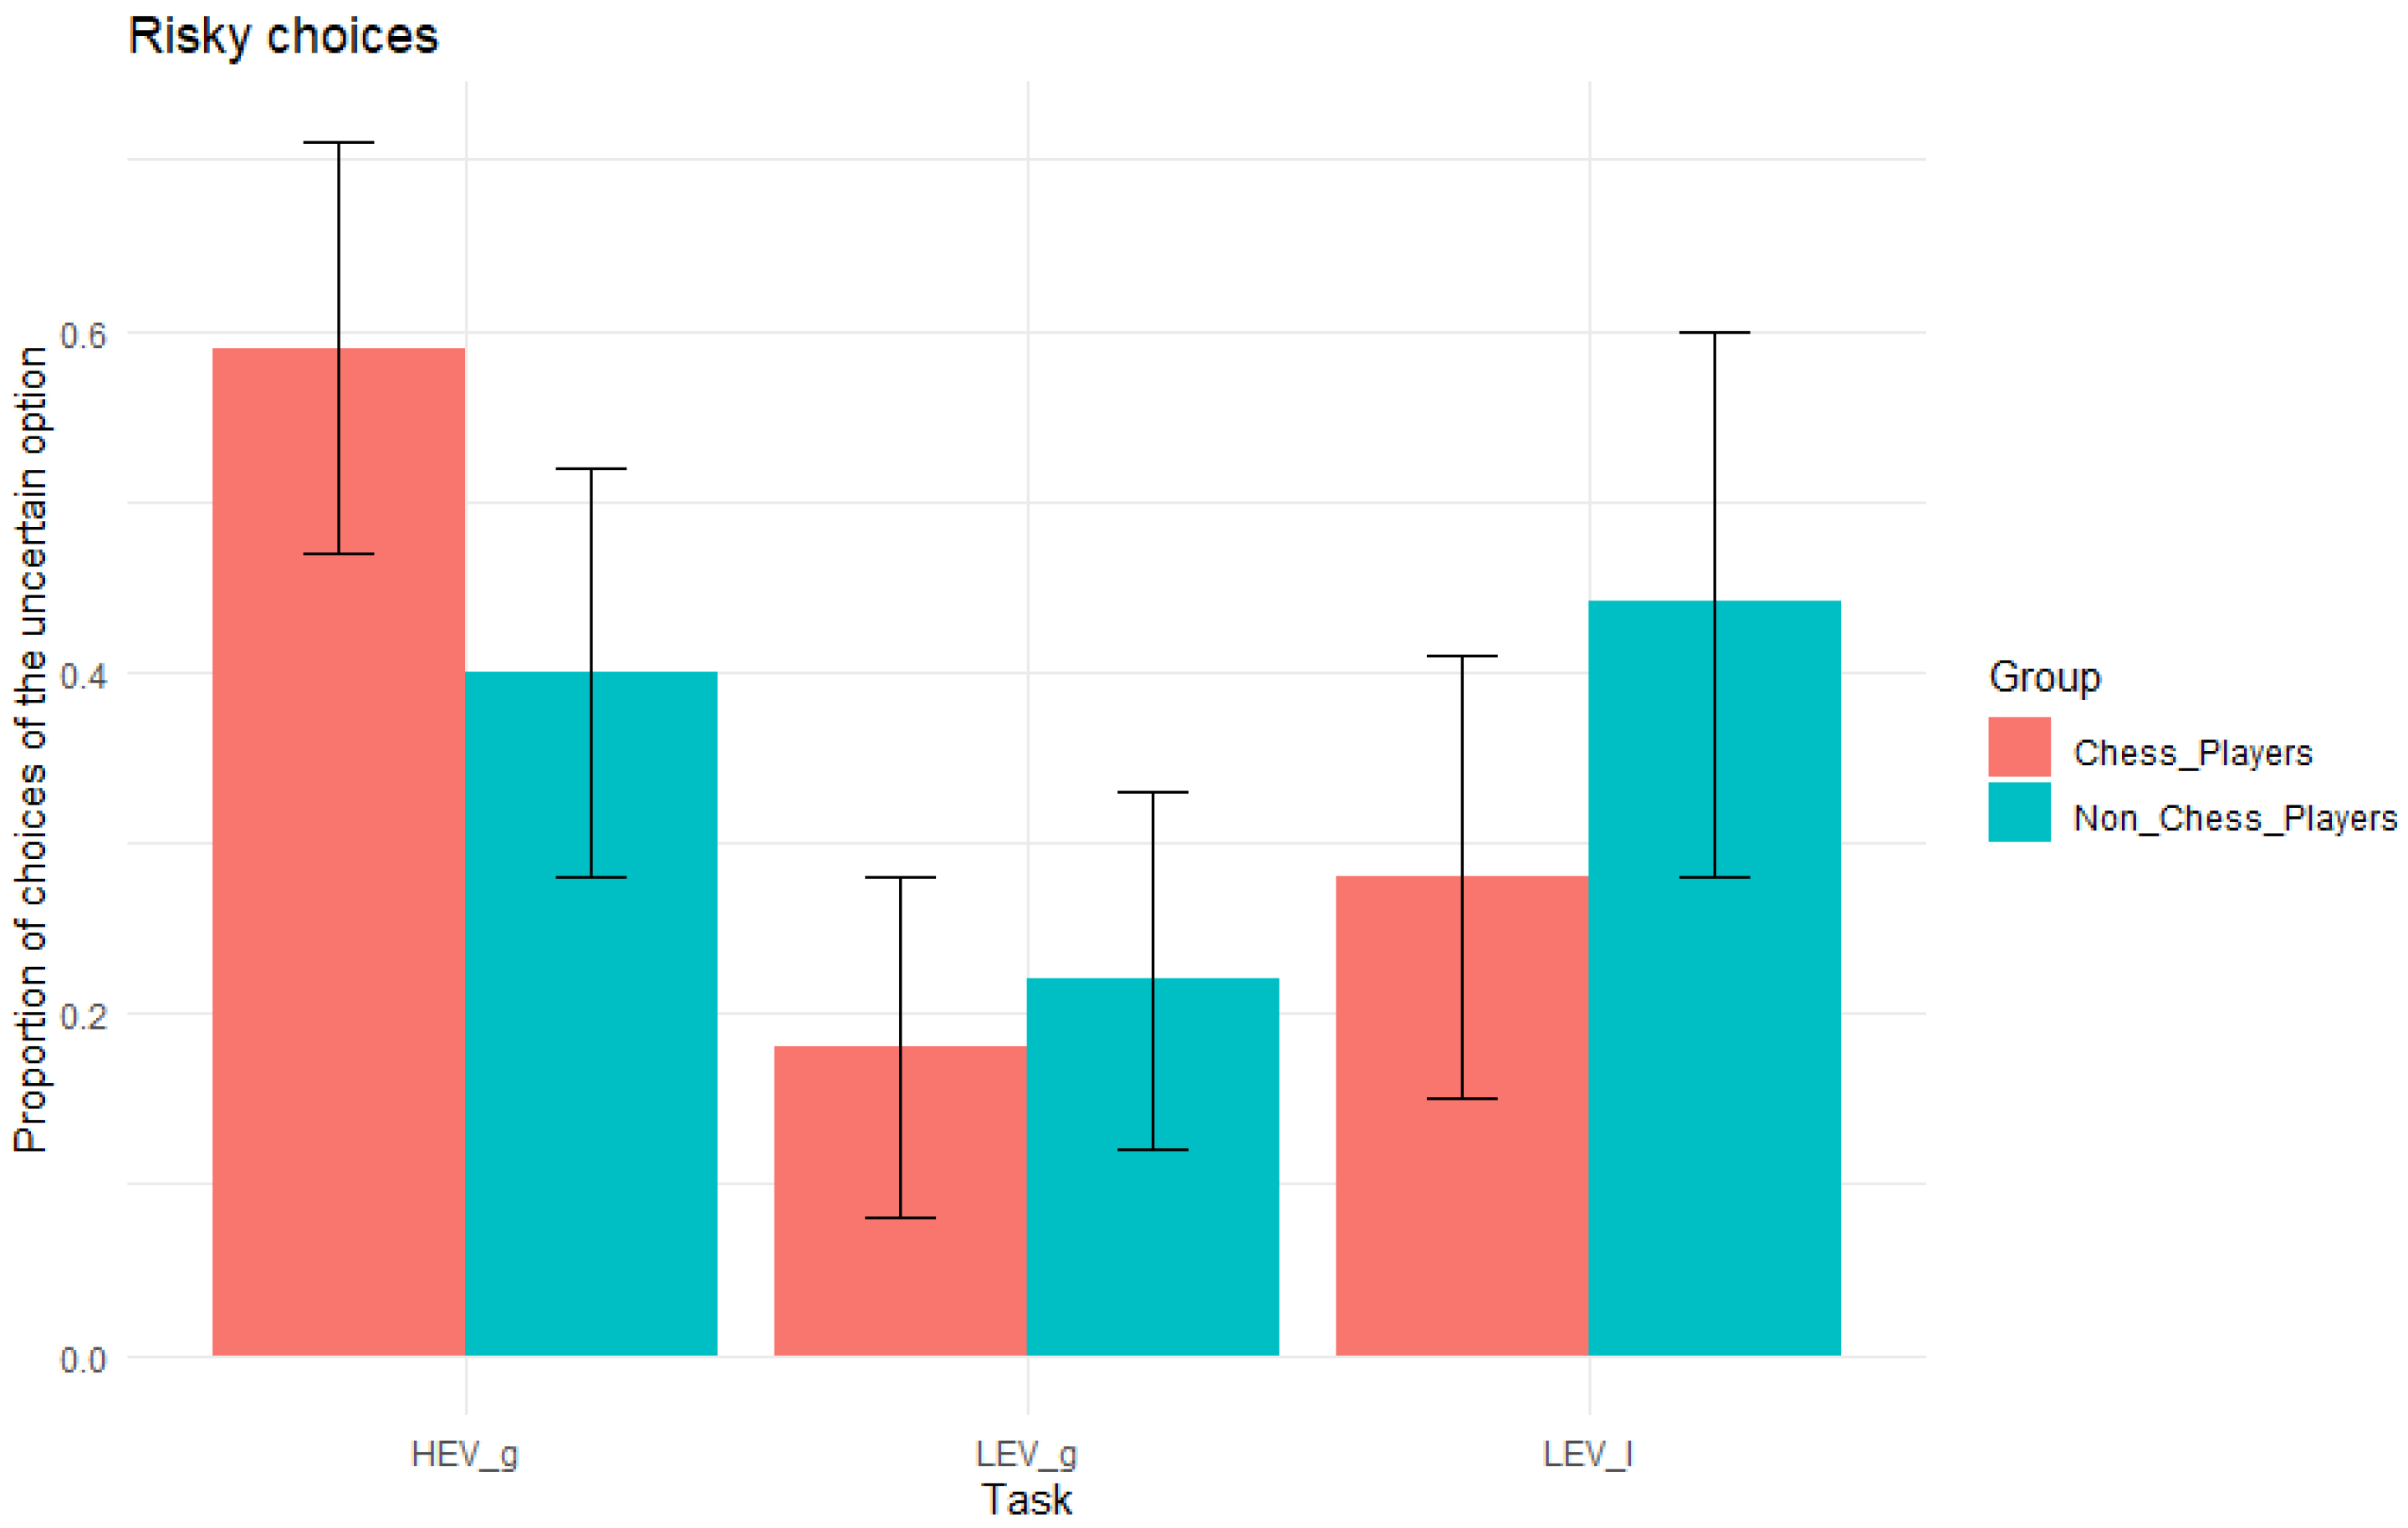
| HEVg | 0.590 | 0.288 | 0.471 | 0.709 | 0.400 | 0.298 | 0.277 | 0.523 | 2.318 |
| LEVg | 0.180 | 0.245 | 0.079 | 0.281 | 0.220 | 0.253 | 0.115 | 0.325 | 0.323 |
| LEVl | 0.280 | 0.315 | 0.15 | 0.41 | 0.441 | 0.382 | 0.283 | 0.599 | 0.822 |
References
- Bernoulli, Daniel. 1954. Exposition of a new theory of measurement of risk. Econometrica 22: 23–36. First published 1738. [Google Scholar]
- Bilalić, Merim, and Peter McLeod. 2014. Why do good thoughts block better ones? Scientific American 310: 74–79. [Google Scholar] [PubMed]
- Bilalić, Merim, Peter McLeod, and Fernand Gobet. 2008a. Expert and ‘Novice’ Problem Solving Strategies in Chess—Sixty Years of Citing de Groot 1946. Thinking & Reasoning 14: 395–408. [Google Scholar]
- Bilalić, Merim, Peter McLeod, and Fernand Gobet. 2008b. Inflexibility of experts: Reality or myth? Quantifying the Einstellung effect in chess masters. Cognitive Psychology 56: 73–102. [Google Scholar] [PubMed]
- Bilalić, Merim, Peter McLeod, and Fernand Gobet. 2008c. Why good thoughts block better ones: The mechanism of the pernicious Einstellung (set) effect. Cognition 108: 652–61. [Google Scholar]
- Bilalić, Merim, Peter McLeod, and Fernand Gobet. 2009. Specialization effect and its influence on memory and problem solving in expert chess players. Cognitive Science 33: 1117–43. [Google Scholar]
- Blanch, Angel. 2021. Chess and Individual Differences. Cambridge: Cambridge University Press. [Google Scholar]
- Blanch, Angel. 2022. Chess instruction improves cognitive abilities and academic performance: Real effects or wishful thinking? Educational Psychology Review 34: 1371–1398. [Google Scholar] [CrossRef]
- Blech, Carsten, Robert Gaschler, and Merim Bilalić. 2020. Why do people fail to see simple solutions—Uncovering the mechanism behind the Einstellung (mental set) effect with the help of think-aloud protocols. Thinking & Reasoning 26: 552–80. [Google Scholar]
- Burgoyne, Alexander P., Giovanni Sala, Fernand Gobet, Brooke N. Macnamara, Campitelli Guillermo, and David Z. Hambrick. 2016. The relationship between cognitive ability and chess skill: A comprehensive meta-analysis. Intelligence 59: 72–83. [Google Scholar]
- Campitelli, Guillermo, and Fernand Gobet. 2004. Adaptive expert decision making: Skilled chess players search more and deeper. International Computer Games Association Journal 27: 209–16. [Google Scholar] [CrossRef]
- Campitelli, Guillermo, and Martin Labollita. 2010. Correlations of cognitive reflection with judgments and choices. Judgment and Decision Making 5: 182–91. [Google Scholar] [CrossRef]
- Campitelli, Guillermo, and Martin Labollita. 2016. Campitelli-Labollita_Datset_Chessplayers&Students. Figshare Dataset. Available online: https://doi.org/10.6084/m9.figshare.3172813.v1 (accessed on 12 March 2025).
- Campitelli, Guillermo, and Philip Gerrans. 2014. Does the cognitive reflection test measure cognitive reflection? A mathematical modeling approach. Memory and Cognition 42: 434–47. [Google Scholar] [CrossRef] [PubMed]
- Carlin, David J., Phipps Bonerba, Alexander Michael, Shapiro M. George, and Jordan Grafman. 2000. Planning impairments in frontal lobe dementia and frontal lobe lesion patients. Neuropsychologia 38: 655–65. [Google Scholar] [CrossRef] [PubMed]
- Charness, Neil. 1981. Search in chess: Age and skill differences. Journal of Experimental Psychology: Human Perception and Performance 7: 467. [Google Scholar] [CrossRef]
- Charness, Neil. 1992. The impact of chess research on cognitive science. Psychological Research 54: 4–9. [Google Scholar] [CrossRef]
- Chase, William G., and Herbert A. Simon. 1973a. Perception in chess. Cognitive Psychology 4: 55–81. [Google Scholar] [CrossRef]
- Chase, William G., and Herbert A. Simon. 1973b. The mind’s eye in chess. In Visual Information Processing. Edited by William Chase. New York: Academic Press, pp. 215–81. [Google Scholar]
- Connors, Michael H., Bernard D. Burns, and Guilliermo Campitelli. 2011. Expertise in complex decision making: The role of search in chess 70 years after de Groot. Cognitive Science 35: 1567–1579. [Google Scholar] [CrossRef]
- De Bruin, Anique B., Elian M. Kok, Jimmie Leppink, and Guido Camp. 2014. Practice, intelligence, and enjoyment in novice chess players: A prospective study at the earliest stage of a chess career. Intelligence 45: 18–25. [Google Scholar] [CrossRef]
- De Groot, Adriaan D. 1978. Thought and Choice in Chess. The Hague: Mouton Publishers. First published 1946. [Google Scholar] [CrossRef]
- Elo, Arpad. 1978. The Rating of Chessplayers, Past and Present. Montréal-Nord: Arco. [Google Scholar]
- Frederick, Shane. 2005. Cognitive reflection and decision making. Journal of Economic Perspectives 19: 25–42. [Google Scholar] [CrossRef]
- Frederick, Shane, George Loewenstein, and Ted O’Donoghue. 2002. Time discounting and time preference: A critical review. Journal of Economic Literature 40: 351–401. [Google Scholar] [CrossRef]
- Frydman, Maurice, and Richard Lynn. 1992. The general intelligence and spatial abilities of gifted young Belgian chess players. British Journal of Psychology 83: 233–35. [Google Scholar] [PubMed]
- Gobet, Fernand. 1997. A pattern-recognition theory of search in expert problem solving. Thinking and Reasoning 3: 291–313. [Google Scholar]
- Gobet, Fernand. 1998. Chess thinking revisited. Swiss Journal of Psychology 57: 18–32. [Google Scholar]
- Gobet, Fernand, and Herbert A. Simon. 1996a. Templates in chess memory: A mechanism for recalling several boards. Cognitive Psychology 31: 1–40. [Google Scholar] [CrossRef] [PubMed]
- Gobet, Fernand, and Herbert A. Simon. 1996b. Recall of random and distorted positions. Implications for the theory of expertise. Memory and Cognition 24: 493–503. [Google Scholar] [CrossRef] [PubMed]
- Gobet, Fernand, and Herbert A. Simon. 1998. Pattern recognition makes search possible: Comments on Holding (1992). Psychological Research 61: 204–8. [Google Scholar]
- Gobet, Fernand, de A. J. Voogt, and Jean Retschitzki. 2004. Moves in Mind: The Psychology of Board Games. Hove: Psychology Press. [Google Scholar]
- Grabner, Roland H. 2014. The role of intelligence for performance in the prototypical expertise domain of chess. Intelligence 45: 26–33. [Google Scholar]
- Grabner, Roland H., Elsbeth Stern, and Aljoscha C. Neubauer. 2007. Individual differences in chess expertise: A psychometric investigation. Acta Psychologica 124: 398–420. [Google Scholar]
- Holding, David H. 1989. Evaluation factors in human tree search. American Journal of Psychology 102: 103–8. [Google Scholar] [CrossRef]
- Holding, David H. 1992. Theories of chess skill. Psychological Research 54: 10–16. [Google Scholar]
- JTeam. 2024. JASP, Version Version 0.19.0. Available online: https://jasp-stats.org/ (accessed on 12 March 2025).
- Kahneman, Daniel, and Amos Tversky. 1979. Prospect Theory: An Analysis of Decision under Risk. Econometrica 47: 263. [Google Scholar] [CrossRef]
- Kahneman, Daniel, and Amos Tversky. 1984. Choices, values, and frames. American Psychologist 39: 341. [Google Scholar] [CrossRef]
- Kaller, Christoph P., Josef M. Unterrainer, Benjamin Rahm, and Ulrike Halsband. 2004. The impact of problem structure on planning: Insights from the Tower of London task. Cognitive Brain Research 20: 462–72. [Google Scholar] [CrossRef] [PubMed]
- Keidel, Kristof, Qendresa Rramani, Bernd Weber, Carsten Murawski, and Ulrich Ettinger. 2021. Individual differences in intertemporal choice. Frontiers in Psychology 12: 643670. [Google Scholar] [CrossRef]
- Klein, Gary, Susan Wolf, Laura Militello, and Caroline Zsambok. 1995. Characteristics of skilled option generation in chess. Organizational Behavior and Human Decision Processes 62: 63–69. [Google Scholar] [CrossRef]
- Loewenstein, George. 1992. Anomalies of Intertemporal Choice: Evidence and Interpretation. New York: Russell Sage. [Google Scholar]
- Luchins, Abraham S. 1942. Mechanization in problem solving: The effect of Einstellung. Psychological Monographs 54: i-95. [Google Scholar]
- Morey, Richard D., Jeffrey N. Rouder, Tahira Jamil, and Michael R. D. Morey. 2015. Package ‘bayesfactor’. [Google Scholar]
- Oechssler, Jörg, Andreas Roider, and Patrick W. Schmitz. 2009. Cognitive abilities and behavioural biases. Journal of Economic Behavior and Organization 72: 147–52. [Google Scholar] [CrossRef]
- Pearl, Judea. 2009. Causality. Cambridge: Cambridge University Press. [Google Scholar]
- Pearl, Judea, and Dana Mackenzie. 2018. The Book of Why: The New Science of Cause and Effect. New York: Basic Books. [Google Scholar]
- Pennycook, Gordon, James A. Cheyne, Derek J. Koehler, and Jonathan A. Fugelsang. 2016. Is the cognitive reflection test a measure of both reflection and intuition? Behavior Research Methods 48: 341–48. [Google Scholar]
- RStudioTeam. 2020. RStudio: Integrated Development for R. Available online: http://www.rstudio.com/ (accessed on 12 March 2025).
- Saariluoma, Pertti. 1995. Chess Players’ Thinking: A Cognitive Psychological Approach. Hove: Psychology Press. [Google Scholar]
- Sala, Giovanni, Alexander P. Burgoyne, Brooke N. Macnamara, David Z. Hambrick, Guillermo Campitelli, and Fernand Gobet. 2017. Checking the “academic selection” argument. Chess players outperform non-chess players in cognitive skills related to intelligence: A meta-analysis. Intelligence 61: 130–39. [Google Scholar] [CrossRef]
- Sala, Giovanni, and Fernand Gobet. 2016. Do the benefits of chess instruction transfer to academic and cognitive skills? A meta-analysis. Educational Research Review 18: 46–57. [Google Scholar]
- Shallice, Tim. 1982. Specific impairments of planning. Philosophical Transactions of the Royal Society of London. B, Biological Sciences 298: 199–209. [Google Scholar]
- Sigman, Mariano, Pablo Etchemendy, Diego F. Slezak, and Guillermo A. Cecchi. 2010. Response time distributions in rapid chess: A large-scale decision making experiment. Frontiers in Decision Neuroscience 4: 60. [Google Scholar] [CrossRef]
- Singley, Mark K., and John A. Anderson. 1989. The Transfer of Cognitive Skill. Cambridge, MA: Harvard University Press. [Google Scholar]
- Thomson, Keela S., and Daniel M. Oppenheimer. 2016. Investigating an alternate form of the cognitive reflection test. Judgment and Decision Making 11: 99–113. [Google Scholar] [CrossRef]
- Thorndike, Edward L., and Robert S. Woodworth. 1901. The influence of improvement in one mental function upon the efficiency of other functions. II. The estimation of magnitudes. Psychological Review 8: 384. [Google Scholar] [CrossRef]
- Toplak, Maggie E., Richard F. West, and Keith E. Stanovich. 2014. Assessing miserly information processing: An expansion of the Cognitive Reflection Test. Thinking and Reasoning 20: 147–68. [Google Scholar] [CrossRef]
- Trincherini, Roberto, and Valeria Postal. 2024. Expertise and decision-making: An analysis of expert capacities through the Iowa Gambling Task. Journal of Expertise 7: 59–72. [Google Scholar]
- Tversky, Amos, and Daniel Kahneman. 1974. Judgment under uncertainty: Heuristics and biases. Science 185: 1124–31. [Google Scholar] [CrossRef]
- Unterrainer, Josef M., Christoph P. Kaller, Rainer Leonhart, and Benjamin Rahm. 2011. Revising superior planning performance in chess players: The impact of time restriction and motivation aspects. American Journal of Psychology 124: 213–25. [Google Scholar] [CrossRef]
- Unterrainer, Josef M., Christoph P. Kaller, Ulrike Halsband, and Benjamin Rahm. 2006. Planning abilities and chess: A comparison of chess and non-chess players on the Tower of London task. British Journal of Psychology 97: 299–311. [Google Scholar] [CrossRef]
- Vaci, Nemanja, and Merim Bilalić. 2017. Chess databases as a research vehicle in psychology: Modeling large data. Behavioral Research Methods 49: 1227–40. [Google Scholar] [CrossRef]
- van der Maas, Han L. J., and Eric-Jan Wagenmakers. 2005. A psychometric analysis of chess expertise. American Journal of Psychology 118: 29–60. [Google Scholar] [CrossRef] [PubMed]
- von Neumann, John, and Oskar Morgenstern. 1944. Theory of Games and Economic Behavior. Princeton: Princeton University Press. [Google Scholar]
- Wagenmakers, Eric-Jan, Jeff Love, Maarten Marsman, Tahira Jamil, Alexander Ly, Joris Verhagen, Ravi Selker, Quentin F. Gronau, Daniel Dropmann, Bruno Boutin, and et al. 2018. Bayesian inference for psychology. Part II: Example applications with JASP. Psychonomic Bulletin & Review 25: 58–76. [Google Scholar] [CrossRef]
- Waters, Andrew J., Fernand Gobet, and Graham Leyden. 2002. Visuo-spatial abilities in chess players. British Journal of Psychology 30: 303–11. [Google Scholar]
- Woodworth, Robert S., and Edward L. Thorndike. 1901. The influence of improvement in one mental function upon the efficiency of other functions.(I). Psychological Review 8: 247. [Google Scholar]
Disclaimer/Publisher’s Note: The statements, opinions and data contained in all publications are solely those of the individual author(s) and contributor(s) and not of MDPI and/or the editor(s). MDPI and/or the editor(s) disclaim responsibility for any injury to people or property resulting from any ideas, methods, instructions or products referred to in the content. |
© 2025 by the authors. Licensee MDPI, Basel, Switzerland. This article is an open access article distributed under the terms and conditions of the Creative Commons Attribution (CC BY) license (https://creativecommons.org/licenses/by/4.0/).
Share and Cite
Campitelli, G.; Labollita, M.; Bilalić, M. Planning, Cognitive Reflection, Inter-Temporal Choice, and Risky Choice in Chess Players: An Expertise Approach. J. Intell. 2025, 13, 40. https://doi.org/10.3390/jintelligence13030040
Campitelli G, Labollita M, Bilalić M. Planning, Cognitive Reflection, Inter-Temporal Choice, and Risky Choice in Chess Players: An Expertise Approach. Journal of Intelligence. 2025; 13(3):40. https://doi.org/10.3390/jintelligence13030040
Chicago/Turabian StyleCampitelli, Guillermo, Martín Labollita, and Merim Bilalić. 2025. "Planning, Cognitive Reflection, Inter-Temporal Choice, and Risky Choice in Chess Players: An Expertise Approach" Journal of Intelligence 13, no. 3: 40. https://doi.org/10.3390/jintelligence13030040
APA StyleCampitelli, G., Labollita, M., & Bilalić, M. (2025). Planning, Cognitive Reflection, Inter-Temporal Choice, and Risky Choice in Chess Players: An Expertise Approach. Journal of Intelligence, 13(3), 40. https://doi.org/10.3390/jintelligence13030040