Measurement-Invariant Fluid Anti-Flynn Effects in Population—Representative German Student Samples (2012–2022)

 , , and
Abstract
1. Introduction
2. Materials and Methods
2.1. Berliner Test zur Erfassung Fluider und Kristalliner Intelligenz (BEFKI)
2.2. Procedure
2.3. Statistical Analysis
3. Results
4. Discussion
Strengths and Limitations
5. Conclusions
Author Contributions
Funding
Institutional Review Board Statement
Informed Consent Statement
Data Availability Statement
Conflicts of Interest
References
- Bratsberg, Bernt, and Ole Rogeberg. 2018. Flynn effect and its reversal are both environmentally caused. Proceedings of the National Academy of Sciences of the USA 115: 6674–78. [Google Scholar] [CrossRef]
- Cattell, Raymond Bernard. 1957. Personality and Motivation: Structure and Measurement. Chicago: World Book. [Google Scholar]
- Cheung, Gordon W., and Roger B. Rensvold. 2002. Evaluating goodness-of-fit indexes for testing measurement invariance. Structural Equation Modeling 9: 233–55. [Google Scholar] [CrossRef]
- Cohen, Jacob. 1988. Statistical Power Analysis for the Behavioral Sciences, 2nd ed. Mahwah: Erlbaum. [Google Scholar]
- Colom, Roberto, and Carmen Flores-Mendoza. 2001. Intelligence and working memory: Relationship between factor g, cognitive complexity and processing capacity. Psicologia: Teoria e Pesquisa 17: 37–47. [Google Scholar] [CrossRef]
- Colom, Roberto, Luis F. García, Pei Chun Shih, and Francisco J. Abad. 2023. Generational intelligence tests score changes in Spain: Are we asking the right question? Intelligence 99: 101772. [Google Scholar] [CrossRef]
- Cotton, Sue M., Patricia M. Kiely, David P. Crewther, Brenda Thomson, Robin Laycock, and Sheila G. Crewther. 2005. A normative and reliability study for the Raven’s Coloured Progressive Matrices for primary school aged children from Victoria, Australia. Personality and Individual Differences 39: 647–59. [Google Scholar] [CrossRef]
- Dickens, William T., and James R. Flynn. 2001. Heritability estimates versus large environmental effects: The IQ paradox resolved. Psychological Review 108: 346–69. [Google Scholar] [CrossRef] [PubMed]
- Dutton, Edward, Dimitri van der Linden, and Richard Lynn. 2016. The negative Flynn Effect: A systematic literature review. Intelligence 59: 163–69. [Google Scholar] [CrossRef]
- Dworak, Elizabeth M., William Revelle, and David M. Condon. 2023. Looking for Flynn effects in a recent online US adult sample: Examining shifts within the SAPA Project. Intelligence 98: 101734. [Google Scholar] [CrossRef]
- Flynn, James R. 1984. The mean IQ of Americans: Massive gains 1932 to 1978. Psychological Bulletin 95: 29–51. [Google Scholar] [CrossRef]
- Gonthier, Corentin, and Jacques Gregoire. 2022. Flynn effects are biased by differential item functioning over time: A test using overlapping items in Wechsler scales. Intelligence 95: 101688. [Google Scholar] [CrossRef]
- Heller, Kurt A., and Christoph Perleth. 2000. Kognitiver Fähigkeitstest für 4. bis 12. Klassen, Revision: KFT 4-12+ R [Cognitive Ability Test for Grades 4 to 12, Revised: KFT 4-12+ R]. Weinheim: Beltz-Test. [Google Scholar]
- Lazaridis, Alexandros, Marco Vetter, and Jakob Pietschnig. 2022. Domain-specificity of Flynn effects in the CHC-model: Stratum II test score changes in Germanophone samples (1996–2018). Intelligence 95: 101707. [Google Scholar] [CrossRef]
- Must, Olev, Aasa Must, and Vilve Raudik. 2003. The secular rise in IQs: In Estonia, the Flynn effect is not a Jensen effect. Intelligence 31: 461–71. [Google Scholar] [CrossRef]
- Neisser, Ulric. 1997. Rising scores on intelligence tests: Test scores are certainly going up all over the world, but whether intelligence itself has risen remains controversial. American Scientist 85: 440–47. [Google Scholar]
- Pietschnig, Jakob, and Georg Gittler. 2015. A reversal of the Flynn effect for spatial perception in German-speaking countries: Evidence from a cross-temporal IRT-based meta-analysis (1977–2014). Intelligence 53: 145–53. [Google Scholar] [CrossRef]
- Pietschnig, Jakob, and Martin Voracek. 2015. One century of global IQ gains: A formal meta-analysis of the Flynn Effect (1909–2013). Perspectives on Psychological Science 10: 282–306. [Google Scholar] [CrossRef]
- Pietschnig, Jakob, Pia Deimann, Nicole Hirschmann, and Ursula Kastner-Koller. 2021. The Flynn effect in Germanophone preschoolers (1996–2018): Small effects, erratic directions, and questionable interpretations. Intelligence 86: 101544. [Google Scholar] [CrossRef]
- Pietschnig, Jakob, Sandra Oberleiter, Enrico Toffalini, and David Giofrè. 2023. Reliability of the g factor over time in Italian INVALSI data (2010–2022): What can achievement-g tell us about the Flynn effect? Personality and Individual Differences 214: 112345. [Google Scholar] [CrossRef]
- R Core Team. 2022. R: A Language and Environment for Statistical Computing. Vienna: R Core Team. Available online: https://www.R-project.org/ (accessed on 27 December 2023).
- Rindermann, Heiner, and James Thompson. 2013. Ability rise in NAEP and narrowing ethnic gaps? Intelligence 41: 821–31. [Google Scholar] [CrossRef]
- Rosseel, Yves. 2012. Lavaan: An R package for structural equation modeling. Journal of Statistical Software 48: 1–36. [Google Scholar] [CrossRef]
- Schaie, K. Warner, and Charles R. Strother. 1968. A cross-sequential study of age changes in cognitive behavior. Psychological Bulletin 70: 671–80. [Google Scholar] [CrossRef]
- Schneider, W. Joel, and Kevin S. McGrew. 2018. The Cattell-Horn-Carroll theory of cognitive abilities. In Contemporary Intellectual Assessment: Theories, Tests, and Issues. New York: Guilford Press, pp. 73–163. [Google Scholar]
- Spearman, Charles. 1904. “General intelligence” objectively determined and measured. American Journal of Psychology 15: 201–93. [Google Scholar] [CrossRef]
- Wilhelm, Oliver, Ulrich Schroeders, and Stefan Schipolowski. 2014. BEFKI 8–10: Berliner Test zur Erfassung Fluider und Kristalliner Intelligenz für die 8. bis 10. Jahrgangsstufe; Manual [BEFKI 8–10: Berlin Test for the Assessment of Fluid and Crystallized Intelligence for Grades 8 to 10: Manual]. Boston: Hogrefe. [Google Scholar]
- Woodley, Michael A., Jan te Nijenhuis, Olev Must, and Aasa Must. 2014. Controlling for increased guessing enhances the independence of the Flynn effect from g: The return of the Brand effect. Intelligence 43: 27–34. [Google Scholar] [CrossRef]
- Wu, Hao, and Ryne Estabrook. 2016. Identification of confirmatory factor analysis models of different levels of invariance for ordered categorical outcomes. Psychometrica 81: 1014–1045. [Google Scholar] [CrossRef]


| Data Collected in | 2012 | 2018 | 2022 |
|---|---|---|---|
| N | 3889 | 7142 | 8443 |
| Sex | |||
| Men | 1929 | 3719 | 4070 |
| Women | 1960 | 3353 | 4065 |
| Age | |||
| Mean | 15.82 | 15.70 | 15.60 |
| SD | 0.29 | 0.52 | 0.55 |
| Model | χ2 | p | df | CFI |
|---|---|---|---|---|
| Overall | 1337.333 | <0.001 | 104 | 0.972 |
| 2012 | 334.889 | <0.001 | 104 | 0.981 |
| 2018 | 492.863 | <0.001 | 104 | 0.965 |
| 2022 | 664.814 | <0.001 | 104 | 0.971 |
| Configural | 1735.346 | <0.001 | 340 | 0.968 |
| Strict | 1938.521 | <0.001 | 372 | 0.964 |
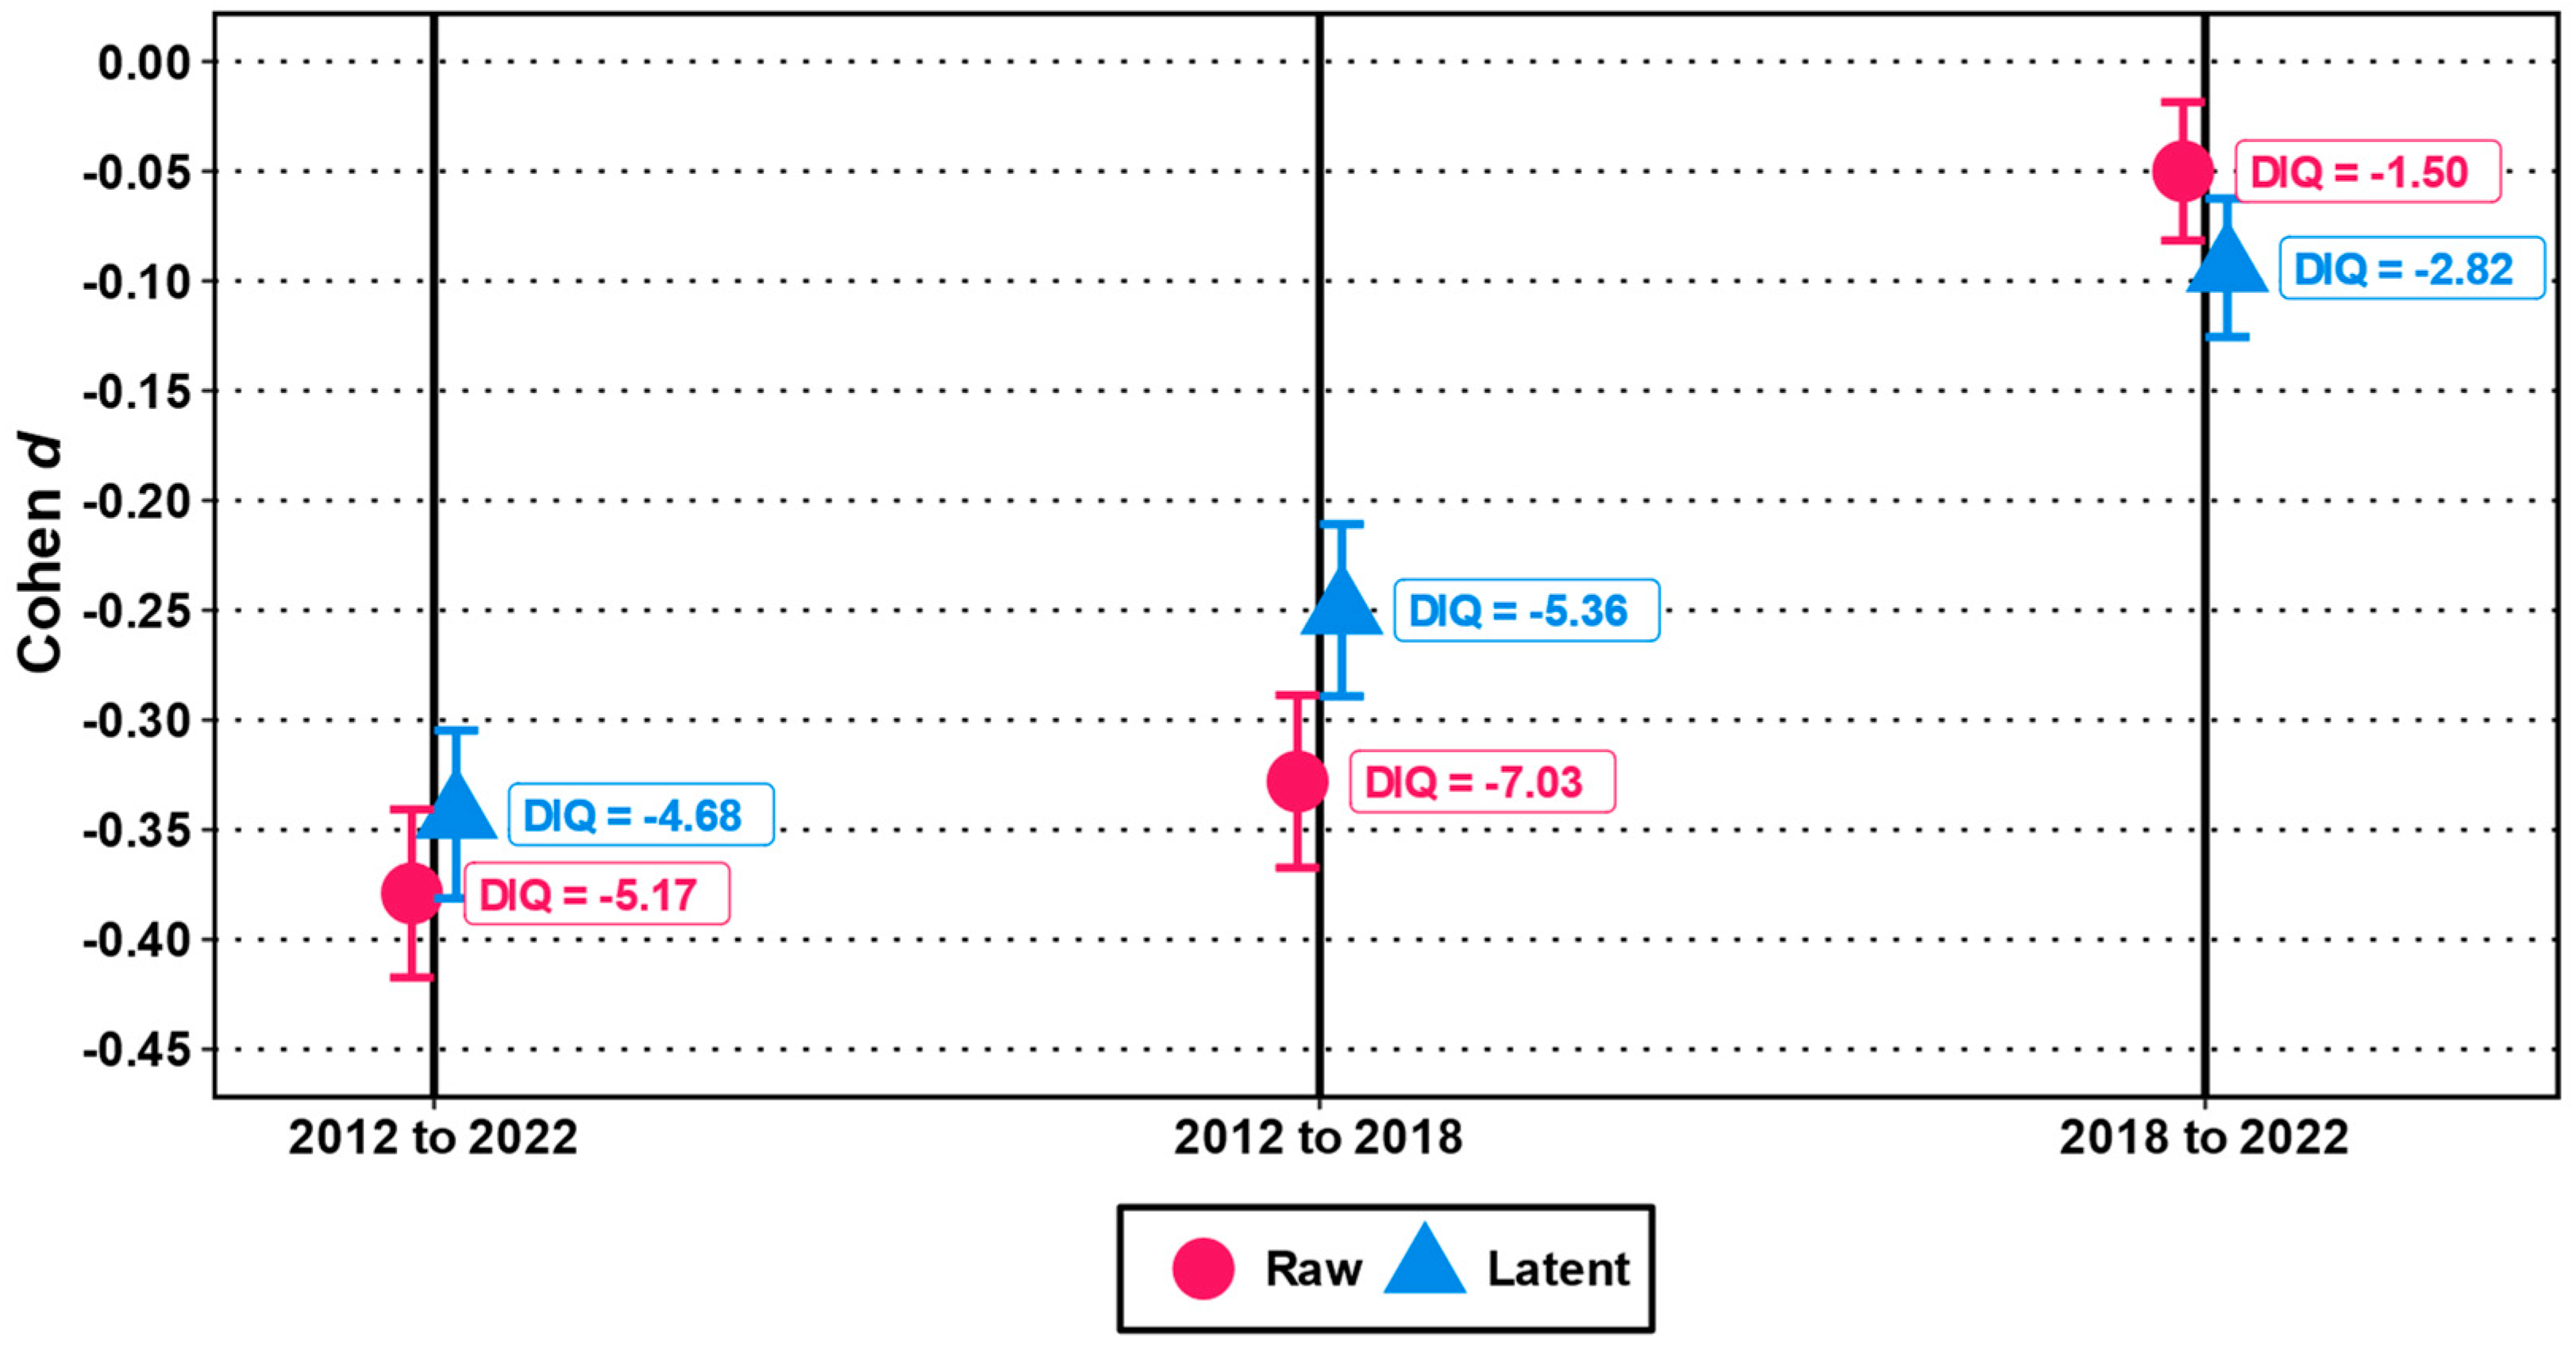
| Year | 2012 | 2018 | 2022 |
|---|---|---|---|
| 2012 | - | −0.328 *** (−7.03) | −0.379 *** (−5.17) |
| 2018 | −0.250 *** (−5.36) | - | −0.050 ** (−1.50) |
| 2022 | −0.343 *** (−4.68) | −0.094 *** (−2.82) | - |
| F | df | p | ηp2 | |
|---|---|---|---|---|
| ANOVA | ||||
| Model fit | F = 199.31 (158.52); df1 = 2, df2 = 19,471; p = < .001 | |||
| Time | 199.31 (158.52) | 2 | <0.001 (<0.001) | 0.02 (0.02) |
| ANCOVA | ||||
| Model fit | F = 77.90 (61.66); df1 = 5, df2 = 19,090; p = < .001 | |||
| Time | 192.46 (152.18) | 2 | <0.001 (<0.001) | 0.02 (0.02) |
| Sex | 0.05 (0.31) | 1 | 0.822 (0.512) | <0.001 (<0.001) |
| Time × Sex | 2.07 (0.26) | 2 | 0.126 (0.166) | <0.001 (<0.001) |
Disclaimer/Publisher’s Note: The statements, opinions and data contained in all publications are solely those of the individual author(s) and contributor(s) and not of MDPI and/or the editor(s). MDPI and/or the editor(s) disclaim responsibility for any injury to people or property resulting from any ideas, methods, instructions or products referred to in the content. |
© 2024 by the authors. Licensee MDPI, Basel, Switzerland. This article is an open access article distributed under the terms and conditions of the Creative Commons Attribution (CC BY) license (https://creativecommons.org/licenses/by/4.0/).
Share and Cite
Oberleiter, S.; Patzl, S.; Fries, J.; Diedrich, J.; Voracek, M.; Pietschnig, J. Measurement-Invariant Fluid Anti-Flynn Effects in Population—Representative German Student Samples (2012–2022). J. Intell. 2024, 12, 9. https://doi.org/10.3390/jintelligence12010009
Oberleiter S, Patzl S, Fries J, Diedrich J, Voracek M, Pietschnig J. Measurement-Invariant Fluid Anti-Flynn Effects in Population—Representative German Student Samples (2012–2022). Journal of Intelligence. 2024; 12(1):9. https://doi.org/10.3390/jintelligence12010009
Chicago/Turabian StyleOberleiter, Sandra, Sabine Patzl, Jonathan Fries, Jennifer Diedrich, Martin Voracek, and Jakob Pietschnig. 2024. "Measurement-Invariant Fluid Anti-Flynn Effects in Population—Representative German Student Samples (2012–2022)" Journal of Intelligence 12, no. 1: 9. https://doi.org/10.3390/jintelligence12010009
APA StyleOberleiter, S., Patzl, S., Fries, J., Diedrich, J., Voracek, M., & Pietschnig, J. (2024). Measurement-Invariant Fluid Anti-Flynn Effects in Population—Representative German Student Samples (2012–2022). Journal of Intelligence, 12(1), 9. https://doi.org/10.3390/jintelligence12010009