Developmental Assessment of Visual Communication Skills in Primary Education
Abstract
:1. Introduction
2. Materials and Methods
2.1. Assessing Subskills of the Produce Domain of Visual Communication
Assessing Subskills of the “Respond” Domain in Visual Communication
2.2. Sample and Assessment Methods of the Two Studies
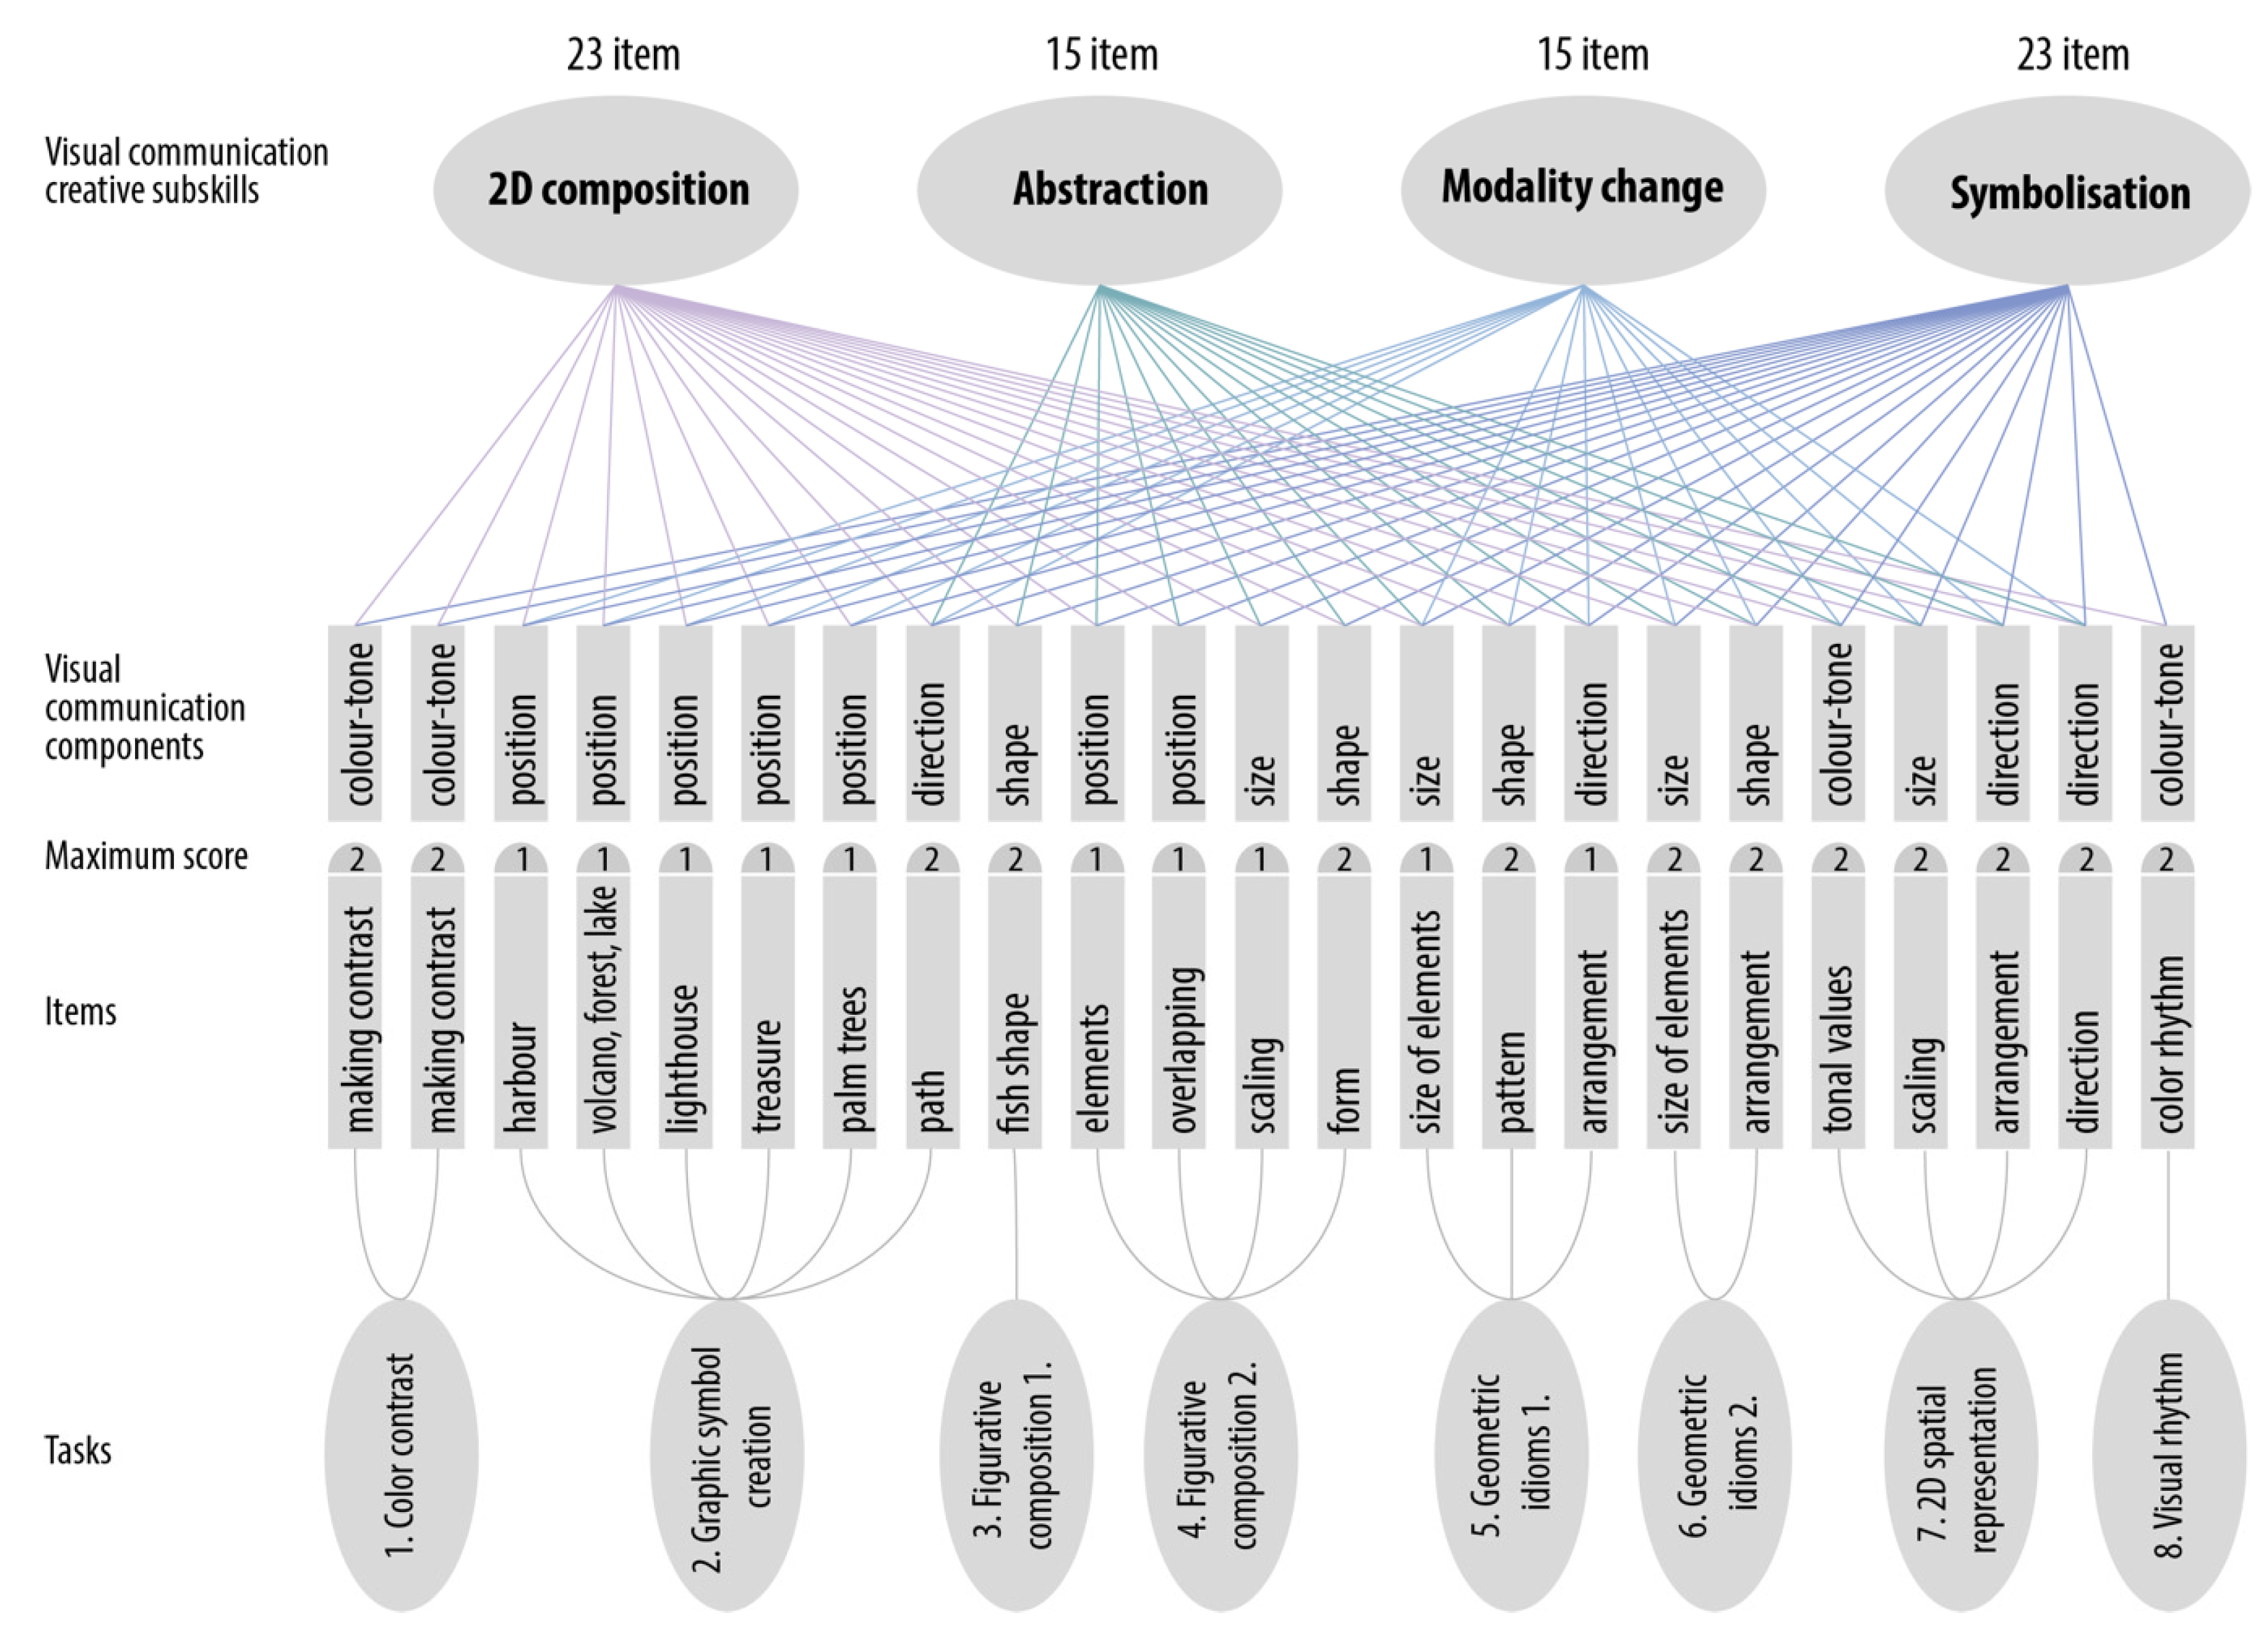
2.2.1. Sample and Task System for the “Produce” Domain of Visual Communication
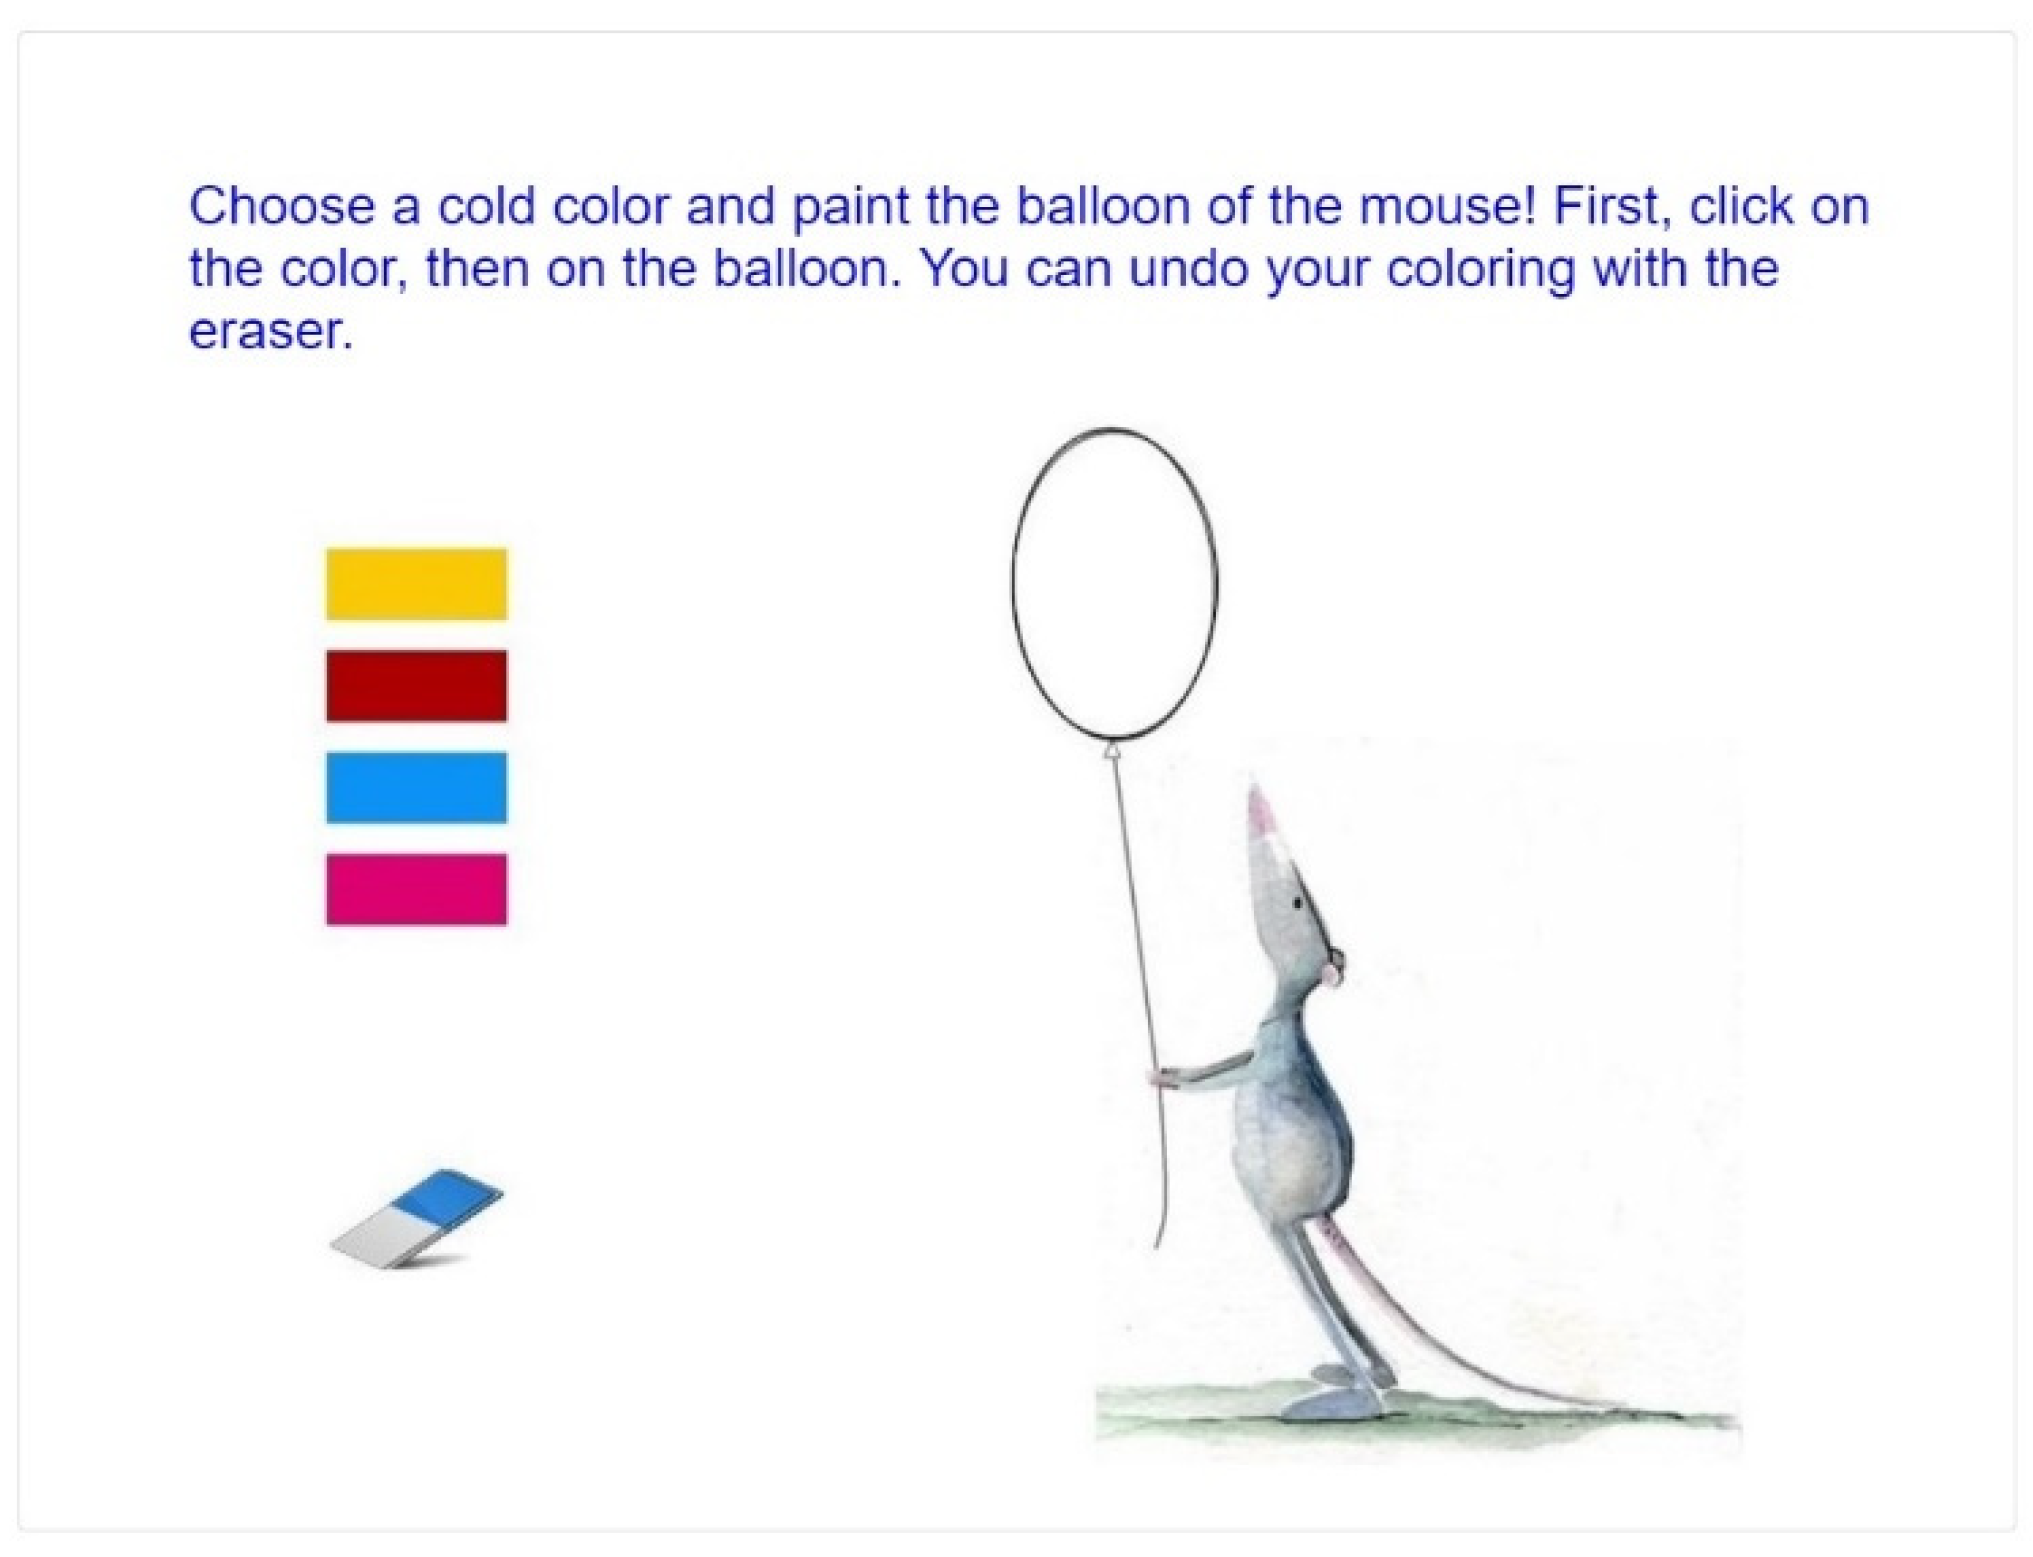
Highlighting a Shape Using Color Contrasts
Creation of Graphic Symbols
Figurative Composition Created from Geometric Shapes
Expressive Value of Geometric Shapes
Two-Dimensional Spatial Representation
Visual Rhythm
2.2.2. Sample and Task System of the Response Domain of Visual Communication
Recognition and Differentiation
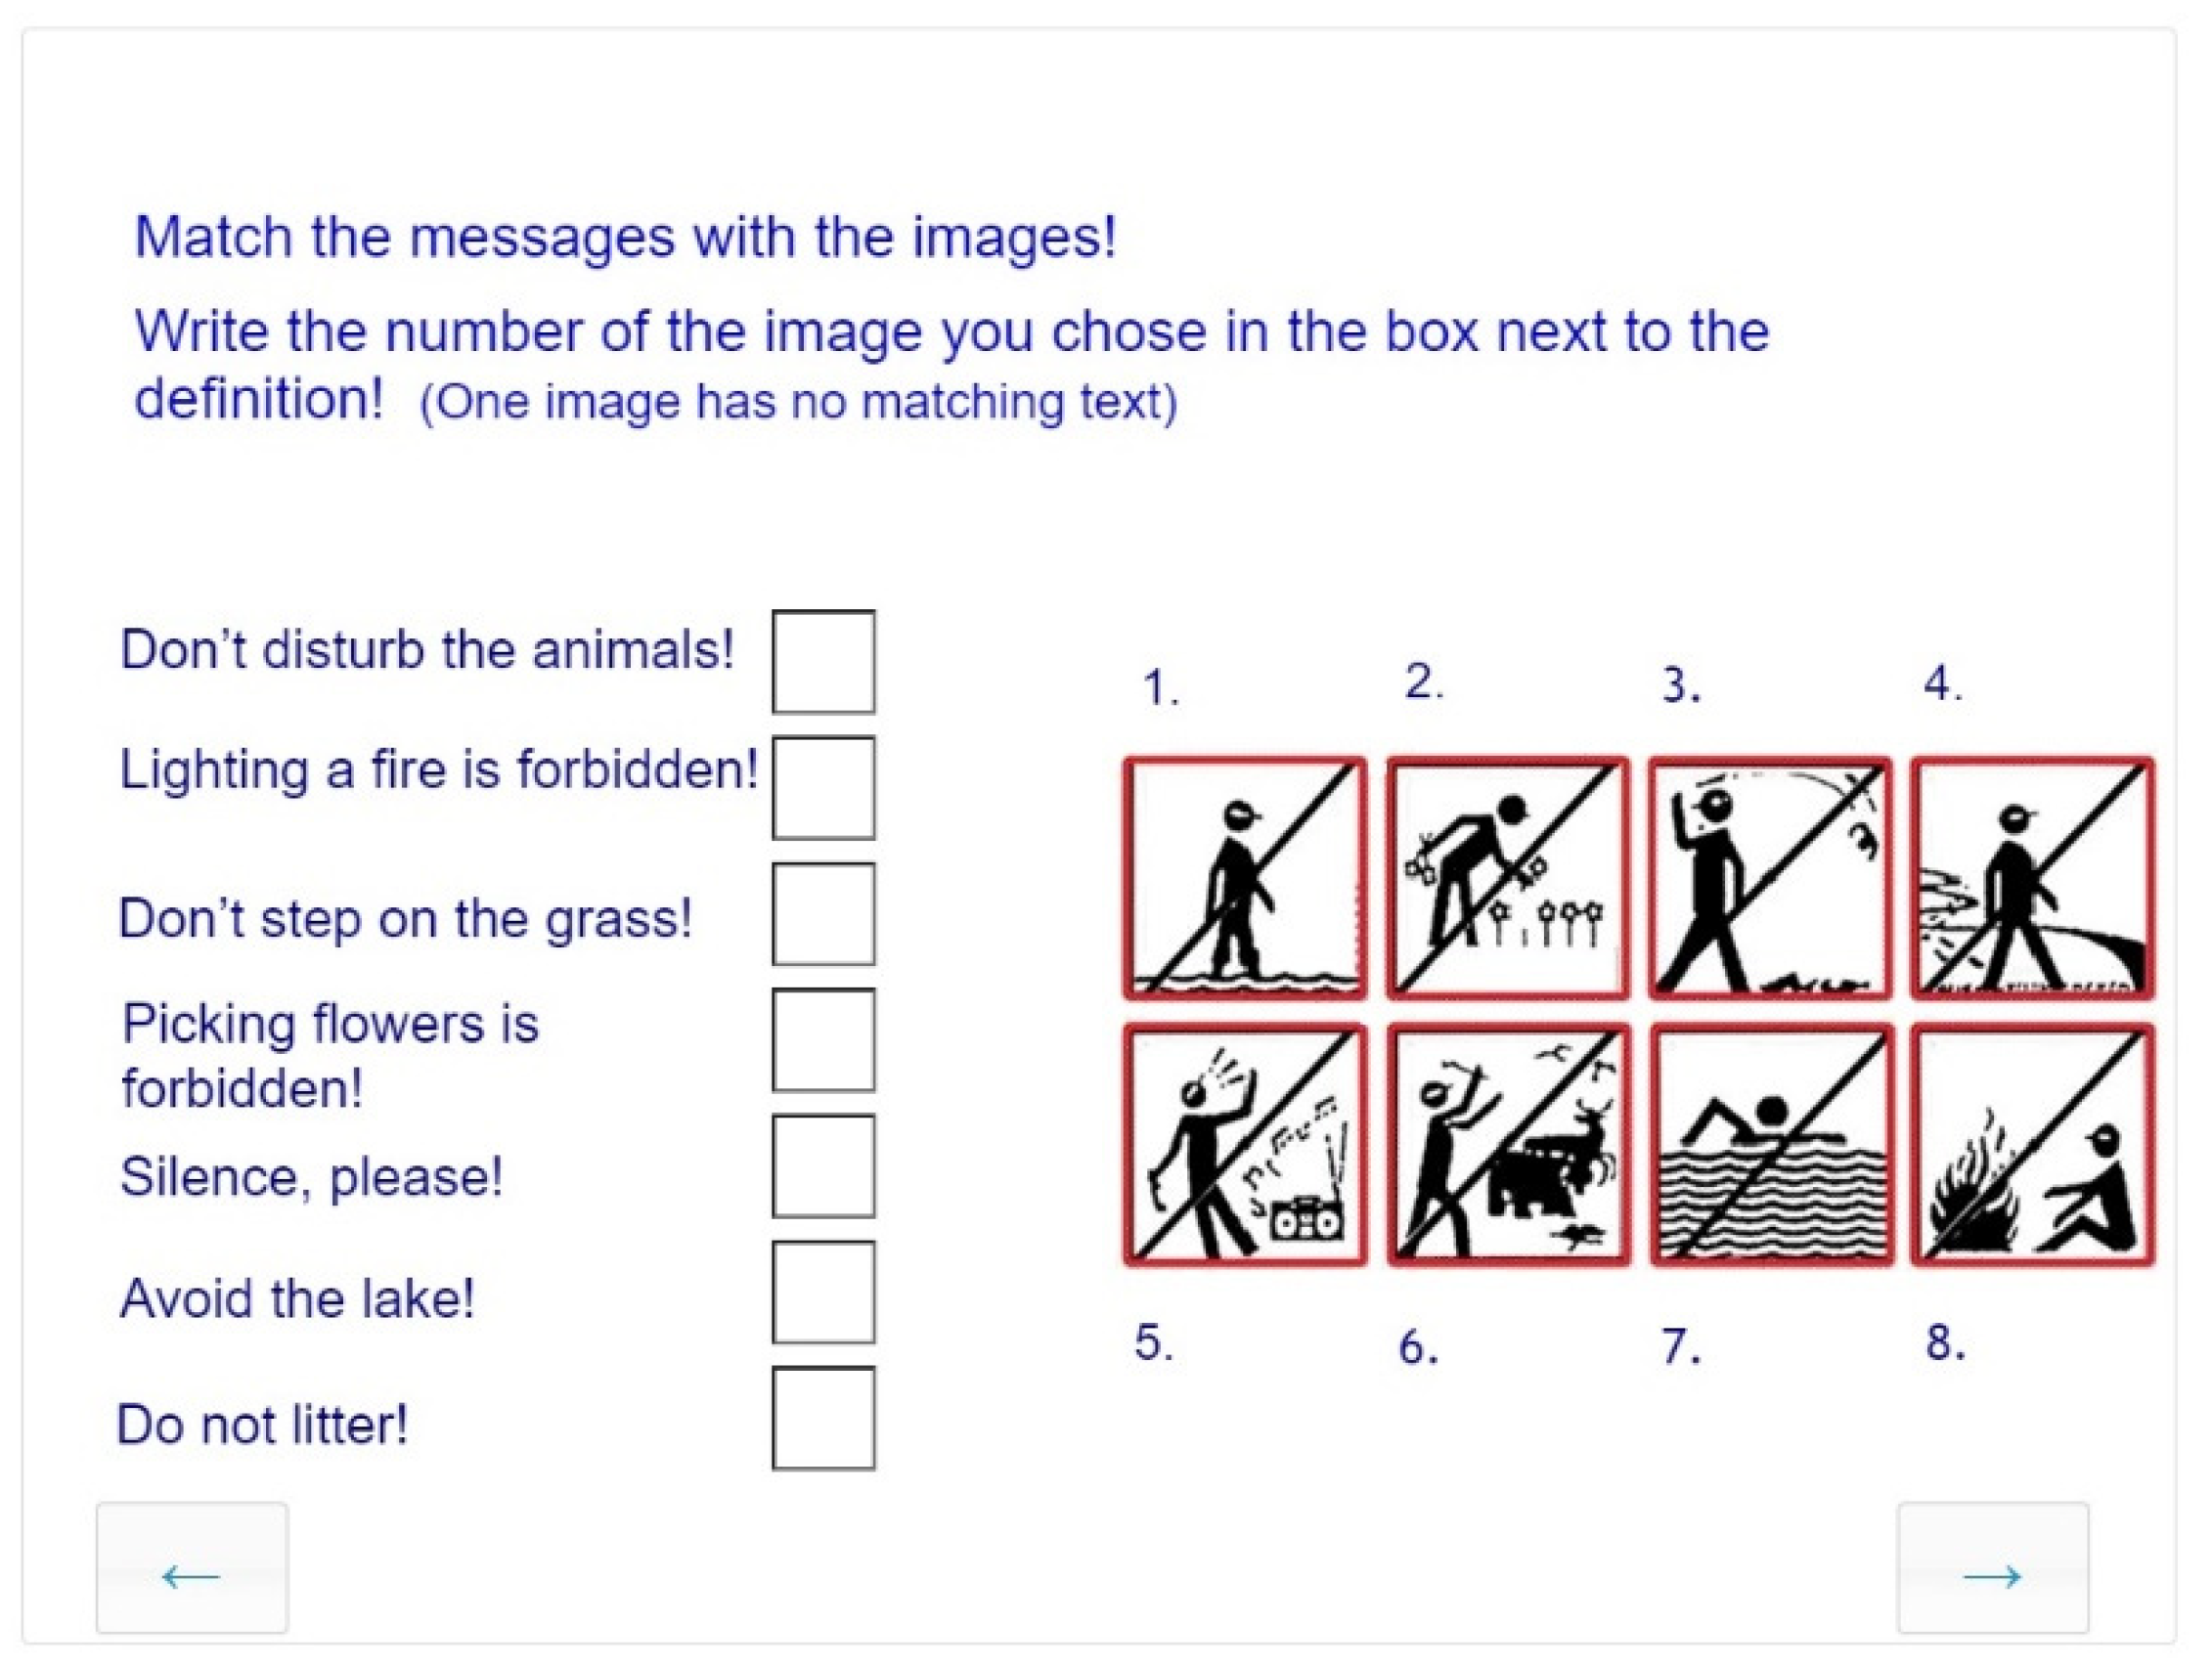
Visual Interpretation and Recognition of Connections
Visual Analysis: Reading Messages Conveyed in Abstract Compositions
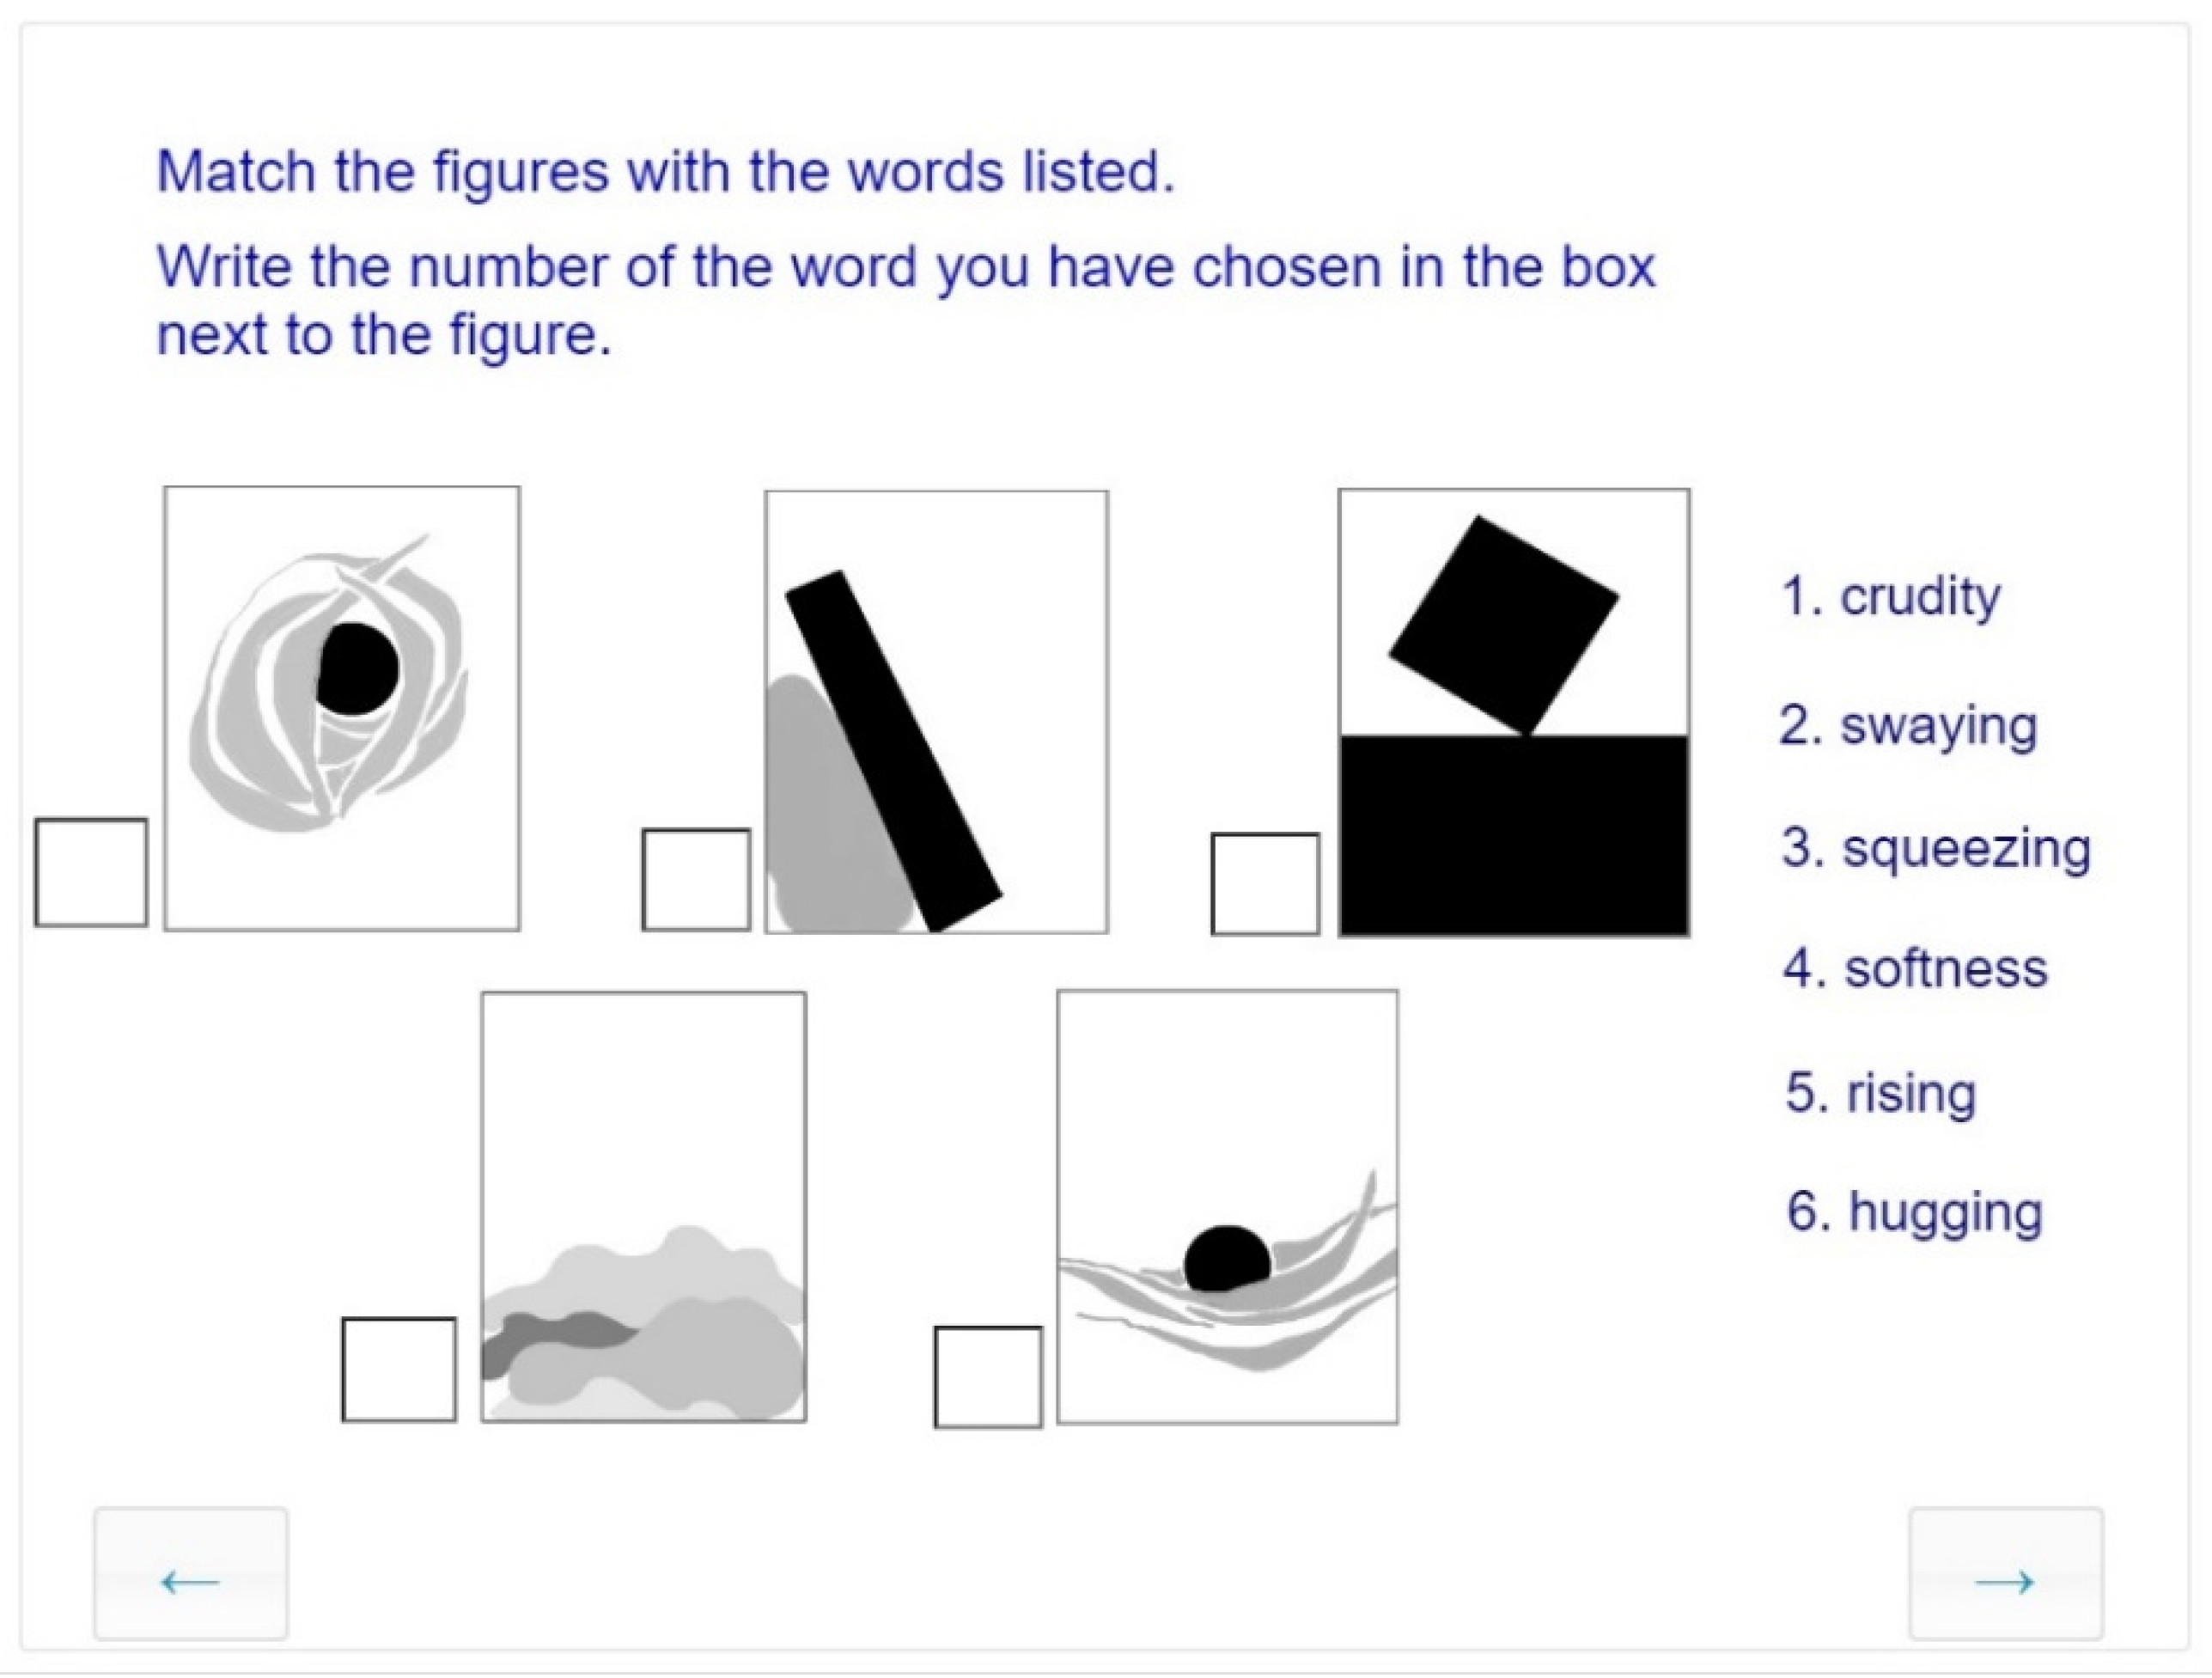
Modality Change
3. Results and Discussion
3.1. Assessment Results: Subskills of Visual Communication Related to the Produce Domain of CEFR-VC
3.2. Assessment Results: Subskills of Visual Communication Related to the “Respond” Domain of CEFR-VC
4. Conclusions
Author Contributions
Funding
Institutional Review Board Statement
Informed Consent Statement
Data Availability Statement
Conflicts of Interest
References
- Abramov, Israel, James Gordon, Olga Feldman, and Alla Chavarga. 2012. Sex and vision II: Color appearance of monochromatic lights. Biology of Sex Differences 3: 21. [Google Scholar] [CrossRef] [PubMed] [Green Version]
- Billmayer, Franz. 2016. Situations in which Visual Literacy competencies are required and in which they become apparent. In Gemeinsamer Europäischer Referenzrahmen für Visual Literacy—Prototyp. Edited by Ernst Wagner and Diederik Schönau. Münster and New York: Waxmann Verlag, pp. 91–97. ISBN 9783830934288. [Google Scholar]
- Boughton, Douglas. 2013. Assessment of performance in the visual arts: What, how and why. In From Child Art to Visual Language of Youth—New Models and Tools for Assessment of Learning and Creation in Art Education. Edited by Andrea Kárpáti and Emil Gaul. Bristol: Intellect Publishers, pp. 119–42. [Google Scholar]
- Cary, Richard. 2004. Chapter 5: Howard Gardner’s Theory of Visual-Spatial Intelligence: A critical retheorizing. Counterpoints 278: 84–118. Available online: https://www.jstor.org/stable/42979283 (accessed on 2 June 2022).
- ENViL Structural Model. 2016. Structural Model of the European Framework of Visual Literacy. Available online: http://envil.eu/competence-structure-model/ (accessed on 4 June 2022).
- ENViL. n.d. European Network of Visual Literacy Home Page. Available online: https://envil.eu/ (accessed on 4 June 2022).
- Frick, Ulrich. 2018. Report on a national quantitative assessment study in visual literacy. Paper presented at Competencies in Art Education: Structure, Assessment and Assignments Conference, Paris, France, March 2–13; pp. 2–13. [Google Scholar]
- Gardner, Howard. 1983. Frames of Mind: The Theory of Multiple Intelligences. New York: Basic Books, ISBN1 0465025080. ISBN2 9780465025084. [Google Scholar]
- Gardner, Howard. 2006. Multiple Intelligences: New Horizons. New York: Basic Books, ISBN 0465047688. [Google Scholar]
- Harward Project Zero. n.d. Project Zero Home Page. Available online: http://www.pz.harvard.edu/ (accessed on 4 June 2022).
- Hetland, Lois, Ellen Winner, Shirley Veenema, and Kimberly M. Sheridan. 2007. Studio Thinking: The Real Benefits of Visual Arts Education. Boston: Teachers’ College Press. [Google Scholar]
- Kárpáti, Andrea, and Bernadett Babály. 2021. Development of spatial skills through the Moholy-Nagy Visual Modules: A longitudinal study. In Crossing Boundaries and Disciplines: The Book of Selected Readings 2019. Edited by Danilo M. Baylen. Broken Arrow: International Visual Literacy Association Press (IVLA), pp. 24–43. ISBN 978-0-945829-13-3. [Google Scholar]
- Kárpáti, Andrea, and Emil Gaul. 2011. From Child Art to Visual Language of Youth: The Hungarian Visual Skills Assessment Study. International Journal of Arts 9: 108–32. [Google Scholar]
- Kárpáti, Andrea, and Emil Gaul. 2013. The Hungarian Visual Skills Assessment Study. In From Child Art to Visual Language of Youth—New Models and Tools for Assessment of Learning and Creation in Art Education. Edited by Andrea Kárpáti and Emil Gaul. Bristol: Intellect Publishers, pp. 75–100. ISBN 9781841506241. [Google Scholar]
- Kirchner, Constanze, Tanya Gotta-Leger, and Marlene Nockmann. 2016. Lehrpläne zur Visual Literacy in Europa—Ergebnisse einer qualitativ-empirischen Expertenbefragung. In Common European Framework of Reference for Visual Literacy—Prototype. Edited by Ernst Wagner and Diederik Schönau. Münster and New York: Waxmann, pp. 203–10. ISBN 9783830934288. [Google Scholar]
- Klee, Paul. 1973. Pedagogical Sketchbook. Bern: Faber and Faber. First published 1953. [Google Scholar]
- McGivern, Robert F., J. Patrick Huston, Desiree Byrd, Tina King, Greg J. Siegle, and Judy Reilly. 1997. Sex differences in visual recognition memory: Support for a sex-related difference in attention in adults and children. Brain and Cognition 34: 323–36. [Google Scholar] [CrossRef] [PubMed] [Green Version]
- Molnár, Gyöngyvér, and Benő Csapó. 2019. Making the psychological dimension of learning visible: Using technology-based assessment to monitor students’ cognitive development. Frontiers in Psychology 10: 1368. Available online: https://www.frontiersin.org/articles/10.3389/fpsyg.2019.01368/full (accessed on 2 June 2022).
- Schönau, Diederik W. 2012. Towards developmental self-assessment in the visual arts: Supporting new ways of artistic learning in school. International Journal of Education through Art 8: 49–58. [Google Scholar] [CrossRef]
- Schönau, Diederik, Andrea Kárpáti, Constanze Kirchner, and Maria Letsiou. 2020. A new structural model of visual competencies in Visual Literacy. The revised Common European Framework of Reference for Visual Competency. The Literacy, Pre-Literacy and Education Journal 3: 57–72. [Google Scholar]
- Siew, Nyet Moi, Chin Lu Chong, and Mohamad Razali Abdullah. 2013. Facilitating Students’ Geometric Thinking through Van Hiele’s Phase-Based Learning Using Tangram. Journal of Social Sciences 9: 101. [Google Scholar] [CrossRef]
- Siu, Kin Wai Michael, Mei Seung Lam, and Yi Lin Wong. 2015. Gender Differences in Children’s Use of Colors in Designing Safety Signs. Procedia Manufacturing 3: 4650–57. [Google Scholar] [CrossRef]
- Stavridou, Fotini, and Domna Kakana. 2008. Graphic abilities in relation to mathematical and scientific ability in adolescents. Educational Research 50: 75–93. [Google Scholar] [CrossRef]
- Veltri, Natasha, Hanna Krasnova, Annika Baumann, and Neena Kalayamthanam. 2014. Gender differences in online gaming: A literature review. In Smart Sustainability: The Information Systems Opportunity, Paper Presented at 20th Americas Conference on Information Systems, Savannah, GO, USA, August 7–9. Atlanta: Association for Information Systems (AIS), pp. 3884–94. ISBN 9781632667533. [Google Scholar]
- Wagner, Ernst, and Diederik Schönau, eds. 2016. Common European Framework for Visual Literacy—Prototype. Münster and New York: Waxmann Verlag, ISBN 9783830934288. [Google Scholar]
- Weinert, Franz E. 2001. Leistungsmessung in Schulen—Eine umstrittene Selbstverständlichkeit. In Leistunsgmessung in Schulen. Edited by Franz E. Weinert. Weinheim and Basel: Beltz, pp. 17–31. ISBN 9783407256904. [Google Scholar]
- Wilde, Judith, and Richard Wilde. 2000. Visual Literacy: A Conceptual Approach to Graphic Problem Solving. New York: Watson-Guptill Publications, ISBN 0823056201. [Google Scholar]
- Winner, Ellen, Thalia R. Goldstein, and Stéphan Vincent-Lancrin. 2013. Art for Art’s Sake?: The Impact of Arts Education. OECD Publishing. [Google Scholar] [CrossRef]
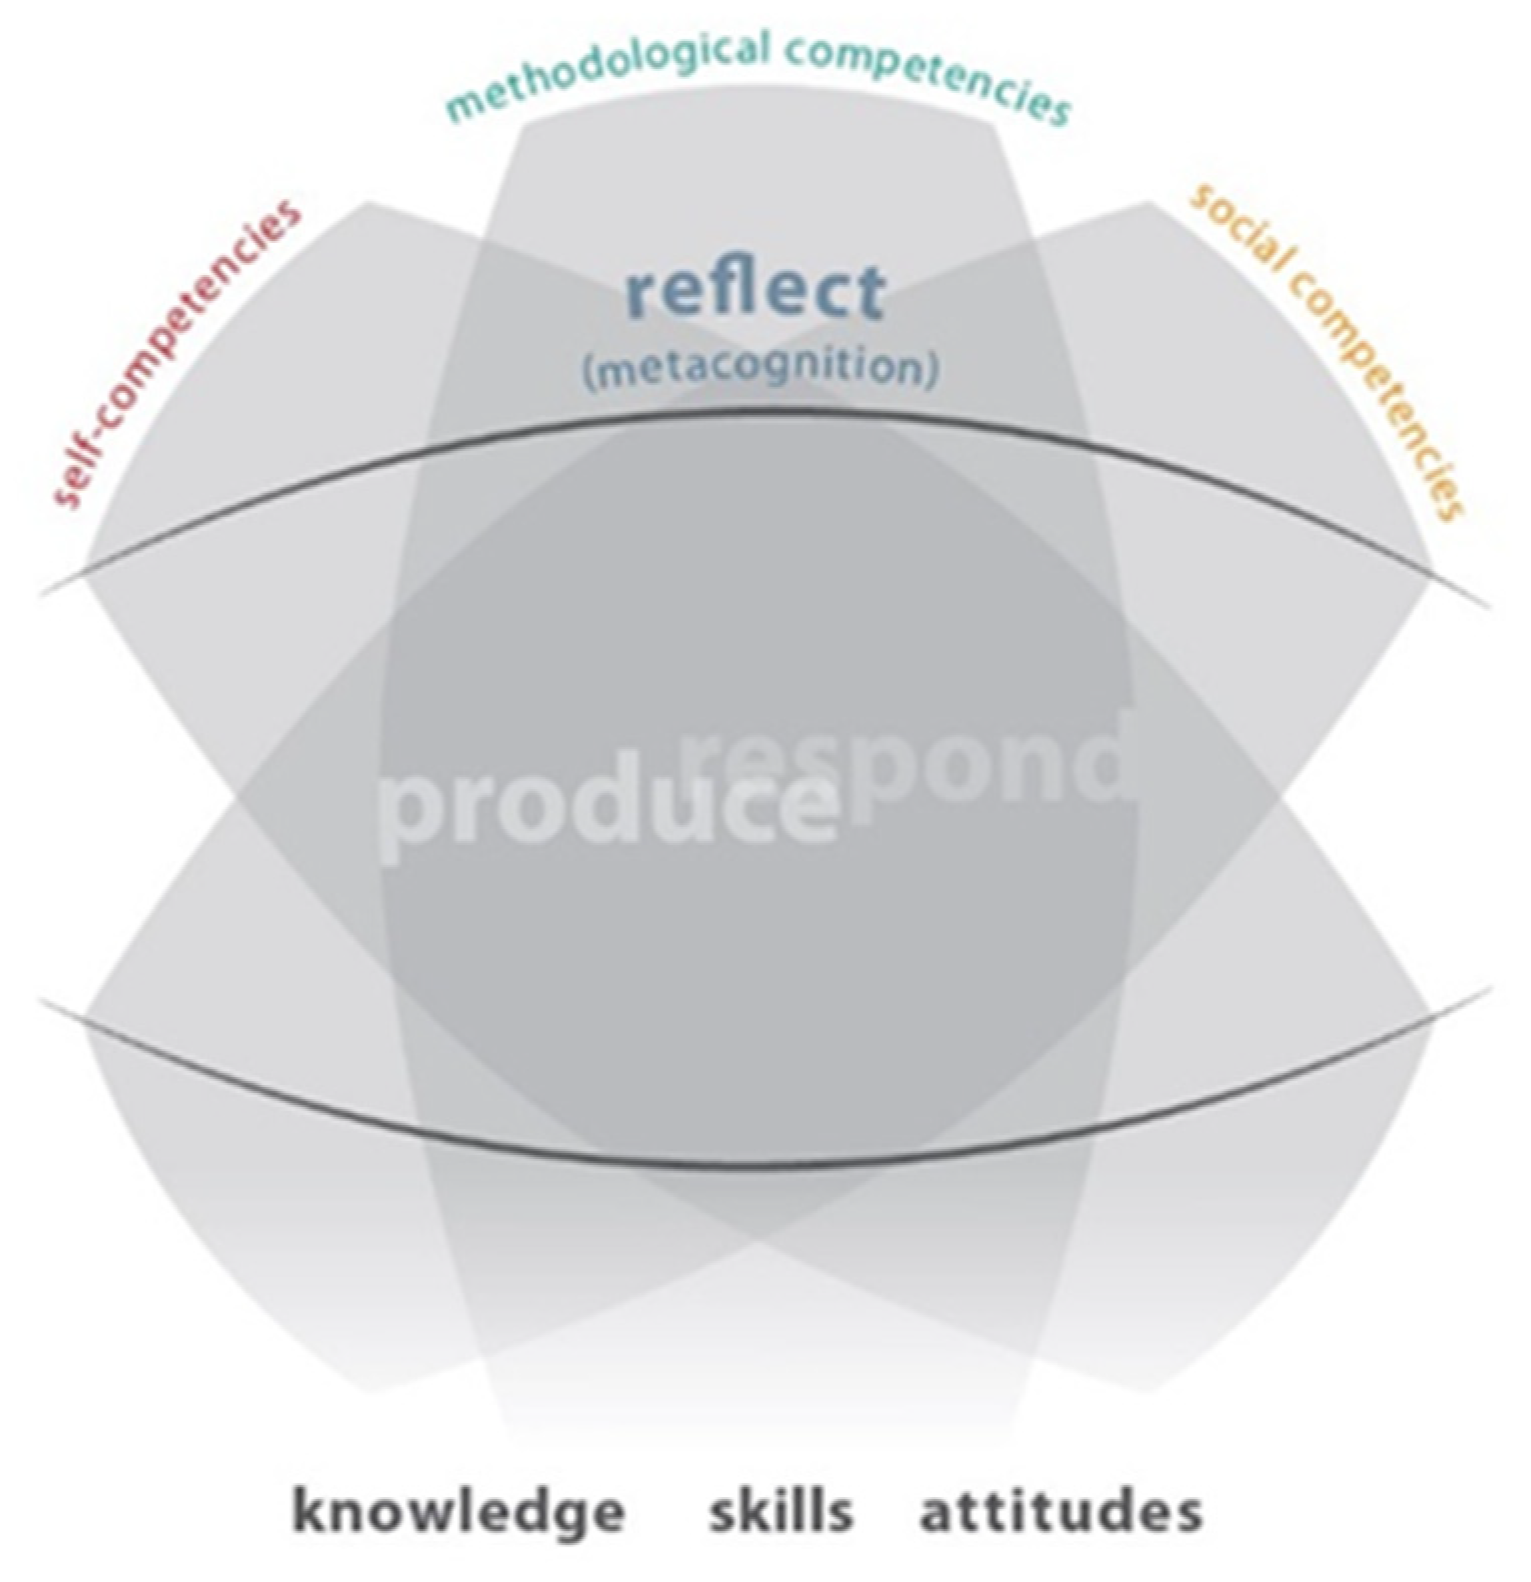
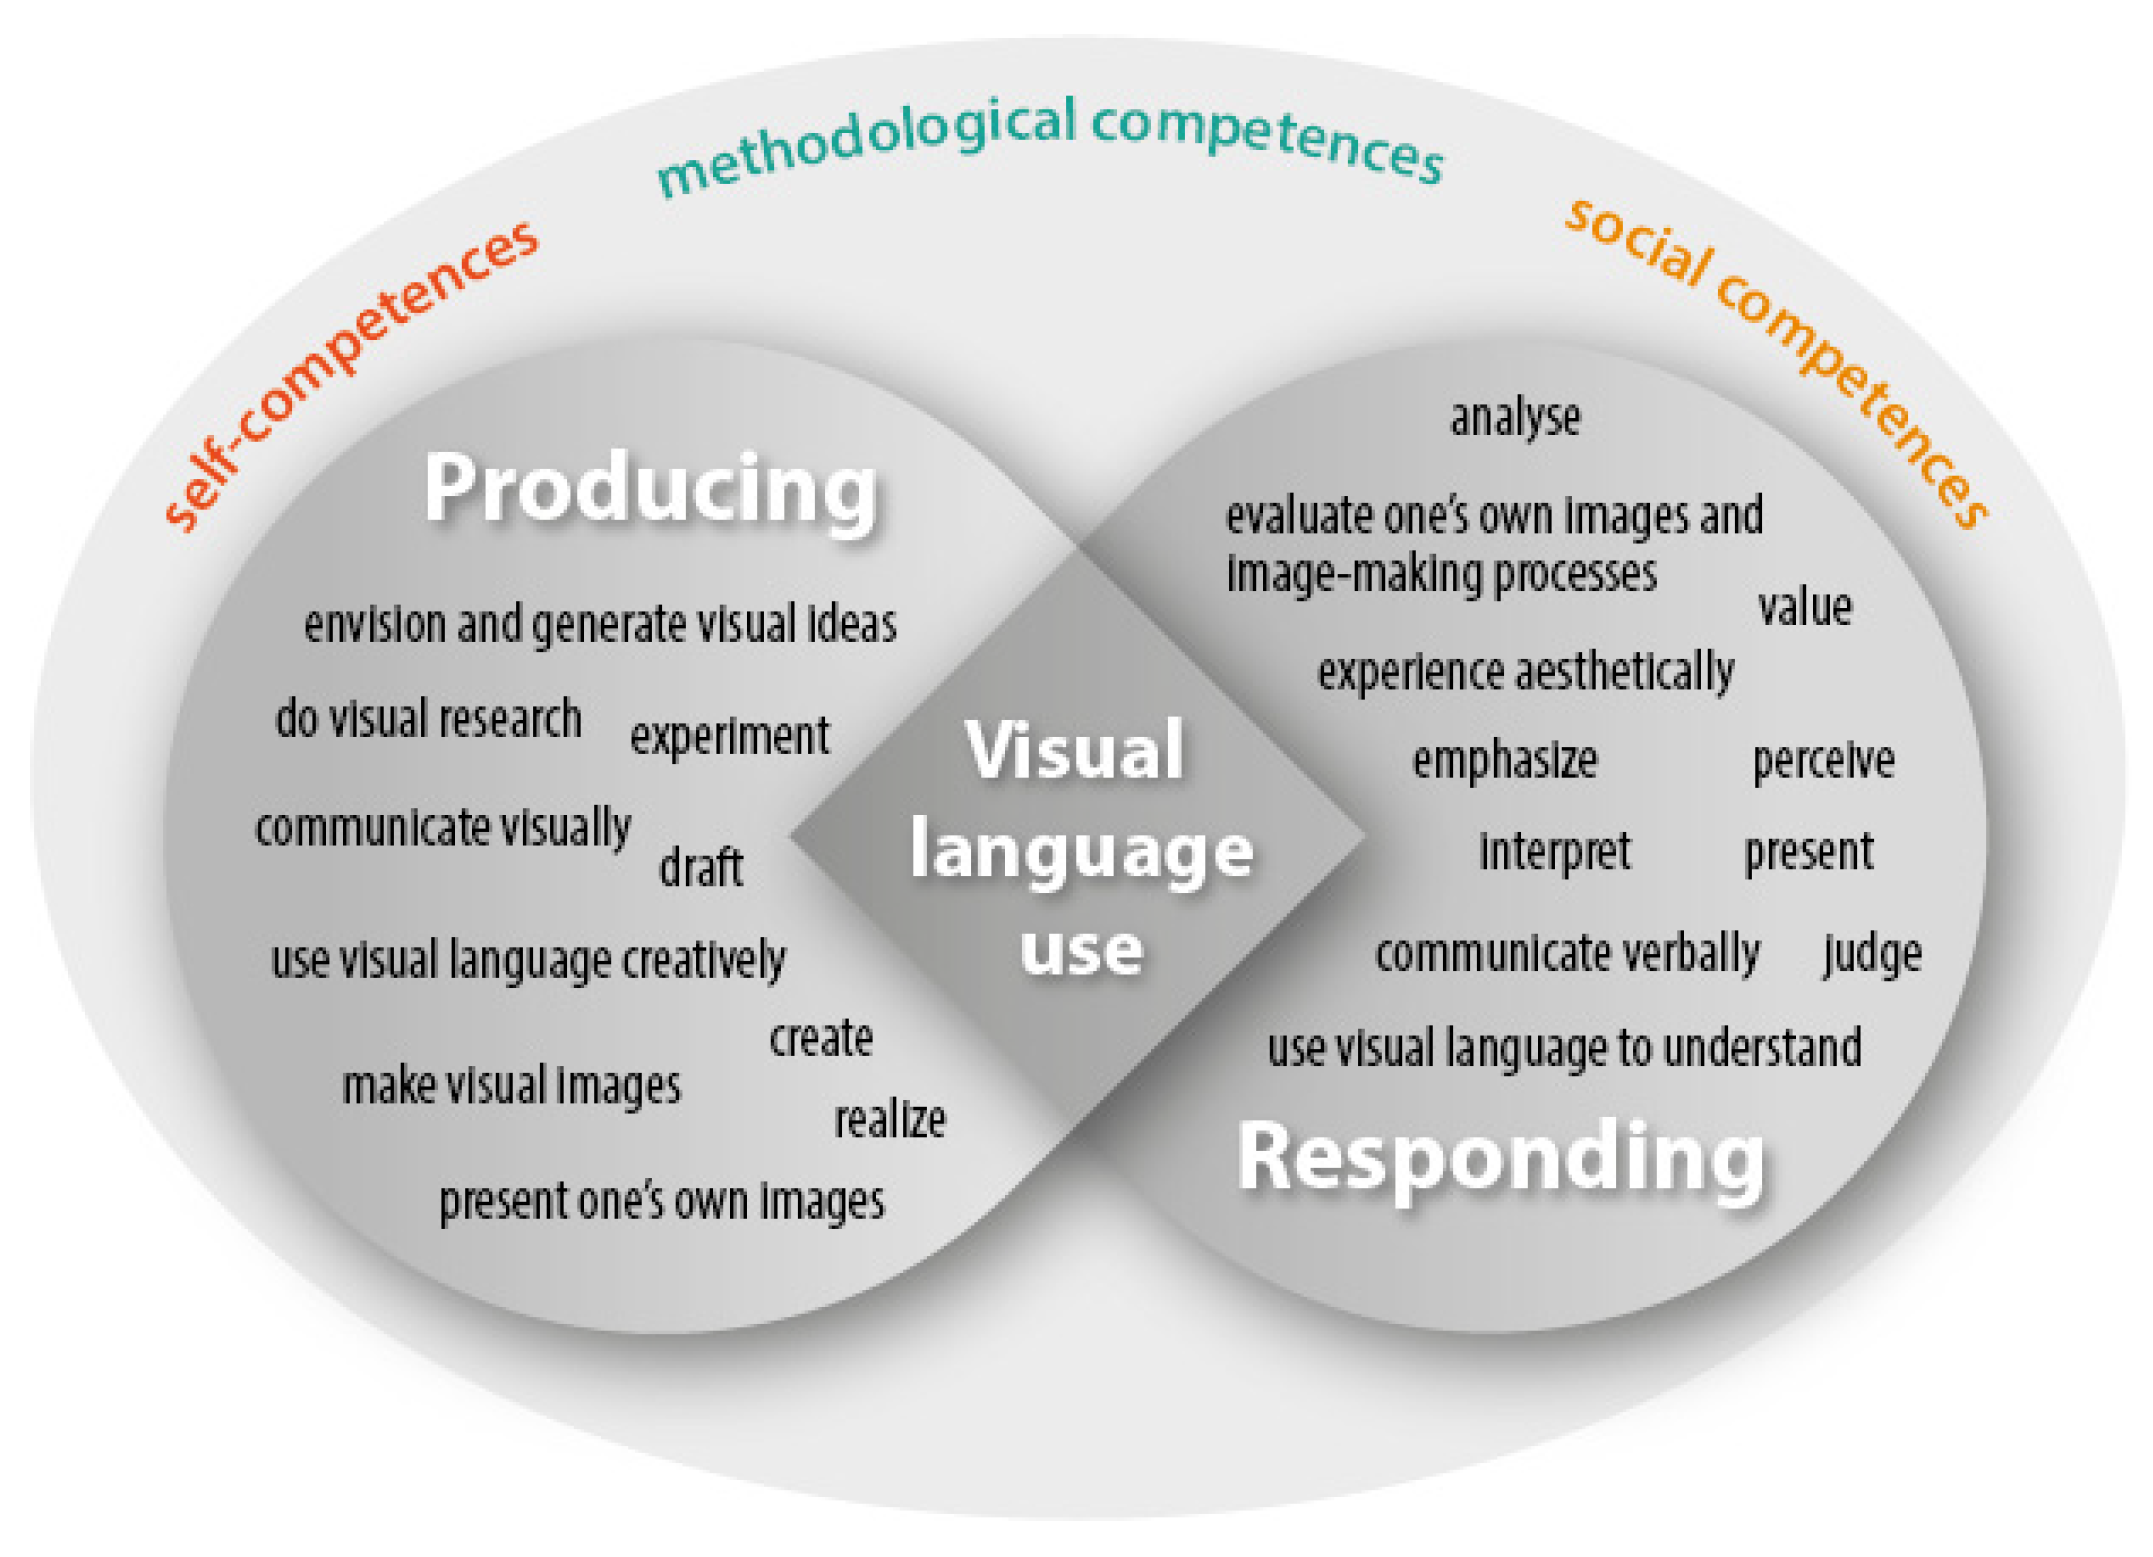
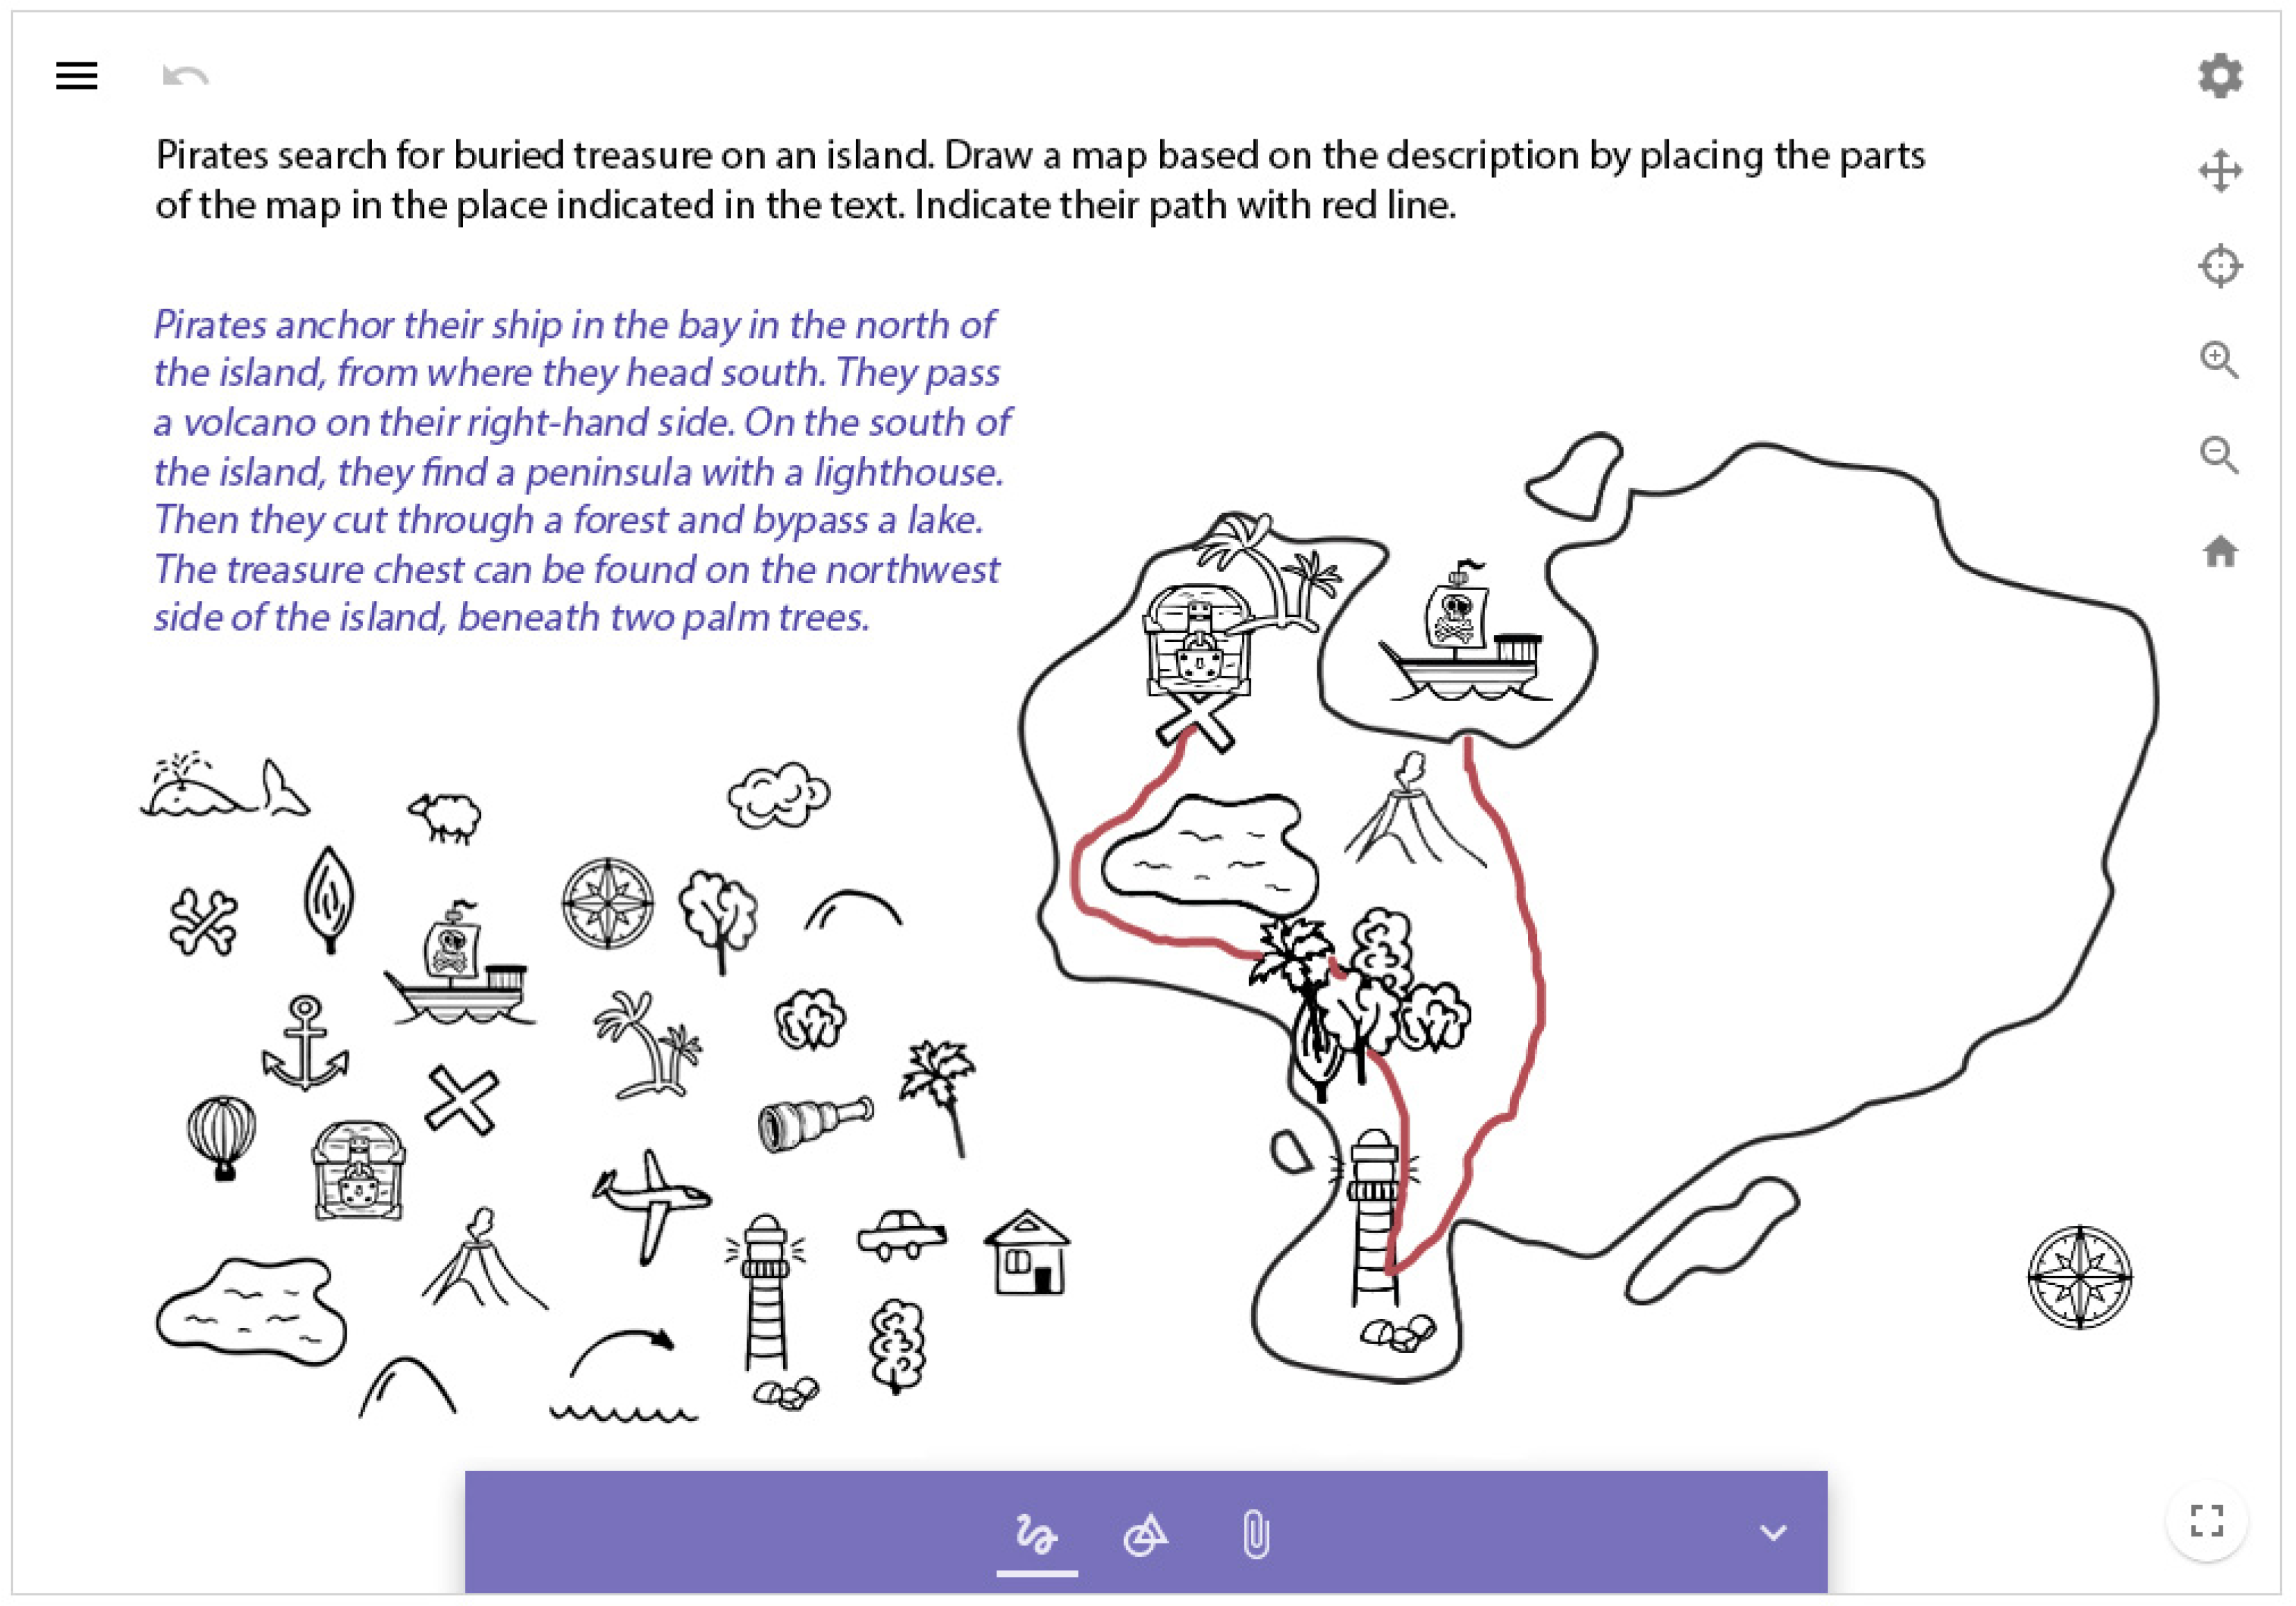

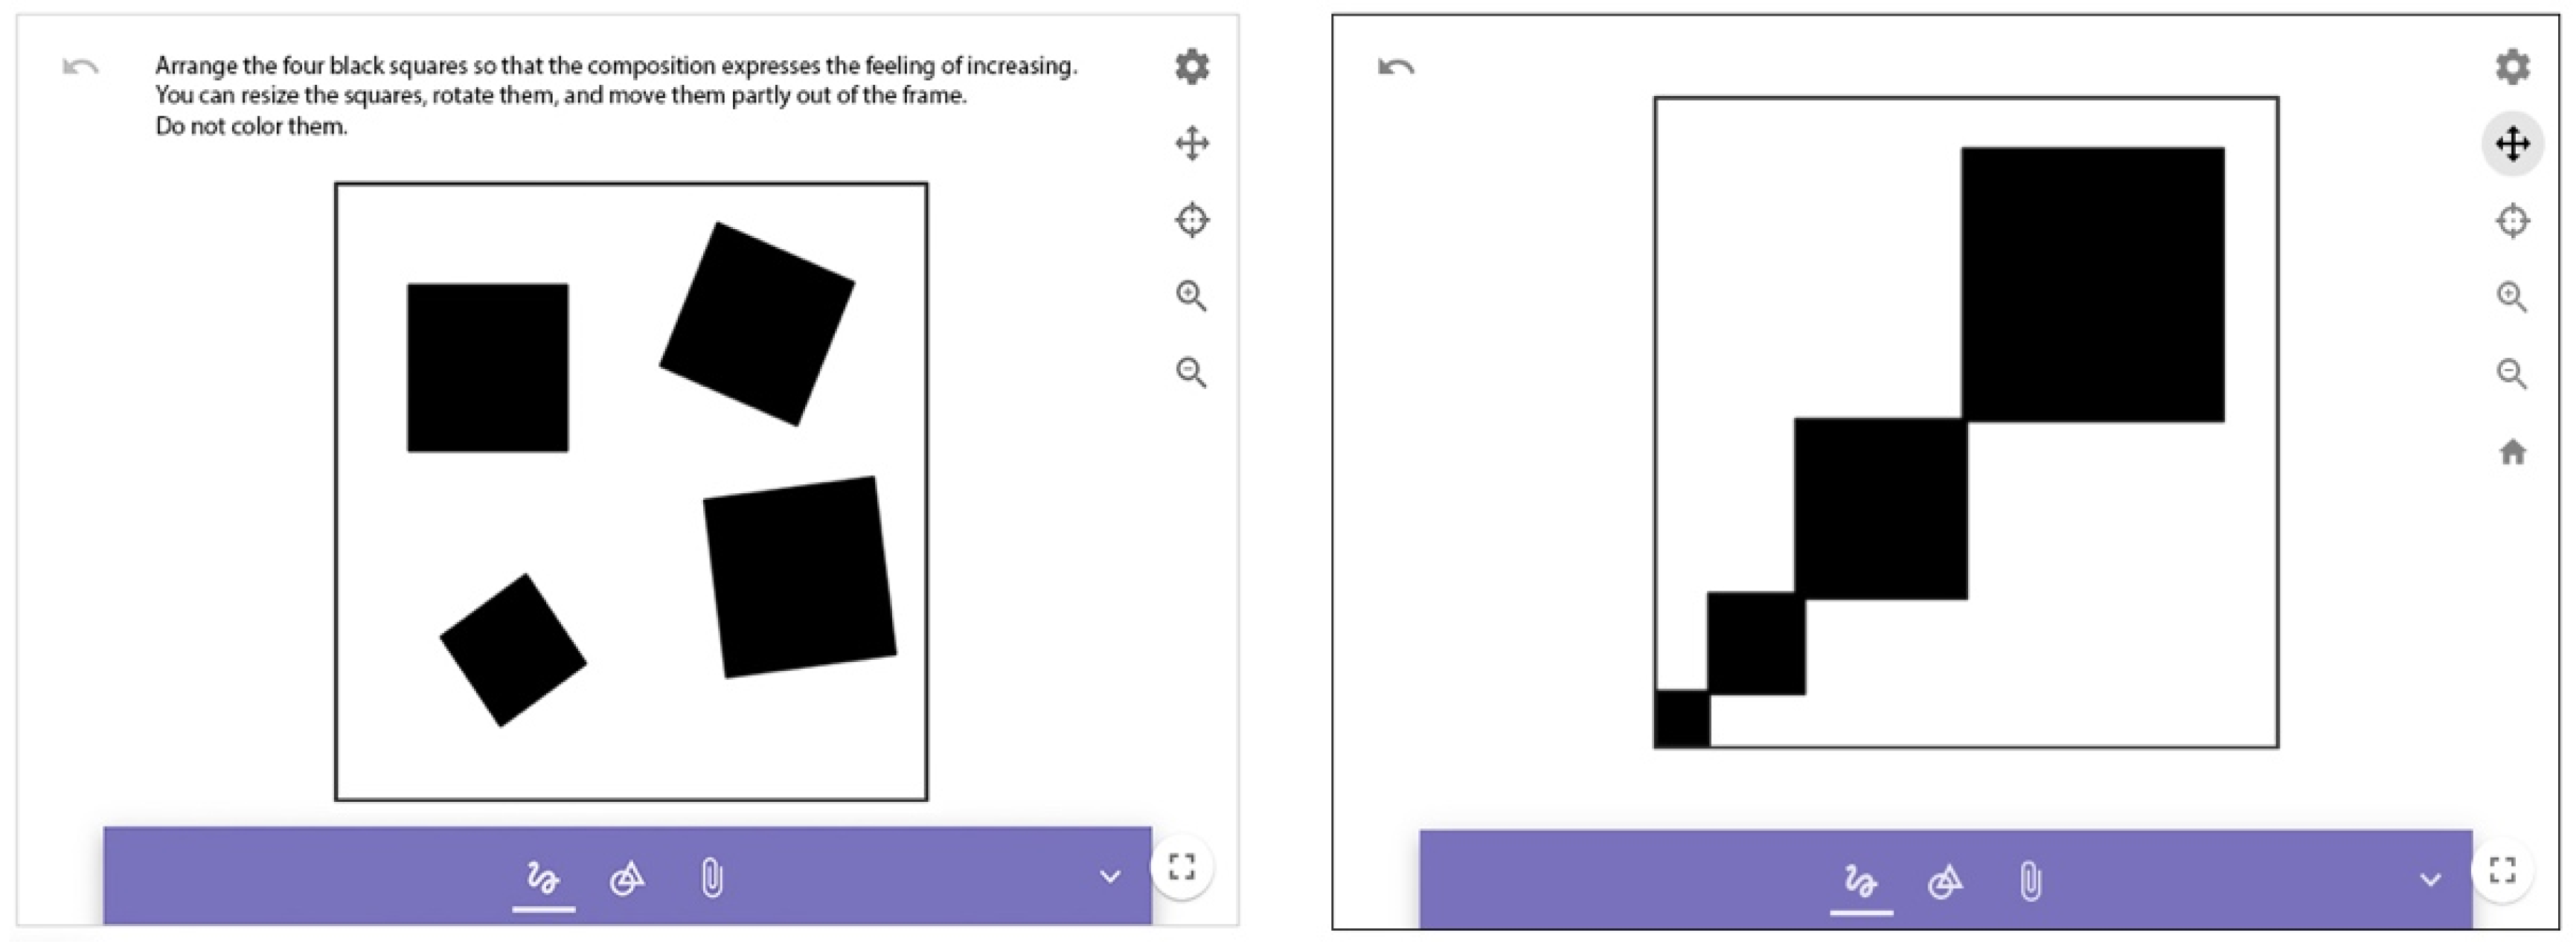


| Subskills | Explanation of Concept | Activities Related to the Subskills |
|---|---|---|
| Two-dimensional (2D) composition | Creating and arranging visual elements. Use of colors. | Organizing and emphasizing visual elements of a pictorial representation. Creating visual dynamics, rhythm, hierarchy. Assigning meaning to certain forms through spatial arrangement. Use of color to direct attention, color contrasts, hues, tones, saturation. |
| Creation of visual symbols | Creating symbols, allegories, visual metaphors, and metonyms. | Making explanatory diagrams, pictograms, logos, and maps. Representing a word, concept, or description by creating a unique symbol or symbol system (and hierarchy within it). |
| Abstraction | Creating visual signs and shapes by highlighting and simplifying images. Creating shapes with specific meaning. Conventional, rule-based signs and images, visual representation of proportions. Expression and representation of real or imagined relationships, representing time and movement. | Visual representation of data, relationships, concepts, structures, and proportions. Creating explanatory drawings, diagrams, flow charts (e.g., map, path, assembly drawing). In several visual genres, symbolization and abstraction are both present. |
| Modality shift | Visualization of narratives. | Making a picture to illustrate a written or orally transmitted text. |
| Skill | Subskills | Activities to Assess Subskills |
|---|---|---|
| Visual recognition, differentiation | Recognition of two-dimensional (2D) forms 1 | Recognition of visual signs (e.g., dots, lines, spot, tone, color, form). Recognition of the meaning of signs in familiar context. |
| Visual interpretation | Recognition of two-dimensional (2D) forms 2 | Recognition of simple visual signs and sign groups in familiar and new context. |
| Visual analysis | Recognition of two-dimensional (2D) forms 3 | Analysis of complex visual signs and sign groups (compositions) related to form and content. Analysis of relations between pictorial components in connection with content. Interpretation of visual emphases. Analysis of well-known visual signs in new context. |
| Visual recognition | Abstraction 1 | Differentiation between and recognition of signs and sign groups; observe techniques of emphasis through methods of pictorial composition. |
| Visual interpretation | Abstraction 2 | Interpretation of the relations between real-life images and visual signs. Interpretation of explanatory drawings, charts, and diagrams based on conventions and rules. Interpretation of relations among images, observation of changes (e.g., acceleration of movement). |
| Visual analysis | Abstraction 3 | Employment of methods of form and function analysis: interpretation of diagrams, pictorial signs, groups of signs, and works of architecture and design. |
| Visual recognition | Symbolization 1 | Recognition, definition, and naming of symbols, allegories, and visual metaphors in familiar contexts. |
| Visual interpretation | Symbolization 2 | Separation, comparison, and analysis of symbols, allegories, and visual metaphors in partially familiar contexts. |
| Visual analysis | Symbolization 3 | Analysis and assessment of symbols, allegories, visual signs, and metaphors in new contexts. |
| Visual recognition | Modality shift 1 | Recognition of different experiences and modalities (seeing, hearing, smelling, touching, tasting) in images and signs; connection of familiar images and signs to different modalities. |
| Visual interpretation | Modality shift 2 | Connection of different experiences, modalities (seeing, hearing, smelling, touching, tasting) to images. Connection of familiar and partially new signs with different modalities. |
| Visual analysis | Modality shift 3 | Analysis of connections of sensory experiences in different modalities (seeing, hearing, smelling, touching, tasting) with visual signs. |
| Subskills | Image Types | Number of Tasks | Number of Items |
|---|---|---|---|
| Recognition and differentiation: recognition of form and color, matching a part and the whole of the image, matching images represented through different media | Paintings and sculpture in classic historic styles, snapshots and phase photos, storybook illustrations | 11 | 38 |
| Visual interpretation and recognition of connections: recognizing depicted activities and objects; symbolization 1: attaching meaning to abstract images, symbolization 2: connecting messages of a musical sequence with abstract images, matching a literary work with its illustration | Maps, simple linear drawings, works of art, basic elements of visual language (dot, line, geometric shapes, patches), pictograms of everyday use, storybook illustrations | 26 | 67 |
| Visual analysis: reading graphs and charts, interpreting color symbols and spatial relations. | Instruction sheets, graphs and charts, photos, works of art | 9 | 14 |
| Parameters | Paper-Based Test Scores | Digital Test Scores | ||
|---|---|---|---|---|
| Males (N = 57) | Females (N = 46) | Males (N = 151) | Females (N = 134) | |
| Mean (%) | 40.27 | 60.87 | 50.13 | 50.96 |
| Std dev. (%) | 16.99 | 16.81 | 20.10 | 18.73 |
| Category | Test |
|---|---|
| Number of items | 23 |
| Number of participants (N) | 312 |
| Cronbach’s alpha | 0.82 |
| Mean (%) | 49.64 |
| Std. Deviation (%) | 20.62 |
| Age (Year) | N | Test Results | One-Way ANOVA | Significantly Different Groups Based on Dunnett’s T3 Test | |||
|---|---|---|---|---|---|---|---|
| Mean (%) | Std Dev. (%) | F | p | ηp2 | |||
| 11 | 71 | 37.13 | 17.77 | 39.27 | <0.001 | 0.30 | {11:12} < {13:14} |
| 12 | 74 | 44.60 | 16.76 | ||||
| 13 | 64 | 56.17 | 13.03 | ||||
| 14 | 77 | 64.24 | 17.38 | ||||
| Parameters | Students | Independent-Sample t-Test | |||
|---|---|---|---|---|---|
| Boys (N = 151) | Girls (N = 134) | Z | p | Cohen’s d | |
| Mean (%) | 50.13 | 50.96 | −0.42 | 0.66 | 0.04 |
| Std dev (%) | 20.10 | 18.73 | |||
| Category | Test Tasks (N = 312) | ||||||
|---|---|---|---|---|---|---|---|
| 1. Color Contrast | 2. Graphic Symbol 1. | 3. Graphic Symb. 2. | 4. Figure Comp. 1. | 5. Figure Comp. 2. | 6. Spatial Repr. | 7. Visual Rhythm | |
| Item number | 2 | 6 | 5 | 3 | 2 | 4 | 2 |
| Cronbach’s alpha | 0.59 | 0.72 | 0.46 | 0.74 | 0.92 | 0.69 | - |
| Mean (%) | 41.46 | 58.65 | 48.08 | 52.72 | 52.55 | 47.13 | 53.69 |
| Std. dev (%) | 36.03 | 30.63 | 26.70 | 35.53 | 43.17 | 30.82 | 45.12 |
| Parameters | Device | Independent-Sample t-Test | |||
|---|---|---|---|---|---|
| Tablet (N = 182) | PC (N = 104) | Z | p | Cohen’s d | |
| Mean (%) | 49.66 | 52.29 | −0.42 | 0.27 | 0.13 |
| Std. dev (%) | 18.83 | 20.54 | |||
| Grades | Number of Items | Cronbach’s α | N (Valid Tests) |
|---|---|---|---|
| Grade 4 | 57 | 0.87 | 416 |
| Grade 5 | 64 | 0.89 | 217 |
| Grade 6 | 72 | 0.89 | 482 |
| Grades | EAP/PV Reliability Indicators |
|---|---|
| Grade 4 | 0.84 |
| Grade 5 | 0.83 |
| Grade 6 | 0.85 |
| Model | χ2 | p | df | CFI | TLI | RMSEA (95% CI) |
|---|---|---|---|---|---|---|
| Grade 4 | 1746.13 | <0.001 | 703 | 0.679 | 0.658 | 0.063 (0.059–0.067) |
| Grade 5 | 3144.69 | <0.001 | 1371 | 0.742 | 0.731 | 0.063 (0.060–0.066) |
| Grade 6 | 6701.85 | <0.001 | 1431 | 0.587 | 0.569 | 0.057 (0.055–0.060) |
| Grade | N | Minimum | Maximum | Mean (%) | Std. Dev (%) |
|---|---|---|---|---|---|
| 4 | 432 | 0 | 55 | 67.57 | 15.47 |
| 5 | 338 | 0 | 63 | 67.11 | 14.77 |
| 6 | 486 | 0 | 69 | 67.56 | 15.02 |
| Total | 1256 | 0 | 69 | 67.44 | 15.10 |
Publisher’s Note: MDPI stays neutral with regard to jurisdictional claims in published maps and institutional affiliations. |
© 2022 by the authors. Licensee MDPI, Basel, Switzerland. This article is an open access article distributed under the terms and conditions of the Creative Commons Attribution (CC BY) license (https://creativecommons.org/licenses/by/4.0/).
Share and Cite
Simon, T.; Biró, I.; Kárpáti, A. Developmental Assessment of Visual Communication Skills in Primary Education. J. Intell. 2022, 10, 45. https://doi.org/10.3390/jintelligence10030045
Simon T, Biró I, Kárpáti A. Developmental Assessment of Visual Communication Skills in Primary Education. Journal of Intelligence. 2022; 10(3):45. https://doi.org/10.3390/jintelligence10030045
Chicago/Turabian StyleSimon, Tünde, Ildikó Biró, and Andrea Kárpáti. 2022. "Developmental Assessment of Visual Communication Skills in Primary Education" Journal of Intelligence 10, no. 3: 45. https://doi.org/10.3390/jintelligence10030045
APA StyleSimon, T., Biró, I., & Kárpáti, A. (2022). Developmental Assessment of Visual Communication Skills in Primary Education. Journal of Intelligence, 10(3), 45. https://doi.org/10.3390/jintelligence10030045


