Abstract
The presented work is devoted to isocyanate synthesis by the thermal decomposition of carbamates model. The work describes the existing isocyanate-obtaining processes and the main problems in the study of isocyanate synthesis by the thermal decomposition of carbamates, which can be solved using mathematical and computer models. Experiments with carbamates of various structures were carried out. After processing the experimental data, the activation energy and the pre-exponential factor for isocyanate synthesis by the thermal decomposition of carbamates were determined. Then, a mathematical model of the reactor for the thermal decomposition of carbamates using the COMSOL Multiphysics software was developed. For this model, computational experiments under different conditions were carried out. It was shown that the calculation results correspond to the experimental ones, so the suggested model can be used in the design of the equipment for isocyanate synthesis by the thermal decomposition of carbamates.
1. Introduction
Isocyanates are currently one of the most in demand products in the chemical industry, since they are used as raw materials in polyurethane production [1]. Polyurethanes are used in many industries, including construction; in the manufacture of automotive parts; and as insulation materials, paints, varnishes, adhesives, fillers for upholstered furniture, etc. [1]. Isocyanates are also valuable intermediates in the fine organic synthesis of pesticides and other biologically active substances. However, isocyanate production is associated with a number of problems because intermediates are highly toxic and explosive substances, and, therefore, ensuring industrial safety requires great investment.
1.1. Isocyanates: An Overview of Preparation Methods
The phosgenation of amines is the most popular method for isocyanate synthesis [2]. The toxicity of phosgene and the risk of its leakage, however, create a number of disadvantages in this method. Moreover, phosgenation generates a large volume of hydrochloric acid, which causes the corrosion of the equipment, thereby increasing the maintenance costs. Notably, the inconvenience of transporting phosgene due to its toxicity also limits the applicability of the method, especially in small-scale production. The global trend of green chemistry calls for alternative phosgene-free methods for producing isocyanates [3].
The thermal decomposition of carbamates is a promising method for isocyanate production as an alternative to the phosgene method. Methods for the production of industrially important aliphatic monoisocyanates with low boiling points are prioritized. These isocyanates are consumed in large volumes and have a very wide range of application.
The currently existing methods for isocyanate production by the thermolysis of carbamates can be divided into gas and liquid phases.
1.1.1. Gas-Phase Methods for the Isocyanate Synthesis by Thermal Decomposition of Carbamates
The process of the thermolysis of carbamates (urethanes), esters of carbamic acid, in the gas phase is widely described in patent literature [4,5,6,7,8,9,10]. Urethane degradation can be carried out in a wide range of operating pressures and temperatures, with [8,11,12,13] or without catalysts [14,15], according to the patent data. Almost any carbamate synthesized from thermally stable alcohols and amines can be degraded to produce isocyanates. The thermolysis of carbamates in the gas phase is carried out at temperatures of some 400 °C. It has a number of disadvantages, including a high amount of byproducts, which leads to contaminated devices, high equipment requirements, and increased energy consumption.
1.1.2. Liquid-Phase Methods for the Isocyanate Synthesis by Thermal Decomposition of Carbamates
In order to lower the process temperature and reduce undesirable side reactions, liquid-phase methods for the isocyanate synthesis by the thermal decomposition of carbamates were developed. A review of patent sources shows that there are several directions for the research of the optimal process in the liquid phase. For instance, the thermolysis of urethanes can be carried out in high-boiling inert solvents [16,17,18,19,20,21]. This research direction is divided into several categories according to the type of catalyst used for thermolysis. Thermolysis in those solvents that exhibit catalytic activity during carbamate thermolysis looks promising [18]. The development using ionic liquids as a solvent, which is described in [22,23], is also of interest.
We studied patented methods that used high-boiling solvents and came to the conclusion that, in most cases, aliphatic or aromatic hydrocarbons are used as solvents, and transition metals and their compounds are used as thermolysis catalysts [24,25,26]. For example, [24] proposes a method for isocyanate production by the thermal decomposition of urethanes in a high-boiling solvent with a wide range of metals or metal compounds, such as manganese, molybdenum, tungsten, vanadium, iron, cobalt, chromium, copper, and nickel, as a catalyst.
1.2. Mathematical Modeling: An Overview of Software Products
Based on the review of the literature discussed above, gas-phase non-catalytic thermolysis is the most industrially applicable phosgene-free method of synthesizing isocyanates from carbamates. In order to shift the equilibrium of the main reaction and synthesize a purer isocyanate, the process should be carried out with an inert carrier gas or under vacuum. It is easier to control an inert gas than a vacuum along the entire reactor length, and an inert gas does not depend on the hydraulic resistance of the reactor. Carrier gas processes, apart from being easily scaled up, can reduce the partial pressure of carbamates in the gas phase, which helps to lower their boiling points. This ensures an easy and complete evaporation of carbamates upon entry into the thermolysis reactor, which decreases the amount of by-products.
The development of new efficient processes and optimization of existing technological facilities provides the development of chemical technology. Therefore, computer modelling realized by running specialized programs that provide a highly accurate mathematical description of the processes under study is of interest at the present stage of chemical technology development. Modern approaches to mathematical and computer modeling are widely used both in the study of a specific process and production development. Mathematical modeling makes it possible to study the properties of objects on mathematical models, predict optimal schemes and operating modes of commercial plants, and develop automated control systems for technological processes. Mathematical modeling also allows the scaling up of the process and optimizing critical parameters at the design stage of a semi-commercial plant under non-isothermal conditions in the reactor [27].
Such computer models are based on:
- –
- heat and material balances;
- –
- component composition;
- –
- the nature of the interacting substances.
When studying any chemical technological process, material balances are introduced in the form of differential equations that represent the law of conservation of matter.
Heat balance includes the thermodynamic properties of the components, such as the density and temperature at the boiling point or under normal conditions, as well as the heat of combustion and formation, viscosity, etc.
This simulation system usually consists of:
- –
- the Chao–Seader method;
- –
- the Redlich–Kwong or other equations of state for non-ideal gases;
- –
- the NRTL method (Non-Random Two-Liquid);
- –
- the Hayden–O’Connell vapor fugacity methods for dimerizing components;
- –
- special calculation methods, including those for carbamates, isocyanates, amines, and alcohols.
Those methods, widely described in [28,29], allow solving a significant part of the issues with chemical technological processes.
Modelling helps to study the following processes [30]:
- –
- gas separation;
- –
- the separation of liquids, including two immiscible liquids;
- –
- evaporation or condensation;
- –
- heat exchange processes, including heating and cooling;
- –
- the mixing of streams.
Currently, the main software packages used in chemical technology are as follows:
- –
- Aspen Plus;
- –
- Aspen HYSYS;
- –
- CHEMCAD;
- –
- COMSOL Multiphysics.
This paper studies methods for the synthesis of three aliphatic isocyanates by the thermal decomposition of carbamates, researches the kinetics of the thermolysis, and proposes a mathematical model of the process developed with the COMSOL Multiphysics software. In addition, this paper assesses the efficacy of the model and establishes its limits.
1.3. Statement of the Problem
The main problem in the study of isocyanate production by the thermal decomposition of both aliphatic and aromatic carbamates is the absence of the described kinetic regularities. However, there are a large number of patents on this topic, including descriptions of pilot plants and their operating modes. The latter suggests that this area is promising, because the thermal decomposition of carbamates allows us to abandon the use of highly toxic phosgene and to avoid problems associated with the resulting hydrogen chloride.
The main goal of this work was to develop a universal method for obtaining isocyanates from carbamates using modern modeling methods, with the possibility of the further integration of this technology into enterprises of the low-tonnage production of biologically active substances from groups of pesticides, fungicides, insecticides, and medicines. Equipment using this technology can be installed in close proximity to the production facilities discussed above.
To reach this goal, we created a laboratory plant for the thermal decomposition of carbamates, in which the displacement reactor was the most important unit. We carried out a large number of experiments with carbamates of various structures and studied the dependence of the initial substance conversion on the directly controlled parameters—the temperature and flow rate of the carrier gas, which determine the residence time in the reactor. After processing the experimental data, the reaction rate constant and the pre-exponential multiplier were determined. Then, we created a mathematical model of the carbamate thermal decomposition reactor in accordance with the characteristics, determined the process conditions, and calculated the conversion at the specified values of variables. At the next stage, the adequacy of the model was checked, which consisted of checking the experimental and calculated values using the Fisher statistical method, the positive result of which indicates the sufficient reliability of the model. It is important to highlight that the proven model can be used in the design of the equipment.
An approach for determining the reaction rate constant and the pre-exponential multiplier was proposed. A model of a carbamate thermal decomposition reactor was developed using the computational fluid dynamics (CFD )method realized in the COMSOL Multiphysics software. The adequacy of the developed model was verified by comparing the experimental and calculated values of the transformation degree. It is important to highlight that the proven model can be used in the design of the equipment.
2. Materials and Methods
2.1. Experimental Studying
The research objects are O-methyl-N-(n-butyl) carbamate, O-methyl-N-cyclohexyl carbamate, and O-methyl-N-benzyl carbamate, which are the raw materials for the synthesis of industrially significant aliphatic isocyanates n-butyl isocyanate, cyclohexyl isocyanate, and benzyl isocyanate.
2.1.1. Methods of Conducting Experiments
The chemical reaction network for a kinetic study is shown in Figure 1.
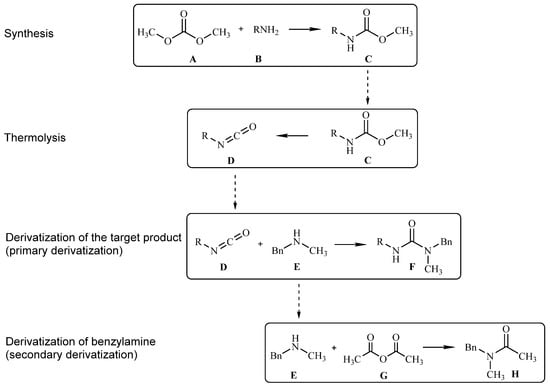
Figure 1.
Chemical reactions during the process under study.
The reaction involves the interaction of a primary amine A and an electrophilic agent B (dimethyl carbonate) with the production of the required carbamate C, which is then thermally decomposed in a displacement reactor at a temperature of between 250 and 600 °C. Then. the reaction mass containing the target isocyanate D and the unreacted carbamate C as the main products is absorbed into a sorption solution containing N-methyl-N-benzylamine E and 3,5-dibromopyridine as an internal standard. As a result of the reaction between isocyanate D and N-methyl-N-benzylamine E, asymmetric urea F is produced. In order to improve the separation of peaks in HPLC analysis, a molar excess of amine E with respect to carbamate C binds with acetic anhydride G, forming the corresponding acetamide H during sample preparation. The resulting sample can be sent for analysis in order to obtain the molar ratio of the reaction products. All the conditions of analytical measurements were determined for a qualitative and quantitative analysis of the resulting mixtures of products after thermolysis. Moreover, the design strategy for a thermal decomposition laboratory plant was chosen.
2.1.2. Methods of Analytical Research
The samples were analyzed using the Shimadzu LC20 Promince high-performance liquid chromatography system (LC-20AD pump; MZ PerfectSil Target C18 250 mm × 4.6 mm, 5 microns column; RID-20A refractometric detector and SPD-20A UV detector installed in series).
Conditions for the chromatographic measurements:
- Eluent: deionized water–acetonitrile mixture in the ratio of 45:55.
- The mode of elution: isocratic.
- Column temperature: (25 ± 5) °C.
- Detector applications: a 254 nm spectrophotometric detector for O-methyl-N-benzyl carbamate analysis and a refractometric detector for O-methyl-N-cyclohexyl carbamate and O-methyl-N-(n-butyl) carbamate analysis.
- The speed of the eluent flow: 1.0 mL/min.
- Sample volume: 10 µL.
2.1.3. Description of the Laboratory Plant
A laboratory facility was constructed, since the gas-phase thermolysis of carbamates was chosen. The facility was based on a reactor, with the hydrodynamic regime closest to that of a plug-flow reactor. First, the main units of the experimental facility were determined, as shown in Figure 2:
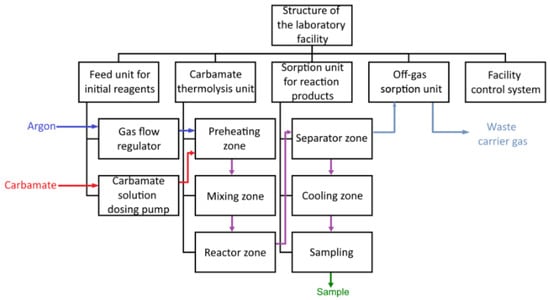
Figure 2.
Block diagram of an experimental facility for carbamate thermolysis.
- Feed unit for initial reagents;
- Preheating system;
- Reactor unit;
- Sorption unit;
- Facility control system.
A laboratory facility was developed to carry out thermolysis; the diagram is shown in Figure 3. The facility consists of a feed unit for initial reagents, a preheating system, a thermal decomposition reactor unit, a sorption unit for reaction products, and a facility control system.
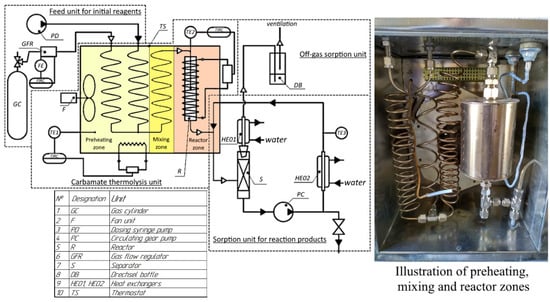
Figure 3.
Diagram of a laboratory facility for carbamate thermolysis.
The characteristics of the most important components of the facility are shown in Table 1.

Table 1.
Composition and characteristics of the components of the facility for thermolysis.
A thermostat (TS) is the basis of the preheating and thermolysis units. The thermostat is a heat-insulated box of 250 × 300 × 330 mm made of stainless steel AISI304 (08X18H10). This section is divided into 2 thermal zones according to its function. From outside, the feed units for the initial reagents are connected to the thermostat on one side and the elements of the sorption unit on the other.
2.1.4. The Results of the Experiments of the Carbamates Thermolysis
A series of experiments were carried out for the decomposition of N-alkyl-O-methyl carbamates in a displacement reactor in the gas phase to obtain experimental data in a wide range of temperatures and residence times for various carbamates—O-methyl-N-benzyl carbamate, O-methyl-N-(n-butyl) carbamate, and O-methyl-N-cyclohexyl carbamate—which allow us to calculate the kinetic parameters of the process. Experiments with a carrier gas flow rate of 0.05 mL/min over the entire temperature range were mandatory for all three carbamates. The remaining experiments were conducted within the selected zone in Table 2 for different carbamates. Depending on the degree of transformation obtained, the experiments could vary or be duplicated.

Table 2.
Parameter range for a series of experiments on the thermal decomposition of N-alkyl-O-methylcarbamates.
The conditions of the experiments and the fractional conversions for all the thermal decomposition kinetics experiments are shown in Table 3, Table 4 and Table 5.

Table 3.
Results of the kinetic measurements of O-methyl-N-benzyl carbamate thermolysis (1c).

Table 4.
Results of the kinetic measurements of O-methyl-N-cyclohexyl carbamate thermolysis (1b).

Table 5.
Results of the kinetic measurements of O-methyl-N-(n-butyl) carbamate thermolysis (1a).
The results show the rise in the degree of conversion of the original starting material with the increasing maximum temperature in the reactor and/or the increasing residence time of the reaction mixture in the reactor, while the formation of such by-products as cyanurates and carbodiimides and other possible products was not observed. This fact indicates a high selectivity of obtaining the corresponding isocyanates from various carbamates.
2.1.5. Processing and Analysis of Experimental Data
A greater number of experiments at high temperatures with high fractional conversions were carried out for N-benzyl-O-methyl carbamate, which led to a greater number of experiments in general compared to other carbamates. The data obtained were used later to assess the efficacy of the developed model. In addition, the obtained experimental data were used to calculate the values of the activation energies Ea and the pre-exponential factors k0. To obtain the calculated values for the degree of conversion, the function was set in a software product MathCAD, allowing us to find the value of the activation energy EA and the pre-exponential factor k0 based on the experimental data (temperature profile of the reactor, the carrier gas flow, and the degree of conversion). The function was compiled based on the equation of unsteady mass transfer, with the assumption of the absence of mass transfer by diffusion and back-mixing because of the insignificant contribution. The function also includes non-isothermic character of the temperature profile and the dimensions of the reactor [30].
where is the degree of transformation in the i-th calculation cell; is the the cross-sectional area of the reactor; is the pre-exponential factor; is the activation energy, J/mol; is the gas constant, 8.31 J/(mol*K); is the the temperature in the reactor, which is described by the function from Section 2.2.3, K; is the total pressure in the reactor, equal to 1 atm; is the the molar flow rate of the gas mixture, mol; is the the degree of transformation determined experimentally; is the estimated length of the cell, ; is the reactor length, m; is the number of splits along the length of the reactor.
To obtain adequate results using the analytical model of the reactor, n = 1000 was taken as the required number of splits along the length of the reactor. This number of splits does not require much computing power and allows one to obtain a value with an error of less than 1%.
The results of the function calculations for the three carbamates are in Table 6.

Table 6.
Activation energies and pre-exponential factors of the studied carbamates.
The obtained values were used later as the parameters of the developed model.
2.2. Simulation
COMSOL Multiphysics was chosen to study the decomposition process of O-methyl-N-benzyl carbamate, O-methyl-N-(n-butyl) carbamate, and O-methyl-N-cyclohexyl carbamate due to its ease of use and the fact that it is the preferred choice for complex calculations.
The process of the gas-phase decomposition of carbamate highly depends on the temperature regimes used and the hydrodynamic situation in the reactor. Modern computer simulation is the only means by which this conditionality can be ascertained with a high accuracy.
The following assumptions are made for the development of the model:
- –
- The system considered is a homogeneous, multi-component, and viscous compressible fluid;
- –
- This system undergoes a chemical reaction of decomposition, the order of which is equal to one;
- –
- The thermal effect of the decomposition reaction is not taken into account due to the low reagent content;
- –
- The density of the medium is determined by the density of the carrier gas, argon, due to the low reagent content;
- –
- The temperature of the reactor wall is taken as a constant.
- –
- The carbamate decomposition process was calculated and studied with the CFD method using the COMSOL Multiphysics software.
2.2.1. Mathematical Model Development
The mathematical model of the process is a complex of differential equations: the conservation of mass over two components (the source substance and the product of the chemical reaction) and over the whole mixture, a momentum conservation equation, and an energy conservation equation. The hydraulic resistance of the column is calculated using the Brinkman equation (the third and fourth components of the right-hand part of the momentum conservation equation). It is assumed that all the equations take into account the column porosity.
The following equations are used to calculate the chemical reaction rate:
The Arrhenius equation is used to calculate the chemical reaction rate constant:
The Peng–Robinson state equation was used in the calculation:
The reactor model boundary conditions:
where ρ is the density, kg/m3; is the rate vector, m/s; T is the temperature, K; p is the pressure, Pa; Y1 is the source substance mass fraction, kg/kgcm; Y2 is the product mass fraction, kg/kg; τkl is the viscous stress tensor kg/m∙s2; is the heat capacity, J/K; is the dynamic viscosity, Pa ∙ s; is the velocity, m/s; is the concentration of i product (i = 1 or 2), mol/L; r is the reaction rate, mol/s, Dj is the diffusivity, m2/s; k is the reaction rate constant; k0 is the pre-exponential factor; T0 is the inlet flow temperature, K; Tf is the function for temperature on the wall, K; R is the gas constant 8.31 J/mol∙K; K is the permeability factor; vm is the molar volume, m3/kmol; a, b are the empirical factors conditional on the nature of the substance, and in multi-component systems on the composition; indexes: in—input, w—wall.
The “Brinkman Equations”, “Heat Transfer in Porous Media”, and “Transport of Diluted Species” interfaces were used when setting up the mathematical model.
2.2.2. Virtual Geometry Design and Mesh Generation
This stage of the simulation requires a virtual geometry of the apparatus used for the thermal decomposition of the carbamates. The virtual geometry is shown in Figure 4.
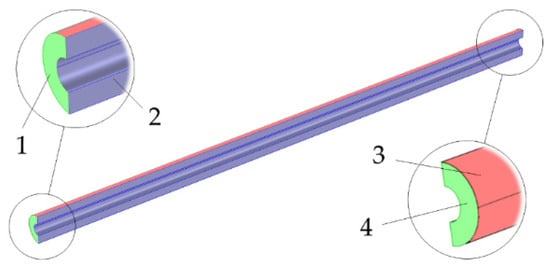
Figure 4.
Geometric model of gas flow: 1—inlet; 2—reaction site; 3—heating side; 4—outlet.
The resulting geometry is a hollow cylindrical tube which is bounded from the outside by the surface of the reactor wall and from the inside by the outer surface of the thermocouple sleeve. The outer diameter is 0.01 m and the inner is 0.007 m. The flow input is from the side where L = 0 m and the flow output is from the side where L = 0.14 m.
The geometrical model design is followed by mesh generation. Using COMSOL Multiphysics allowed us to generate combined calculation mesh, consisting of tetrahedral- and prism-shaped integral elements. Moreover, prism-shaped elements are concentrated in the wall region, where the mesh inflation was added for a more accurate modelling of the wall effects. To evaluate the mesh quality, the option “Skewness” is selected. It details the skew of the mesh elements compared to the regular shape (the regular tetrahedron and the regular prism). For the specified parameter, a value of 1 corresponds to the regular shape, and a value of 0 indicates that a 3D element has become a flat 2D shape. The generated mesh is shown in Figure 5.
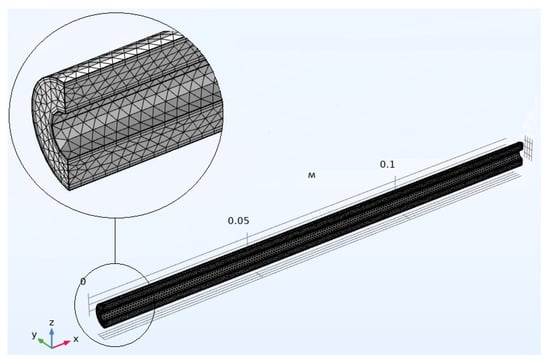
Figure 5.
Geometrical model mesh.
The proposed mesh consists of 156,879 elements. The resulting mesh has an average element skewness of 0.7014. The skewness is not lower than 0.132 relative to all mesh elements. Thus, the quality of the mesh is sufficient for computer modeling.
2.2.3. Temperature Profile Determination on Reactor Wall
Some features that are associated with the design of the experimental plant (Figure 3) characterize the reactor heating. The reactor zone is directly heated by a separate heating element to high temperatures of up to 600 K. All the pipelines and fittings that are connected to the reactor, the preheating zone, the mixing zone, and the inlet and outlet of the reactor are located in a specially air-heated zone. The temperature at these zones is maintained at 200 °C. The entire setup has a high specific quantity of metal per structure; thus, a significant part of the heat supplied directly to the reactor by its heater is quickly dissipated. Thus, the temperature profile on the reactor wall is determined not only by its heating element, but also by the entire setup as a whole. Predicting such a profile requires an accurate and complex calculation of the heating element, taking into account the entire geometry of the setup, which significantly complicates the task. Therefore, it was decided to determine the temperature profile along the length of the reactor experimentally at different gas flow rates. As a result, a temperature function with the determination coefficient R2 = 99.8 was obtained:
where G is the gas flow rate, l/min; l is the reactor length, sm; Tmax is the maximum of temperature, °C.
The coefficients of the obtained relationship are presented in Table 7.

Table 7.
Coefficients of the reactor temperature profile relationship.
The resulting function is used as a boundary condition on the reactor wall when calculating the process using the proposed model. Thus, the simulated temperature profile within the whole reactor volume will be close enough to the experimental one.
3. Results and Discussion
The computer simulation based on the calculated model aims to predict the course of carbamate thermal decomposition in the previously shown tubular reactor conditional on the process parameters. In the future, the proposed model can be used to increase the process efficiency, to optimize the geometry of laboratory and industrial equipment, and for scaling the process to an industrial level.
The result of each calculation is the fields of the gas flow rate, pressure, temperature, and composition of the system under study within the indicated virtual geometry. A series of calculations was carried out, yielding parameters that correspond to the previously noted experimental data. Based on the results obtained, the efficacy of the proposed model was determined by comparing the calculated and experimental fractional conversions at the reactor outlet.
The input parameters for the computational experiments are presented in Table 8.

Table 8.
Input parameters for the computational experiments.
3.1. Temperature Profile Investigation
The obtained function for temperature on the reactor wall (Section 2.2.3) was used for process simulation. The results of comparing the experimental data with the calculated ones are shown in Figure 6.
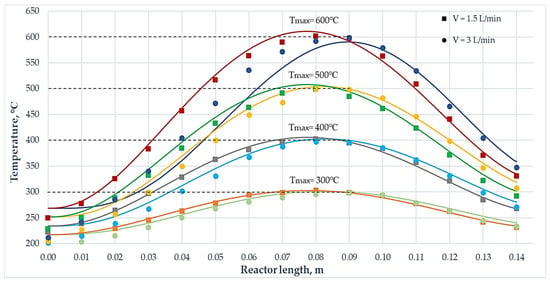
Figure 6.
Comparison of the experimentally obtained temperature profiles along the reactor length at different temperature conditions and carrier gas flow rates with the profiles obtained during the calculation in COMSOL Multiphysics. Continuous lines show the calculated temperature values and experimental points (square points are taken at the carrier gas flow rate of 1.5 L/min, and round points at 3 L/min).
The temperature profiles along the longitudinal section of the reactor, which allow one to see the profile of temperature changes over the entire volume of equipment, with carrier gas flow rates of 0.05, 1.5, and 3.0 L/min at 600 °C are shown in Figure 7.
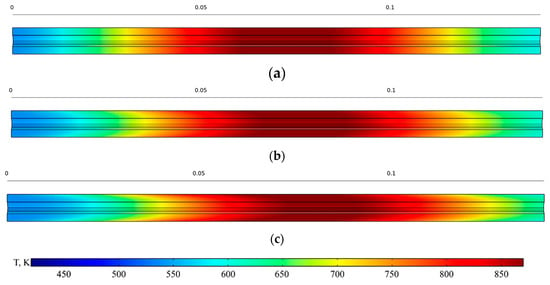
Figure 7.
Temperature profile along the length of the reactor at a temperature of 600 °C and carrier gas flow rates of 0.05 (a), 1.5 (b), and 3.0 (c) L/min.
The COMSOL tools allowed the model-based calculation of data that yielded the calculated temperature profiles and fractional conversions along the reactor length and the profiles of rate and fractional conversions of the thermal decomposition reaction. Figure 8, Figure 9, Figure 10, Figure 11, Figure 12, Figure 13, Figure 14, Figure 15, Figure 16, Figure 17, Figure 18, Figure 19, Figure 20 and Figure 21 show some of the data received.
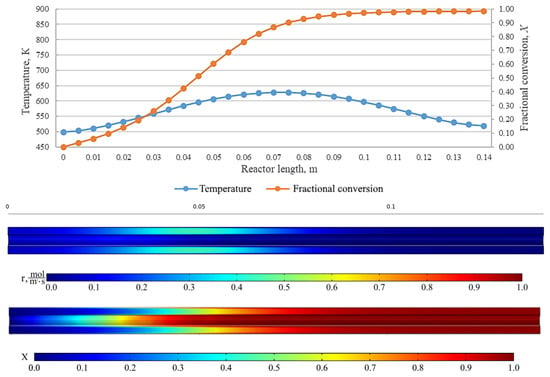
Figure 8.
From top to bottom: temperature and fractional conversion curves, profiles of the reaction rate and fractional conversion along the reactor length for the experiment BnOm_350_18 (Tmax = 350 °C, = 0.05 L/min).
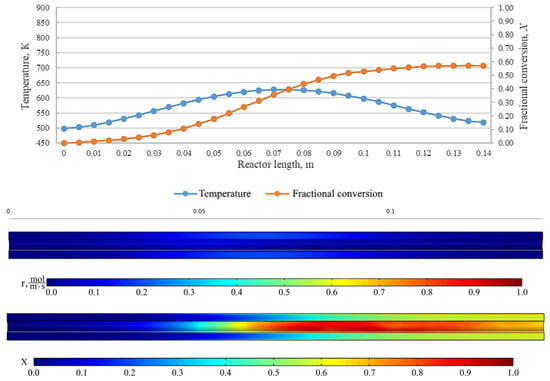
Figure 9.
From top to bottom: temperature and fractional conversion curves, profiles of the reaction rate and fractional conversion along the reactor length for the experiment BnOm_350_40 (Tmax = 350 °C, = 0.25 L/min).
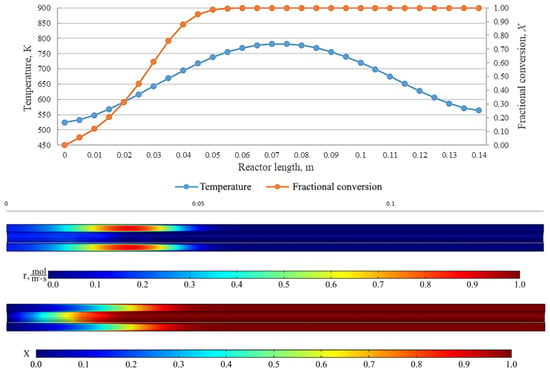
Figure 10.
From top to bottom: temperature and fractional conversion curves, profiles of the reaction rate and fractional conversion along the reactor length for the experiment BnOm_500_19 (Tmax = 500 °C, = 0.05 L/min).
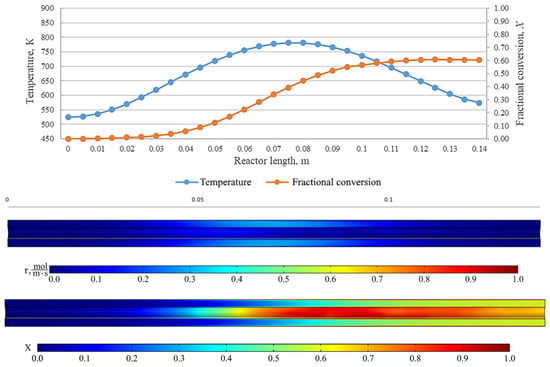
Figure 11.
From top to bottom: temperature and fractional conversion curves, profiles of the reaction rate and fractional conversion along the reactor length for the experiment BnOm_500_43 (Tmax = 500 °C, = 1.5 L/min).
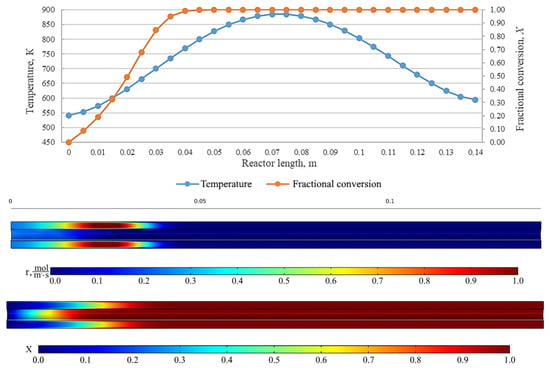
Figure 12.
From top to bottom: temperature and fractional conversion curves, profiles of the reaction rate and fractional conversion along the reactor length for the experiment BnOm_600_23 (Tmax = 600 °C, = 0.05 L/min).
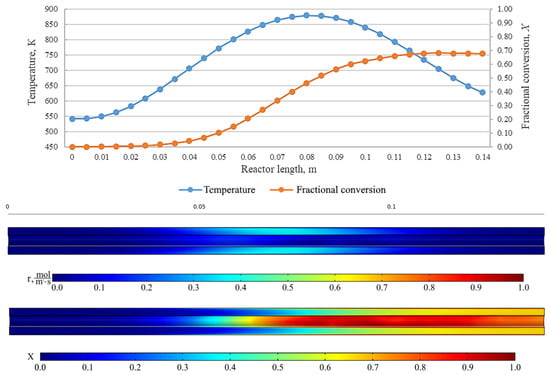
Figure 13.
From top to bottom: temperature and fractional conversion curves, profiles of the reaction rate and fractional conversion along the reactor length for the experiment BnOm_600_37 (Tmax = 600 °C, = 3.0 L/min).
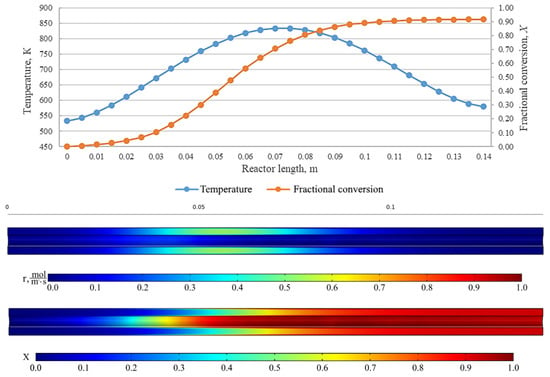
Figure 14.
From top to bottom: temperature and fractional conversion curves, profiles of the reaction rate and fractional conversion along the reactor length for the experiment BuOm_550_71 (Tmax = 550 °C, = 0.05 L/min).
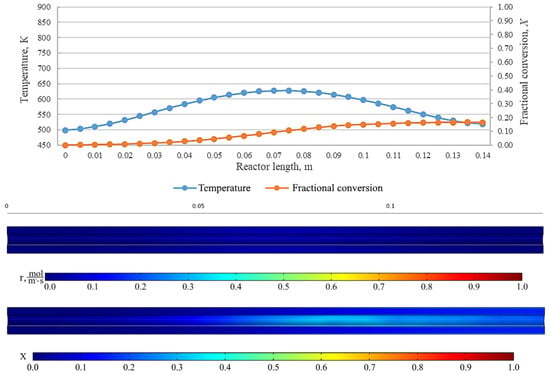
Figure 15.
From top to bottom: temperature and fractional conversion curves, profiles of the reaction rate and fractional conversion along the reactor length for the experiment BuOm_350_72 (Tmax = 350 °C, = 0.1 L/min).
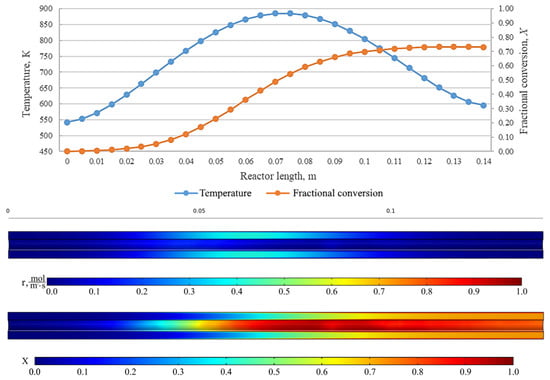
Figure 16.
From top to bottom: temperature and fractional conversion curves, profiles of the reaction rate and fractional conversion along the reactor length for the experiment BuOm_600_82 (Tmax = 600 °C, = 0.15 L/min).
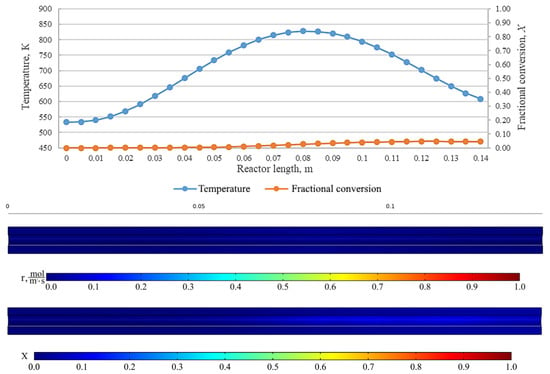
Figure 17.
From top to bottom: temperature and fractional conversion curves, profiles of the reaction rate and fractional conversion along the reactor length for the experiment BuOm_550_69 (Tmax = 550 °C, = 3.0 L/min).
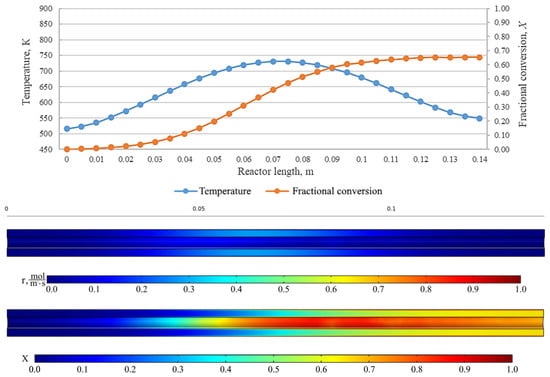
Figure 18.
From top to bottom: temperature and fractional conversion curves, profiles of the reaction rate and fractional conversion along the reactor length for the experiment cyGOm_450_116 (Tmax = 450 °C, = 0.05 L/min).
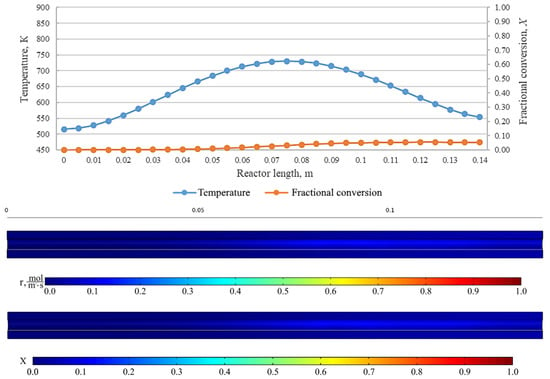
Figure 19.
From top to bottom: temperature and fractional conversion curves, profiles of the reaction rate and fractional conversion along the reactor length for the experiment cyGOm_450_127 (Tmax = 450 °C, = 1.0 L/min).
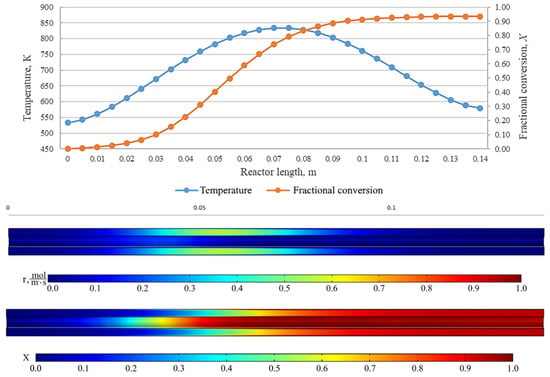
Figure 20.
From top to bottom: temperature and fractional conversion curves, profiles of the reaction rate and fractional conversion along the reactor length for the experiment cyGOm_550_120 (Tmax = 550 °C, = 0.05 L/min).
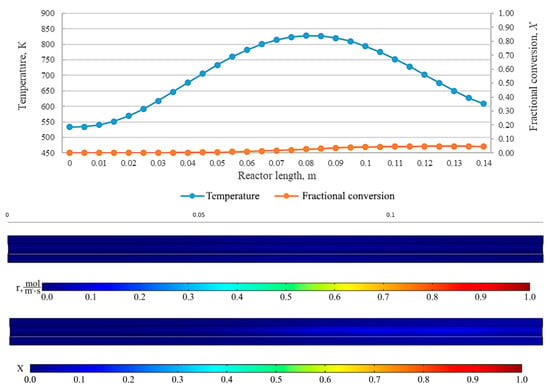
Figure 21.
From top to bottom: temperature and fractional conversion curves, profiles of the reaction rate and fractional conversion along the reactor length for the experiment cyGOm_550_129 (Tmax = 550 °C, = 3.0 L/min).
The results show an effect that indicates a high fractional conversion in the near-wall region of the reactor. This is due to a low carrier gas flow rate and, as a result, an increase in the residence time of the initial carbamate at those points. Cross-mixing enables the leveling of the concentration of components, and the fractional conversion is leveled at the reactor outlet. In addition, the diagrams represent the regions with the highest rate of the chemical reaction. At low carrier gas flow rates and high temperatures, the same fractional conversion can be observed at the reactor outlet, while the pattern inside the plug-flow reactor can be completely different. This shall be taken into consideration when designing larger reactors, where the uniformity of temperature across the reactor cross-section is crucial. On the curves, it can be seen that the area with a high chemical reaction rate is near the inlet of the reactor and represents a relatively narrow interval in the reactor at low flow rates of carrier gas. However, while the flow rate increases, this zone becomes the zone of maximum temperatures and there is an expansion of the zone, resulting in a decrease in the value of the maximum reaction rate.
3.2. Comparative Analysis of Experimental Values of Conversion with the Calculated Data
Based on the data of the simulation experiments with integrated COMSOL Multiphysics tools, the fractional conversions of the carbamate thermal decomposition product were calculated and are shown in Table 9, Table 10 and Table 11. The values were determined by averaging the fractional conversion at the reactor cross-section at the output at L = 0.14.

Table 9.
Comparison of the experimental fractional conversion of O-methyl N-benzyl carbamate with the data of the calculation experiments.

Table 10.
Comparison of the experimental fractional conversion of O-methyl-N-butyl carbamate with the data of the calculation experiments.

Table 11.
Comparison of the experimental fractional conversion of O-methyl-N-cyclohexyl carbamate with the data of the calculation experiments.
3.3. Checking the Adequacy of Mathematical Model for the Displacement Reactor
A relative error and a correlation factor were calculated in order to determine the deviation of the calculated data from the experimental data. Fisher’s test was used to confirm the adequacy of the proposed model.
The following values are compared in the efficacy assessment: Fobs., which is calculated as the ratio of sample variances , and the value of F critical, one-sided, or Fcr., which, depending on Fobs. can take on the values of the “left” (lower) or “right” (upper) quantiles of the F-distribution with the number of degrees of freedom equal to . The upper quantile is equal to such a value for which the probability that the random variable will take on a value greater than or equal to is equal to half the value of the significance level α—i.e., . For the lower quantile, the following equation works: . The calculation of the function quantile is an inverse operation to determine probability—i.e., in this case, with the known value of , a value of meeting the given requirements is sought. Since the F-distribution density is not even, the upper quantile of the F-distribution is not equal to the lower one with a minus sign. However, the lower quantile can be expressed through the upper one with —i.e., . The criterion for rejecting the null hypothesis H0 is such a value of Fobs. Of the compared samples that ensure or —i.e., if —rejecting the null hypothesis is not required.
In addition, the F-test also includes a comparison of the probability of an event when a random variable with the given F-distribution exceeds the set value of the significance level α, and in the case of a two-sample F-test P (Fobs.) is compared with 2α.
Based on the data obtained, the deviation of the calculated data from the experimental data is acceptable, as evidenced by the obtained values of relative error and the correlation factor. Besides this, according to the Table 12, and P (Fobs.) > 2α in each case; therefore, there is no reason to reject the hypothesis of the equality of sample variances obtained through the experiments and calculations—i.e., the model can adequately describe the experimental data despite the existing level of deviations.

Table 12.
Statistical processing of the experimental and calculated fractional conversions.
4. Conclusions
A mathematical model for carbamate thermolysis developed with the help of the COMSOL Multiphysics modeling environment was proposed. This model represents the process of the thermal decomposition of O-methyl-N-alkyl carbamates to alkyl isocyanates in a displacement reactor under non-isothermal conditions and can be used to design industrial reactor equipment.
A study was made in a non-isothermal displacement reactor with varying residence times and temperature profiles along the reactor length in a constructed laboratory facility for the thermal decomposition of O-methyl-N-alkyl carbamates. The following kinetic parameters were obtained: the activation energy and the pre-exponential factor of the thermal decomposition of O-methyl-N-butyl carbamate, O-methyl-N-cyclohexyl carbamate, and O-methyl-N-benzyl carbamate, which were used as input parameters of the model during the computational experiments.
The experimental and calculated temperature profiles along the reactor length at different carrier gas rates were compared.
A comparative analysis of the fractional conversion obtained through the experiments and the fractional conversion calculated using COMSOL Multiphysics was carried out. The deviation of the calculated values from the experimental ones did not exceed 7%. The adequacy of the developed model was assessed using Fisher’s test. Thus, the proposed mathematical model in the COMSOL Multiphysics modeling environment makes it possible to obtain the values of the process parameters, such as the temperature profiles, flow rates, reaction rates, and component concentrations in the reactor. This can contribute to the development of a new type of equipment for the thermal decomposition of carbamates, since it will partially replace full-scale experiments with computational ones and requires fewer resources during development.
The obtained kinetic parameters and the created mathematical model can be used in the future for modeling and designing pilot plants for the production of biologically active substances from the class of carbamates (Iodocarb, Propamocarb), urea (Benomyl), sulfonylurea (Glibenclamide, Glipizide), and other substances through the phosgene-free method.
Author Contributions
Conceptualization, R.D. and N.M.; Investigation, R.D., G.K. and P.T.; Project administration, K.G. and A.B.; Software CA, I.L., A.L. and P.T.; Writing—original draft, N.M., R.D. and G.K.; Computational experiments, A.L. and P.T. All authors have read and agreed to the published version of the manuscript.
Funding
The main source of funding is the Ministry of Science and Higher Education of the Russian Federation. The purpose of funding is the promotion of the Federal Target Program No. 075-15-2019-1856 of 12/03/19 (Unique project identifier RFMEFI60719X0315).
Conflicts of Interest
The authors declare no conflict of interest. The funders had no role in the design of the study; in the collection, analysis, or interpretation of data; in the writing of the manuscript; or in the decision to publish the results.
References
- Sonnenschein, M.F. Polyurethanes: Science, Technology, Markets, and Trends; John Wiley & Sons: Hoboken, NJ, USA, 2015. [Google Scholar]
- Richter, R.H.; Priester, R.D., Jr. Isocyanates, organic. In Kirk-Othmer Encyclopedia of Chemical Technology, 4th ed.; Kroschwitz, J.I., Howe-Grant, M., Eds.; Wiley: New York, NY, USA, 1998; Volume 14, pp. 446–461. [Google Scholar]
- Tundo, P.; Musolino, M.; Aricò, F. Replacement of toxic feedstocks in chemical synthesis. In Green Chemistry and Chemical Engineering: A Volume in the Encyclopedia of Sustainability Science and Technology, 2nd ed.; Han, B., Wu, T., Eds.; Springer: New York, NY, USA, 2019; pp. 257–283. [Google Scholar]
- Krimm, H.; Buysch, H.J. A Process for the Production of N- and O-Substituted Mono- or Bis-Urethanes, as well as Their Use as Starting Material for the Production of Aliphatic Isocyanates. German Patent DE 3035146A1; International Patent Classification C07C263/04, 22 April 1982. [Google Scholar]
- Engbert, T.; Hammen, G.; Knoefel, H. Process for the Continuous Thermal Cleavage of Carbamic Acid Esters. German Patent DE 3215591A1; International Patent Classification C07C263/04, 27 October 1983. [Google Scholar]
- Shinohata, M.; Miyake, N. Isocyanate Production Process. Canadian Patent CA 2721359C; International Patent Classification C07C263/04, 6 May 2014. [Google Scholar]
- Shinohata, M.; Miyake, N. Process for Producing Isocyanate. Patent WO 2008084824A1; International Patent Classification C07C263/04, 17 July 2008. [Google Scholar]
- Rosendahl, T.; Mäurer, T.; Stroefer, E.; Franzke, A. Heterogeneously Catalyzed Carbamate Dissociation for Synthesis of Isocyanates Over Solid Lewis Acids. U.S. Patent US 20110313192A1; International Patent Classification C07C263/04, 22 December 2011. [Google Scholar]
- Bortnick, N.M. Preparation of 1,8-Diisocyanato-p-Menthane. U.S. Patent US 2692275; International Patent Classification 260–453, 19 October 1954. [Google Scholar]
- Mattuer, O.; Merger, F.; Towae, F. A Process for Preparing Isocyanates by Thermal Cracking of Urethanes. German Patent DE 3339300; International Patent Classification C07C263/04, 9 May 1985. [Google Scholar]
- Schweitzer, C.E. Chemical Process and Products. U.S. Patent US 2409712; International Patent Classification C07C263/04, 22 October 1946. [Google Scholar]
- BohmholdtJosef, G.; Disteldorf, J.; Kirchner, P. Cyclic Process for the Preparation of (Cyclo)Aliphatic Diisocyanates. European Patent EP 0355443A2; International Patent Classification C07C263/04, 3 November 1993. [Google Scholar]
- Otterbach, A.; Schwarz, H.; Merger, F.; Schwarz, W. Multistep, Continuous Preparation of Organic Polyisocyanates. U.S. Patent US 5386053; International Patent Classification C07C263/04, 31 January 1995. [Google Scholar]
- Delamater, G.B.; Herrick, E.C.; Milligan, B. Process for the Preparation of Isocyanates from Urethanes. German Patent DE 2410505A1; International Patent Classification C07C263/04, 30 September 1982. [Google Scholar]
- Delamater, G.B.; Herrick, E.C.; Milligan, B. Isocyanates from Urethanes. U.S. Patent US 3870739; International Patent Classification C07C263/04, 11 March 1975. [Google Scholar]
- Engbert, T.; Hammen, G.; Knofel, H. Process for the Continuous Thermal Decomposition of Carbamic-Acid Esters. European Patent EP 0092738A1; International Patent Classification C07C263/04, 2 November 1983. [Google Scholar]
- Okawa, T. Process for Producing Isocyanate Compound. European Patent EP 0436800A1; International Patent Classification C07C269/00, 2 February 1994. [Google Scholar]
- Sundermann, R.; Konig, K.; Engbert, T. Process for the Preparation of Polyisocyanates. U.S. Patent US 4388246; International Patent Classification C07C263/04, 14 June 1983. [Google Scholar]
- Engbert, T.; Hammen, G.; Knofel, H. Continuous Process for Thermal Splitting of Carbamic Acid Esters. U.S. Patent US 4692550 B; International Patent Classification C07C263/04, 8 September 1987. [Google Scholar]
- Sheridan, R.E.; Hartman, K.W. Hot Oil Process for Producing Isocyanato Organosilanes. U.S. Patent US 6008396; International Patent Classification C07F7/1892, 28 December 1999. [Google Scholar]
- Henson, T.R.; Timberlake, J.F. Preparation of Organic Isocyanates. U.S. Patent US 4294774; International Patent Classification C07C 118/00, 13 October 1981. [Google Scholar]
- Zhang, Q.; Wang, L.; Xiong, T. Method for Producing 1,6-Hexamethylene Diisocyanate with Hexa-Methylene Diamino-Methyl Formate Liquid Phase Thermal Cracking. Chinese Patent CN 101195590; International Patent Classification C07C263/04, 11 July 2008. [Google Scholar]
- Deng, Y.; Guo, X.; Shi, F.; Zhang, Q. Method for Preparing Isocyanates by Liquid-Phase Thermal Cracking. U.S. Patent US 2011/0021810A1; International Patent Classification C07C263/04, 27 January 2011. [Google Scholar]
- Rosenthal, R.; Zajacek, J.G. Catalytic Production of Isocyanates from Esters of Carbamic Acids. U.S. Patent US 3919279; International Patent Classification C07C 118/00, 11 November 1975. [Google Scholar]
- Yagii, T.; Itokazu, T.; Oka, K.; Tanaka, Y. Process for Preparation of Alipfatic Diisocyanate Compounds. U.S. Patent US 5789614; International Patent Classification C07C269/04, 8 April 1998. [Google Scholar]
- Schleenstein, D.; Rasp, C.; Ronge, G. Use of High Boiling Solvents or Solvent Mixtures as Heat Exchange Medium in the Thermal Decomposition of Carbamic Esters. European Patent EP 0795543A1; International Patent Classification C07C263/04, 3 March 1997. [Google Scholar]
- Corsano, G.; Montagna, J.M.; Iribarren, O.A.; Aguirre, P.A. Mathematical Modeling Approaches for Optimization of Chemical Processes; Nova Science Publishers, Inc.: New York, NY, USA, 2009; 91p. [Google Scholar]
- Peng, D.; Robinson, D.B. A new two-constant equation of state. Ind. Eng. Chem. Fundam. 2004, 15, 59–64. [Google Scholar] [CrossRef]
- Van Der Spoel, D.; Lindahl, E.; Hess, B.; Groenhof, G.; Mark, A.E.; Berendsen, H.J.C. GROMACS: Fast, flexible and free. J. Comp. Chem. 2005, 26, 1701–1718. [Google Scholar] [CrossRef] [PubMed]
- Rasmuson, A.; Andersson, B.; Olsson, L.; Aandersson, R. Mathematical Modeling in Chemical Engineering; Cambridge University Press: Cambridge, UK, 2014; 183p. [Google Scholar]
Publisher’s Note: MDPI stays neutral with regard to jurisdictional claims in published maps and institutional affiliations. |
© 2020 by the authors. Licensee MDPI, Basel, Switzerland. This article is an open access article distributed under the terms and conditions of the Creative Commons Attribution (CC BY) license (http://creativecommons.org/licenses/by/4.0/).