1. Introduction and Background
For several years, the main metric used in the High Performance Computing (HPC) field to assess performances of computing systems has been the maximum floating-point operations per second ratio (FLOPs) achieved in running specific synthetic benchmarks or applications. This is still used today to rank the most powerful systems in the Top500 list (
https://www.top500.org). However, a large increasing consensus is being formed around the idea that this metric alone is quite limited because it does not take into account other important factors, relevant to assess performances of recent HPC systems [
1], and does not allow a fair comparison among different systems [
2].
The increase in raw computing power (FLOP/s) of modern HPC installations has been developed along with an increase in electric power requirements. This is leading to a situation where the power drain and energy consumption required to operate large HPC facilities are becoming unsustainable for both technical and economic reasons, and a significant fraction of the total cost of ownership of installations is already dominated by the electricity bill. Then, new metrics are required to compare different architectures, able to take into account parameters such as the maximum power drain of a system, and the related energy efficiency in running applications of interest. The FLOPs/Watt (the computing power in FLOP/s per average power drained in Watt) metric better fits these requirements, and in fact it has been adopted to rank the most energy-efficient HPC systems around the world in the Green500 list [
3]. As a coarse approximation, hardware manufacturers try to optimize HPC systems at all system levels, and in particular at the level of processor, increasing the computing performance while containing the power requirements, in the quest for an higher energy efficiency. The peak FLOPs/Watt metric is then able to synthesize both of these goals, accounting for FLOP/Joule, and thus for the number of floating-point operations performed with one Joule of energy.
When evaluating entire HPC systems, computation of FLOPs/Watt is quite straightforward, since the power drain of the whole system can be measured at the “wall socket”, while the FLOP/s throughput can be measured by a synthetic benchmark. This methodology takes into account the efficiency at a system level, involving many elements such as the power distribution, the cooling, the storage, etc. On the other side, when measuring a single processor efficiency, there is not an easy way to interpose a power meter between the CPU and the motherboard. To tackle this issue, given the increasing interest towards processors power monitoring and the involvement of developers communities in optimizing the energy efficiency of applications [
4,
5], recent processor chip designs have embedded power meters to monitor energy consumption or power drain while running applications codes.
1.1. The Appearance of Arm in HPC
The recent rapid growth of the smartphones market has triggered a huge demand of low energy CPUs suitable for battery-powered mobile devices. Nowadays, one of the major leaders in this segment is the Arm architecture, optimized through the years for low-power chips and highly energy-efficient devices.
More recently, the low levels of energy consumption of Arm-based processors have also attracted the interest of HPC communities [
6]. In this direction, several research works and projects [
7,
8] have investigated the use of Arm mobile CPUs as building blocks for new generations of energy-efficient systems [
9], and a comprehensive software ecosystem has been developed to easily deploy and operate HPC Arm-based clusters [
10]. These projects have also highlighted the lack, in these Arm processors, of some important features for HPC, such as: high bandwidth data paths to connect together multiple processors, capability to sustain peak computing performances for a long amount of time, and high number of cores to provide an high peak computing throughput. These shortcomings have delayed the deployment of production ready large installation until specific Arm processors have been designed and released for the server market. An example of such processor is the
Marvell ThunderX2 (in the following TX2), developed to fit the requirements of large datacenters. TX2 is an evolution of the
Cavium ThunderX, already considered for HPC applications in previous works [
11,
12] with promising results.
Attracted by the combination of potential energy efficiency and server features, new high-end parallel systems have adopted the TX2: the
Astra system at Sandia National Labs in USA, the first Arm-based machine listed in the Top500 ranking [
13], the
Dibona cluster installed in France, built within the framework of the EU Mont Blanc3 project [
7], and the
Isambard system of the GW4 alliance [
14] in the UK. In addition, other Arm-based competitors are appearing, targeting the same server market, such as the Huawei Kunpeng 916 processor [
15], the Fujitsu A64FX (
https://www.fujitsu.com/global/about/resources/news/press-releases/2018/0822-02.html), and the GPP of the European Processor Initiative (EPI) (
https://www.european-processor-initiative.eu).
The performance of TX2 for HPC applications, has been studied on an early beta silicon for a range of applications and mini-apps relevant for the UK national HPC service [
14], and later on production silicon at the Sandia National Laboratories [
13] using popular micro-benchmarks and mini-apps. More recently, other works have investigated also multi-node performances [
16] underlining that the level of scalability is comparable to that of server grade multi-core processors.
1.2. Contributions
In [
17], we presented an early assessment of TX2 performances in the context of lattice-based simulations, benchmarking two applications on the
Carmen prototype cluster installed at the CINECA
Tier-0 computing center in Bologna, Italy. In this study, we further extended our previous contribution, taking into account also energy consumption.
We started by evaluating the effective peak computing performance and memory bandwidth using a synthetic benchmark that we optimized specifically for TX2. Then, we ran our codes, further optimized to exploit all level of parallelism of the processor, and we analyzed the performance both in terms of computing throughput and energy efficiency.
With reference to TX2, our aim here was fourfold: (i) investigate the achievable level of energy efficiency; (ii) analyze the tools available to monitor power drain; (iii) assess characteristics of applications to enjoy high energy efficiency; and (iv) compare the level of energy efficiency and performance with other CPUs.
Regarding the last point, since in this study we focused on homogeneous architectures in the same performance and power ranges, we compared with other multi-core CPUs, and we did not take into account accelerators such as GPUs. In particular, we chose two Intel Xeon processors based, respectively, on the Haswell and Skylake architectures, given that they are customarily adopted in current HPC systems, covering together about 50% of the systems share of the latest Top 500 list. We also remark that we are aware that on-chip power meters are different between TX2 and Intel CPUs; for this reason, rather than comparing absolute values, we focused on the differences in energy consumption on the three architectures, according to the workload characteristics.
The remainder of this paper is organized as follows. In
Section 2, we briefly present the
ThunderX2 hardware features. In
Section 3, we show how to measure the power drain and estimate the energy consumption on the processors taken into account. In
Section 4, we introduce the
Empirical Roofline Tool [
18] (ERT) and describe how we modified the original source code to empirically measure the TX2 peak computing performance, and the peak memory bandwidth. In
Section 5, we describe some details about the applications adopted. In
Section 6, we show the obtained results. Finally, in
Section 7, we draw our conclusions.
2. The Marvell ThunderX2
The
Marvell ThunderX2 is a recent multi-core server-oriented processor; it relies on massive thread-parallelism, runs the standard GNU/Linux operating system, and targets the data-center market. It was announced in 2016 by
Cavium Inc. as an improvement over the previous
ThunderX [
19], and released later in 2018 by
Marvell with an architecture based on the Broadcom
Vulcan design. The TX2 embeds up to 32 cores, with 64-bit Armv8 architecture, interconnected on a bidirectional ring bus. Each core integrates two 128-bit FP (Floating-Point) units, 32 KB of L1 cache, and 256 KB of L2 cache; furthermore, a 1 MB slice of L3 cache is shared by each core through a dual-ring on-chip bus (claimed to offer up to 6 TB/s bandwidth), assembling a large L3 distributed memory level.
The FP units support Arm NEON vector extensions, and are able to execute four FMA (
Fused-Multiply-Accumulate) double-precision SIMD (Single Instruction Multiple Data) instructions per clock cycle, corresponding to a theoretical peak throughput of 8 double-precision FLOP/cycle. This is
higher than the FP-units used in the previous
ThunderX processor [
12].
The TX2 has two ECC memory controllers connected to a ring bus, and 8 DDR4-2666 channels providing a theoretical peak bandwidth of
GB/s. The effective value achieved by the STREAM [
20] benchmark has been reported between
GB/s [
7] and
GB/s [
21], according to the different models and operating frequencies. For more details on TX2 architecture, see [
22].
In this study, we evaluated the computing performance and energy efficiency of one TX2 processor of the ARMIDA (ARM Infrastructure for the Development of Applications) Cluster, hosted at E4 Computing Engineering s.p.a. in Italy. This processor is a 32-core 2.2 GHz CN9980 model, configured to work at nominal frequency, and with a theoretical peak performance of GFLOP/s.
The main features of the TX2 are summarized in
Table 1, and compared with two different generations of Intel Xeon processors, widely used in HPC, i.e., a Gold 6130 based on
Skylake architecture available since 2017 and an E5-2630v3 based on
Haswell architecture introduced in the market in 2014.
3. Power and Energy Monitoring
To assess energy efficiency of processors, three different values are needed: the power drain, the execution time, and the number of operations performed while processing a workload. The corresponding energy E is the power drain P integrated over time T, which can be approximated as , where is the average power measured in the interval T. However, to estimate the energy efficiency, we also need to take into account the kind of operations and tasks executed. As an example, a processor could be very energy efficient in performing fixed-point operations, as well as inefficient when it comes to executing floating-point operations.
In the HPC domain, typical workloads use predominantly floating-point operations, and then a natural metric for energy efficiency is usually measured as GFLOPs/Watt. However, this metric does not take into account other operations, such as cache accesses, integer operations, conditions verification, etc., and thus, it may not reflect the actual efficiency of a system in computing more complex applications that does not execute only floating-point operations. Therefore, another common way to measure the energy efficiency of a processor is to use a reference workload, e.g., an application code of interest, and compute the so-called energy-to-solution, which assesses the energy efficiency of a processor in executing a specific workload.
Regardless of the metric adopted, the evaluation of E requires measuring T, and the average power drain . While running an application, the power is not a fixed value, and it changes according to several parameters of the computation, such as the core frequencies, the number of cores used, the kind of instructions executed, the use of caches and in-chip communications, the chip temperature, etc. For this reason, power drain values should be sampled at a frequency higher than the one at which events occur, which could possibly change the power drain itself. Values acquired during execution have to be eventually averaged, to later compute the actual energy consumed.
One of the main problems in doing this, is that CPUs do not have yet a standard way to monitor and expose to users power drain values. On Intel processors the energy consumption of the whole CPU (plus another value for DRAM) is readable through the Running Average Power Limit (RAPL) hardware counter registers. These counters accumulate the energy consumption (in Joules) of the processor, and can be read through software libraries such as PAPI [
23]; dividing then the energy value read, by the length of the sampling period, an almost instantaneous
P can be derived.
Initial implementations of RAPL counters used to be filled by values estimated by other performance counters, but on recent processors from the
Haswell architecture onward, they use actual hardware power sensors [
24], monitoring CPUs voltage and current drain. Several research works attempted to validate the reliability of RAPL counters, but there is not a unique way to identify a ground-truth value to compare with [
24], in particular if trying to evaluate the absolute value and not just the difference with respect to the idle state. Moreover, some applications have been demonstrated to have execution patters which may lead significant errors in RAPL readings [
25]. This could probably be related to the inner sampling frequency used to fill the counters, being not high enough to correctly take into account the instantaneous power variations. Despite this, at the moment, they are the only way to have an on-chip energy consumption measurement on Intel processor.
For the
ThunderX2, RAPL counters are not available, but other architecture specific on-chip sensors can be used. These are not yet supported by PAPI or other common libraries, but Marvell has provided a Linux kernel driver and a user space application (
https://github.com/jchandra-cavm/tx2mon to query these sensors). Two different tools are provided:
tx2mon_kmod, a Linux kernel module which provides access to system specific data and configuration areas using sysfs; and
tx2mon, an example application which uses this sysfs interface to read hardware sensors.
Once the
tx2mon_kmod kernel module is installed, it is possible to get access to additional counters/events with respect to to the ones provided as part of the PMU (Performance Monitor Unit) defined as “required events” in [
26] and the TX2 specific ones described in [
27]. The
tx2mon application can then be used to decode and display (or save to file) the operating region of the SoC management controller. In contrast to RAPL counters, these are instantaneous readings from hardware sensors and in particular the obtainable information regards: current temperature from sensors, clock frequencies, voltages, and the power measurements. In particular, in this work, we use mainly the values listed in
Table 2. The
tx2mon application requires
root privileges and the
tx2mon_kmod kernel module loaded.
4. The Empirical Roofline Tool
The
Empirical Roofline Tool [
18] (ERT) is a synthetic benchmark to assess the upper bound of computing performances of a processor, as well as the maximum bandwidth achieved by the different memory and cache levels available. In several other works investigating the
ThunderX2, computing performance and memory bandwidth were measured using other well known benchmarking tools [
13], such as LINPACK [
28] and STREAM [
20]. The ERT allows summarizing both data into a
Roofline Model [
29] plot, highlighting the
machine balance [
30] of the architecture, and allowing a more comprehensive comparison of different processors [
31]. The machine balance is a specific value for each hardware architecture, and corresponds to the ratio
, where
C is the maximum computational performance usually measured as
FLOPS/s, and
B is the maximum memory bandwidth commonly reported as
bytes-per-seconds.
The
Roofline Model assumes that a computational task performs a number of operations
O on
D data items exchanged with memory. The corresponding ratio
is known as the
arithmetic intensity. Kernels with
arithmetic intensity lower than
machine balance of a specific architecture, are named as memory-bound for such architecture, and compute-bound otherwise [
31].
ERT runs a synthetic benchmark kernel several times, with different arithmetic intensity values; this allows estimating the effective peak computing throughput, and the bandwidth of the memory and different levels of caches. The main kernel function (sketched in Algorithm 1) iterates over an array, and for each element computes a variable number of fused multiply-add to accumulator vector instructions to increase the arithmetic intensity, and fill all floating point pipelines of the processor.
| Algorithm 1: Original ERT main kernel pseudo-code. |
 |
The publicly available ERT software (
https://bitbucket.org/berkeleylab/cs-roofline-toolkit), developed at the Computer Science Department of the Lawrence Berkeley National Laboratory [
18], is not optimized for the Arm architecture. Therefore, once compiled for the TX2 using the GCC 8.2 compiler, we recorded only 127 GFLOP/s, which is roughly the
of the theoretical double-precision FP peak performance of the TX2. The corresponding assembly code produced by the compiler is shown in Listing 1; as we see, no SIMD instructions are generated.
| Listing 1: Assembly code produced by GCC 8.2 from the original ERT source code. |
 |
To improve this situation, we first attempted to enable the use of NEON SIMD instructions. We then made the compiler aware of the data alignment, and, since the code already uses OpenMP directives for multi-threading, we annotated the main loop with the #pragma omp simd directive to instruct the compiler to vectorize the loop body. This modification leads to the assembly shown in Listing 2; this uses SIMD NEON instructions, and allows achieving about of the theoretical peak, which is sensibly better, but still leaves room for further improvements.
| Listing 2: Assembly code adding an omp simd pragma over the main loop. |
 |
In fact, we identified a further limiting factor, preventing reaching the full throughput of the two FP units available in the TX2 to be directly related with the NEON SIMD instruction set. On Intel architectures (e.g.,
Haswell and
Skylake) several FMA instructions are supported, allowing to accumulate on different registers, and performing either
or
(i.e.,
vfmadd132pd vfmadd231pd) [
32,
33]. On Armv8.1-a the situation is different, and only one floating-point FMA (i.e.,
fmla) is implemented, corresponding to the execution of the latter operation. As a consequence (see Listing 2), every FMA operation (
fmla) is preceded by a
mov instruction to load the accumulator register.
To overcome this limitation, developed a new kernel, as shown in Algorithm 2, with the aim of producing arbitrary long sequences of consecutive
fmla instructions. Using explicitly NEON intrinsics, we manually unrolled the body of the function and built eight independent and interleaved “chains” of FMAs (see Listing 3). Apart from the initial loads, this scheme does not require any further
mov operations, and allows filling the pipelines of the two FP-units. Using this kernel and running one thread per core, we achieved an empirical computing throughput of ≈370 GFLOPs, corresponding to ≈66% of the theoretical peak value. Our modified version of the ERT benchmark is now available for download with a Free Software license (
https://bitbucket.org/ecalore/cs-roofline-toolkit/branch/feature/thunderx2).
| Algorithm 2: TX2 optimized ERT main kernel pseudo-code. |
 |
| Listing 3: Assembly code obtained using NEON Intrinsics inside the main loop. |
 |
5. Applications
In addition to the ERT synthetic benchmark, we also ran two actual HPC applications, based on stencil algorithms, widely used by several scientific communities to perform extensive CFD and Lattice-QCD simulations. For both applications, we used OpenMP to manage thread parallelism, and exploited vectorization using appropriate data structure. In particular, here we used the
Array of Structure of Arrays (
AoSoA) for both applications, which combines the advantages of the most common used
AoS and
SoA layouts, and therefore satisfies the computing requirements of different kernels in the code. More details can be found in [
17,
34]. The
AoSoA stores at contiguous memory locations a block of BL data of different sites, and then all blocks of data for that BL sites are stored in memory. The rationale behind this approach is that each block can be moved in parallel using the SIMD instructions of the processors, while blocks corresponding to different populations indexes are relatively close in memory.
The first application is based on Lattice Boltzmann Methods (LBM), an efficient class of CFD solvers able to capture the physics of complex fluid flows, through a mesoscopic approach. LBM are stencil-based algorithms, discrete in space, time and momenta, typically operating on regular Cartesian grids. Pseudo-particles (
populations) are sitting at the edges of a two- or three-dimensional lattices, and each grid point can be potentially processed in parallel, making this class of solvers ideal targets for efficient implementations on multi- and many-core processors. A LBM model labeled as
describes fluids in
x dimensions using
y populations per lattice site. At each time step, populations
propagate to neighboring lattice sites (according to a specific scheme), and then
collide mixing and changing their values appropriately. These two computing steps are usually the most time consuming in running production LBM simulations.
propagate and
collide have different computing requirements: the first is memory-intensive and does not involve any floating-point computation, while the latter, used to compute the collisional operator, is fully compute intensive. In this work, we take into account a bi-dimensional thermal LBM [
35,
36], initially ported and optimized for multi- and many-core architectures [
37]. In this case, the
propagate kernel moves 37 data populations at each lattice site, accessing memory at sparse addresses, with non-optimal patterns and limited options for cache re-use; this makes the operation challenging for the memory controller of the processor, and for this reason it is considered memory intensive. The
collide kernel applies the collisional operator, processing data associated to the populations moved at each lattice site by the previous
propagate step. This step is completely local, as it uses the populations associate to each given site, and performs approximately 6600 floating-point operations per lattice site.
As a second class of benchmark applications, we considered a Lattice Quantum ChromoDynamics (LQCD) code. Quantum ChromoDynamics (QCD) is the theory of the strong nuclear force, describing the interaction between quarks and gluons, the fundamental particles that make up composite hadrons such as protons and neutrons. LQCD is a non-perturbative discretization of QCD to tackle aspects of QCD physics that would be impossible to investigate systematically by using standard perturbation theory. In practice, the continuum four-dimensional space-time of QCD is discretized on a four-dimensional lattice, in such a way that continuum physics is recovered as the lattice spacing get closer to zero. LQCD codes come in a very large number of different versions, each developed to study specific areas of the underlying theory [
38]. In the following, we consider the staggered formulation, commonly adopted for investigating QCD thermodynamics, for which we recently developed the OpenACC Staggered Parallel LatticeQCD Everywhere (OpenStaPLE) code, based on the OpenACC framework [
39,
40]. For benchmark purposes, we further restricted our analysis to the
Dirac operator, a linear-algebra routine specifically optimized for this application [
12,
41] that typically accounts for
of the computational load of a production run. This was done porting the OpenACC implementation of the
Dirac operator of OpenStaPLE to OpenMP, mapping directly OpenACC directives to the corresponding OpenMP ones. Recent versions of the
GCC compiler support OpenACC annotated codes; however, as this feature is still at an early stage of development, we opted for a handmade supervised translation. The
Dirac operator performs multiplications between
complex-valued
matrices and 3-component vectors, for a total of
floating-point operations per lattice site. This kernel has limited arithmetic intensity, thus its performances depend largely on the behavior of the memory sub-system. The
Dirac kernel uses a four-dimensional stencil, and adopts four-nested loops over the 4D-lattice. Our implementation supports also cache blocking on two, three, and four dimensions, and vector and matrix data elements associated to each lattice site can be stored using three different memory layouts.
6. Results
In this section, we summarize the results of our analysis, measuring the performance, power drain, and energy consumption of our selected HPC applications run on the ThunderX2, as well as on the two other Intel processors, as listed in
Table 1. To aid our analysis, we start by establishing the empirical
Roofline of each processor.
6.1. Benchmarking
Running the ERT code described in
Section 4, we plot the empirical
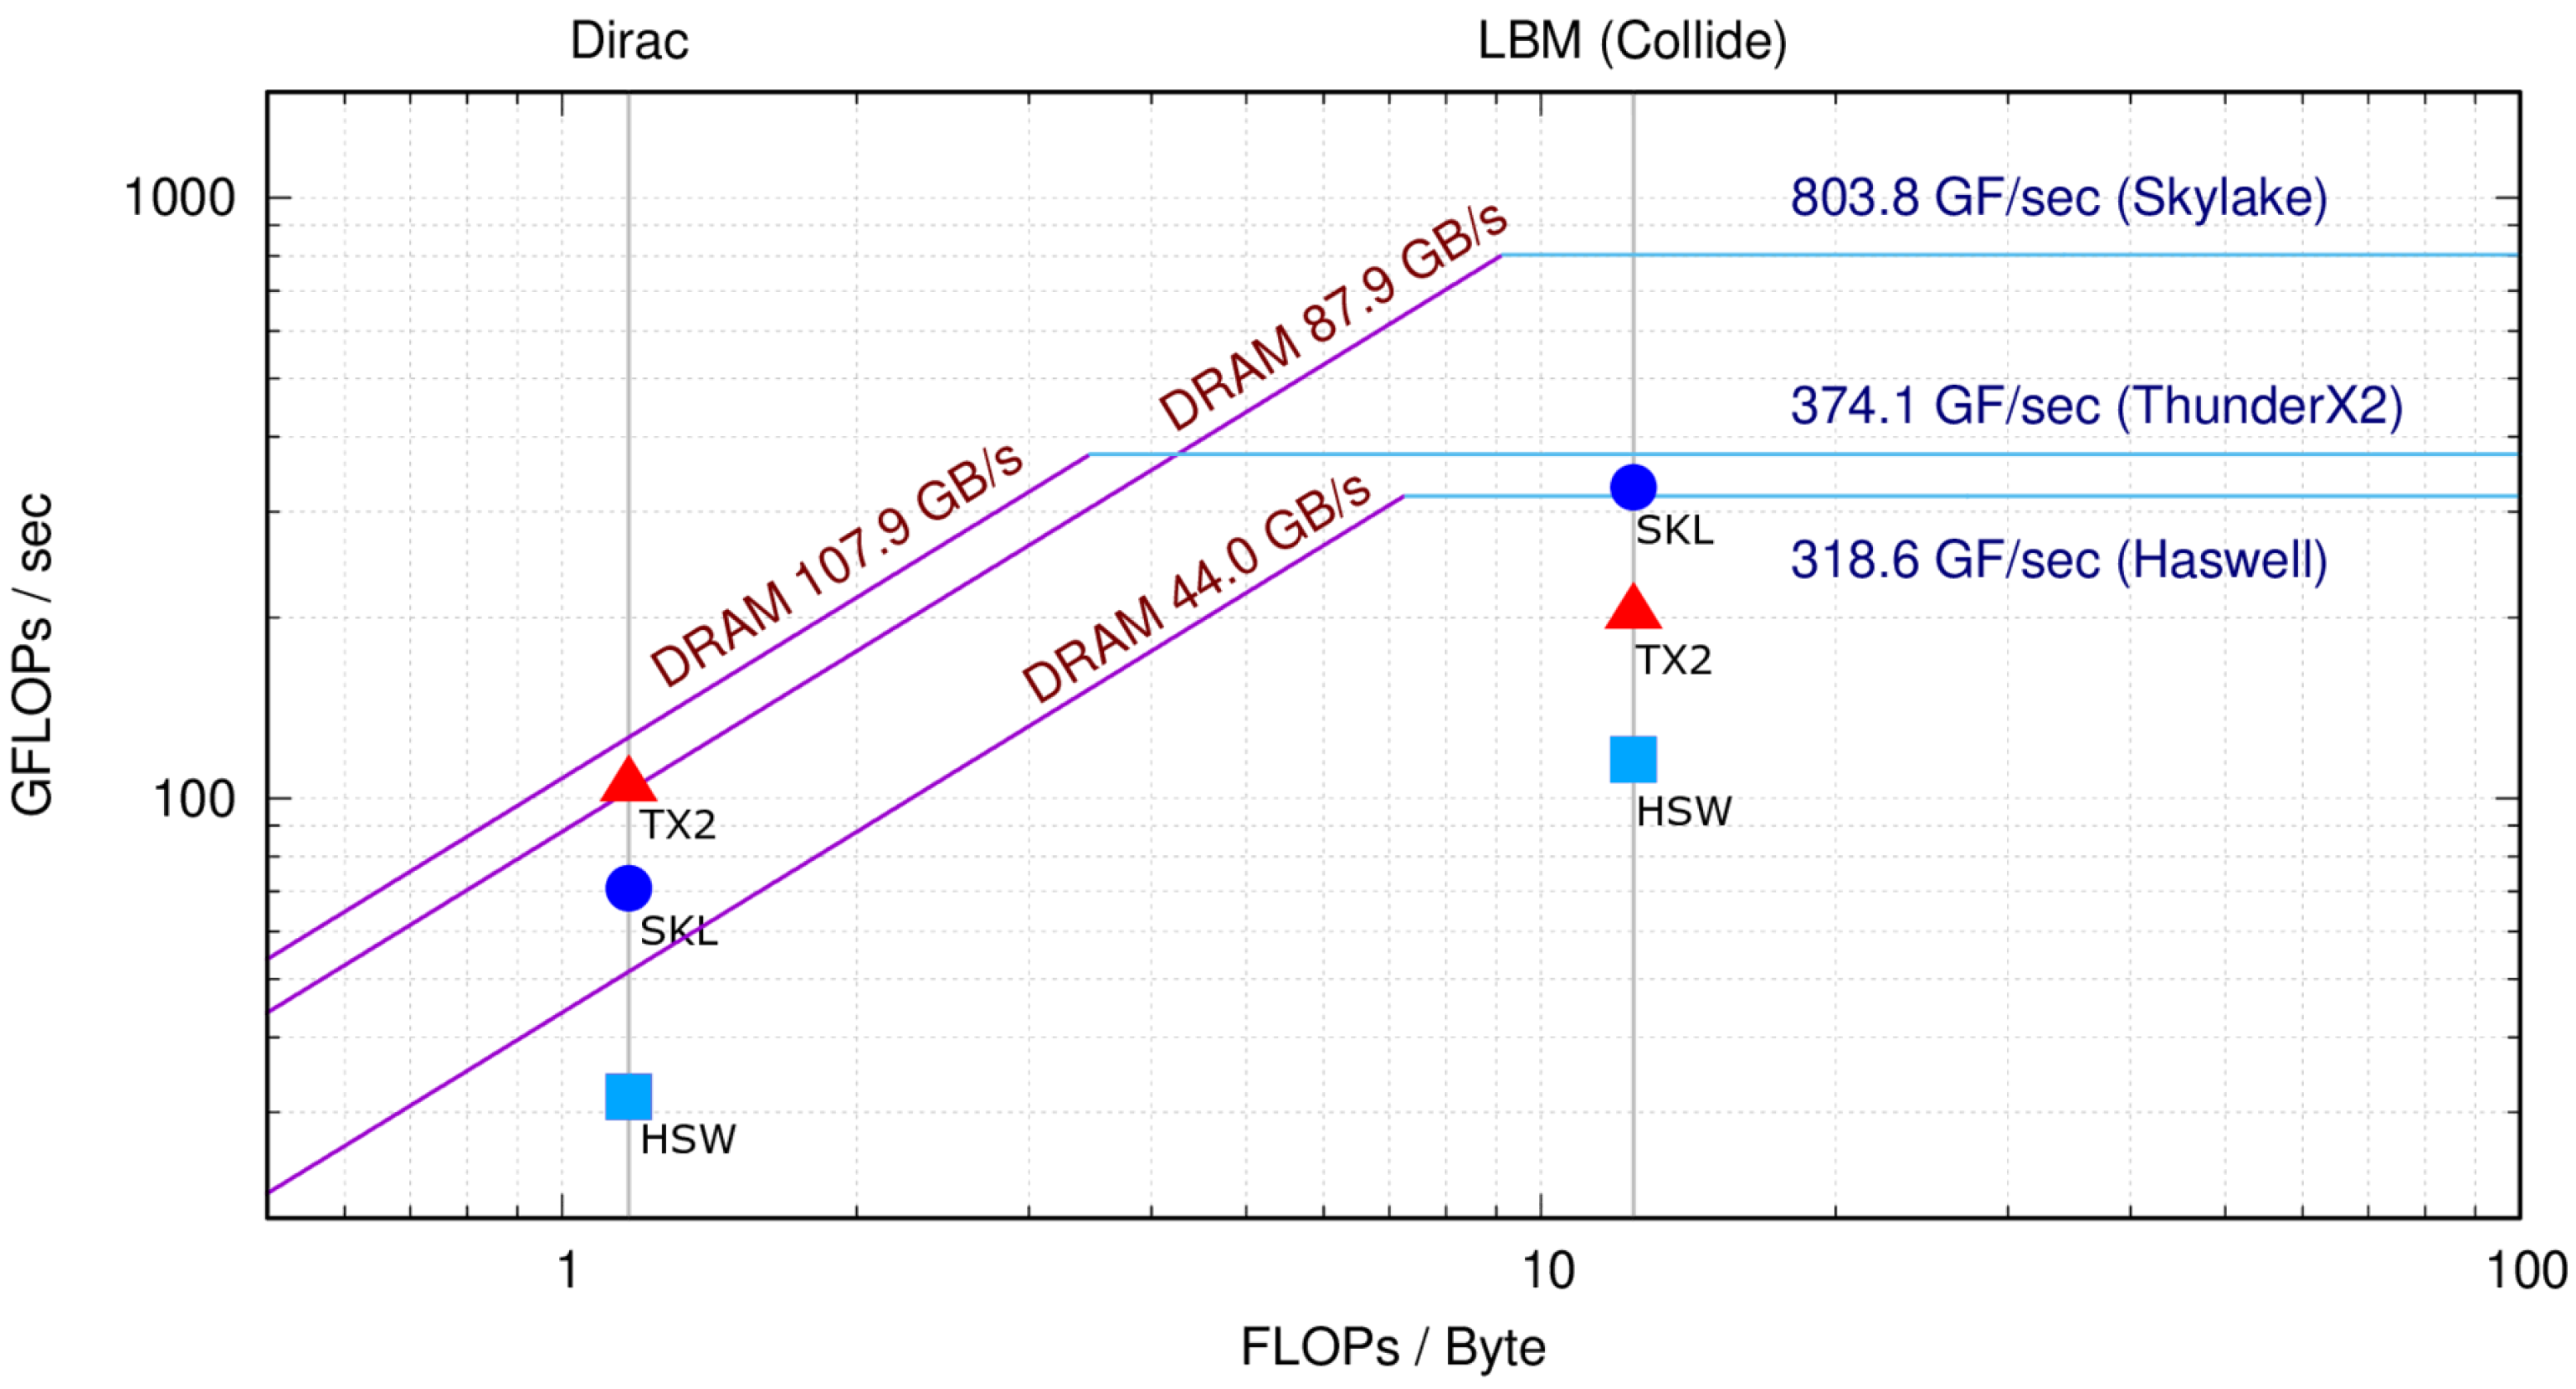
Roofline reported in
Figure 1 for each of the three processors taken into account, running up to one thread per core. This plot allows comparing the peak performance and bandwidth of the three architectures, and also highlights the different
machine balances [
30]. In this plot, we also add one point for each application, highlighting the obtained performance on each architecture, with respect to the empirical
Roofline. For all runs, the ERT tool was compiled using GCC 8.2 and the main tuning flags are reported in
Table 3.
Inspecting
Figure 1, we see that ERT measures the highest memory bandwidth in the TX2, despite it achieving less then half of the double-precision computing throughput of the
Skylake. This translates to the fact that the TX2 exhibits the lowest
machine balance among the three, i.e.,
FLOP/Byte, almost halving the
FLOP/Byte of the
Haswell, and more than halving the ≈9 FLOP/Byte of the
Skylake. The different balance makes Intel CPUs better suited for compute-intensive applications and the TX2 better suited for applications with lower computational intensity, or, in other words, for codes which are more
memory-bound. This is actually an interesting features of TX2, since many HPC codes have a relatively low computational intensity and are commonly
memory-bound.
Apart from the machine balance, we also highlight another important difference at architecture level that may have an impact on applications computing efficiency. Haswell, Skylake, and ThunderX2 are multi-core CPUs, and the computing performance of each of their cores depends on the ability of application codes to exploit SIMD instructions. However, while the size of SIMD vector registers is 256-bit for the Haswell and 512-bit for the Skylake, for the TX2, it is just 128-bit. On the other side, the TX2 partially compensates the shorter hardware vectors with a higher number of cores. Consequently, this could be a benefit for many HPC production applications which are multi-threaded, but have not yet been optimized to exploit vector parallelism, and for this reason may achieve a limited fraction of the peak performance when run on processors with wide SIMD registers. Clearly, on the other side, applications which can exploit longer SIMD instructions will enjoy better performance on the Skylake, in particular if they can not use more than 16 threads.
6.2. Applications Performance
In this section, we discuss the performance of our applications, described in
Section 5, run on the three processors we considered. The computation of these applications can exploit SIMD instructions of different vector lengths, and multi-processing across several threads; thus, they are able to exploit all levels of parallelism available on the three processors. Interestingly, they also present different computational intensities: 0 for the
propagate and
for the
collide kernels of LBM, and
for the
Dirac operator of LQCD; then, they are good candidates to stress and analyze the performance features of the different sub-systems of the CPUs. This can be seen in
Figure 1 for
Dirac operator and
collide kernel of LBM;
propagate being completely memory-bound does not perform any FP operation.
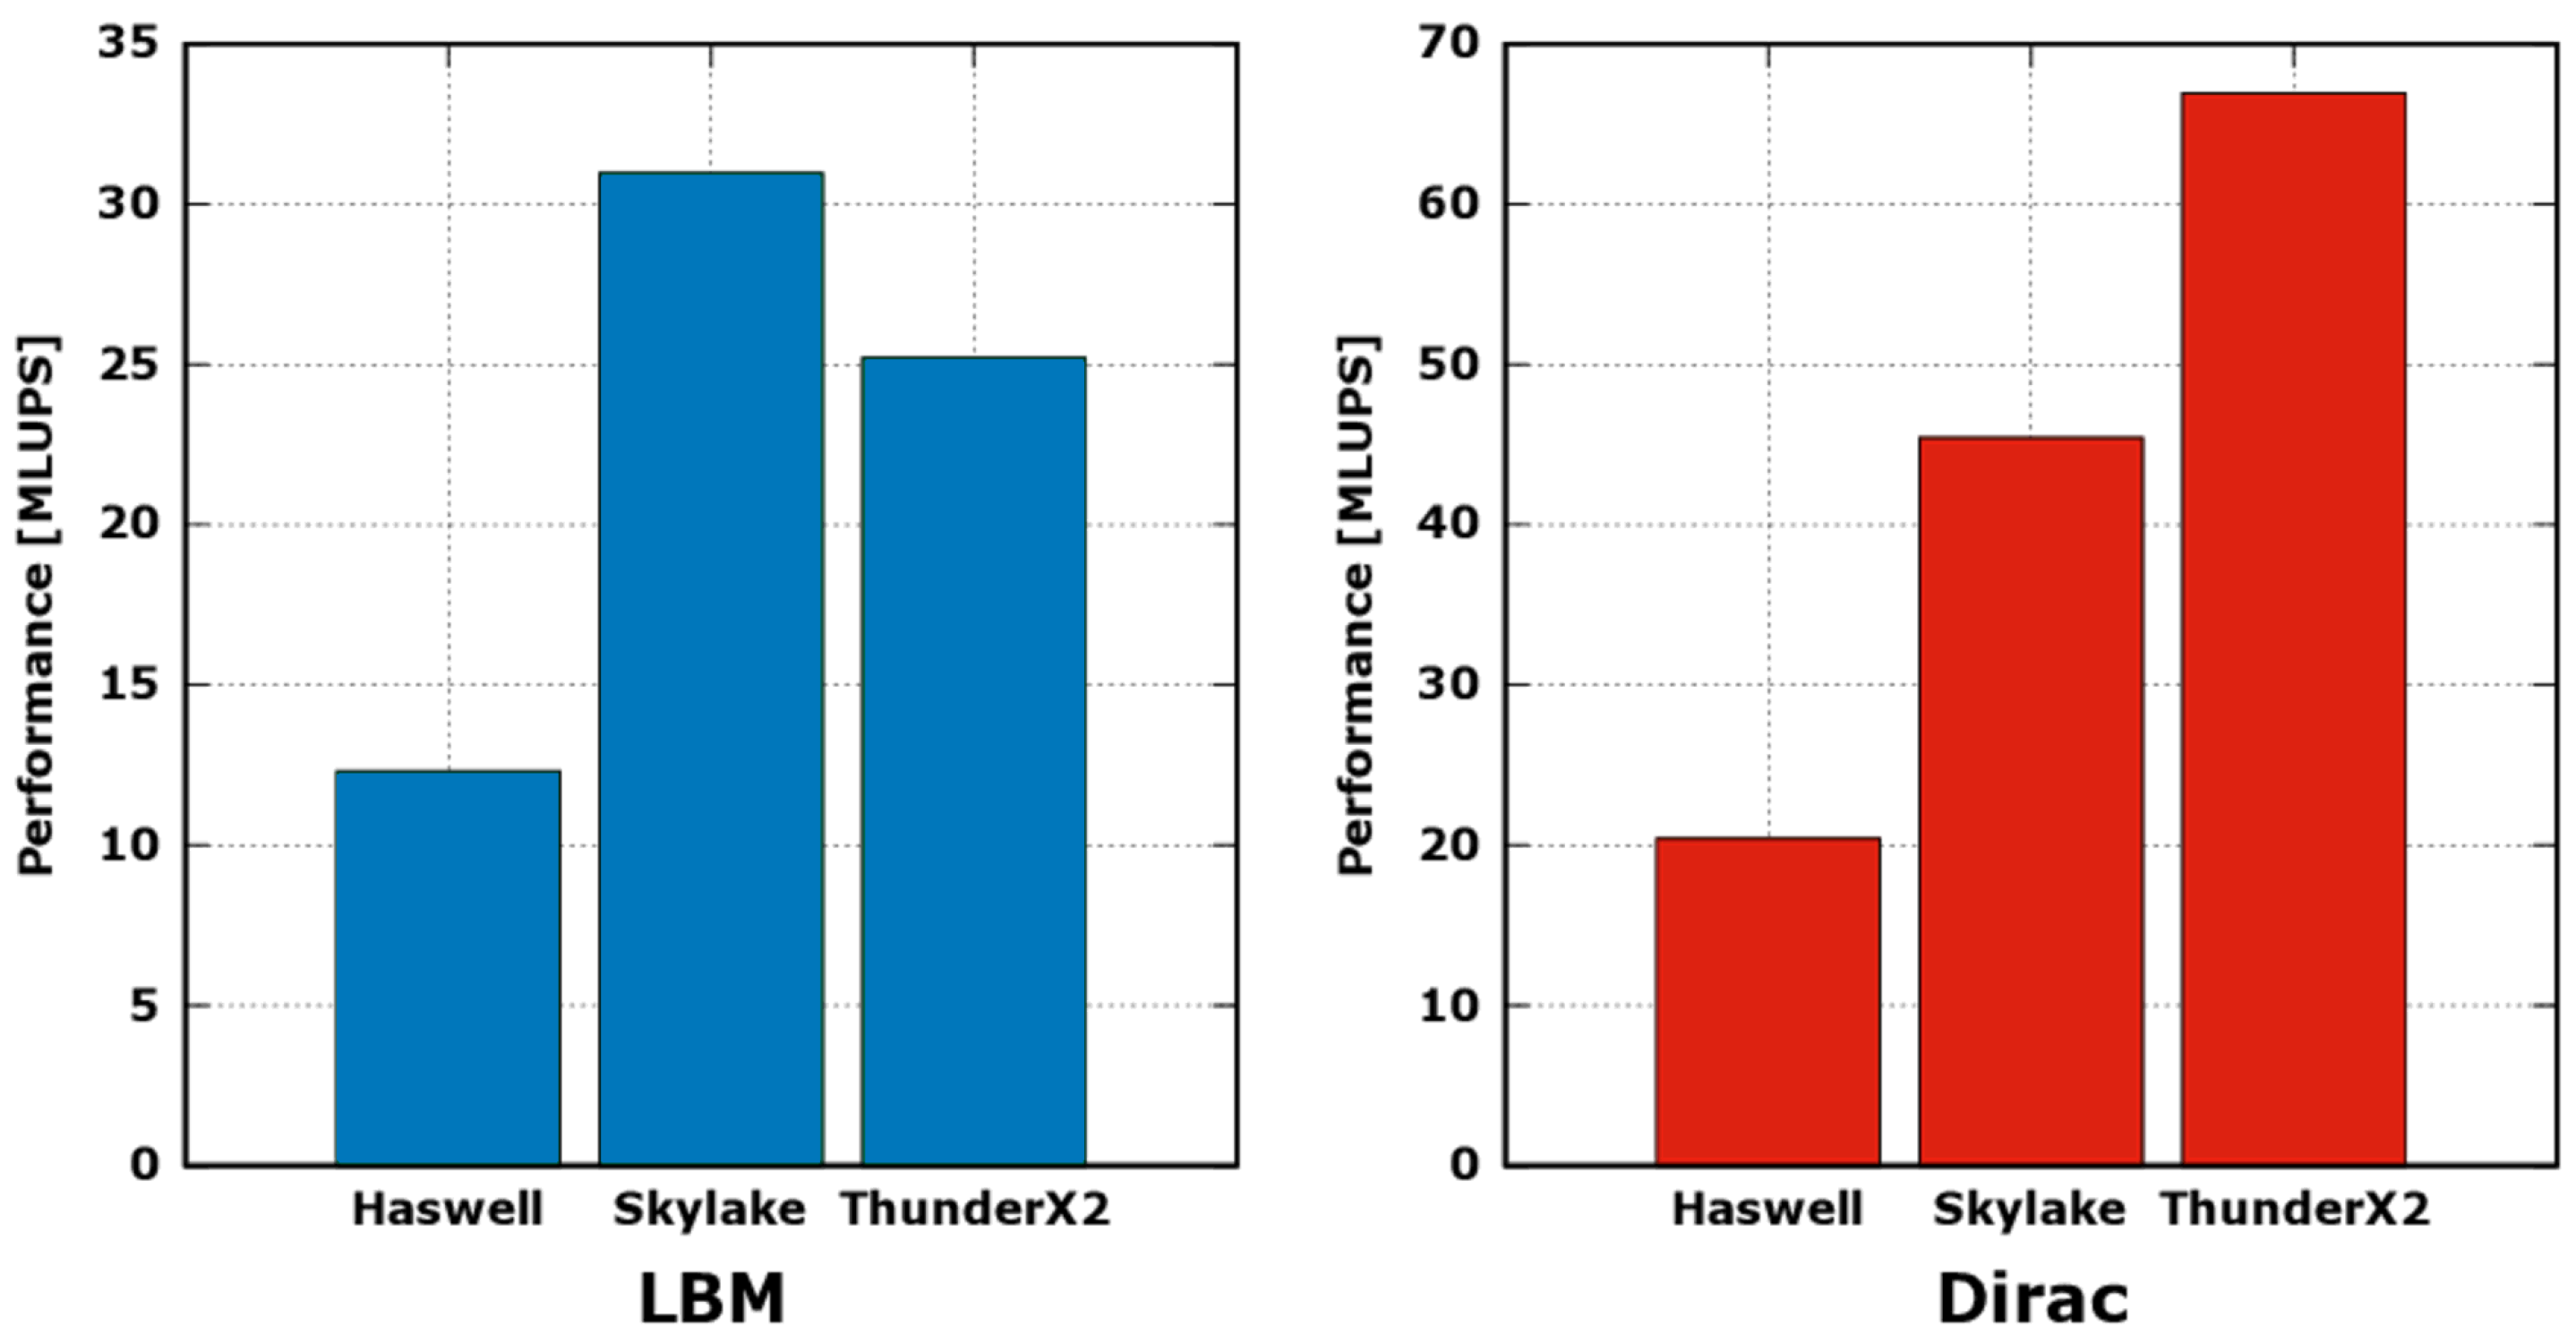
Since applications are lattice-based simulations, operating at each time-step on all points of the grid, we report in
Figure 2 the performance in MLUPS (Mega Lattice Updates per Second), a common metric for these kind of codes. This translates to the speed at which the simulation is able to compute a sequence of time-steps. Every performance measurement is given as the average of 100 iterations, leading to stable and reliable results in terms of statistics.
The computing performance of the LBM application is dominated by the execution of
collide function, and then mainly benefits from a higher computing throughput of the processor; in fact, in
Figure 2, the MLUPS of
Skylake results
higher than
Haswell, reflecting approximately the difference between the two in the empirical peak compute performance shown in
Figure 1. On the other side, although the peak empirical computing throughput of the TX2 is half that of the
Skylake, the performance of LBM on the TX2 results to be
less. This is due to the fact that the LBM
propagate function is completely memory-bound, and reaches a bandwidth of 84GB/s on the TX2 and just 51 GB/s on the
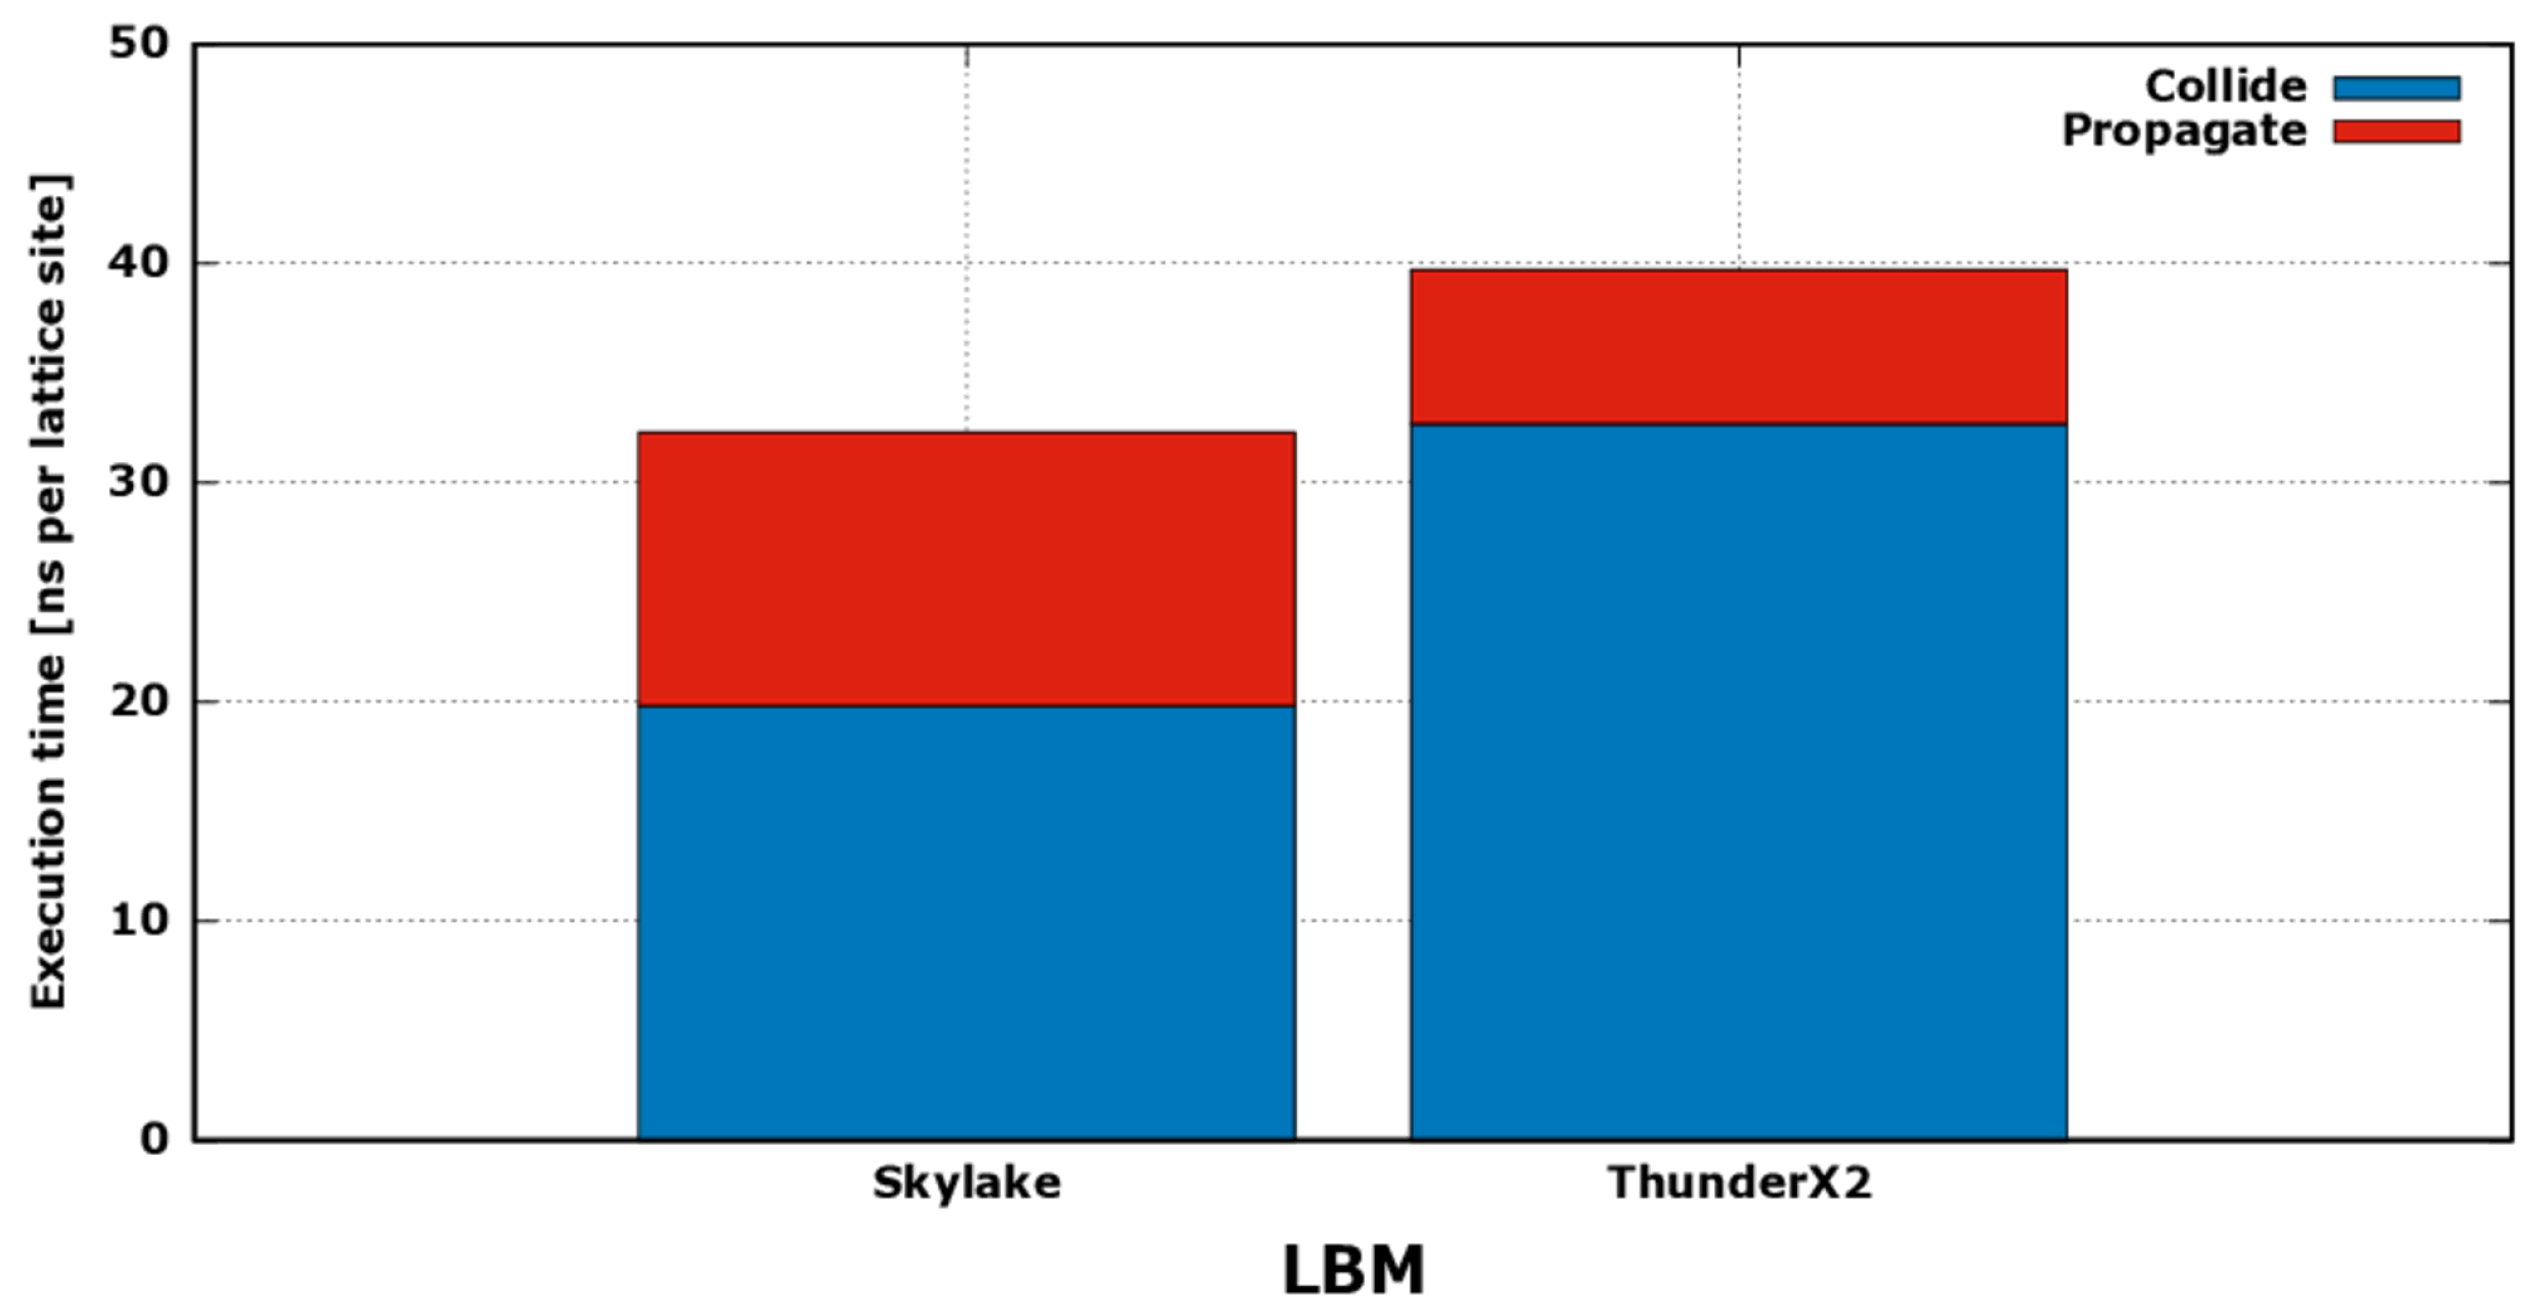
Skylake; thus, despite accounting for a shorter execution time for each iteration, its contribution is not negligible. In
Figure 3, we show the contribution shares of
propagate and
collide kernels on total execution time of LBM. As we see, the execution time of the two functions shrink and expand in opposite ways, and TX2 results more efficient in running the first, while
Skylake in running the latter.
The
Dirac operator function has a low computational intensity (i.e., ≈1), is commonly memory-bound and thus its performance typically benefits from architectures with a low
machine balance; moreover, given the high register pressure, it commonly benefits also from an efficient caches sub-system. In fact, in
Figure 2, we see that it achieves the highest performance when running on the TX2, reaching a performance ≈
higher than
Skylake and ≈3.4 than
Haswell.
Further, looking again at
Figure 1, and analyzing the performance level achieved by our reference applications, we clearly see that, on all architectures, the performance of
Dirac operator is limited by the memory bandwidth, while
collide, with higher level of arithmetic intensity, is limited by the computing throughput. Interestingly, we see also that the
Dirac operator—on the left side of the plot—benefits from the higher memory bandwidth offered by the TX2, and enjoys a better performance. On the other side, the
collide kernel—on the right side of the plot—achieves higher computing performances on the
Skylake, taking advantage of the higher compute throughput offered by this processor.
6.3. Applications Energy-Efficiency
The TDP (Thermal Design Power) of
ThunderX2 is ≈180 W, reflecting a design trend towards server markets, and in contrast with low-power Arm-based processors initially investigated for HPC [
6,
42]. Even though the absolute TDP value is not low, the ratio Watt/core of ≈5.6 is inline with, and actually lower than, the two Intel Xeon processors considered. In fact, for the
Haswell E5-2630v3, the TDP is ≈85 W, corresponding to ≈10.6 W/core, and, for the
Skylake Gold 6130, it is ≈125 W, giving ≈7.8 W/core. These data alone are not sufficient to get a clear view about the energy efficiency because the actual power drain of a processor could be lower than its TDP, according to the type of instructions executed; moreover, to have an energy efficiency measure, we need to have the performance/Watt ratio, e.g., in terms of FLOPs/Watt, or the energy consumed while executing a fixed amount of computation, i.e., the so-called
energy-to-solution.
With this aim, we measured the power drain and energy consumption, on the three different CPUs using the hardware sensors and counters available, while running the reference applications, keeping fixed the input data set and simulation parameters. All applications were compiled with the same compiler (i.e., GCC 8.2), targeting the respective architectures with specific compilation flags. All the measurements were performed averaging over 100 iterations to achieve stable and reproducible results.
As described in
Section 3, for the Intel CPUs, we read the energy consumption using RAPL counters, while, for the
ThunderX2, the
tx2mon software tool allowed reading power sensor values exposed by the
tx2mon_kmod kernel module. Moreover, to cross-check the readings, we also acquired all available power sensors of the BMC (Baseboard Management Controller) through IPMI (Intelligent Platform Management Interface) queries.
In
Figure 4, we show a 2-s sample period of a power trace collected while running the LBM application on the TX2 processor. The plot reports the power drain over the execution time, thus the energy consumption is given by the area under the curves. The dash traces correspond to all available power sensors on one TX2 CPU,
Cores,
SoC,
Mem (accounting for the Last-Level-Cache),
SRAM, and the solid line to the sum of the three, accounting for the whole power drain of the processor. The traces have been collected at a sampling frequency of 1 KHz, allowing a fine grain analysis and to easily identify the different computing phases of the LBM. Inspecting the plot, we clearly see long time periods with high
Cores power drain spaced out by shorter periods where the
Cores drain plummets, while both the
Mem and
SoC drains raise. The long periods corresponds to the execution of compute-bound
collide kernel, which keeps heavily busy the cores compute units, while the short periods corresponds to the execution of memory-bound
propagate kernel, which on the other side keeps active the memory and cache sub-system, as demonstrated using performance counters in a previous work on the
ThunderX processor [
12].
To show the validity of these measures, we plot in
Figure 4 also the value of the
CPU0_POWER sensor, acquired through IPMI, an off-chip external measurement collected by the BMC. This value is almost in line with the sum of the TX2 embedded sensors; the difference (
) may be due to the more coarse grained sampling, as well as the dissipation across the power distribution lanes and other circuits possibly interposed between this off-chip sensor and the on-chip ones.
We next analyzed how the energy efficiency of the three CPUs changes accordingly to the different workloads of our applications. Since the same sensors are not available on all testbeds, the comparison was performed taking into account the sum of on-chip sensors for the TX2, and the RAPL Package value for the Intel CPUs. The RAPL counters measure energy values for: the CPU Package, accounting for all the on-chip components, and for the external DRAMs. Both RAPL values are in Joules [
23], while the TX2 sensors give power drain values in Watt, which once integrated over time provide the
energy-to-solution in Joules for each application.
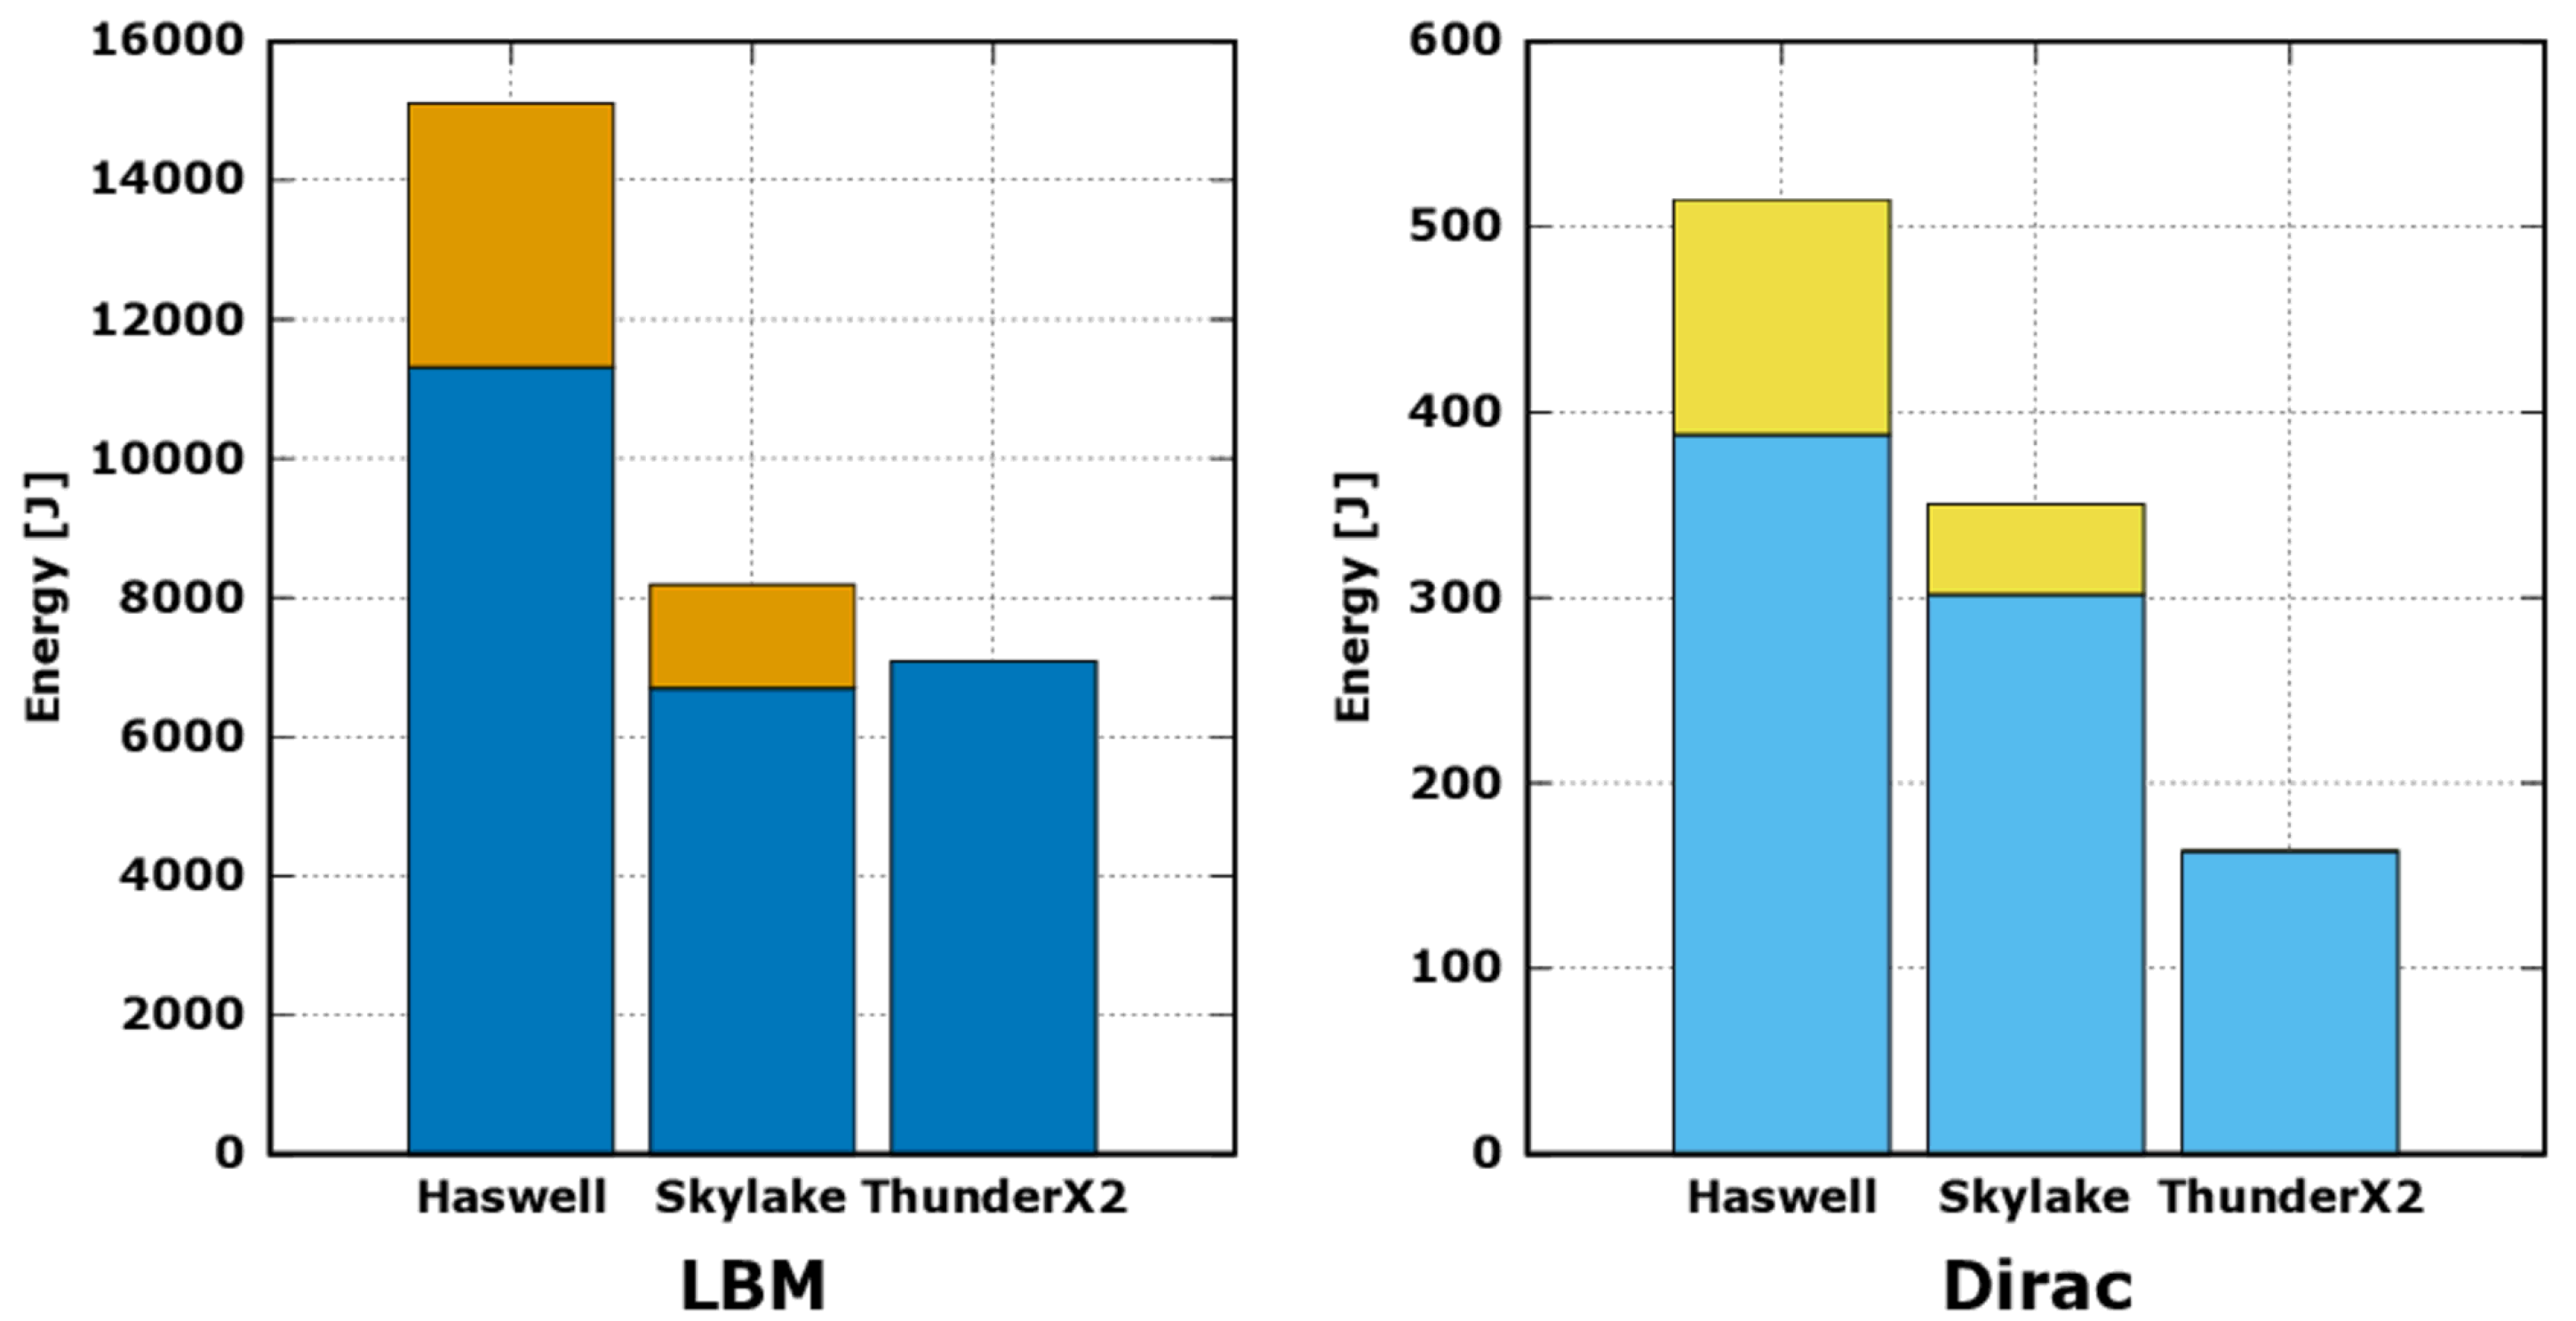
The results are reported in
Figure 5, where orange and yellow bars correspond to DRAM energy, reported only from RAPL counters. For the TX2, this value is not available, but, taking into account that the DRAM technology is the same as in the
Skylake, with slighter higher frequency (2666 MHz instead of 2400 MHz) and number of modules (eight instead of six), we assume that the contribution on the overall energy consumption for the TX2 to be slightly higher, but in the same order of magnitude. We report the Intel RAPL DRAMs values, just for reference.
Analyzing
Figure 5 and neglecting DRAM contribution, the energy consumption of TX2 running LBM is much lower than
Haswell, while it is in line with that measured on
Skylake. In this case, we see that the lower computing performance reported in
Figure 2 is compensated by a slight lower average power drain, leading to a difference in energy consumption of approximately
. In fact, the TX2 shows an average power drain of
Watt, while the
Skylake reaches 125 Watt, corresponding to its maximum TDP value.
On the other side, the energy consumption registered on TX2 for the
Dirac operator is approximately half of the
Skylake, and one third of the
Haswell. Interestingly, for the
Dirac operator, the computing performance of TX2 is
higher that the
Skylake (see again
Figure 2), while the energy consumption is
less. This is due to a lower average power drain while running this workload.
7. Conclusions
In this study, we analyzed the performance of the Arm-based ThunderX2 processor, released by Marwell to target the server market. We considered both computing and energy performances, and we assessed which classes of HPC applications are more suitable to achieve the most out of this processor.
To this aim, we initially modified the ERT benchmark to optimize it for Arm architecture. This was required since the original code was optimized for other instruction sets (e.g., x86), but not for Arm and it was not able to fully exploit the TX2 fused-multiply-add instruction, relevant to achieve a large fraction of floating-point performance. Using the Arm optimized version of ERT benchmark, we then drew an empirical Roofline plot to compare memory bandwidth and computing throughput with two Intel processors, commonly used in HPC systems. The Roofline plot shows that the TX2 has the lowest machine balance value, the highest memory bandwidth, and a computing performance which is lower than the Skylake, while similar to the Haswell. These results suggest the TX2 is more efficient for memory intensive applications, and less for dense floating-point computations. Additionally, we also highlighted other architectural differences between the processors, i.e., Intel processors are based on fewer cores with larger SIMD vector instructions, while TX2 uses smaller SIMD registers and a higher number of cores. Performance results of our reference applications are a further confirmation; in fact, memory intensive kernels such as LBM propagate and LQCD Dirac achieve a better performance on TX2, while compute intense LBM collide performs better on Intel Skylake.
Regarding energy efficiency, we analyzed the power drain of the processors while running our reference applications. To collect power and energy measurements, we used RAPL counters on Intel processors, while on the TX2 we used the on-chip power sensors available. For TX2, we described in detail how power sensors can be used in application codes to measure energy consumption, and we compared their values with off-chip sensor readings, available on the motherboard of our testing system. This showed that the two values are in accordance. Benchmarking our reference applications from the energy point of view, we show that, for floating-point dominated computations such as LBM, the TX2 shows the same level of energy consumption as Skylake, and almost half that of Haswell; on the other hand, for memory bound applications such as Dirac, the energy efficiency of TX2 is remarkably higher, requiring half the Joules required by Skylake, and slightly more than one third of the ones required by Haswell. This confirms that TX2 shows better computing and energy efficiency for applications that exhibit a good balance between memory and floating-point operations. As already remarked, this is an interesting feature because several HPC applications are commonly memory-bound and many emerging scientific applications, e.g., in the fields of big data and AI, exhibit low value of flop-per-byte ratio and—in several cases—close to 1.
On a side note, we remark that, in our analysis, we used common HPC software tools—compilers, libraries, etc.,—which have nowadays reached a good level of maturity in supporting the TX2, and more in general the Arm architecture, allowing the execution of codes developed for other standard commodity processors almost out-of-the-box.
In conclusion, our work shows that TX2 is a valid alternative solution for future HPC systems, providing a competitive level of computing power and energy efficiency, with potential advantages also in terms of total cost of ownership.
For future works, we plan to take into account also accelerators, such as GPUs. In particular, we would be interested in the evaluation of whole HPC nodes, hosting TX2 processors and GPUs, which should be available soon. This would allow taking into account also the evaluation and comparison of intra-node communication links between different processors and accelerators. Moreover, we plan to study the performance and energy efficiency of the TX2 also at the cluster level, including the assessment of inter-node communication performances, and the scalability of our applications on multi-node systems.

 ,
, 


