1. Introduction
Density-functional theory (DFT) has proven to be a useful framework for understanding materials properties quite broadly and in some cases even predicting behaviors that are later confirmed by experiments. The present study considers the equation-of-state (EOS) and particularly the volume dependence of an applied hydrostatic compression. In many solids, the pressure induces crystallographic phase transitions and in some cases these phase transitions were predicted by DFT calculations; see a diverse set of materials including alkali metals, transition metals and actinides in Refs. [
1,
2,
3,
4]. These predictions are persuasive because phase transitions are sensitively connected to the electronic structure and when unbiased computations are correctly predicting such delicate quantities it suggests that the approach is appropriate, at least for those examples. However, in order to reach a more definite and general conclusion on the validity and accuracy of the approach one must consider a larger and broader set of materials.
Density-functional theory relies on an approximation of the electron exchange and correlation that depends on the electronic density and there are numerous expressions that have been proposed over the years. There are also many assessments of these approximations for solids that typically focus on cohesive energies, equilibrium lattice constants and sometimes the equilibrium bulk modulus; see for example [
5,
6,
7]. An extensive and general analysis of the appropriateness and precision of DFT for EOS purposes, particularly at high pressures, has not been conducted to our knowledge and we thus present this important study here. Our hope is that our results will answer questions regarding the validity and accuracy of DFT for EOS and also help define an upper bound to its error at very high pressures (1 million atmospheres).
Our study compares calculated with measured EOS (isotherms) and for this comparison to be useful one needs to very carefully explore and analyze the available experimental data. Thankfully, this was recently done for the elements [
8] where zero-temperature isotherms were compiled up to 100 GPa (1 Mbar). Most of the elements in the periodic table have now been compressed close to or above 100 GPa in diamond-anvil cells and the pressure-volume room-temperature isotherms have been measured. In [
8] these data were collected and reduced to zero-Kelvin isotherms with simple lattice-dynamics models. Young et al. [
8] also gave estimated volume uncertainties that varied from 2% up to 10% depending on the element. We have made one additional correction to the data [
8]. In order to make a consistent comparison between static-lattice DFT and experimental compression data, we must correct the experimental numbers by removing the zero-point pressure. In the Debye model used in Ref. [
8], this is
Here, γ is the Grüneisen function that depends on the volume V, R is the gas constant and θ
D is the volume-dependent Debye temperature. For each element considered, we use the reference values V
0, γ(V
0) and θ
D(V
0) from Ref. [
8] to compute P
ZP for each volume in the isotherm. This is then subtracted from the T = 0 K isothermal pressures for each volume. This correction is significant in some cases at lower pressures but very small for all solids approaching 100 GPa. Below we compare isotherms and their assumed uncertainty from Ref. [
8] (corrected with the P
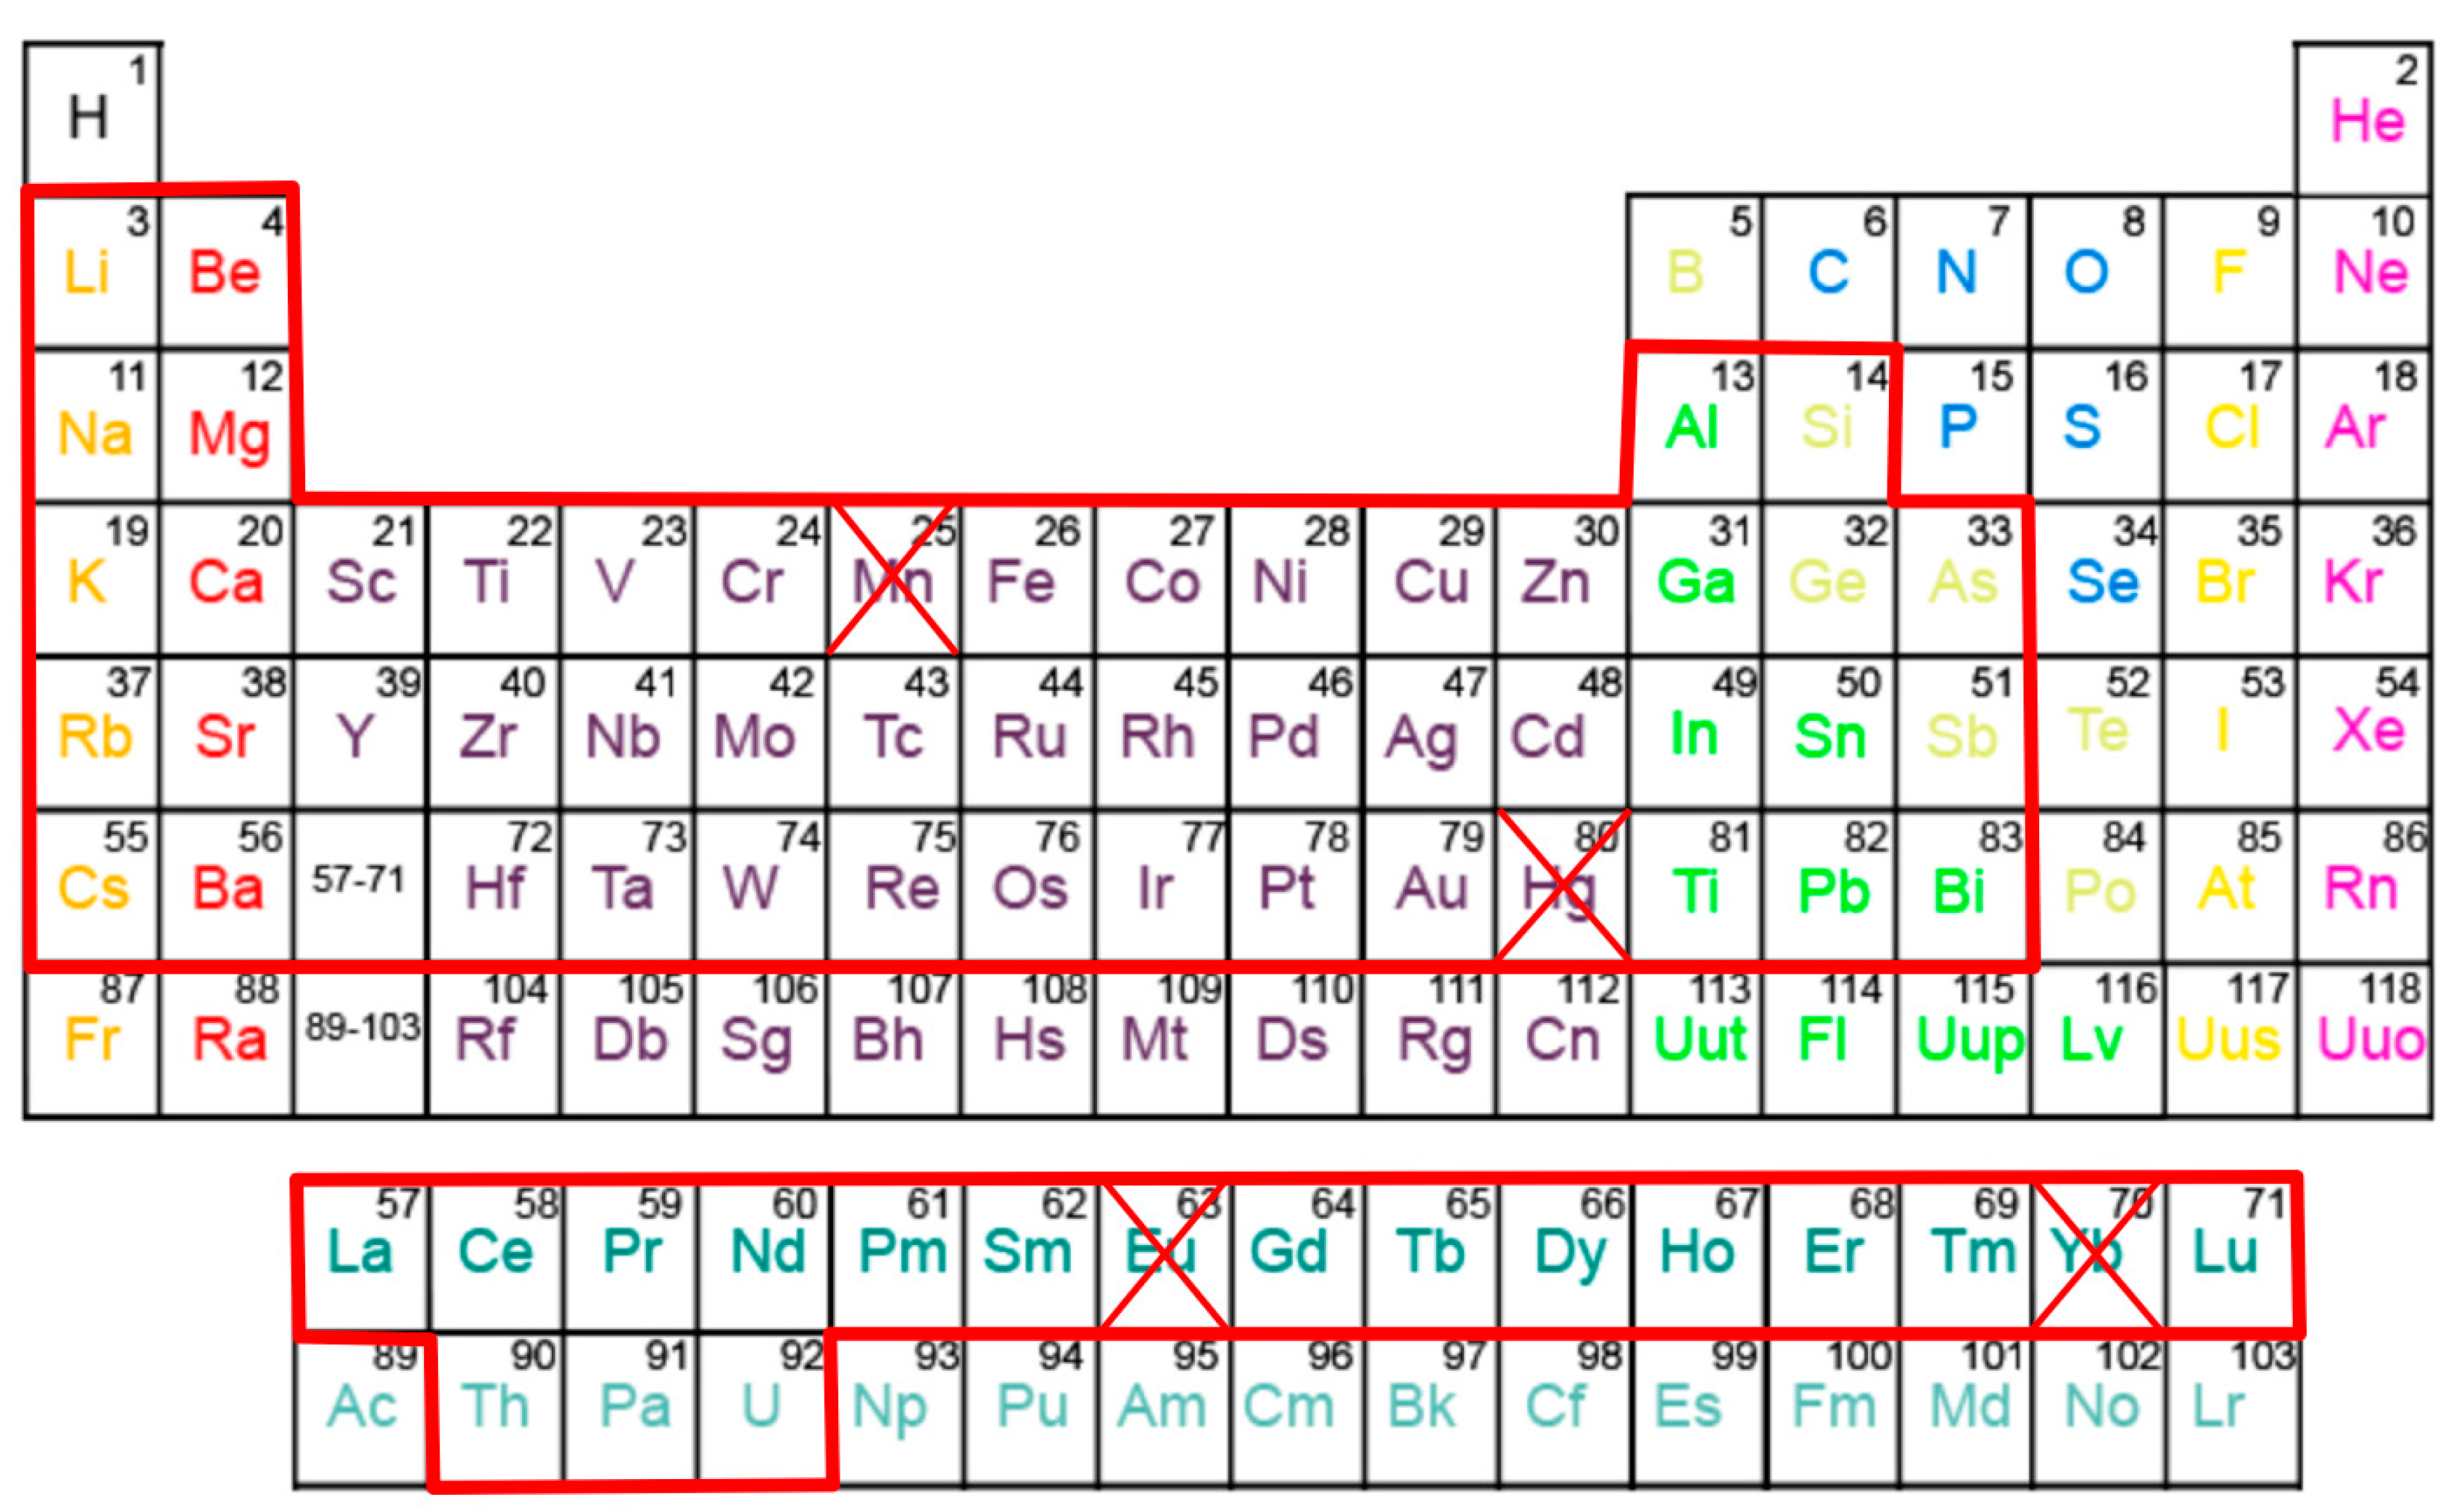
ZP) with carefully performed zero-temperature density-functional-theory calculations up to 100 GPa for the 64 elements indicated in
Figure 1. The scope of the study, as outlined in
Figure 1, is chosen so that we are avoiding gases and liquids as well as the 3
d transition metal manganese that has a very complex 58-atom crystal structure with many internal parameters. We also chose to not consider the divalent rare-earth elements Eu and Yb because their ambient-pressure phases are (incorrectly) predicted by DFT to be trivalent. Lastly, some elemental solids (Po-Ac) have not been measured up to 100 GPa and these we exclude as well.
2. Computational Method
The implementation of density-functional theory is very important because numerical or other technical approximations easily obscure the errors directly corresponding to the DFT and our necessary choice of an approximate electron exchange and correlation functional. Here, we are applying a DFT electronic-structure code that is well established [
9] and has been described in detail [
10].
Because we use an “all-electron” method, we make no approximations for the electron core states that lie deeper in energy than the valence states, unlike the so-called pseudopotential method. The core approximation made in the latter technique can sometimes cause inaccuracies at high pressures that are avoided in all-electron calculations. The present implementation is a full-potential linearized muffin-tin orbitals (FPLMTO) method [
10] that does not make any approximations beyond that of the electron exchange and correlation functional and limitations of the basis set. Basis functions, electron densities and potentials are calculated without any geometrical approximation and these are expanded in spherical harmonics (with a cutoff
lmax = 8) inside non-overlapping (muffin-tin) spheres surrounding each atom and in Fourier series in the region between these muffin-tin spheres. There is a choice how to define the muffin-tin sphere radius and here it is chosen as 0.8 of the radius of a sphere with a volume equal the atomic volume (Wigner-Seitz radius). For some crystal structures, where atoms are very close, a smaller value is used to avoid overlapping muffin-tin spheres. The radial part of the basis functions inside the muffin-tin spheres are calculated from a wave equation for the
l = 0 component of the potential that include all relativistic corrections including spin-orbit coupling for
d and
f states but not for the
p states, following the comprehensive discussion of the spin-orbit interaction in [
11].
All calculations utilize semi-core states and valence states with two fixed energy parameters each for the
s semi-core state,
p semi-core state and the valence states. The total number of tail energies, ε, are six so that ε = κ
2 is negative and raging from −3 to −0.2 Ry. For elements with Z < 14 we define 10 basis functions with an
s semi-core state in addition to the valence states while for elements 19 < Z < 71 we add a semi-core
p state for a total of 12 basis functions. For the 5
d transition metals and up to Z = 83 we also add the 4
f states as semi-core states (total of 14 basis functions). The actinide metals Th, Pa and U have been shown to be very well described with 6
s and 6
p semi-core states and 7
s, 7
p, 5
f and 6
d valence states [
4] and we are replicating that setup here.
The number of k points included in the electronic-structure calculations depend on the particular crystal structure but we generally use ~1000 k points or more for one atom/cell calculations and less for cells with many atoms. Each energy eigenvalue is broadened with a Gaussian having a width of 20 mRy.
All calculations assume the generalized gradient approximation (GGA) in its original formulation (PW91) [
12]. There are certainly other choices one can make to maximize agreement with experiment for individual elements but our intention here is not to “tune” the calculations to particular elements. We do acknowledge that GGA is probably the most popular choice at the moment and that it is known to be better than any other approximation for the actinide metals [
13].
Many solids show crystallographic phase transitions below 100 GPa and for the most part we consider all observed phases in our calculations but exceptions are noted below. Generally, we do not calculate transitions between phases but rely on their experimentally determined stability ranges. The former is in principle possible but requires that even the most complicated phases are dealt with and that is beyond the scope of the present study. If the crystal structures are not constrained by symmetry we relax all internal parameters during the compression. The pressure is then obtained at fixed volumes from a Murnaghan fit to the DFT calculated total energies at neighboring volumes (a total of five volume points, in steps of about 0.3 Å3, is used for each calculated pressure). No structural relaxation is attempted for these small volume variations. The DFT total energies do not include the zero-point motion contribution.
3. Results
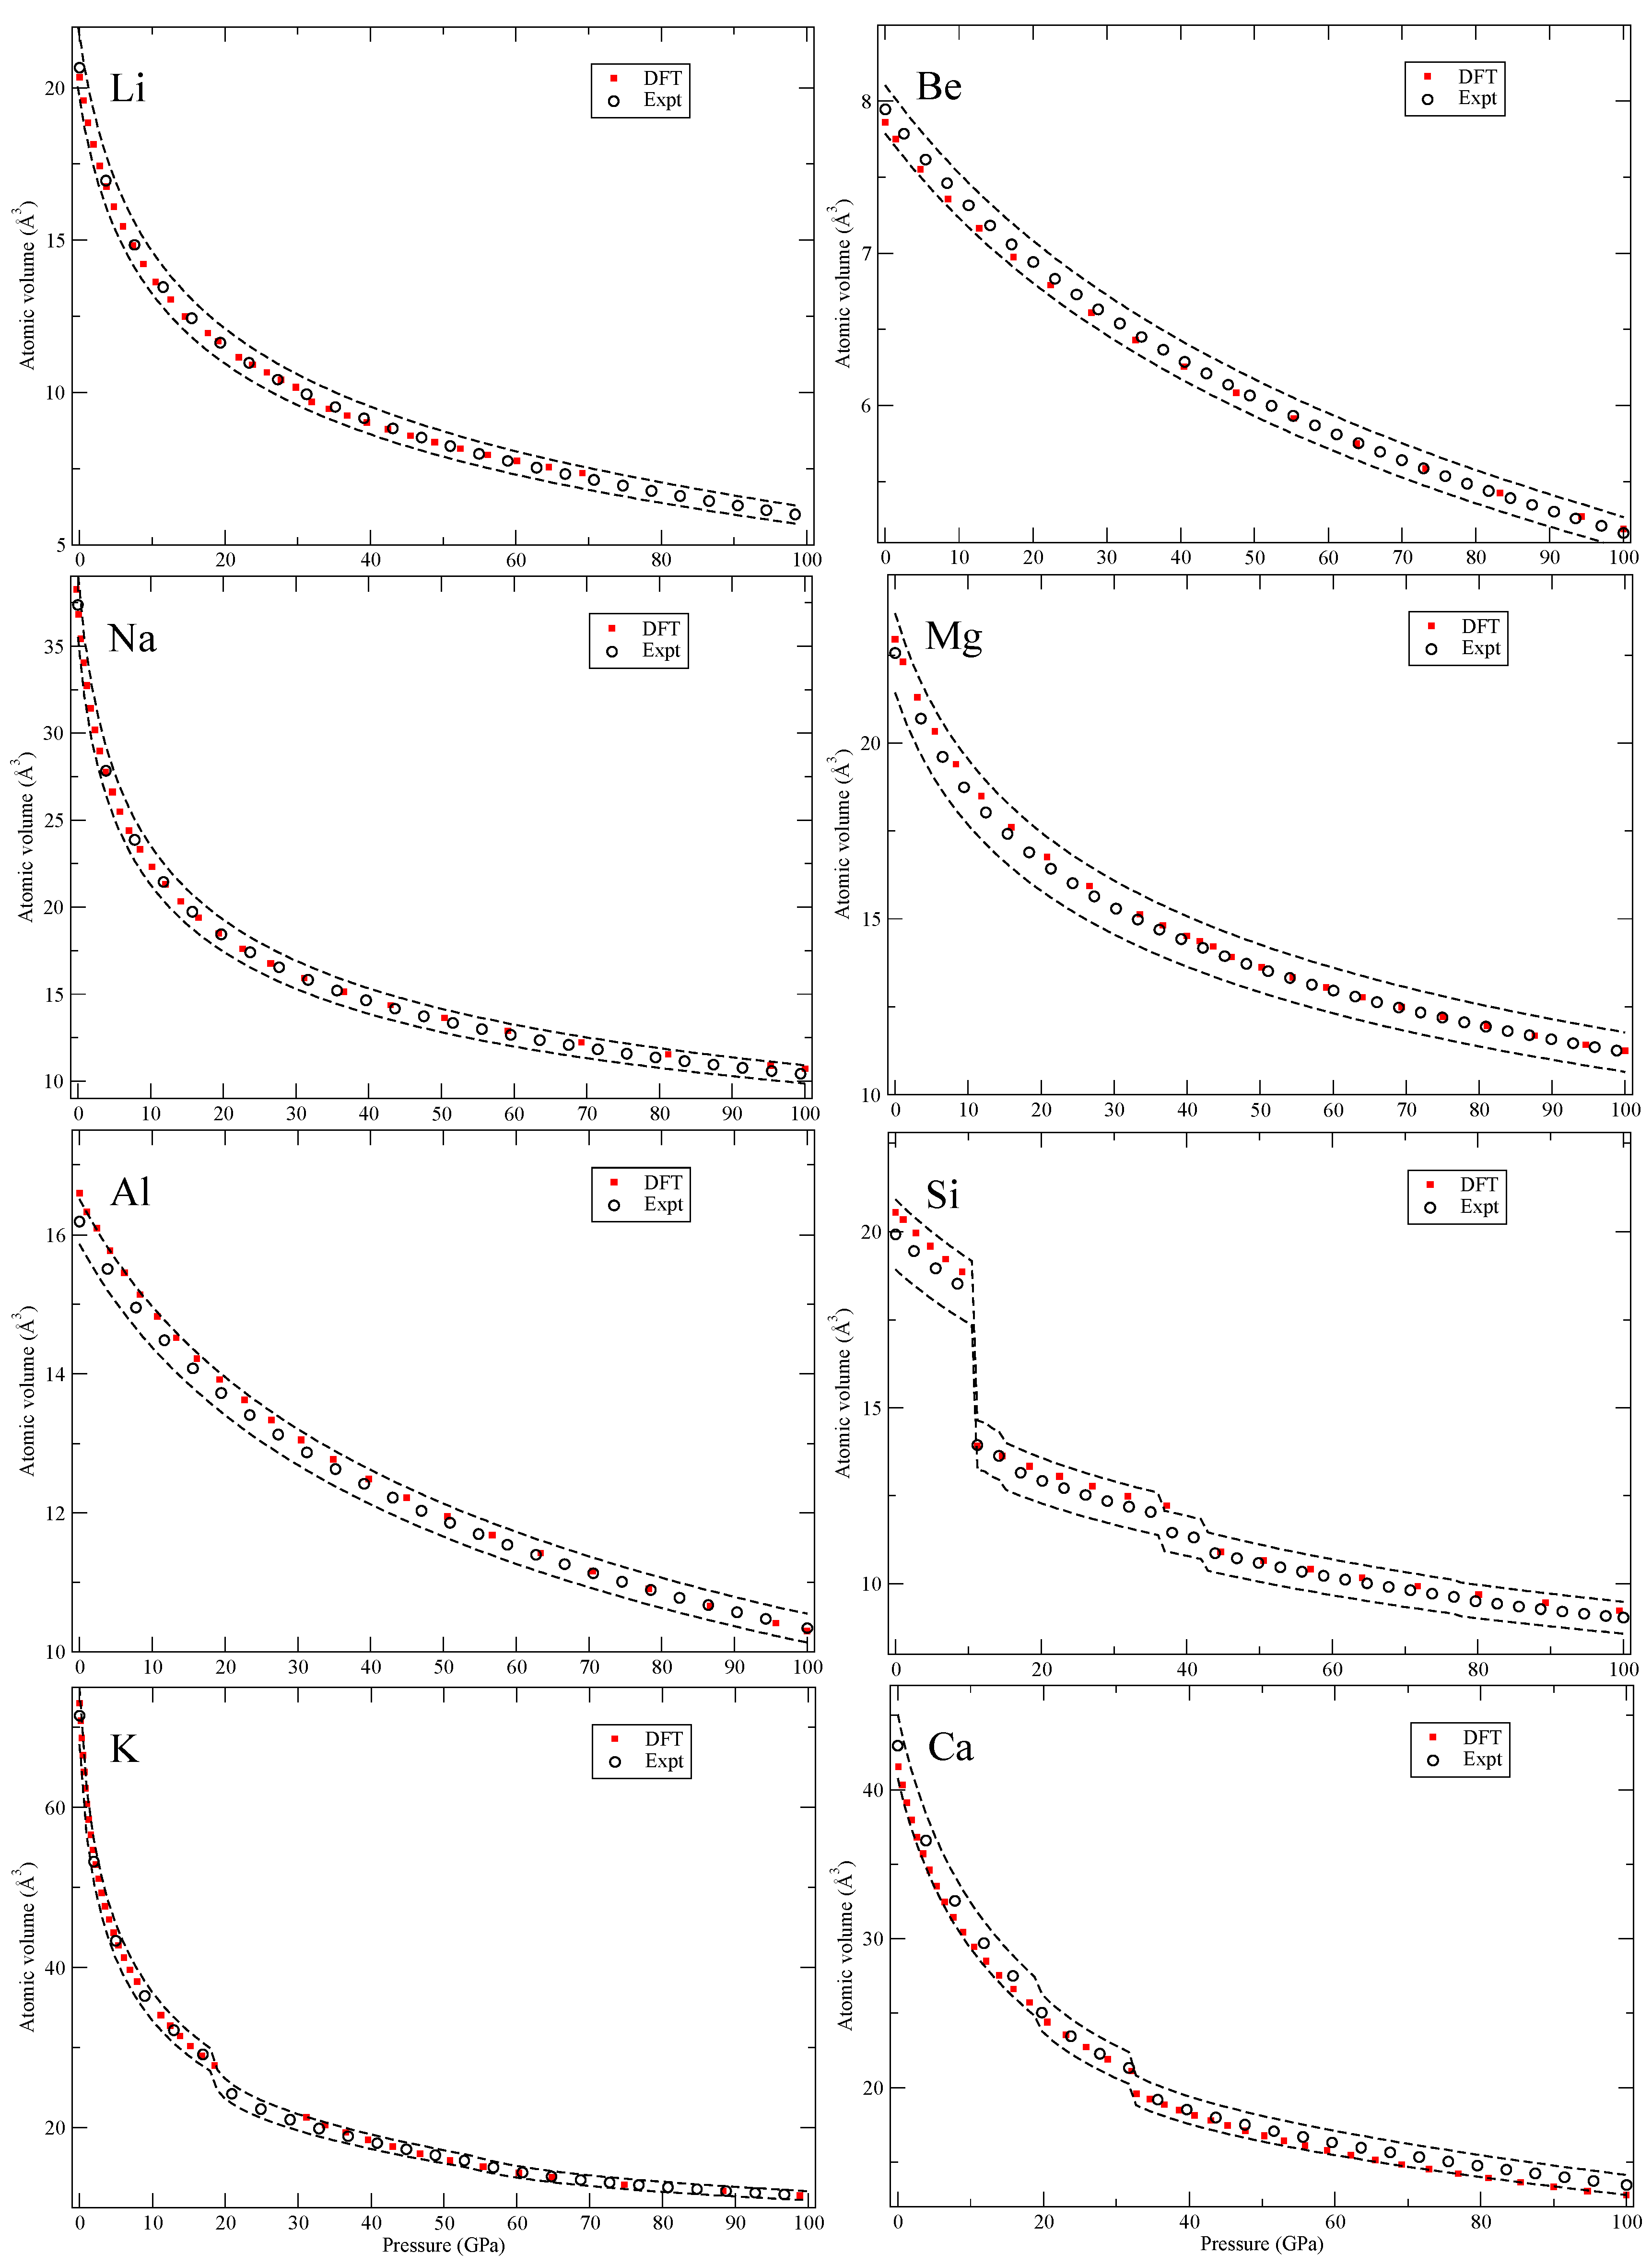
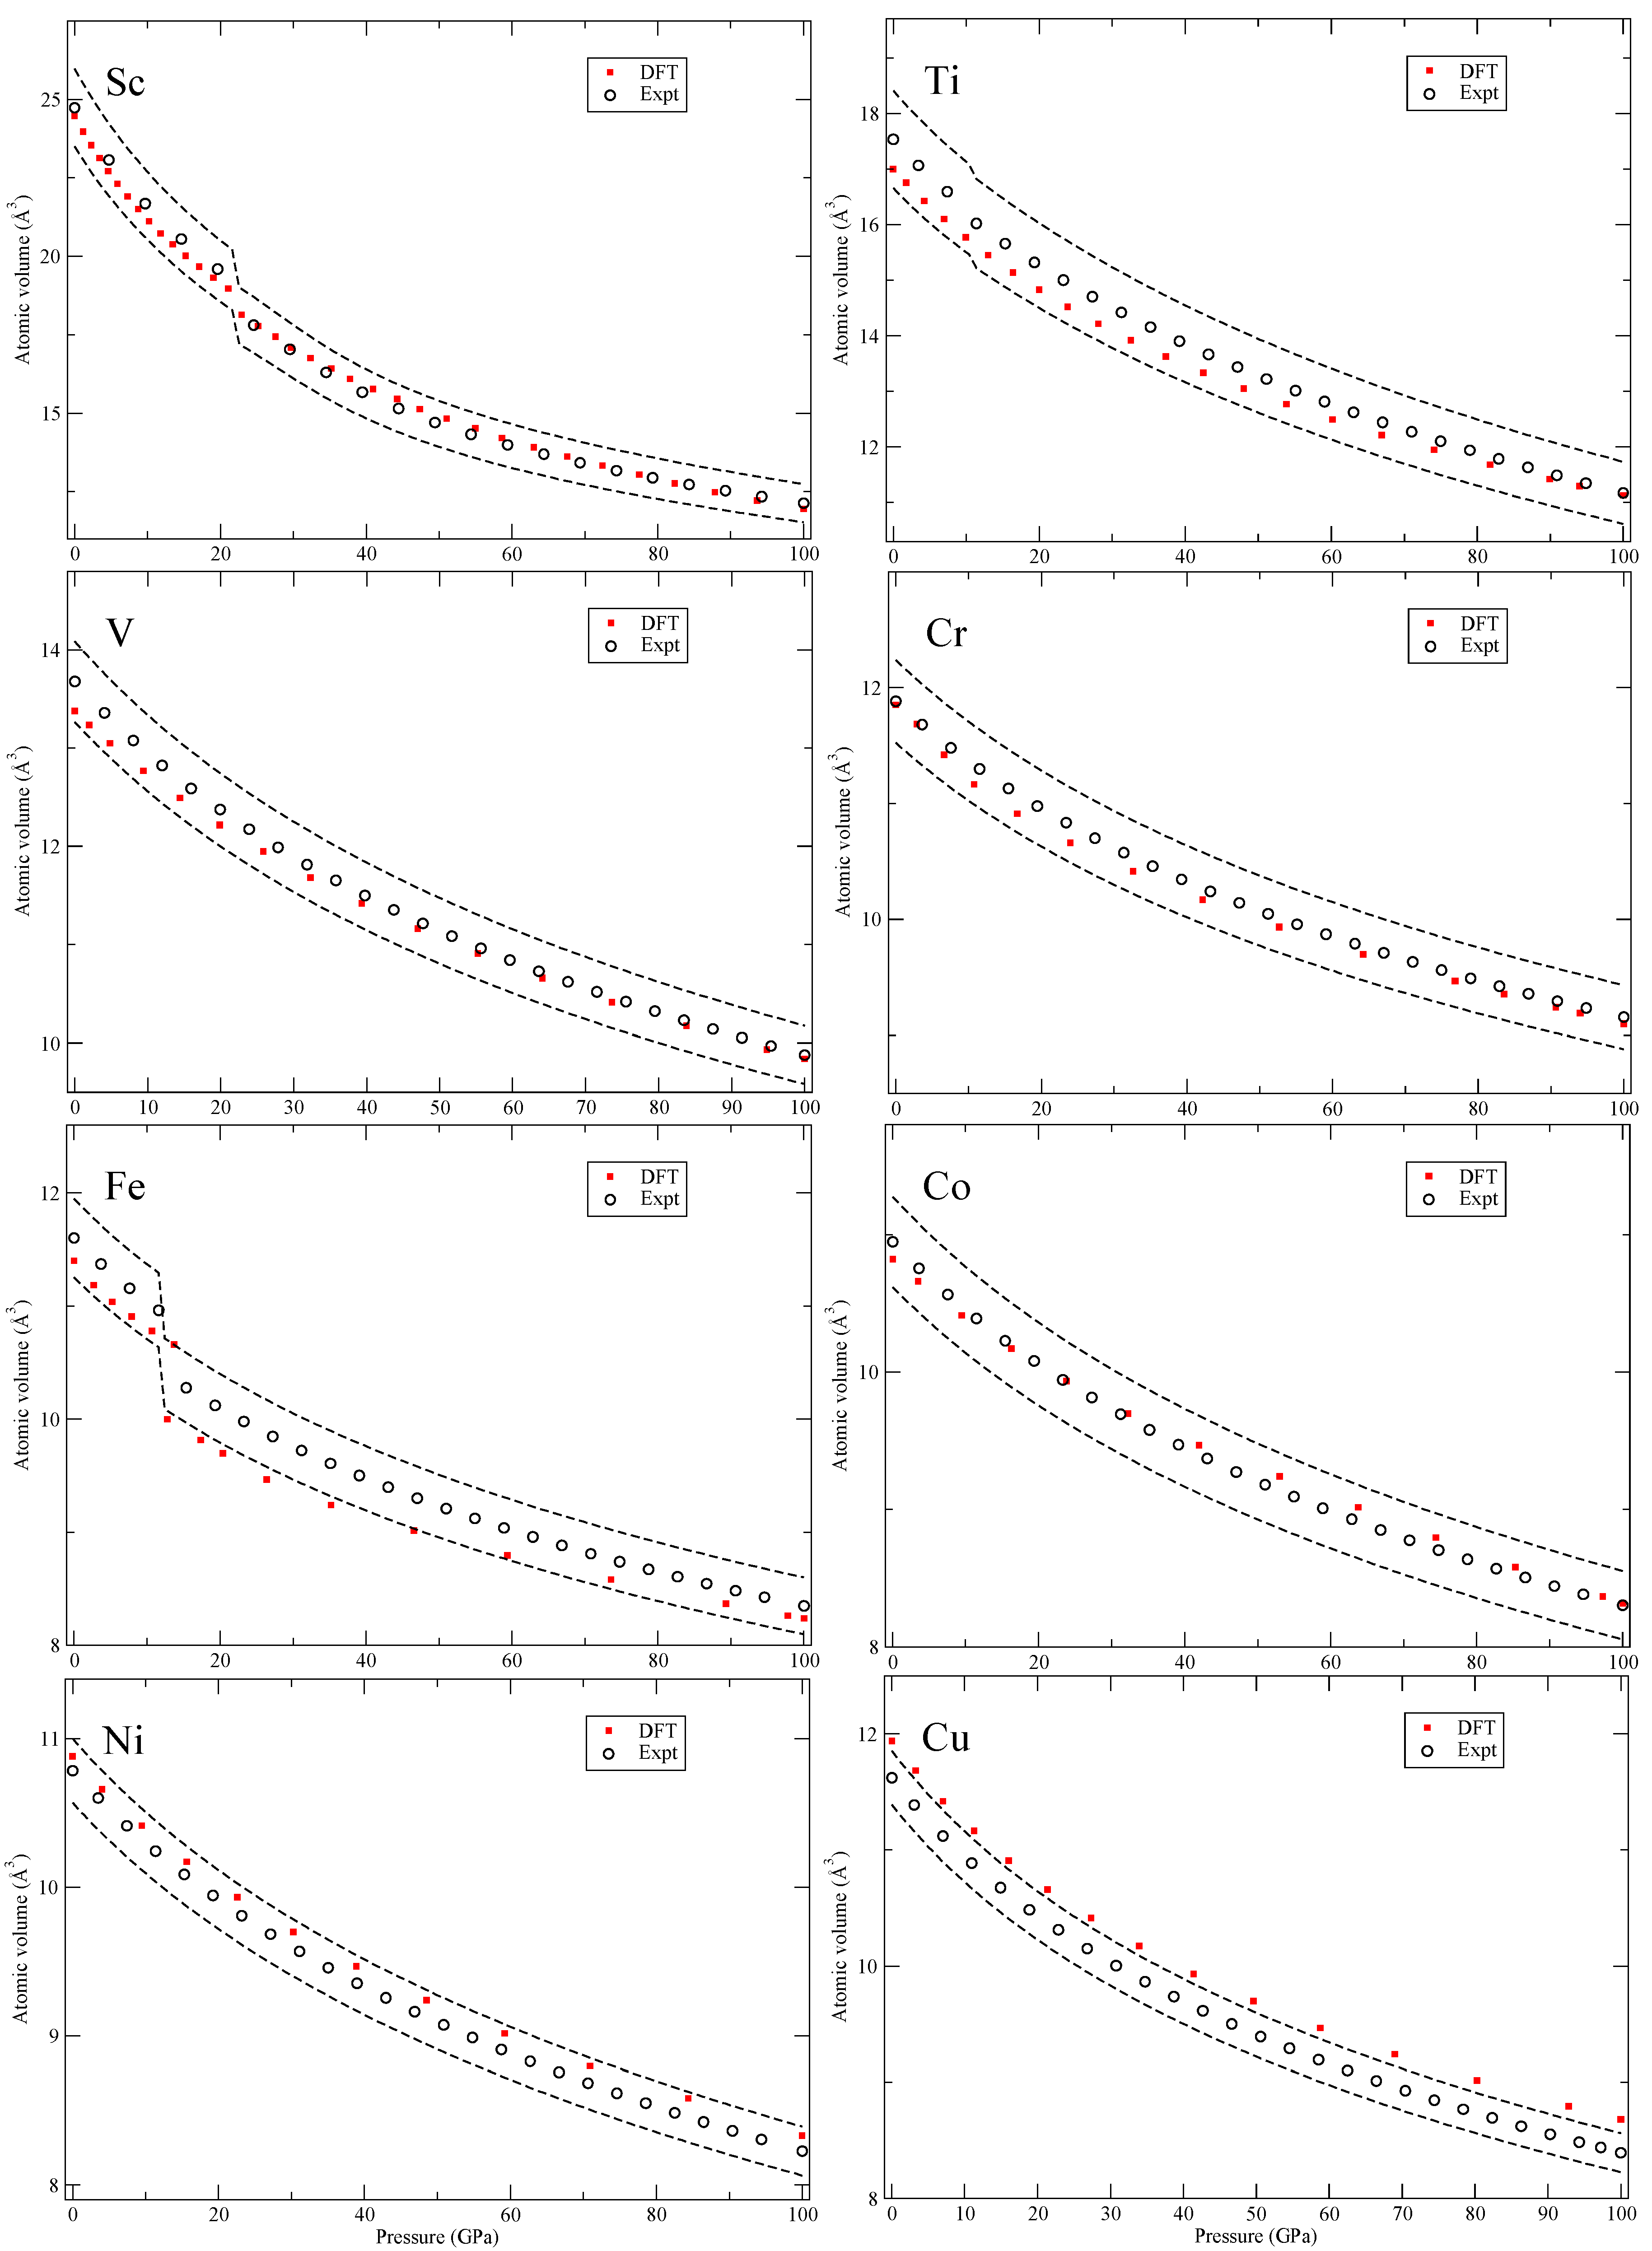
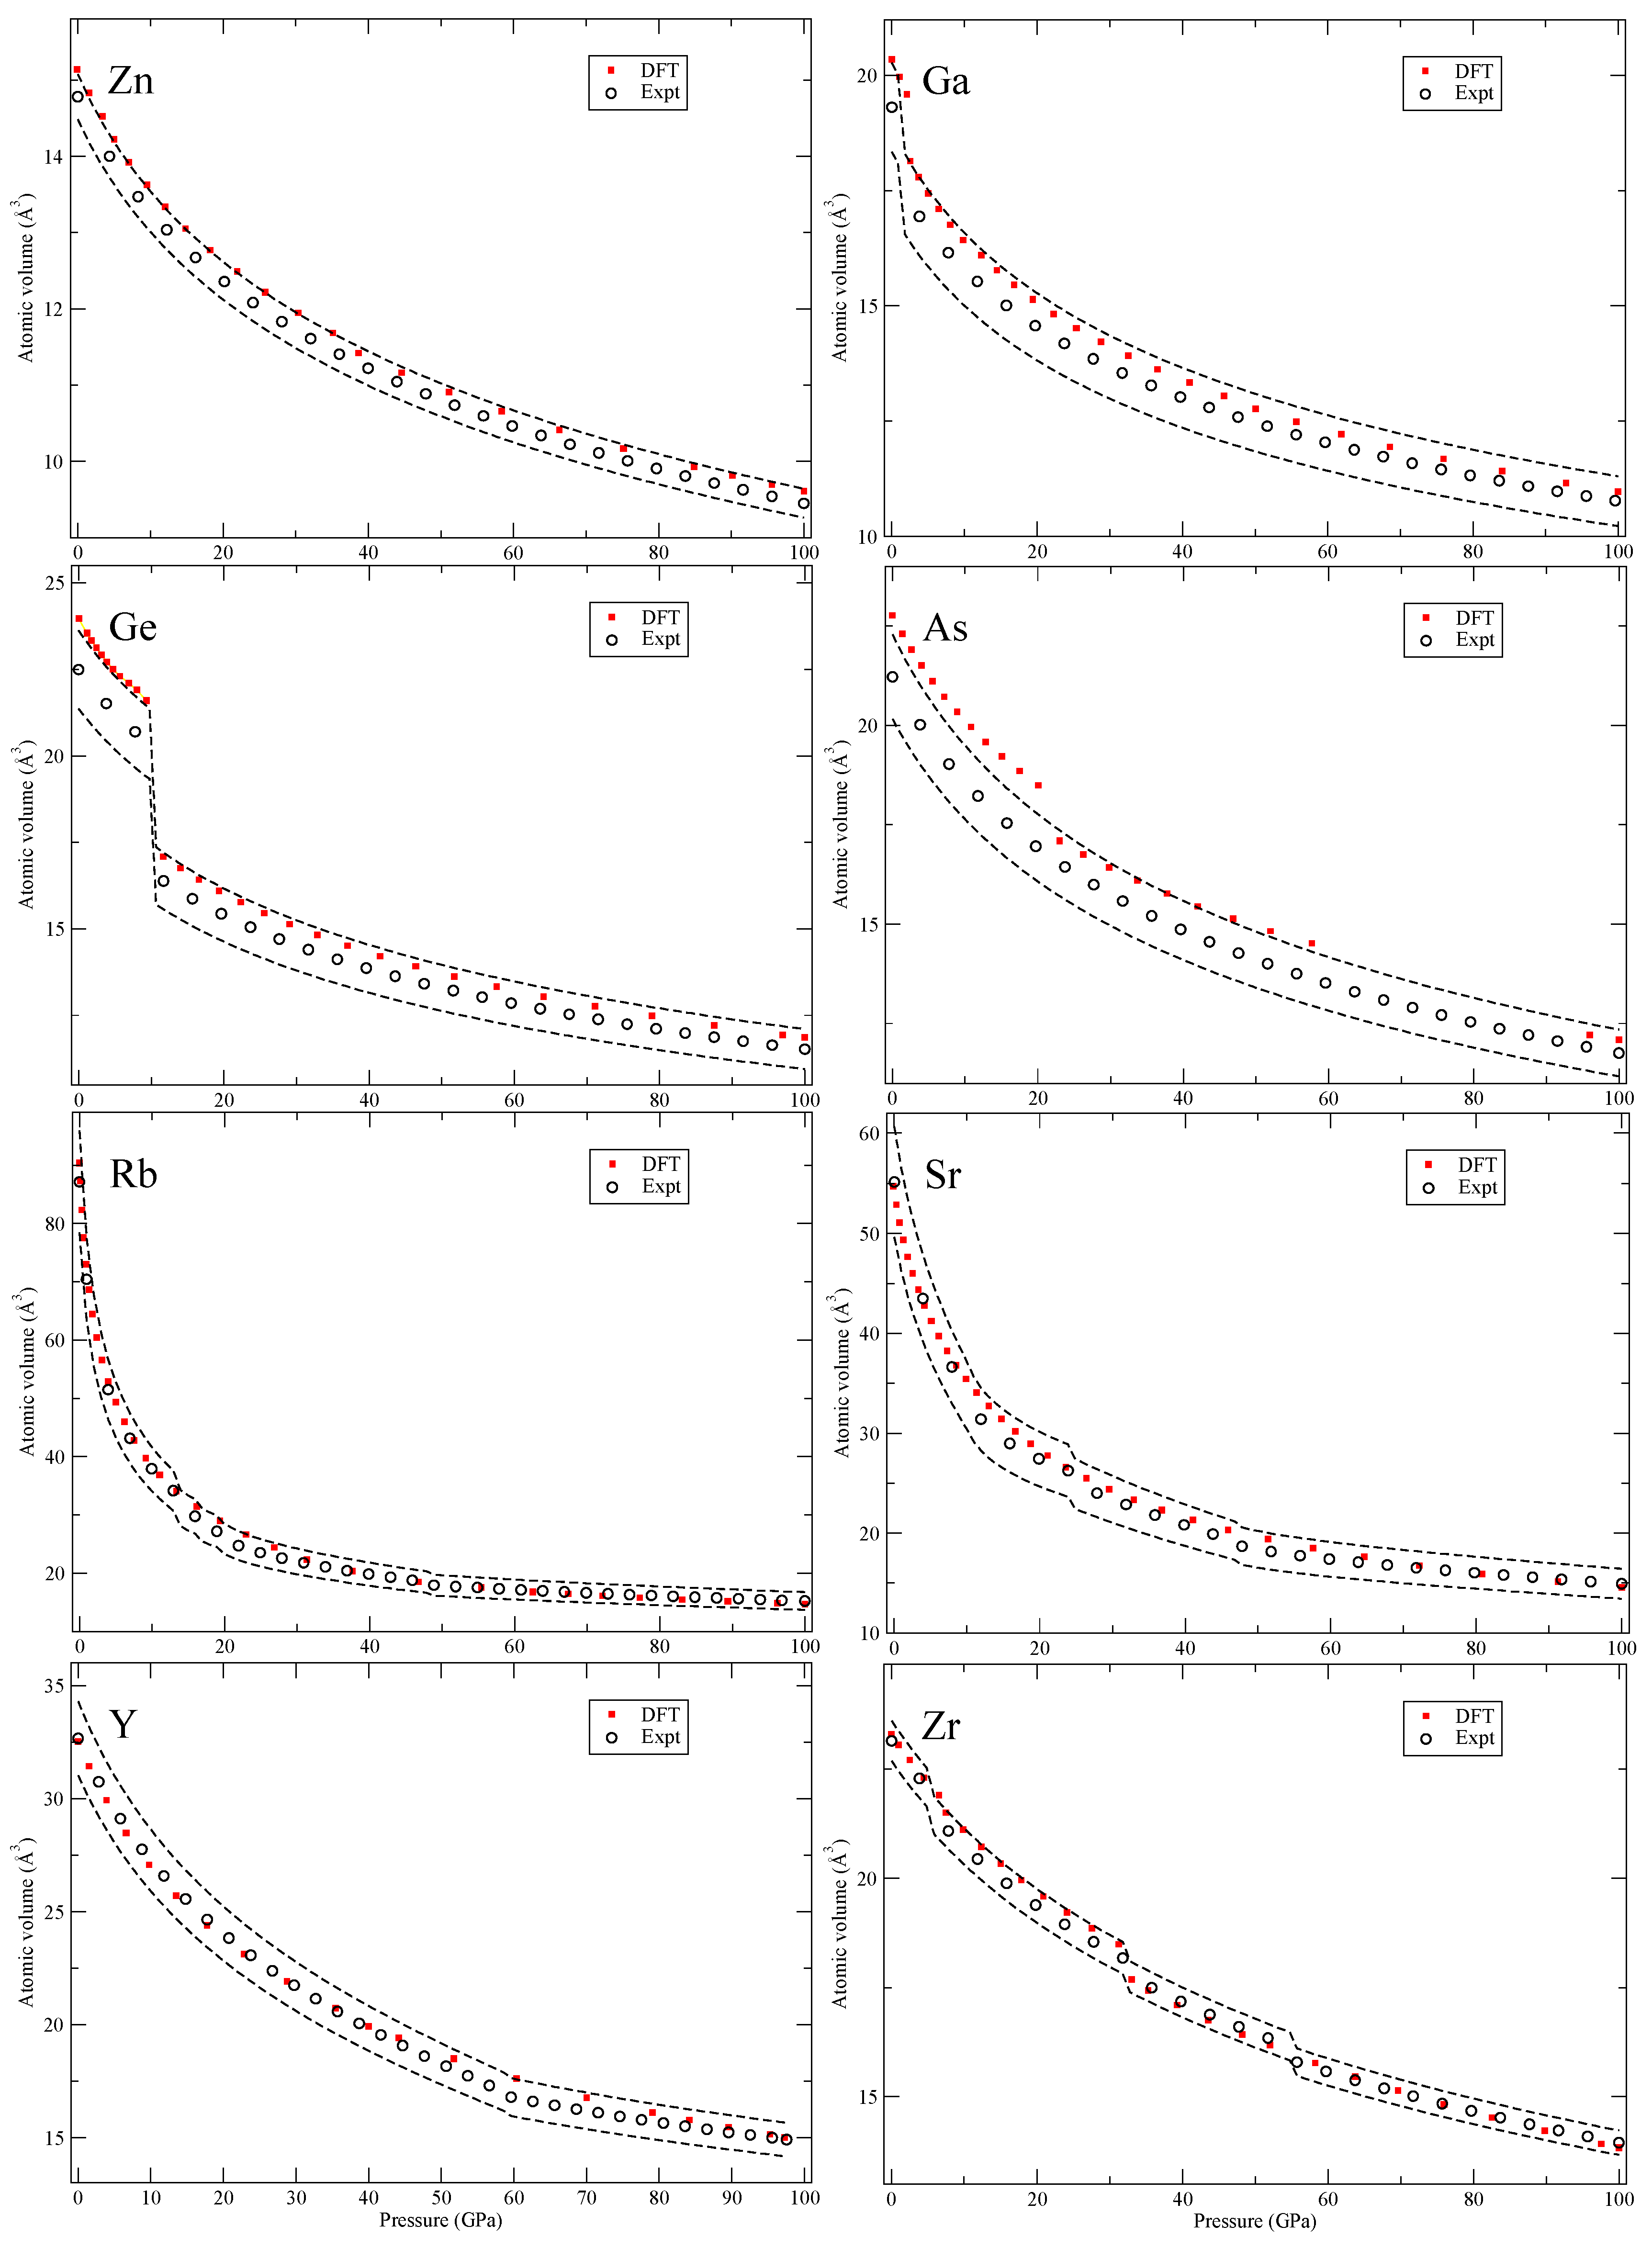
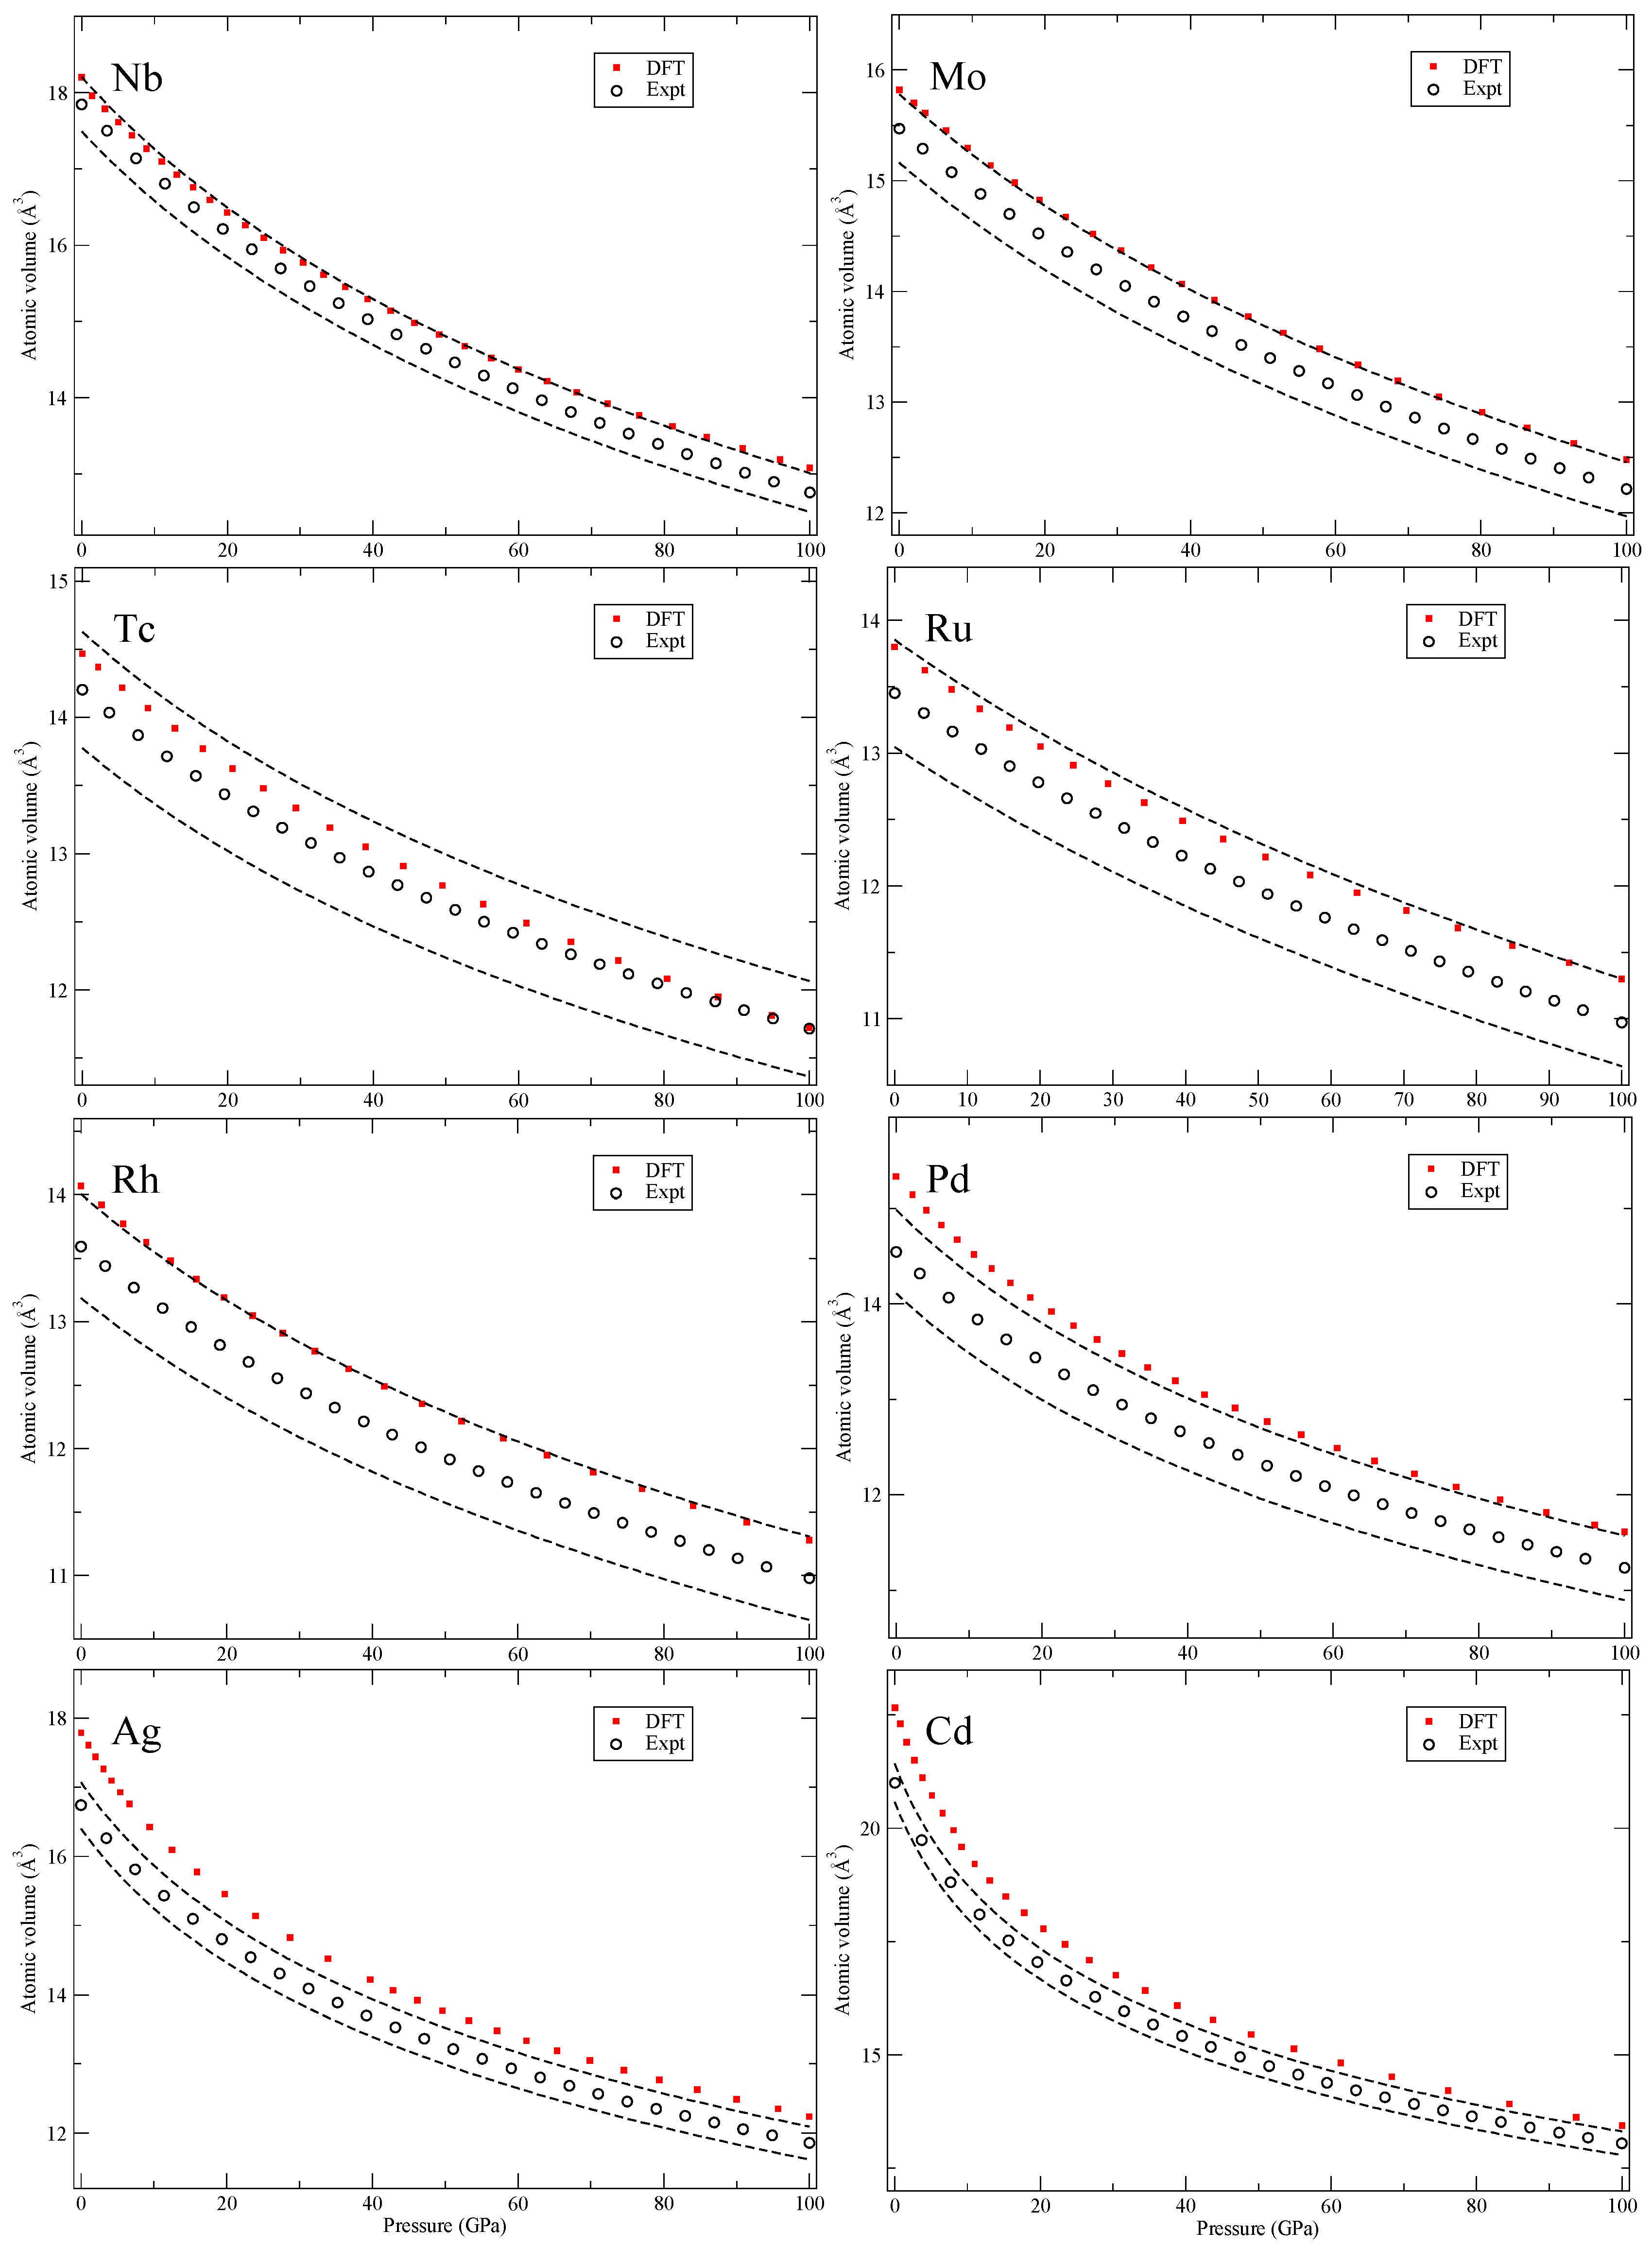
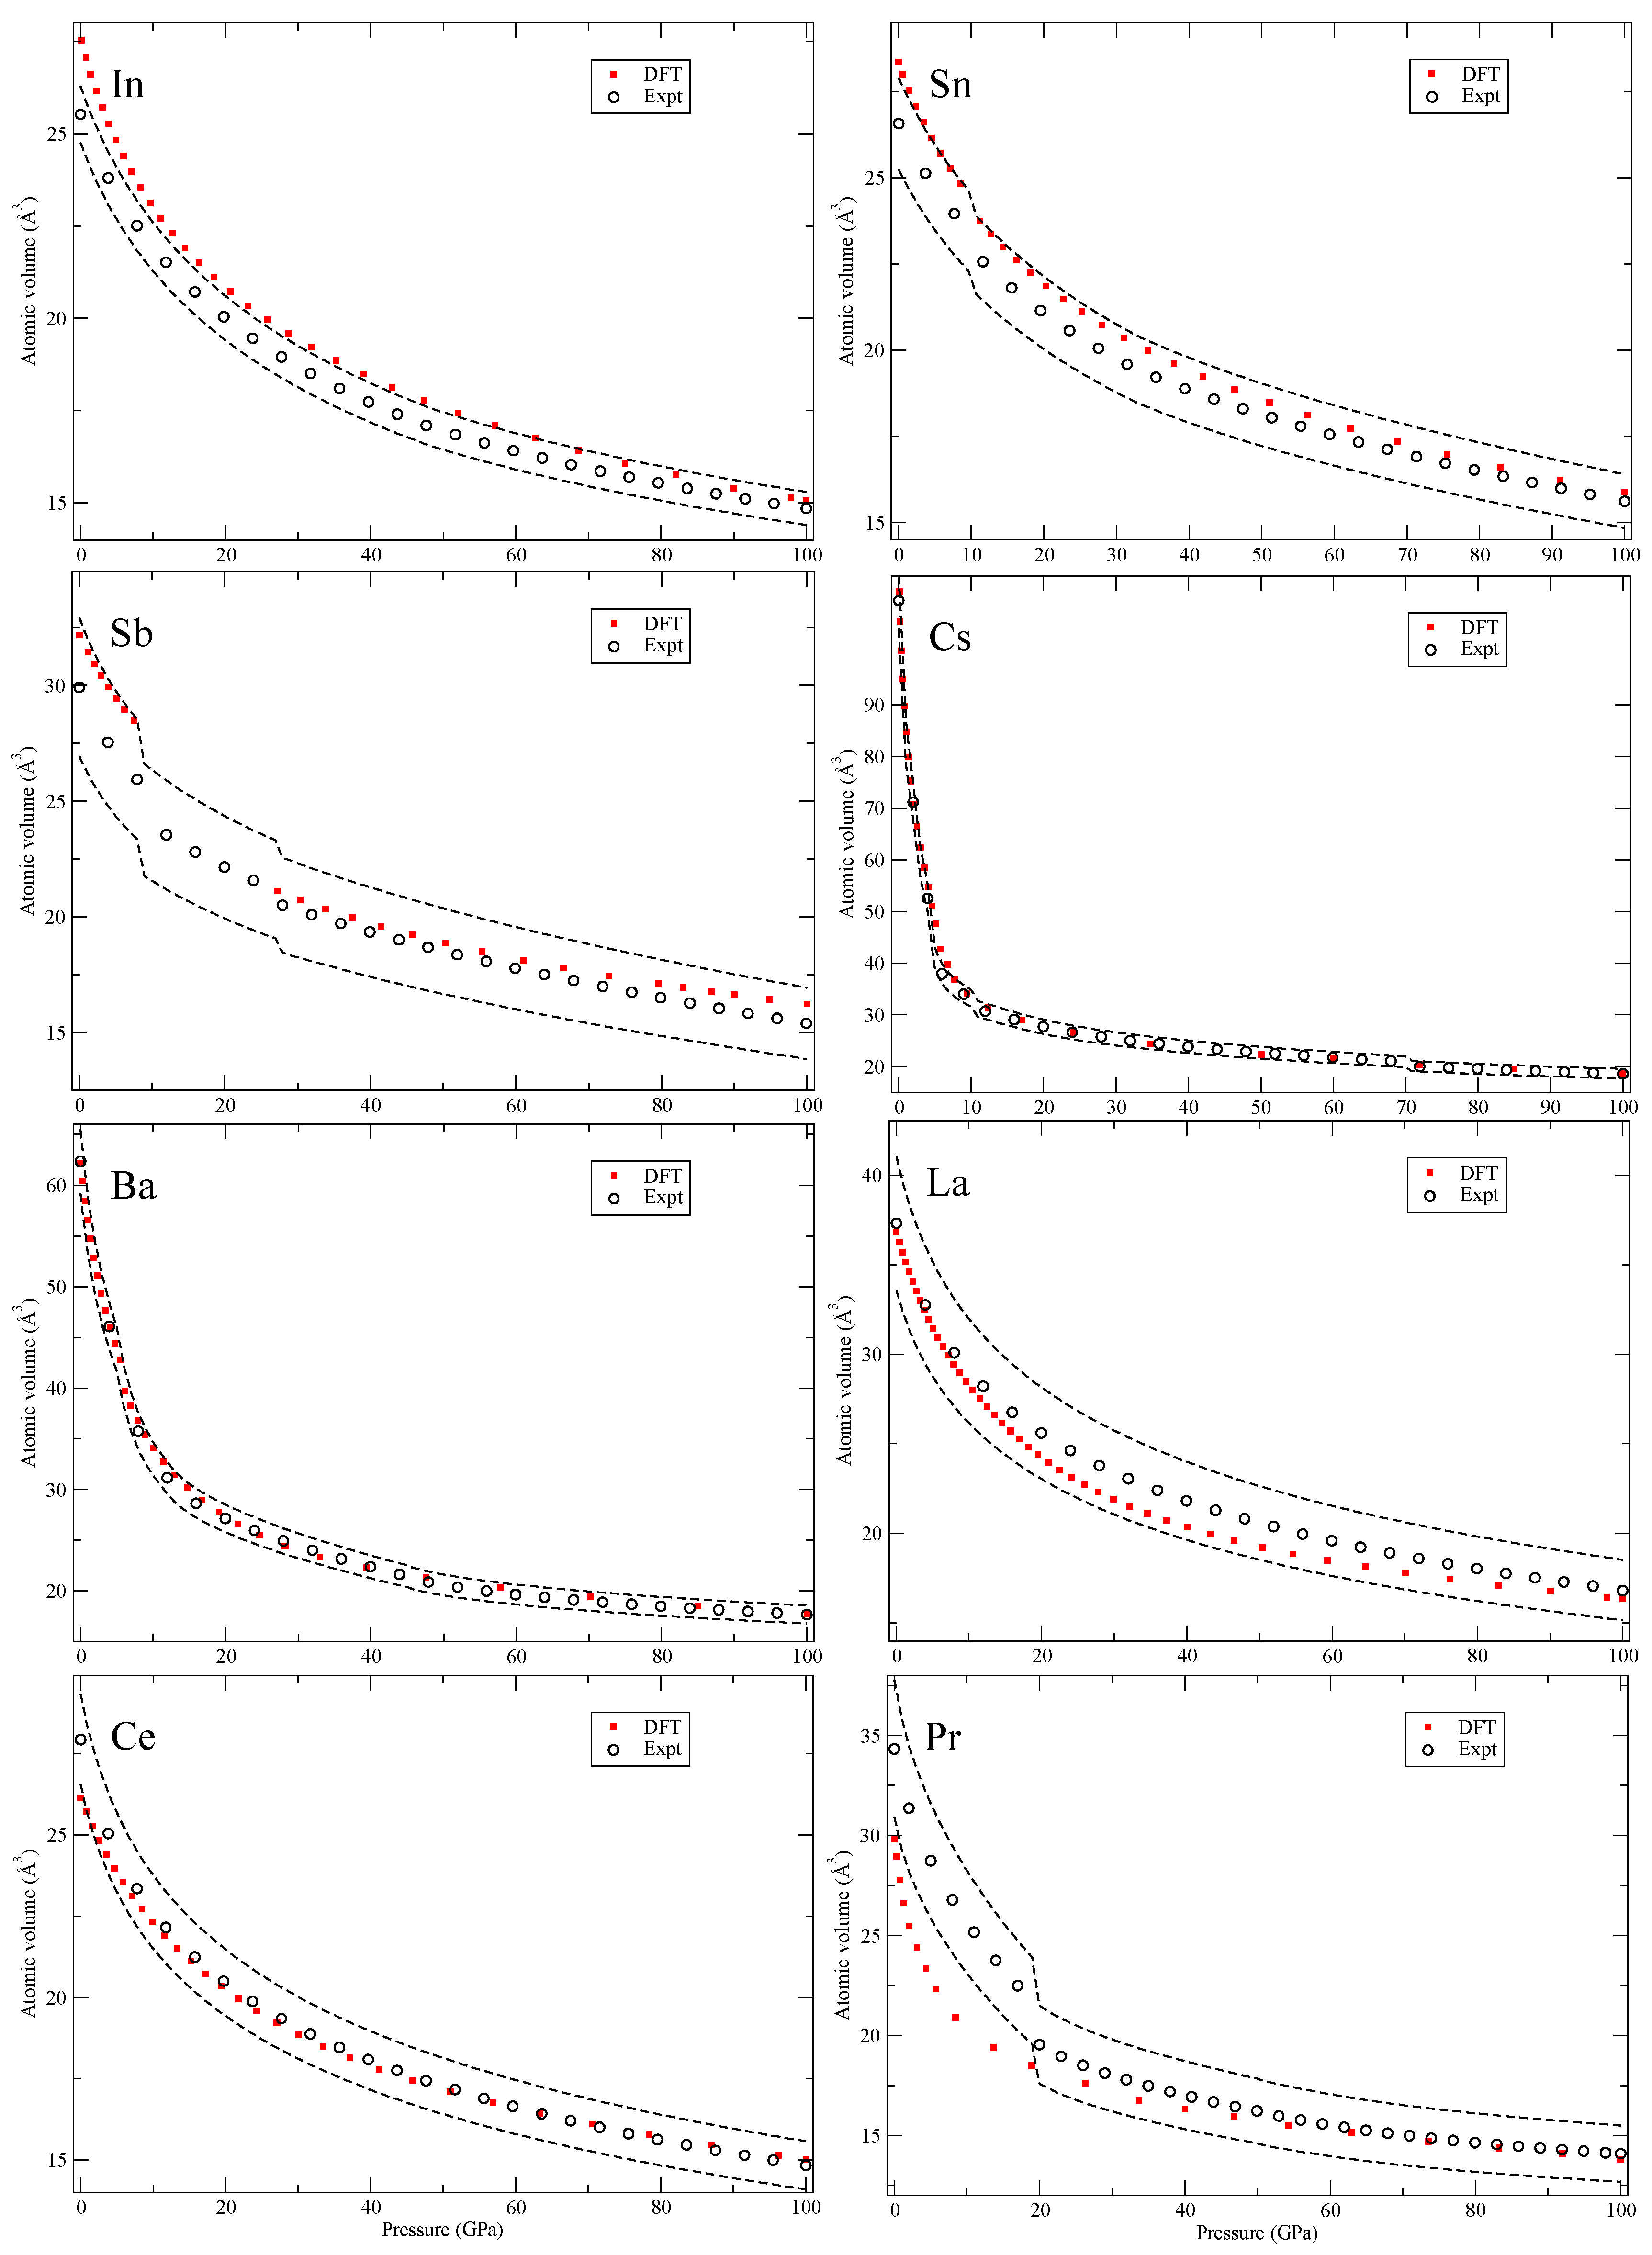
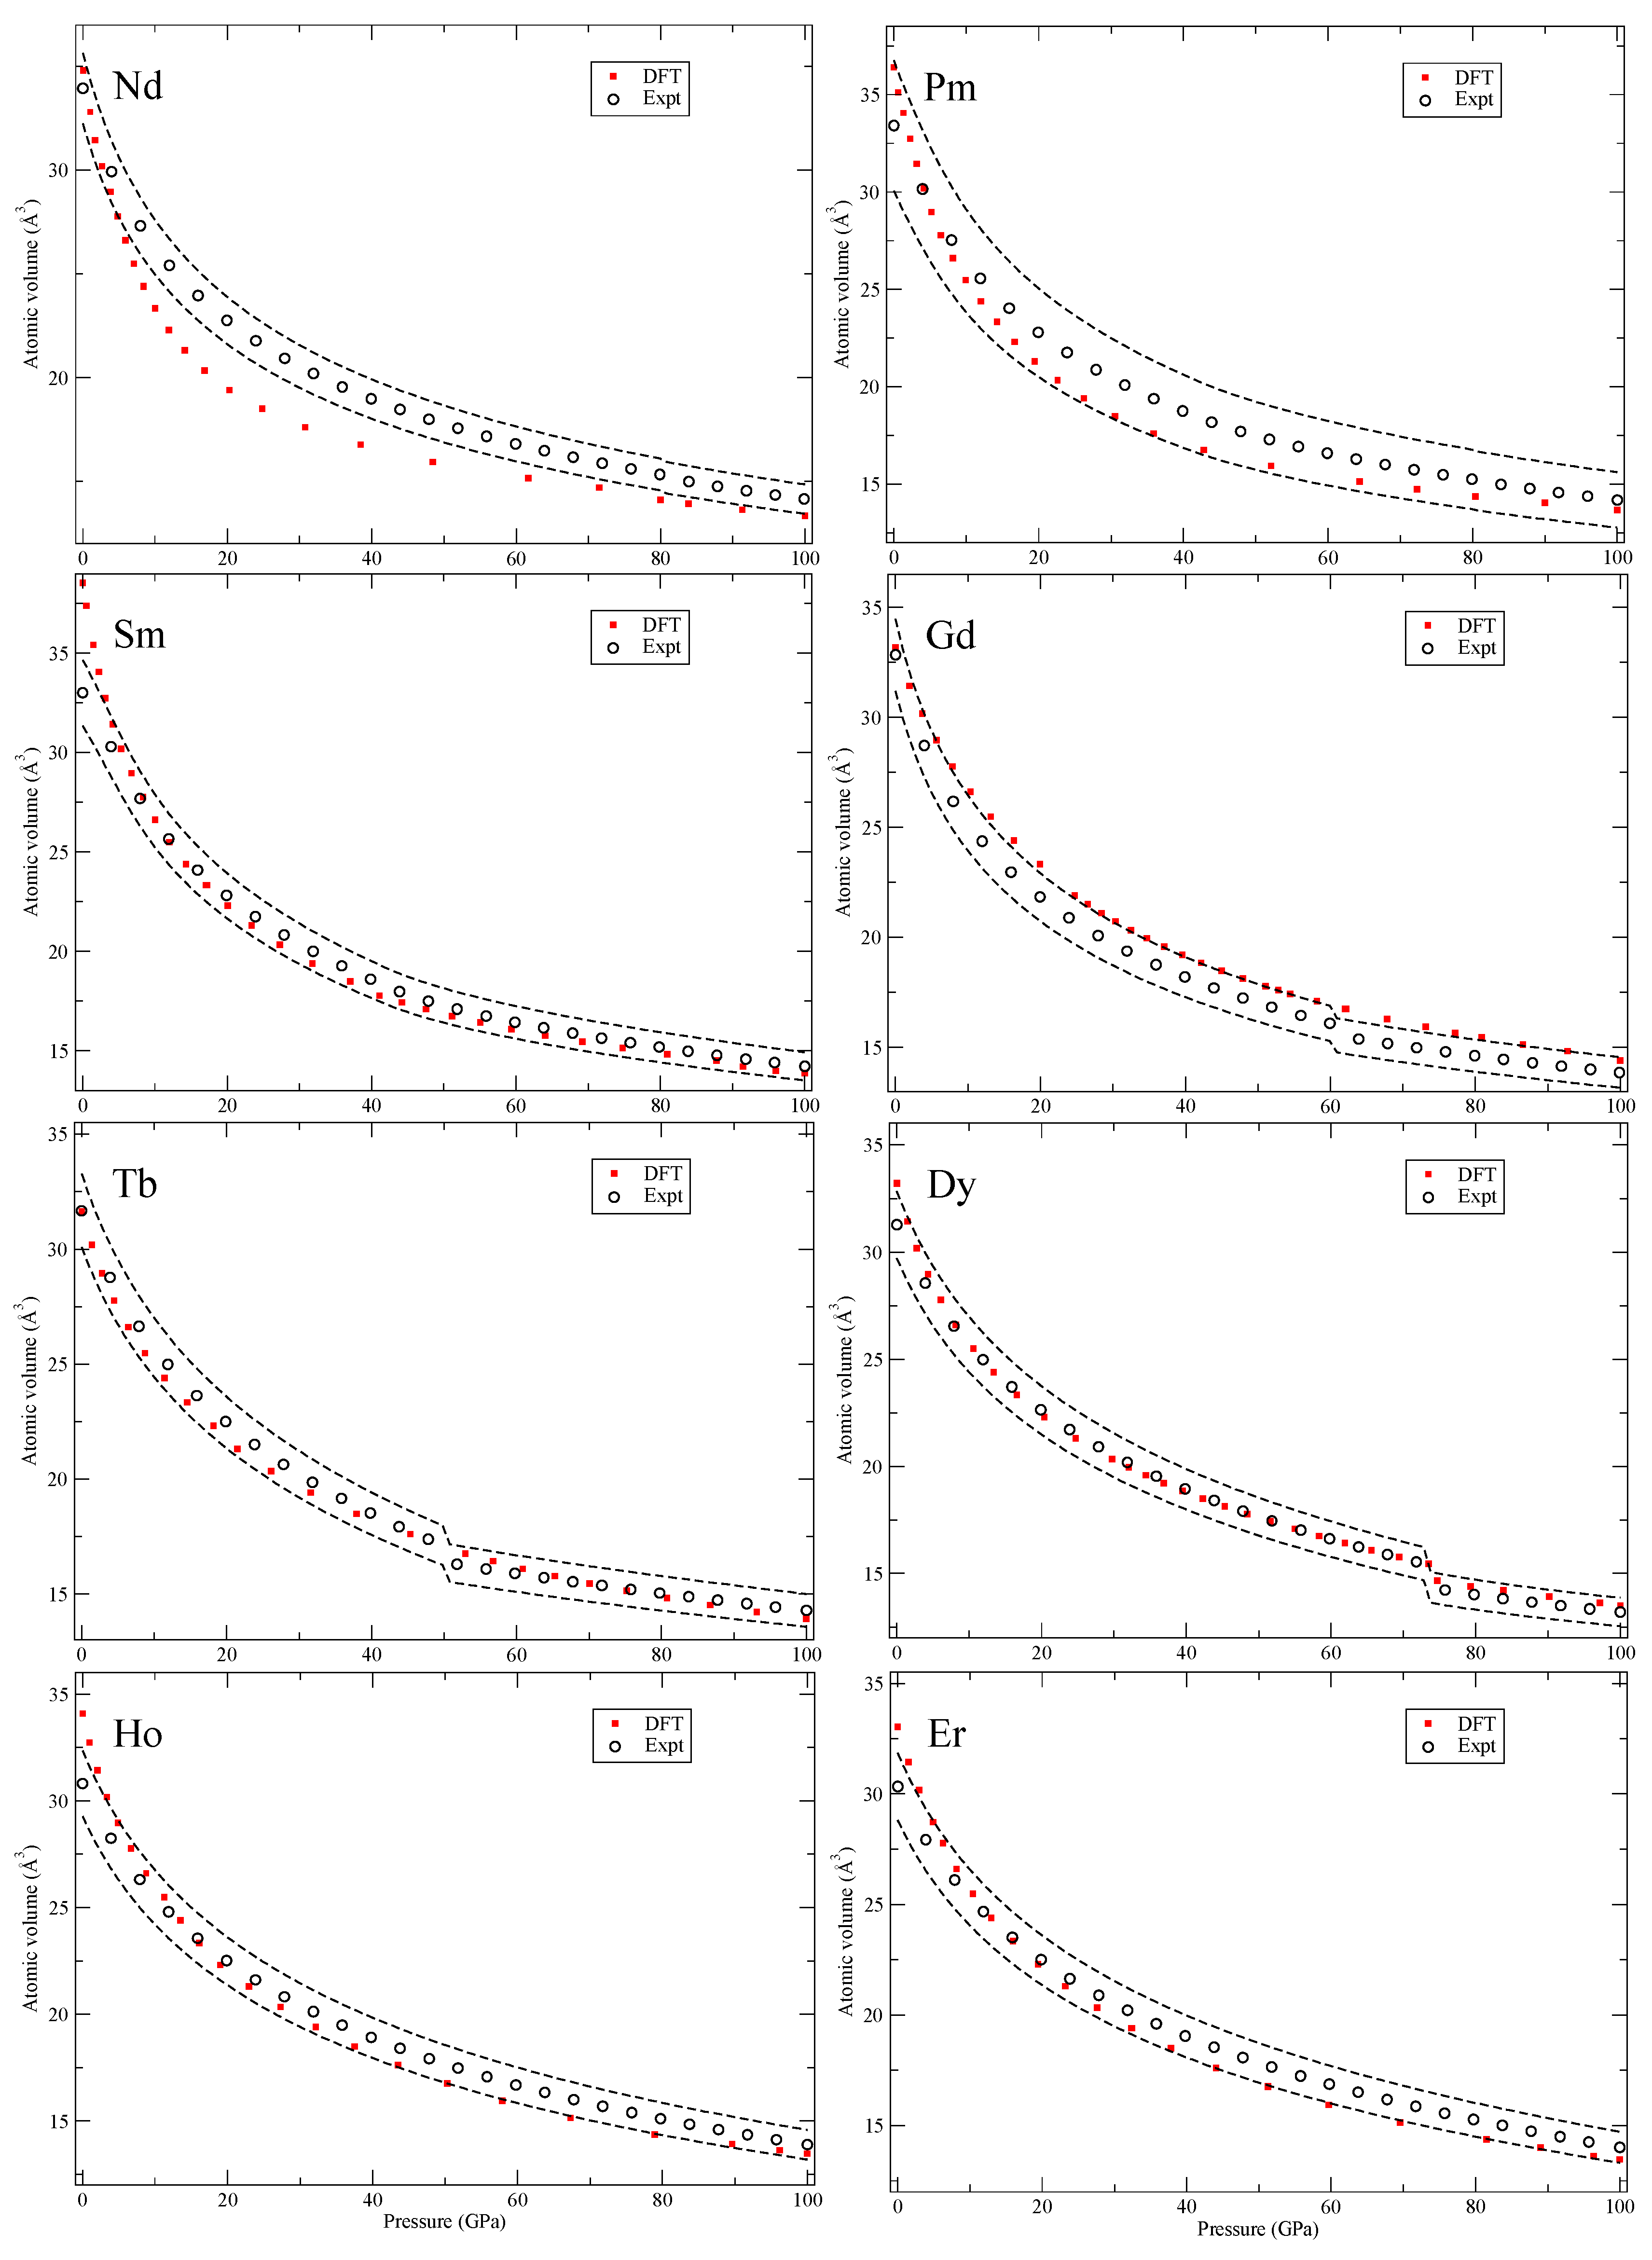
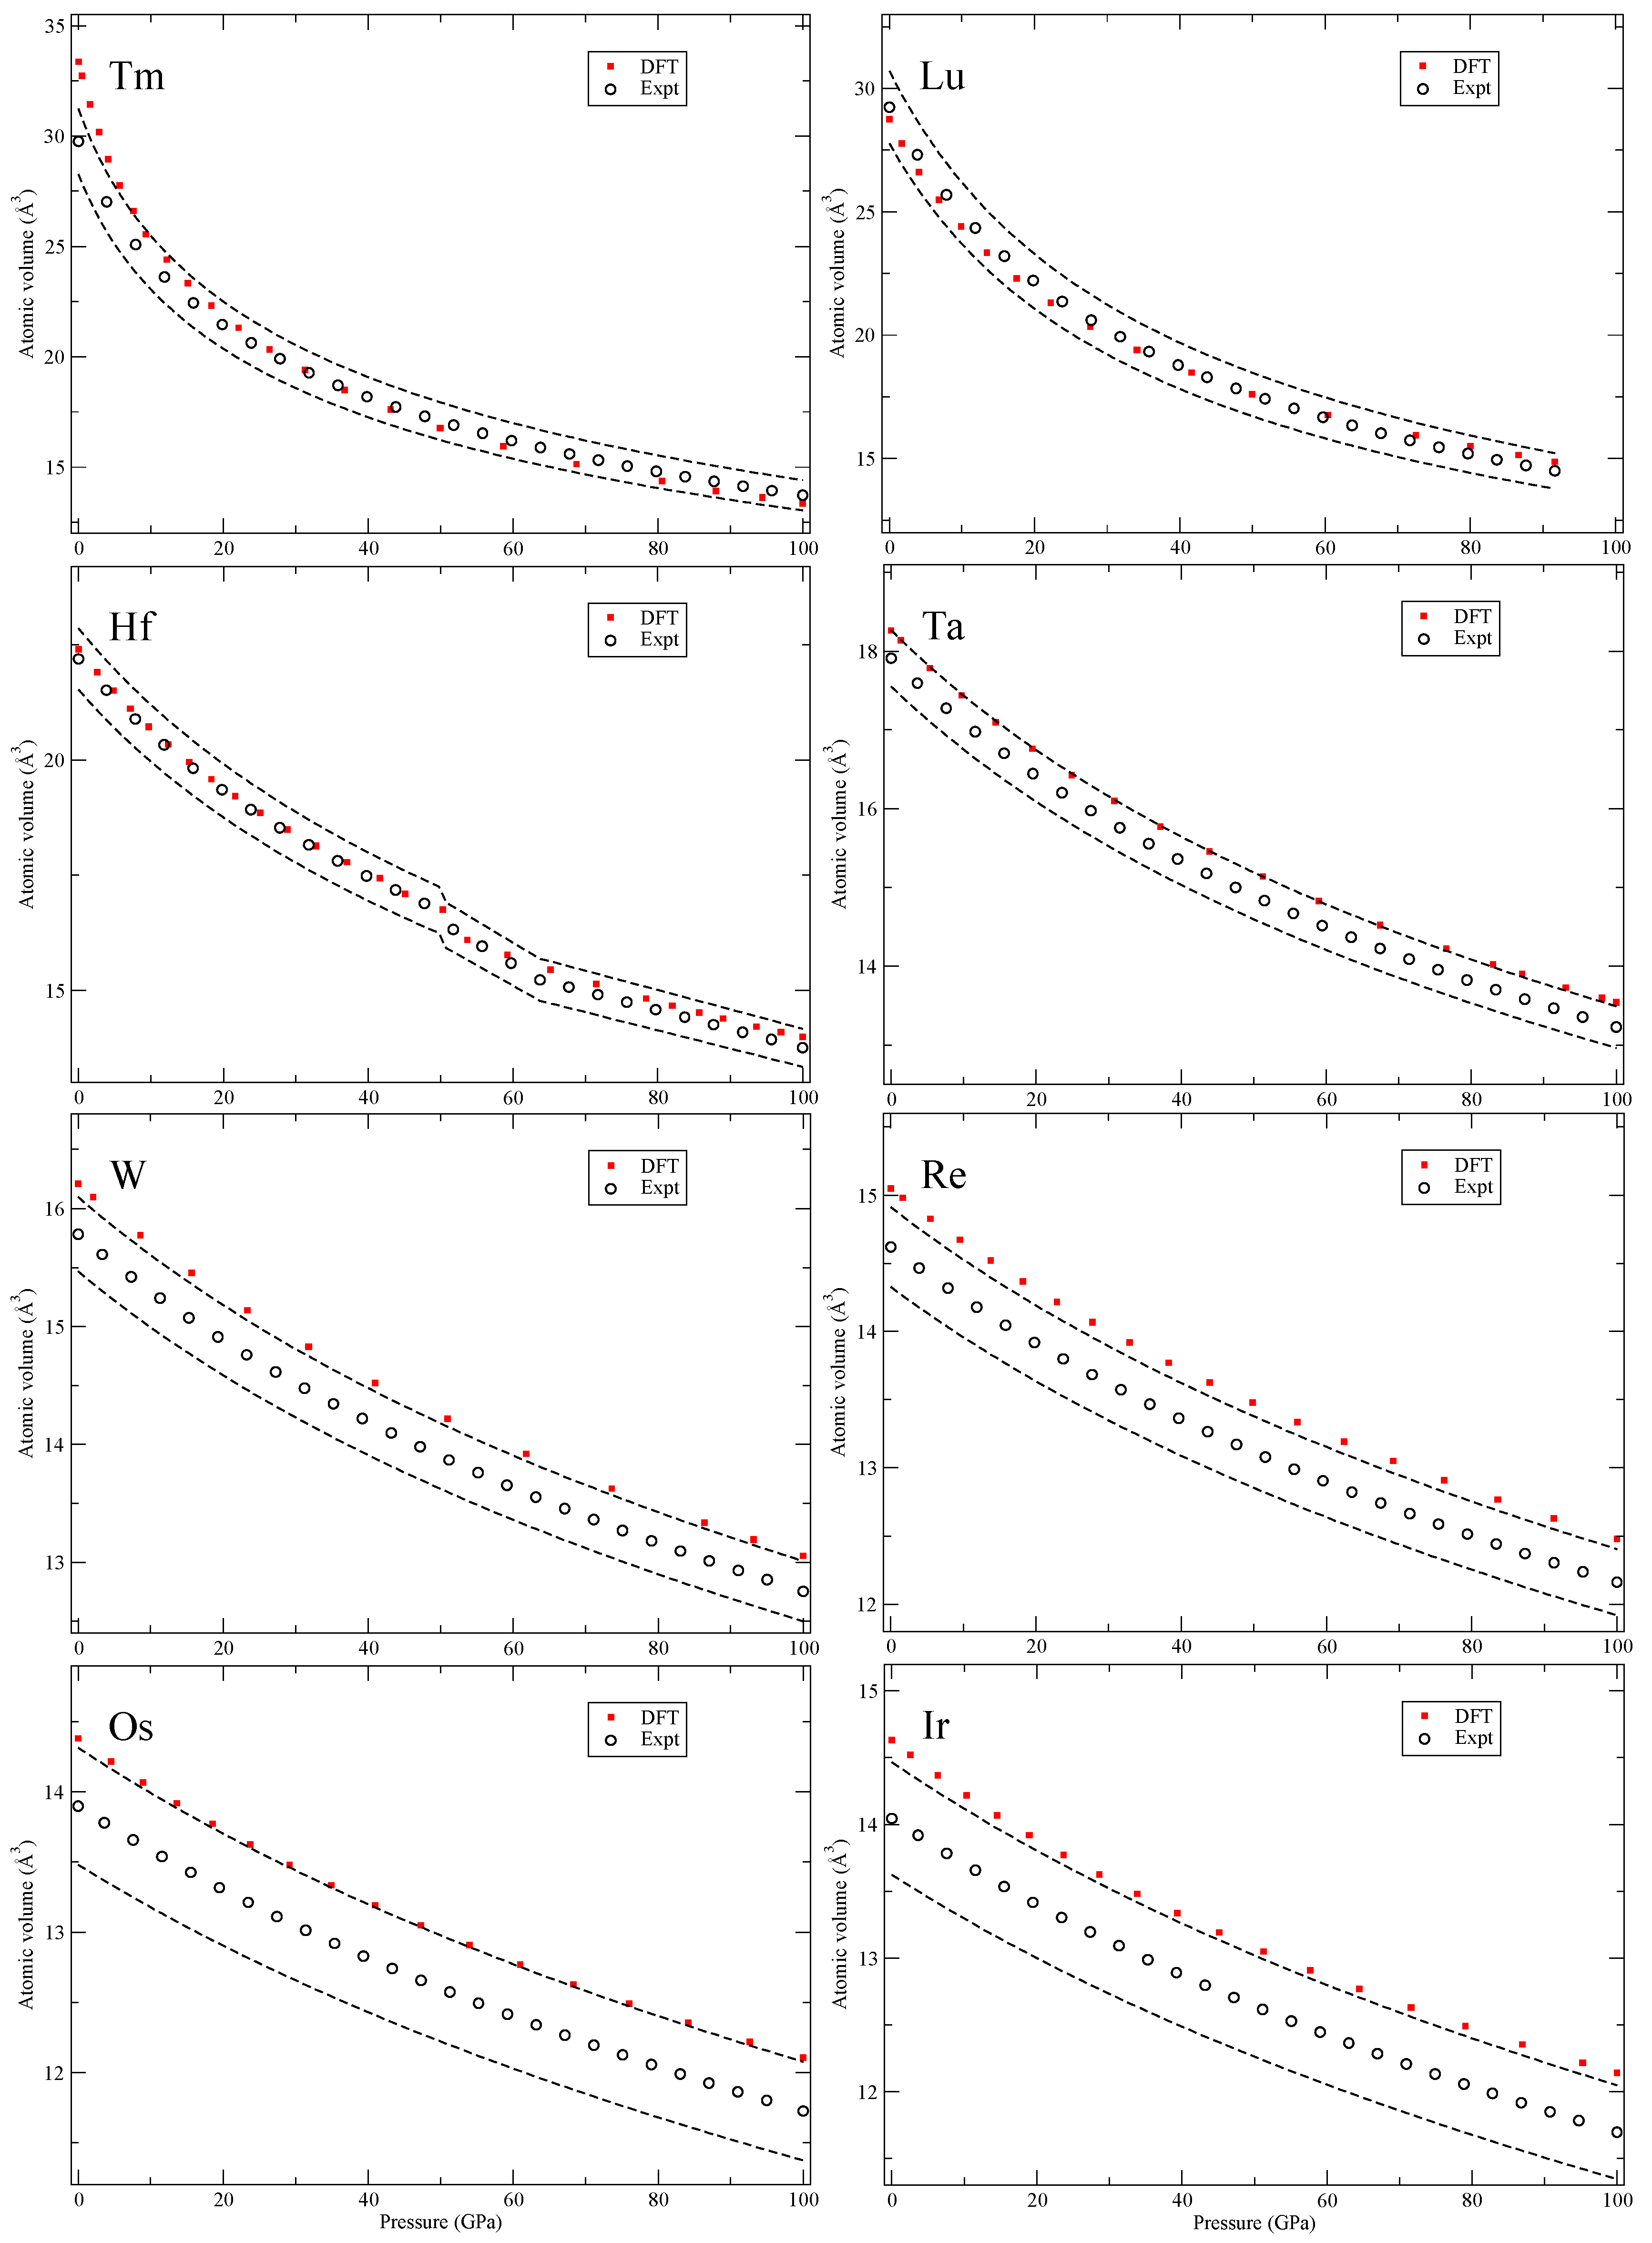
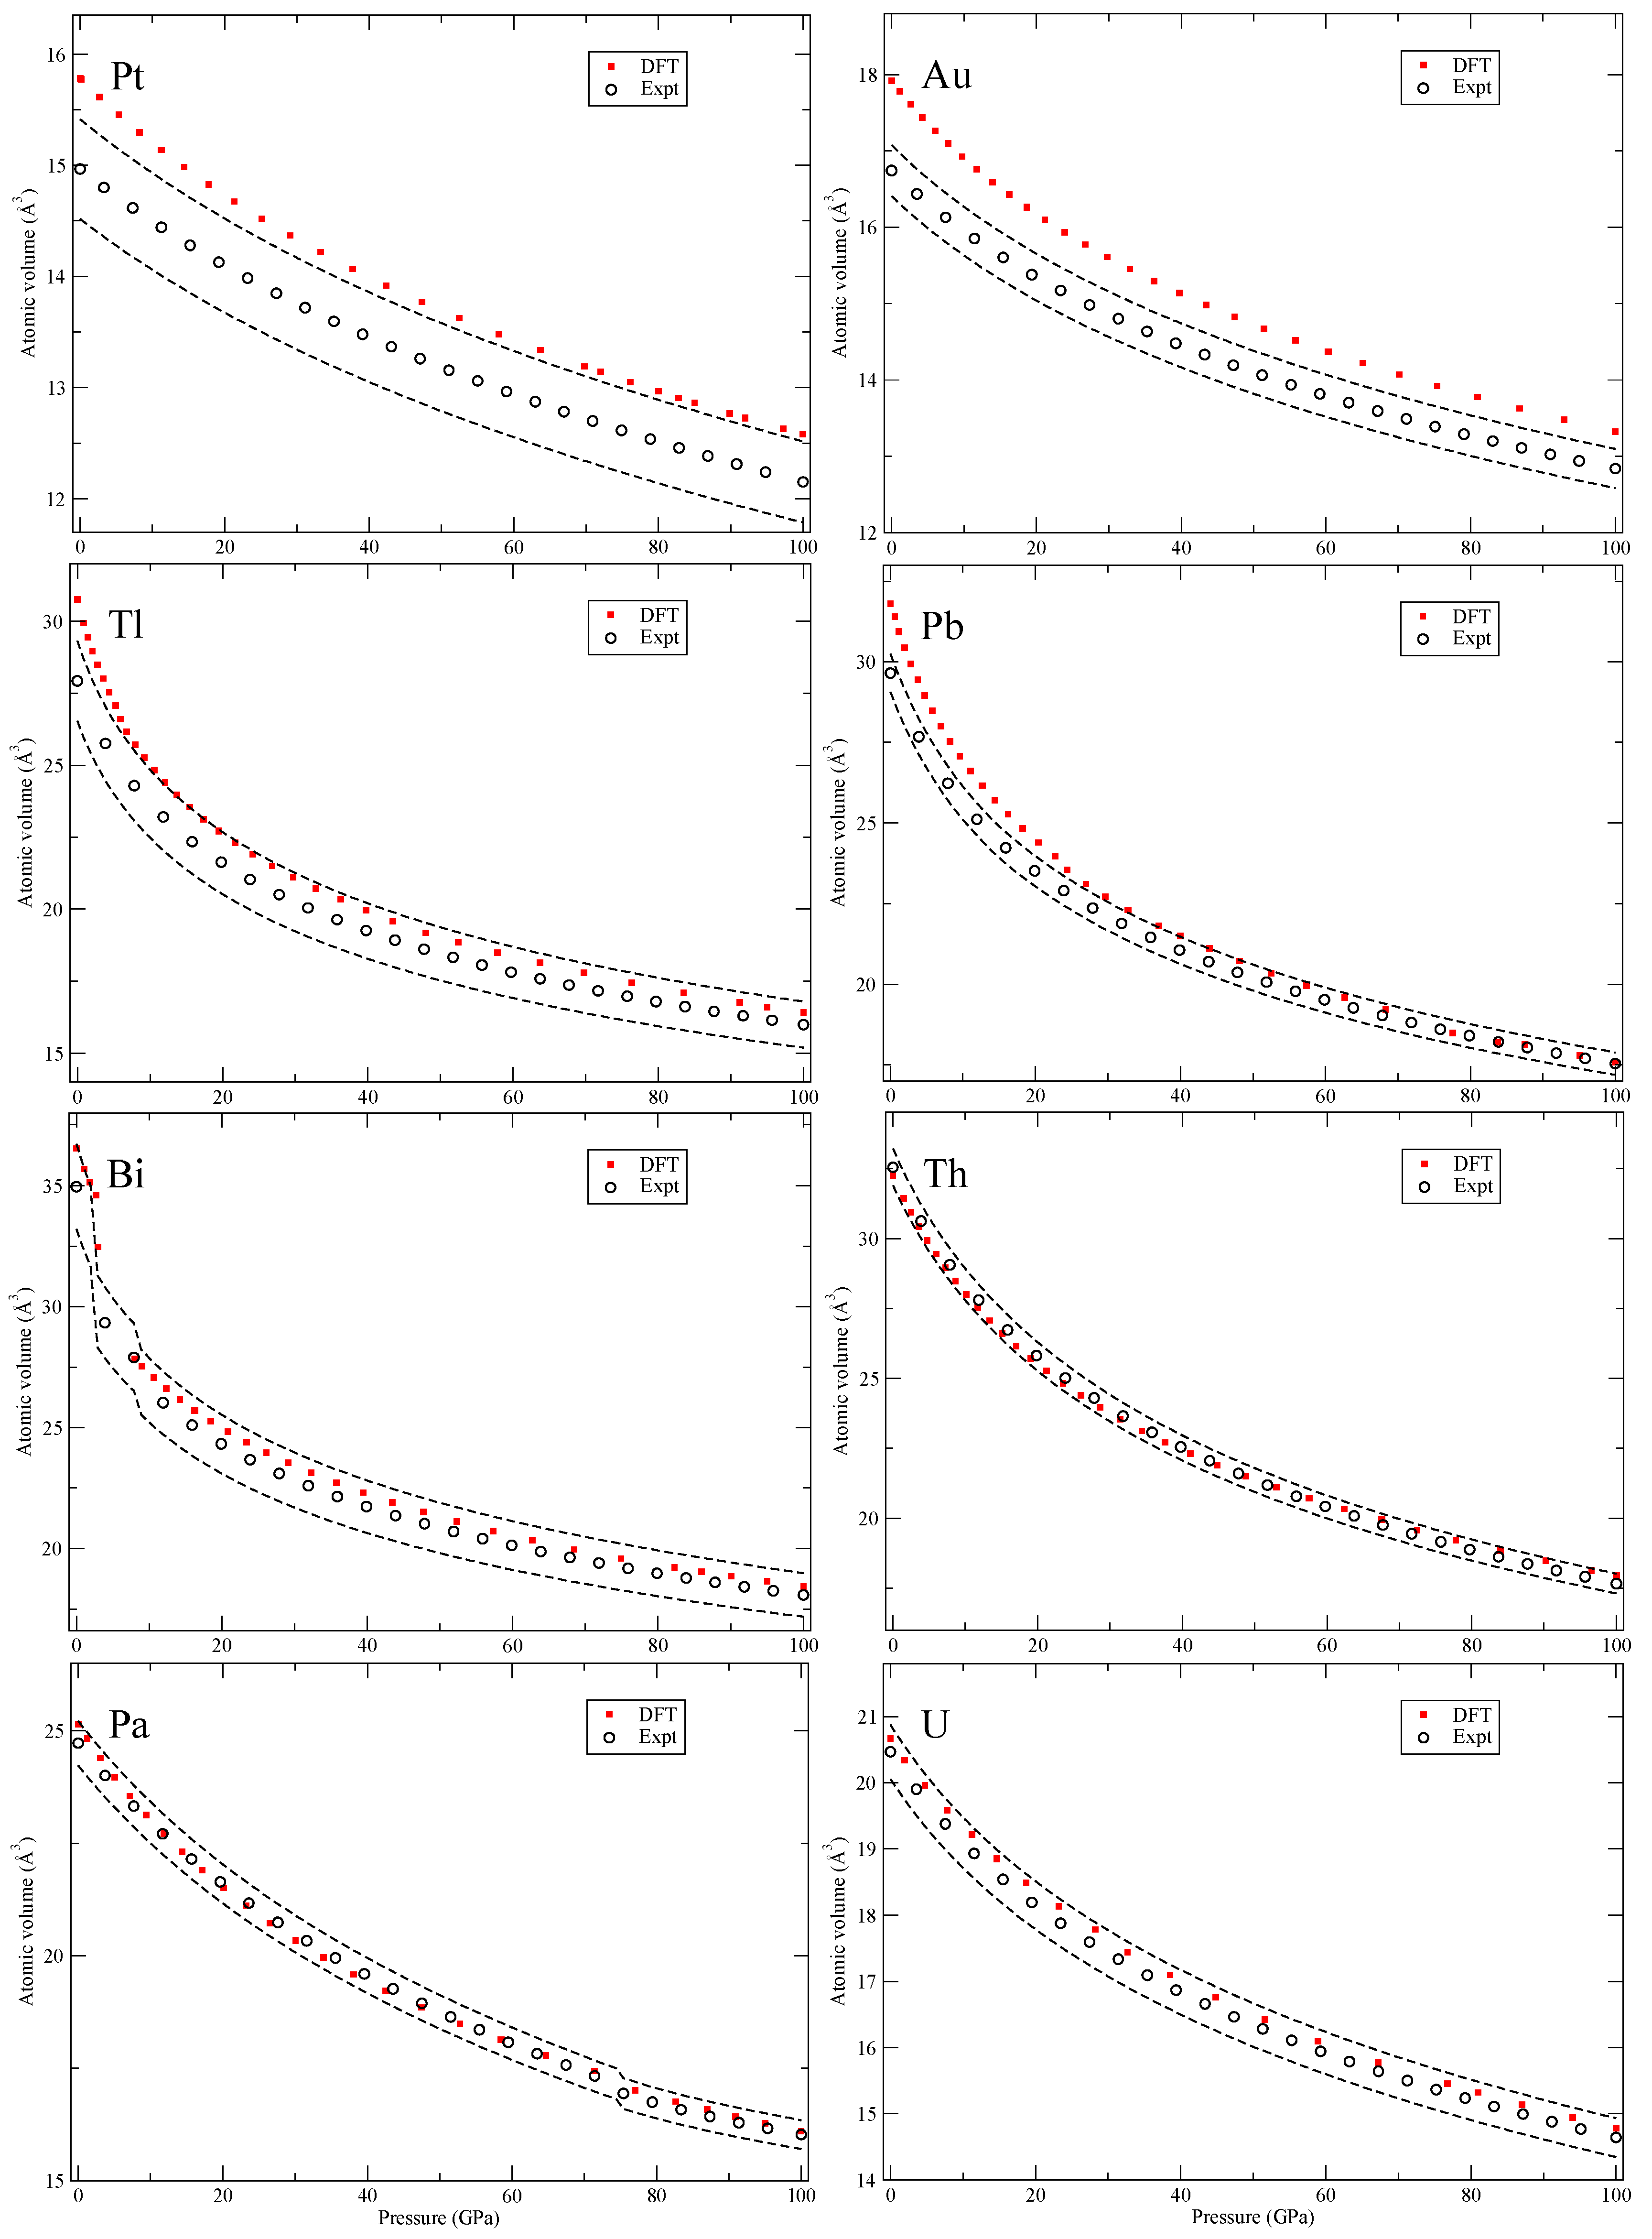
Our calculated zero-Kelvin isotherms are illustrated (red squares marked “DFT”) in
Figure 2,
Figure 3,
Figure 4,
Figure 5,
Figure 6,
Figure 7,
Figure 8 and
Figure 9 together with the experimental data (black circles, marked “Expt”). We also add dashed black lines in these figures corresponding to the volume uncertainty of the experimental data as suggested by Young et al. [
8].
In
Figure 2 we show Li, the lightest solid of the study, that has several very large (many atoms) unit cells (up to 88 atoms). These large structures are not considered here but up to about ~60 GPa Li remains in cubic structures with the largest having 16 atoms per cell (cI16) that are included in the calculations. Silicon (Si) also has several phases and some associated with rather large volume changes and here we consider the diamond, β-Sn, simple and close-packed hexagonal (hcp) and face-centered cubic (fcc) phases but not the 16-atom orthorhombic phase that has been suggested [
14]. For potassium (K) neither the host-guest composite structures [
15] nor the 16-atom orthorhombic cell above 96 GPa are considered but the remaining reported structures are accounted for.
In
Figure 3, for scandium (Sc), we do not address the incommensurate composite structure [
16] but the hcp and the orthorhombic β-Np phase. The metals Cr-Ni are magnetic and the calculations are spin polarized with body-centered cubic (bcc) Cr and hcp Fe having anti-ferromagnetic structures. For anti-ferromagnetic bcc chromium, we use the CsCl cell and for hcp iron the suggested low-energy anti-ferromagnetic configuration [
17].
In
Figure 4, for arsenic (As), we do not consider the complex host-guest structure and therefore do not present theory for the range where this phase is observed. For rubidium and strontium (Rb and Sr), we only calculate the bcc and fcc phases. Other proposed structures are either unknown or are very large with many atoms that we do not consider here. In the case of yttrium (Y), we include double hcp (dhcp), hcp and a 6-atom hexagonal structure (P6
222) [
18] but not the 24-atom distorted fcc (dfcc) or the suggested monoclinic (C2/m) phase [
19]. The 24-atom dfcc has very similar pressure dependence as the hcp phase and the C2/m is excluded due to its high DFT total energy (the P6
222 phase has considerably lower energy).
All solids in
Figure 5 have high-symmetry crystal structures with no phase transitions and in
Figure 6, for tin (Sn), there is a body-centered orthorhombic phase that is stable in a narrow pressure interval that we do not consider in our calculations. However, this phase shows a pressure dependence very close to both the body-centered tetragonal (bct) and the bcc phases that we do compute. Next, for antimony (Sb), the second phase (Sb-II) is complex and not fully characterized [
20] and left out from our theory. For cesium (Cs), we do not consider the large 16-atom orthorhombic phase (Cs-V) that is recognized close to 50 GPa [
21]. The element barium (Ba) has an interesting re-entrant hcp phase (II and V) but also very complex host-guest structures in between that are not computed here. Cerium (Ce) and praseodymium (Pr) are the first two elements with an appreciable amount of 4
f electrons. It is well-known that electron correlation effects effectively localize these electrons in the rare-earth series and that conventional DFT is struggling to deal with it [
22]. Here we consider all phases that occur in the rare-earths,
Figure 6 and
Figure 7, except for the 24-atom dfcc and the 9-atom hexagonal α-Sm phase that exist in some of them. We also chose to ignore the debated phase that occurs in a narrow pressure range in cerium (orthorhombic or monoclinic) and only here consider fcc and face-centered tetragonal (fct). Finally, for the rare-earths, lutetium (Lu) has a high-pressure phase just below 100 GPa that we disregard.
The 5
d transition metals (Hf-Au) and lead (Pb) in
Figure 8 and
Figure 9 have simple structures but Bi shows a complex scenario similar to Sb. The third phase, Bi-III, has a host-guest composite structure [
20] that we do not attempt to compute. Lastly, in
Figure 9, we show results for the early actinide metals thorium (Th), protactinium (Pa) and uranium (U). DFT is quite accurately reproducing the zero-temperature isotherms because the PW91 is a good approximation for actinide metals [
13] and there is certainly no need to go beyond DFT. Actually, the measured second phase of Pa (Pa-II) [
23] was predicted by DFT calculations [
3] many years before it was confirmed experimentally. This successful prediction strongly supports its relevance for the actinide metals and equation-of-state.
4. Summary and Conclusions
Our goal is to analyze the accuracy and validity of the commonly used density-functional theory for predicting the volume-pressure relationship, often referred to as the equation-of-state, for materials. To achieve this goal, we need to have (i) very good experimental data to compare with; (ii) unbiased, robust, accurate and carefully executed DFT electronic-structure calculations; and (iii) a large set of materials to explore so that general conclusions can be made. The present report reflects research that fulfills these three criteria. In regard to (i) we have access to a recent and thorough compilation of experimental zero-Kelvin isotherms [
8] that has been further corrected here by removal of the zero-point pressure. Focusing on criterion (ii), we are utilizing an all-electron, well-documented and -regarded [
9,
10] electronic-structure code, executed without bias for any particular material and applying the commonly-used generalized gradient approximation for the electron exchange and correlation interactions. Thirdly, addressing (iii), we are studying a large group of 64 elemental solids. The elements range from very soft cesium with V
0 ~ 110 Å
3 and B
0 ~ 2 GPa to very stiff osmium with V
0 ~ 14 Å
3 and B
0 ~ 400 GPa, or others with few (lithium; 3) or many (uranium; 92) electrons. We also include in this broad population the series of rare-earth metals (La-Lu) that have localized 4
f electrons that are troublesome to describe within a DFT approach [
22,
24].
The conclusions of analyzing the DFT EOS for these 64 elements can be summarized in two points. First, the DFT results indicate that rarely are the calculations outside of the experimental volume uncertainties assumed in Ref. [
8]. However, there is a systematic overestimation of the atomic volumes in the later part of the 4
d and 5
d transition metals, an acknowledged signature of the PW91 [
5], that brings the DFT results slightly above the relatively tight (2–3%) experimental uncertainties. The second conclusion is very general and quite powerful, namely, the DFT error (at least in the present PW91 formulation) is always
equal or smaller at higher pressures (100 GPa) than it is at very low pressures. Differences in DFT errors much less than 1% are regarded as insignificant and therefore such errors are defined as “equal,” because the experimental uncertainties are far greater (more than 2% for all studied solids). Consequently, it is possible to specify a DFT error at higher pressures (~100 GPa) that is bounded by the error at lower pressures (~0 GPa). This result is very useful because it helps to
bound the calculated error at high compressions where experimental data may be unavailable (assuming that the correct phase is found).
Apparently, DFT (here in the PW91 formulation) is performing as good or better under pressure and one can speculate why this is the case. One reason could be that the only approximation to the DFT—the electron exchange and correlation functional (PW91 in this report)—becomes less important and therefore its inherent error less meaningful under compression. An alternative possibility is that the electronic structure is changing under pressure so that the electron exchange and correlation functional becomes more accurate. The former scenario is easily investigated by isolating the contributions to the pressure from the electron exchange and correlations and compare their importance relative to other contributions such as electrostatic repulsion or kinetic energy. We have done that for several examples (not shown) and we find that the PW91 contributions to the pressure remain very relevant even at high compression. We therefore conclude that the PW91 itself must improve with applied pressure. Finally, it is worthwhile to expand the present study to also include other popular functionals to investigate if our conclusions are general for DFT beyond that of the PW91 assumption.
