Article

Modeling Thermal Energy Storage Capability of Organic PCMs Confined in a 2-D Cavity

by
Abdullatif A. Gari
Mechanical Engineering Department, King Abdulaziz University, Jeddah 21589, Saudi Arabia
Computation 2025, 13(9), 209; https://doi.org/10.3390/computation13090209
Submission received: 5 July 2025 / Revised: 7 August 2025 / Accepted: 15 August 2025 / Published: 1 September 2025
(This article belongs to the Special Issue Computational Methods for Energy Storage)

Abstract

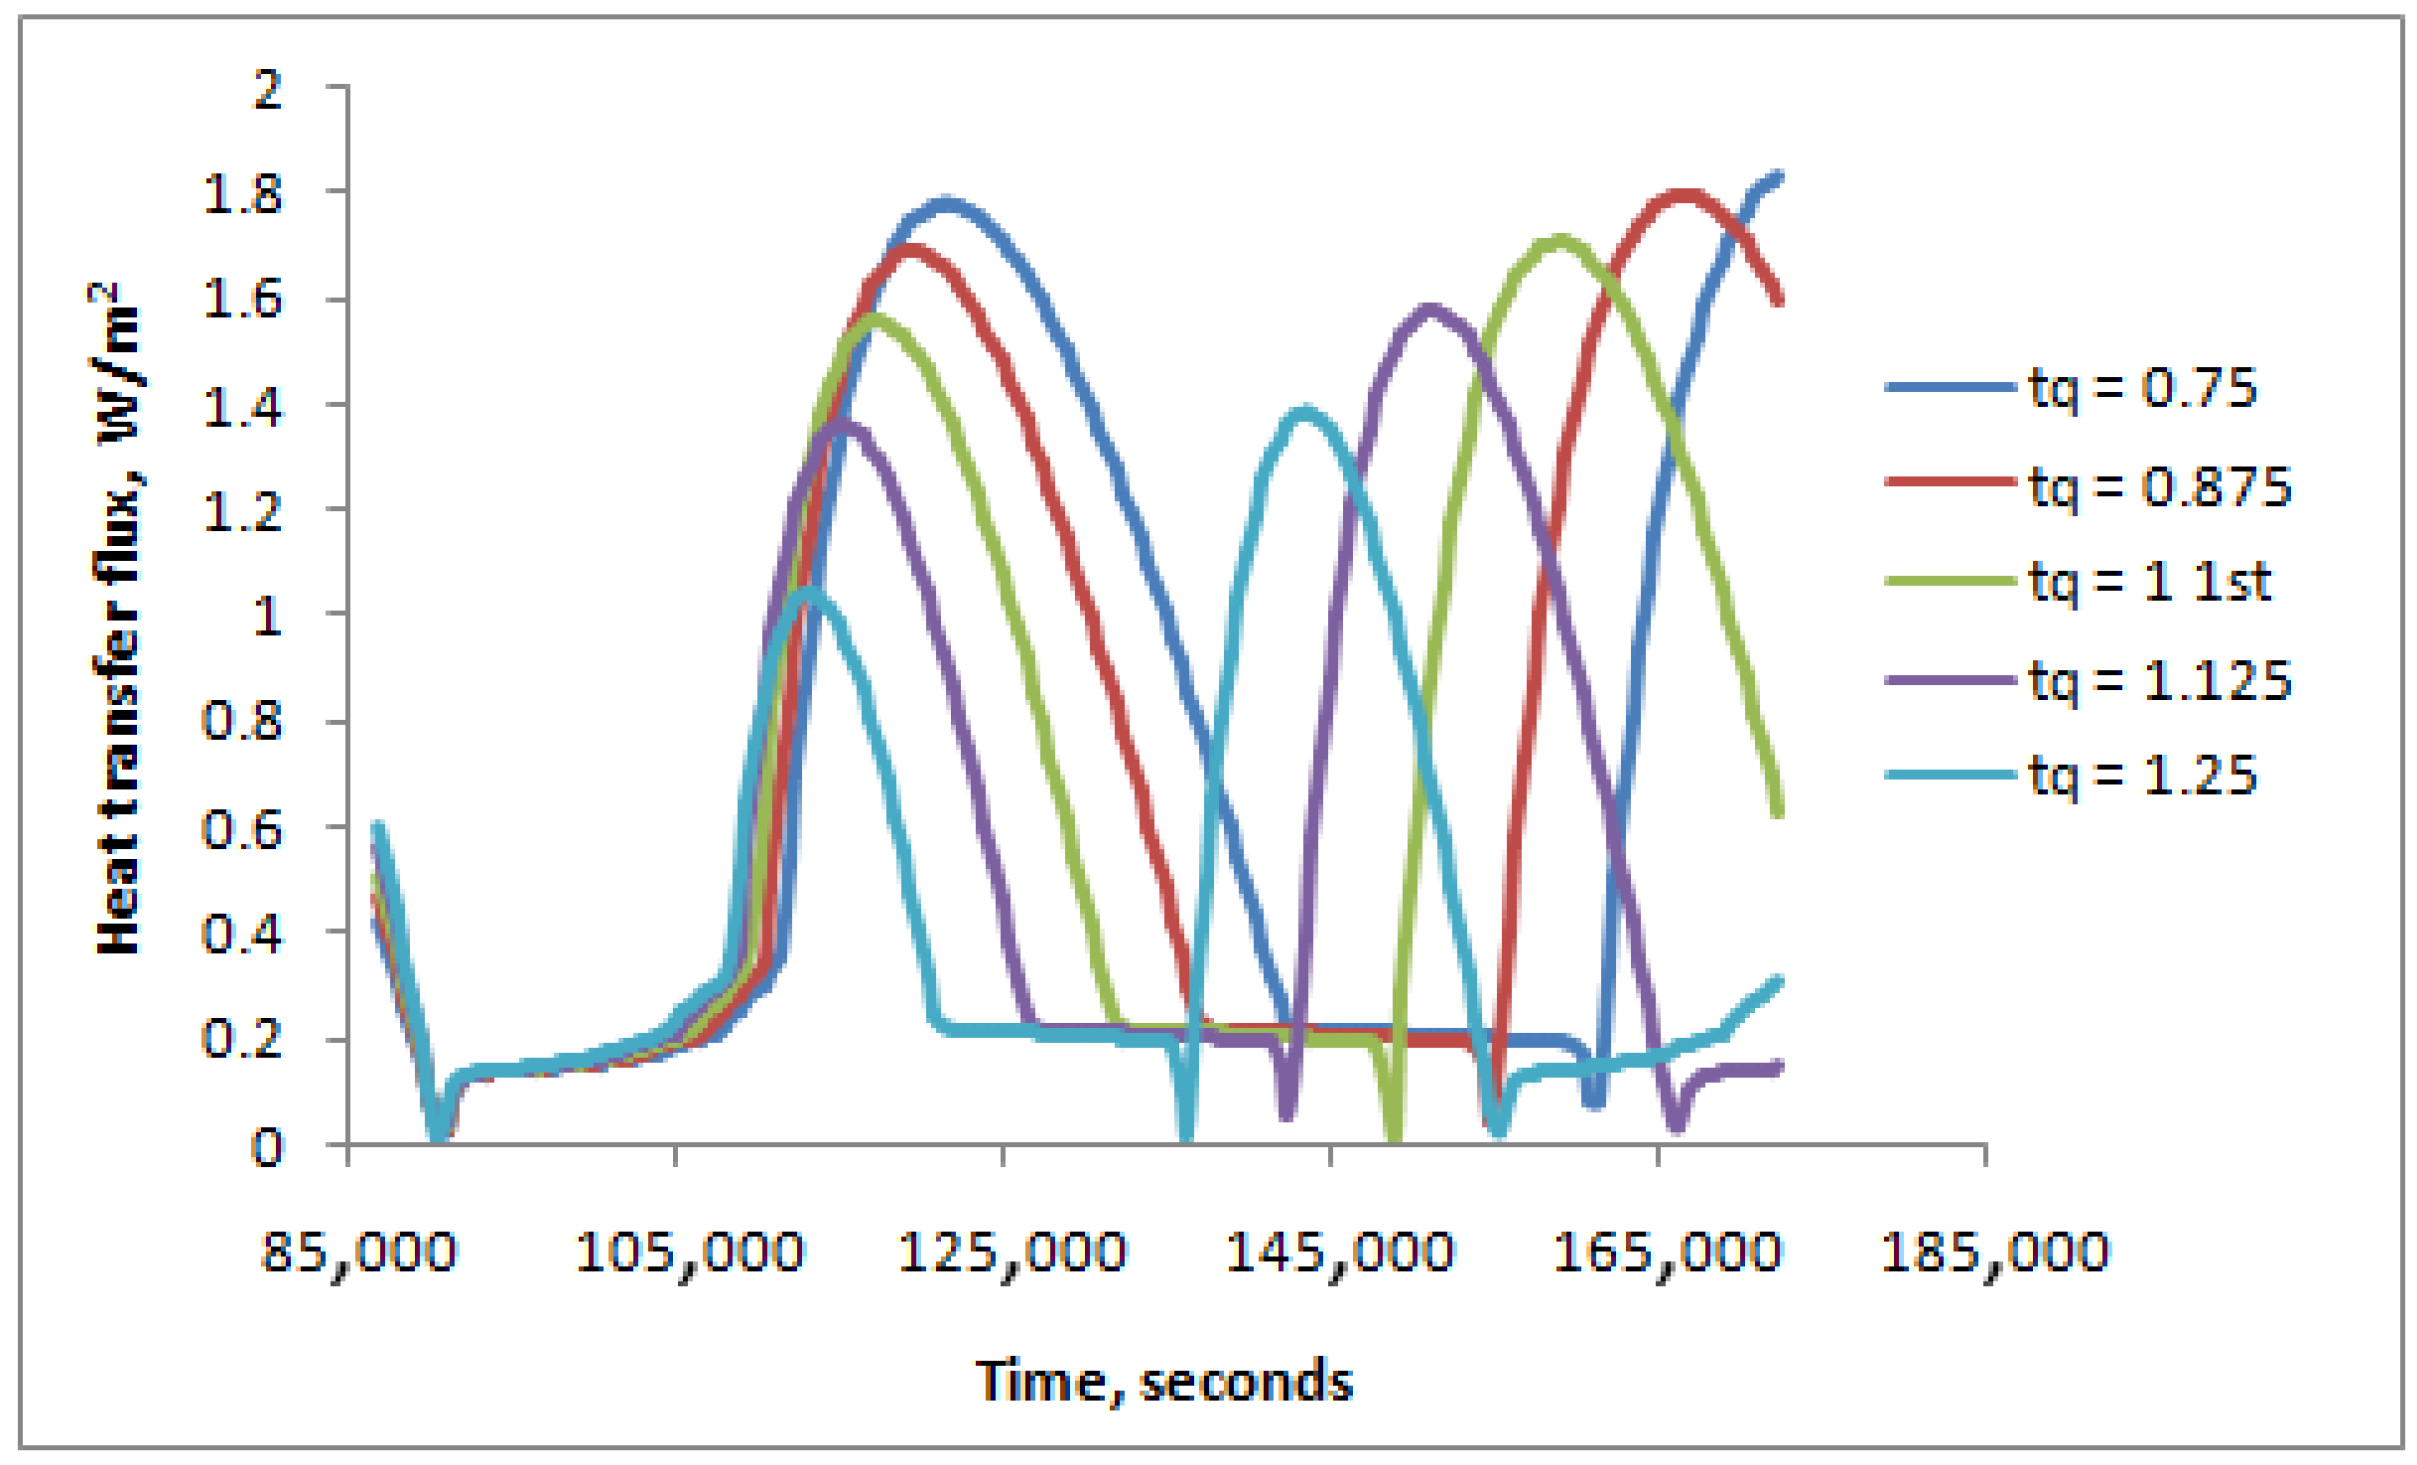
Organic phase change materials (PCMs) are a useful and increasingly popular choice for thermal energy storage applications such as solar energy and building envelope thermal barriers. Buildings located in high-temperature locations are exposed to extreme weather with high solar radiation intensity. PCM envelopes could act as thermal barriers on the exterior walls to prevent excessive heat gain and save on air conditioning costs. The PCM cavity is represented as a square cavity in this project. This project studies the effect of different parameters on energy transfer through the cavity. These parameters are PCM, heat flux gain (solar radiation), and time period (day hours). One parameter was changed at a time while others remained the same. This model was simulated numerically using ANSYS FLUENT software version 6.3.26. The project was solved as a transient problem and was run for a full day in simulation time. A pressure-based model was used because it is ideal for viscous flow and suitable for mildly compressible and low-speed flow. The PISO algorithm was used here because of the transient nature of the project. Temperature and convection heat transfer flux on the inner surface were recorded to study how the inner temperature and the amount of convective heat flux gain react to different conditions after energy passes the PCM envelope. It was found that Linoleic Acid provides the highest convective heat flux gain, meaning it provides the lowest thermal resistance. On the other hand, Tricosane was found to provide the lowest convective heat flux gain, meaning it provides the highest thermal resistance. For longer days (τq < 1), the PCM was in a liquid form for a longer time, which means less conduction, while for shorter days (τq > 1), the PCM was in a solid form for a longer time.

1. Introduction

Organic PCMs are a suitable medium for storing thermal energy. The types of phase change materials include simple alkene chains like Heneicosane, C21H44, and unsaturated fatty acids like Oleic Acid, C18H34O2. These materials have been proposed as viable energy storage mechanisms due to their large enthalpies of fusion and convenient temperatures associated with their solid–liquid phase transition [1,2].
The importance of thermal energy storage (TES) lies in the ability to balance energy supply and demand during heating and cooling periods. This is beneficial to energy savings as well as to the environment, as renewable energy sources could be utilized, reducing reliance on fossil fuels. Nowadays, many TES technologies are available commercially for water and air systems [3]. Some advantages of TES are efficiency increases, energy savings, and environmental friendliness [4]. Also, PCM is transportable and allows small volumes to store large amounts of energy, resulting in low-cost storage [5].
The types of PCMs include popular organic PCMs, which are most common for cooling systems because of their ability to store large amounts of energy. On the other hand, inorganic PCMs have better thermal conductivity compared to organic PCMs [6]. Several criteria govern the selection of the appropriate PCM type, such as the amount of heat of fusion, melting temperatures, solidification or melting temperature ranges, crystallization, and applications [7].
There are several applications for PCMs because of their ability to store solar energy during the day through melting and release the stored energy during the night [8,9,10,11,12,13,14]. Examples involve building envelope thermal barriers [15,16,17,18,19,20,21,22,23] and passive cooling of portable electronics [24,25,26]. Some researchers even used PCM in cooling down electronic circuits, photovoltaic (PV) systems, and thermal barriers [27,28,29,30,31,32].
Researchers have employed PCM technology in traditional building bricks to increase their thermal performance and reduce energy consumption. There are two different approaches to integrating PCMs in building bricks: direct and indirect methods. Examples of the direct method are mixing, immersing, and filling, while indirect method examples are macro-encapsulation, micro-encapsulation, and form stabilization. Mahdaoui et al. [33] studied hollow bricks to improve their thermal performance. They conducted a numerical analysis for 12 types of hollow bricks impregnated with PCMs. Their results showed better stabilization of the building’s inner wall temperature. Hawes et al. [34], on the other hand, stated that PCM impregnation with concrete could increase the walls’ thermal storage capacity up to 130%. On the other hand, many PCM types are unsuitable for impregnation with concrete. Therefore, they studied three different types of PCMs: butyl stearate, dodecanol, and polyethylene glycol 600. They found that all three were compatible with autoclaved concrete blocks. Memon [35] tested different methods to determine chemical compatibility and thermal properties of the PCM. He concluded that the integration of PCM in buildings requires a careful choice of a PCM type depending on applications and thermophysical properties. Zhu et al. [36] studied classifications and applications of shape-stabilized phase change materials (SSPCMs) used in building envelopes. He stated that about 60% of existing studies focus on walls. This is due to their large surface areas and significant effects on reducing energy loads on buildings.
Benyahia et al. [37] numerically studied the thermal efficiency in latent heat thermal energy storage systems (LHTESSs). He considered paraffin wax with copper (Cu) nanoparticles in a trapezoidal cavity shape with an irrigated heat source surface at the bottom. He used four different shape configurations, which resulted in reduced melting times by 10.71–15.12% depending on the shape of the cavity. He used paraffin wax, which has been abundantly researched. His project contained a heat source at the bottom of the cavity, and his focus was to reduce the melting time. In our project, we wanted to calculate the inner wall convection heat flux and compare the heat flux gains and losses during a full day.
Shaban et al. [38] focused on enhancing the charging rate for lauric acid PCM in a rectangular cavity. He used two symmetrical and asymmetrical horizontal partial fins. He found that the melting rate was better for the asymmetric configurations. He also optimized the fins’ positions to improve heat transfer performance. He validated his numerical work with existing experimental work in the literature and an experimental setup he constructed. He concluded that the asymmetrical arrangement showed a higher charging rate by 74.3% on average compared to the symmetrical arrangement. In his work, he used lauric acid as a PCM. Lauric acid has several disadvantages, such as leakage issues and potential flammability [39,40,41]. This limits its direct application in building energy conservation.
Jalghaf H. K. and Kovacs E. [42] have numerically studied temperature change over time for a PCM in a confined layer placed on an exterior wall. This layer prevents heat gain into a building to reduce energy consumption and thus reduce cooling costs. Their numerical model was validated with an existing analytical mathematical model. They studied four different wall configurations composed of brick, concrete, and a PCM layer, as well as different boundary conditions. Their objective was to reduce heating load on the building. They utilized and compared two types of paraffin wax PCMs. Their work showed that minimizing heat load in buildings results in energy-efficient building designs in construction practices.
Although phase change materials have a high enthalpy of fusion, they have relatively low thermal conductivity. Paraffin can have a thermal conductivity as low as 0.2 W/m K [43], which is 3–4 orders of magnitude smaller than common metals. This low thermal conductivity can influence the performance of phase change material applications since heat becomes localized within certain parts of the PCM.
The effectiveness of phase change materials is largely dependent upon their thermal penetration [1]. The thermal penetration of a material can be quantified by the thermal diffusivity α t h , which is expressed as a function of thermal conductivity k , mass density ρ , and mass-based specific heat C p , as shown in Equation (1):
α t h = k ρ C p
Even though there has been plenty of research conducted on PCMs and their different applications, more studies are needed for further exploration. Research on building thermal barriers exposed to solar energy applications is still under consideration for further development and improvement. There is a need to study many parameters and their effect on the performance of the PCM building envelope.
This project studies PCM in a 2-D square enclosure exposed to solar heat flux on one side and convection heat transfer on the other side. The value and time exposure of the solar heat flux on one side represents the exposure to solar energy over a full 24 h including daytime and nighttime. The effects of three parameters were studied: PCM, solar heat flux gain from the left side, and daytime time period τq. Heat flux and average temperature on the right-side wall were plotted and examined.

2. Mathematical Model

The mathematical model used is a 2-dimensional quadratic enclosure confined space with a thin wall filled with Heneicosane PCM, as shown in Figure 1. This is a transient problem that studies the melting and solidification of the PCM throughout a whole day of operation. The enclosure is exposed to heat flux gain from the left side, which represents sunlight, while it radiates energy outward during nighttime. This sinusoidal behavior is expressed in Equation (2), which considers variable daytime length. The model is exposed to convection heat transfer on the inner wall (right side) with a temperature of T = 308 K and a heat transfer coefficient of ho = 5 W/(m2·K). Top and bottom boundaries are insulated. The wall thickness is not included in our study as the wall conditions considered are on the inner surface of the cavity. The heat flux gain from the left side is expressed in such a way as to consider variable heat flux during an entire day. Equation (2) is used to express the variable heat flux sinusoidal behavior on the left side during an entire day. The value depends on constant heat flux gain qo = 200 W/m2 and time period τq = 86,400 s−1.
q = q o * sin π * t 3600 * h i f   t < 3600 * h q = q o * sin π * t 3600 * h 86400 3600 * h i f   t > 3600 * h
Here, qo = 200 W/m2 and h = daytime hours.
Dimensions of the enclosure are taken as 8.89 cm in width and 6.35 cm in height. This is carried out to match the experimental setup by Gau and Viskanta [44]. Heneicosane properties are given in Table 1 by O’Connor [45]. To account for buoyancy in the PCM, the density is calculated according to the Boussinesq model. This means that the density is constant in all equations except for the buoyancy term. This approximation is best for small changes in density. The body force in the y-direction momentum equation is replaced by the term g ρ β T T m , as shown in Equation (5). ANSYS FLUENT version 6.3.26 defines a mushy zone between solid and liquid phases. It uses liquid fraction to define its properties. Liquid fractions are defined as the percentage of the liquid phase present in the mushy zone. Liquid fraction is solved in the continuity equations to track the interface between the 2 phases at each iteration. Properties in the mushy zone are calculated as a percentage between the values of the liquid and solid phases. All properties are calculated in this way except for density.
ANSYS FLUENT was used to model the parameters described above and solve for the temperature profile and wall heat fluxes. The only solver that can be used for the solidification/melting model is the pressure-based solver, and the multi-phase model used is the volume of fluid (VOF) method. It uses a first-order implicit time discretization scheme. ANSYS Fluent uses an enthalpy porosity formulation and treats the mushy zone between liquid and solid phases as a porous zone. In the porous zone, properties are defined according to the liquid fractions in each cell. This is carried out at each iteration based on the enthalpy balance. Enthalpy is calculated by adding sensible enthalpy and latent heat. Liquid fractions are calculated depending on the local temperature as (T − Ts)/(Tl − Ts). The temperature profile can be found by iterating between the energy equation and the liquid fraction equations. This is carried out at each time step. Governing Equations (3)–(6) were solved by a pressure-based solver setting implicit formulation using the PISO algorithm for the pressure–velocity coupling scheme, PRESTO as the discretization method for pressure, and a second-order upwind discretization for both momentum and energy evaluations [46].
u x + v y = 0
ρ u u x + v u y = P x + μ 2 u x 2 + 2 u y 2
ρ u v x + v v y = P y + μ 2 v x 2 + 2 v y 2 g ρ β T T m
2 T x 2 + 2 T y 2 = 0

3. Solution Methodology

3.1. Grid Test

The grid test was carried out for a two-dimensional model. Three different grid systems were tested for accuracy (Figure 2). Each time, the edge intervals of the grid were doubled. The three grid systems had 50 × 50 cells, 100 × 100 cells, and 200 × 200 cells. The case was run for 17,280 time steps, with 5 s considered for each time step. This is equivalent to one full day. A second day was run as well to avoid initial condition effects. The average surface temperature on the right side was monitored and printed at each time step. This parameter was taken as a measure of grid independence.
Errors were calculated by comparing the results of each grid system to those of the 200 × 200 grid system. Table 2 shows the resulting errors for the first and second days. Cell independence was assumed to be accomplished when the temperature errors were less than 0.25%. It was decided to consider the 100 × 100 cell grid model. We can subsequently select the appropriate time step.

3.2. Time Step Selection

A time step test was carried out using a 100 × 100 grid system chosen from the grid test. Three different time steps were used: 10 s, 5 s, and 3 s. The average surface temperature on the right side was monitored. This parameter was taken as a measure of time step independence. The case was run for several time steps, which were equivalent to one full day, as carried out in the grid test. A second day was run as well to avoid initial condition effects. The results were printed every 30 s so that comparisons could be made at the same time of the day. Two parameters were printed and calculated: right-side average surface temperature and efficiency. Table 3 shows the resulting errors. Errors were calculated by comparing the results to those of the 3 s time step. Time step independence was assumed to be accomplished when the temperature errors were less than 0.1%. It was decided to consider a time step of 5 s for this study.

3.3. Initial Condition Effect

Since we know the grid system and the time step needed for this case, we now want to eliminate the effect of the initial condition by running the case for several days. This is carried out to know when we will have similar results for each day. This was conducted on a model with a geometry of 1 cm × 1 cm. Later, all cases were carried out for 2 days only with dimensions of 8.89 cm × 6.35 cm. The case was run with a 100 × 100 grid system and 5 s time step for 69,120 steps. This is equivalent to 4 days. The average surface temperature and heat transfer flux on the right side were monitored for efficiency and error calculation. The 3 parameters considered for error calculations are the right-side average surface temperature and the right-side heat transfer flux during one full day.
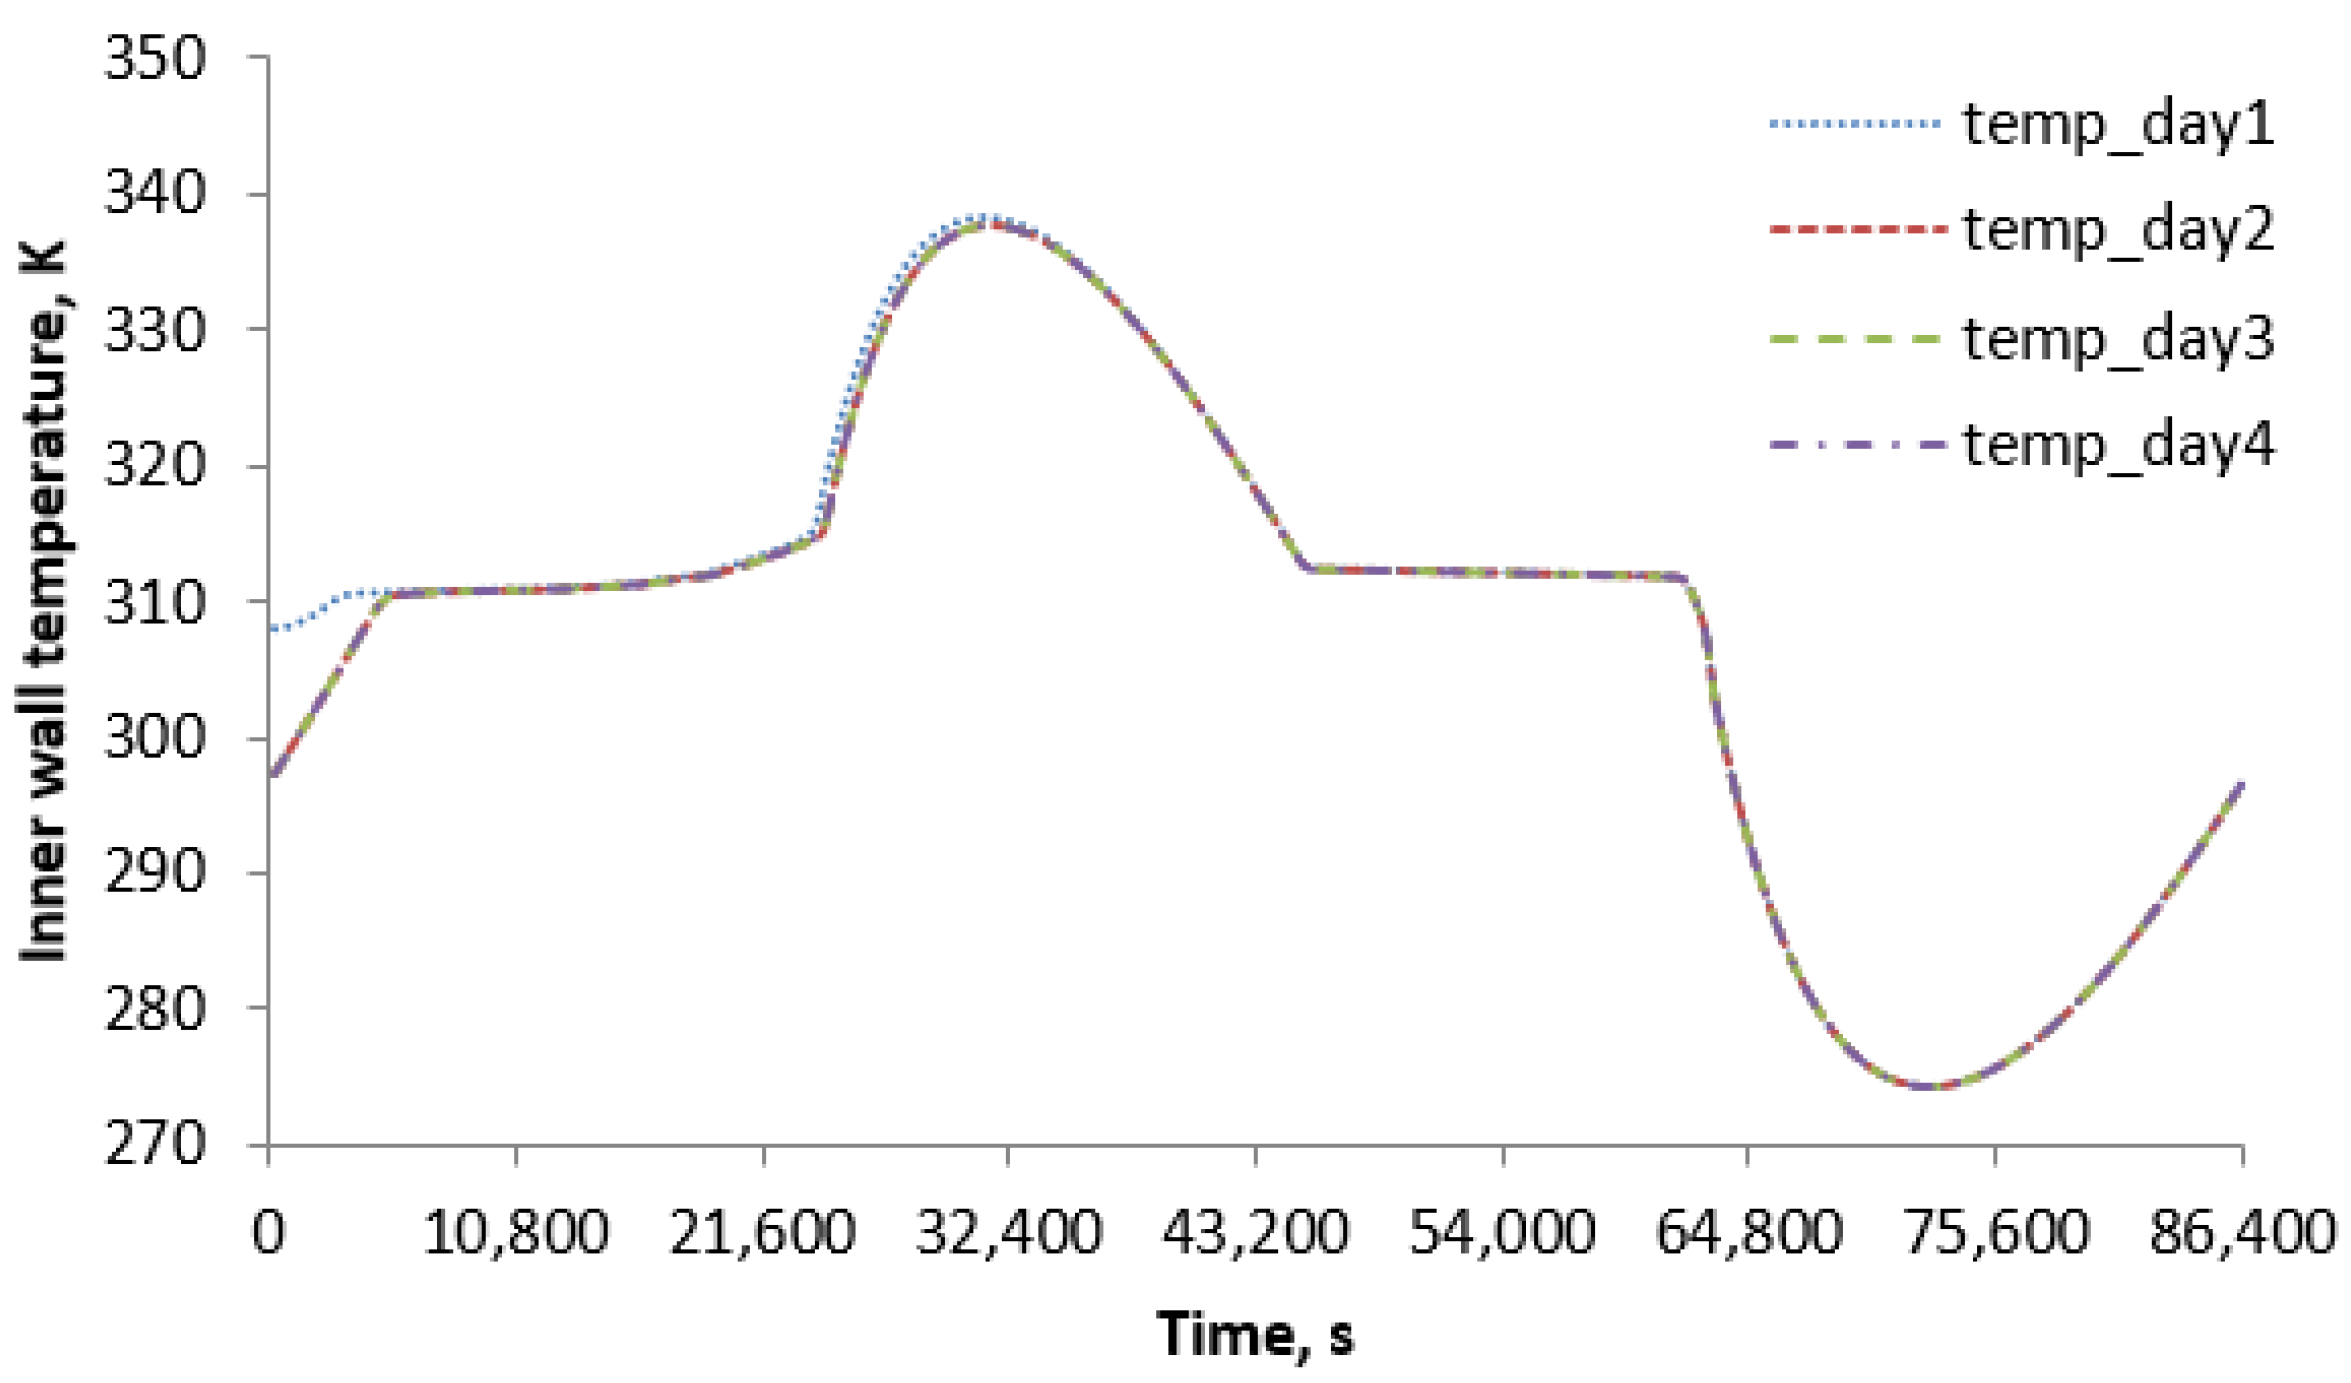
Figure 3 shows the right-side average surface temperature for 4 different days. Only the first day has a different initial condition from the other days. Errors were calculated by comparing the results to those of the fourth day. Table 4 shows the resulting errors. Time independence was assumed to be accomplished when the temperature errors were less than 0.5%. It was decided that the 2nd day is sufficient to eliminate the initial condition effect for this study.

3.4. Numerical Model Validation

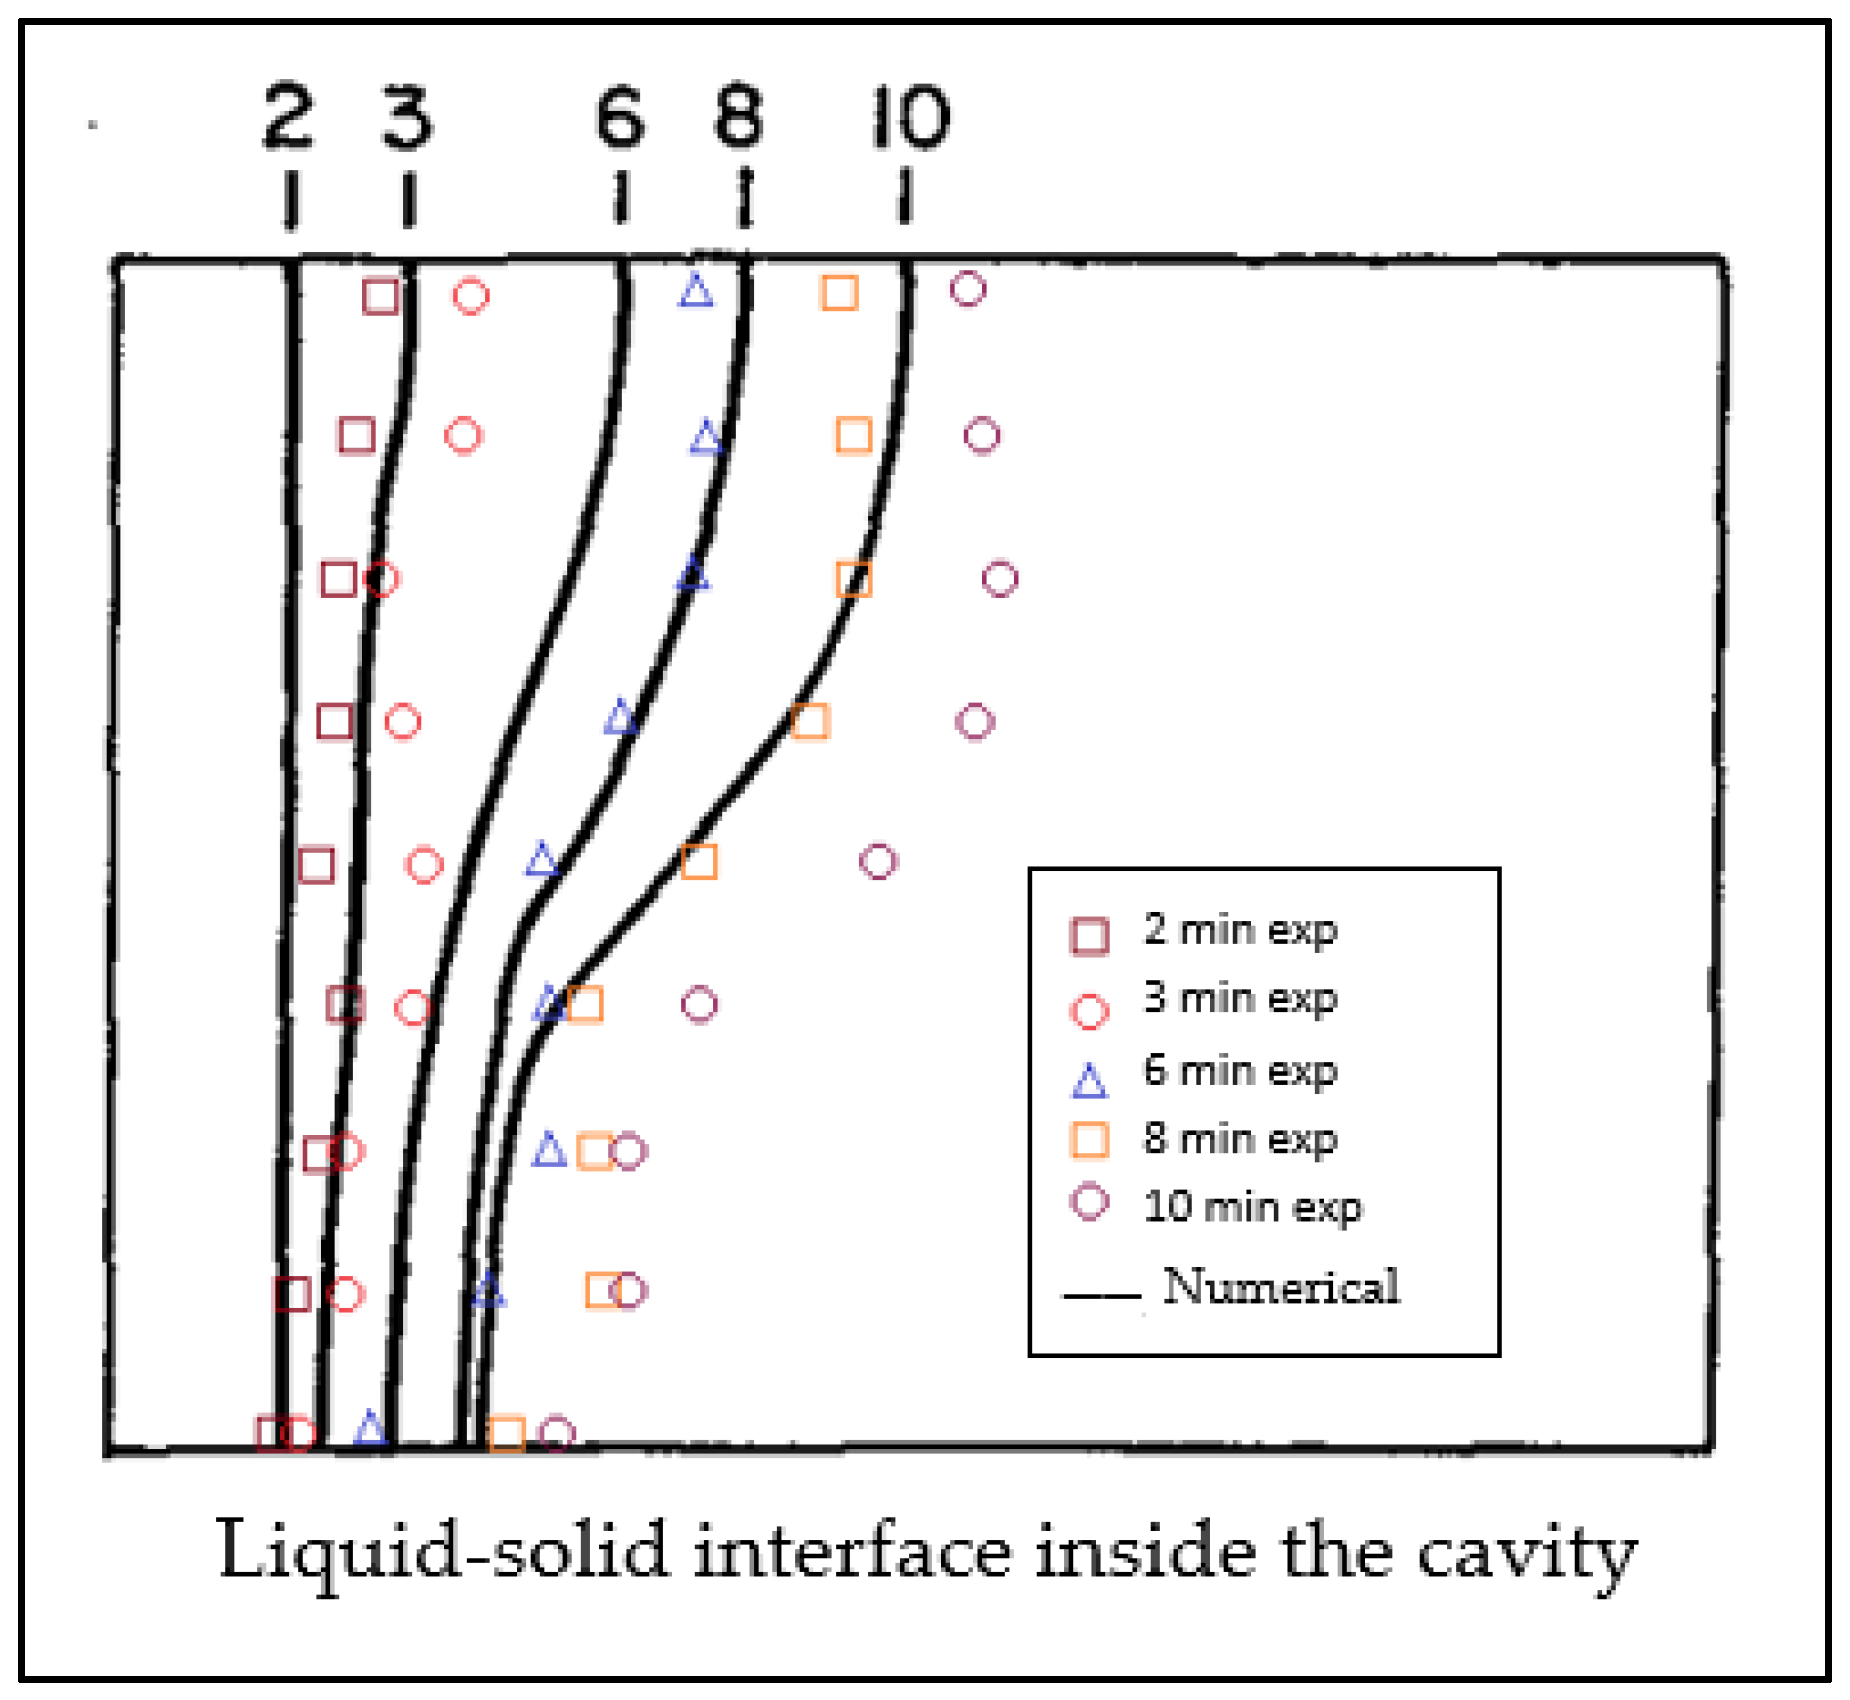
Our model has to subsequently be validated by comparison to existing experimental results from the literature. For example, Gau and Viskanta [44] studied the melting and solidification of pure metal experimentally on a vertical wall. They used a rectangular test cell that was 8.89 cm in height, 6.35 cm in width, and 3.81 cm in depth. The front and back walls were insulated with air gaps. The horizontal temperature distribution in the central region along the top wall, center line, and bottom wall was measured with 69 nested Ththermtheocouples. The PCM used was Gallium with 99.6% purity. Gallium is highly anisotropic. In our numerical model, we used a close-to-average constant thermal conductivity for Gallium. Table 5 shows the properties for Gallium that were used in our model [45]. The researchers used the pour-out method and the probing method to examine and measure the solid–liquid interface.
Figure 4 shows good agreement between our numerical work and the experimental work up to 10 min. The difference between the numerical and experimental work could be due to many reasons, one of which is the use of approximated isotropic thermal conductivity.

4. Results and Discussion

A parametric study is conducted to study the effect of several parameters on the inner convection heat flux transfer (right side) of the cavity. Three parameters were selected for this study: PCM, outer wall heat flux, and day-long time period τq. The original case had Heneicosane as the PCM, with qo = 200 W/m2 and time period τq = 86,400. One parameter was changed at a time while other parameters were kept the same. For example, when changing the outer wall heat flux, the material and time period of the original case (Heneicosane and τq = 86,400) are used. Five different PCMs were used: Heneicosane, Tricosane, Tetracosane, Oleic Acid, and Linoleic Acid. The constant term of the outer wall heat flux qo was changed from 200 to 400 W/m2. The time period τq was changed in such a way that the term (t/τq) in the sinusoidal equation was changed to be between 0.75 and 1.25.
We are interested in results on the inner wall (right side) of the model. Inner wall convection heat flux and temperatures were plotted along the second full day of the simulation. This is to avoid the initial condition effect and to study the daily periodic behavior. The inner wall convection heat flux has sinusoidal behavior due to the melting and solidification of the PCM. The PCM passes energy to the inner wall when its temperature is higher than T, while it gains energy from the inner wall when its temperature is less than T. We plotted both heat fluxes in absolute values to be able to compare the loss and gain of the inner wall convection heat flux.
We are also interested in calculating the total heat gain to the PCM during the melting period and the total heat release during the solidification period during a full day. The difference and the percentage between the two are recorded and calculated. The percentage difference is calculated as follows:
E m E s E s × 100
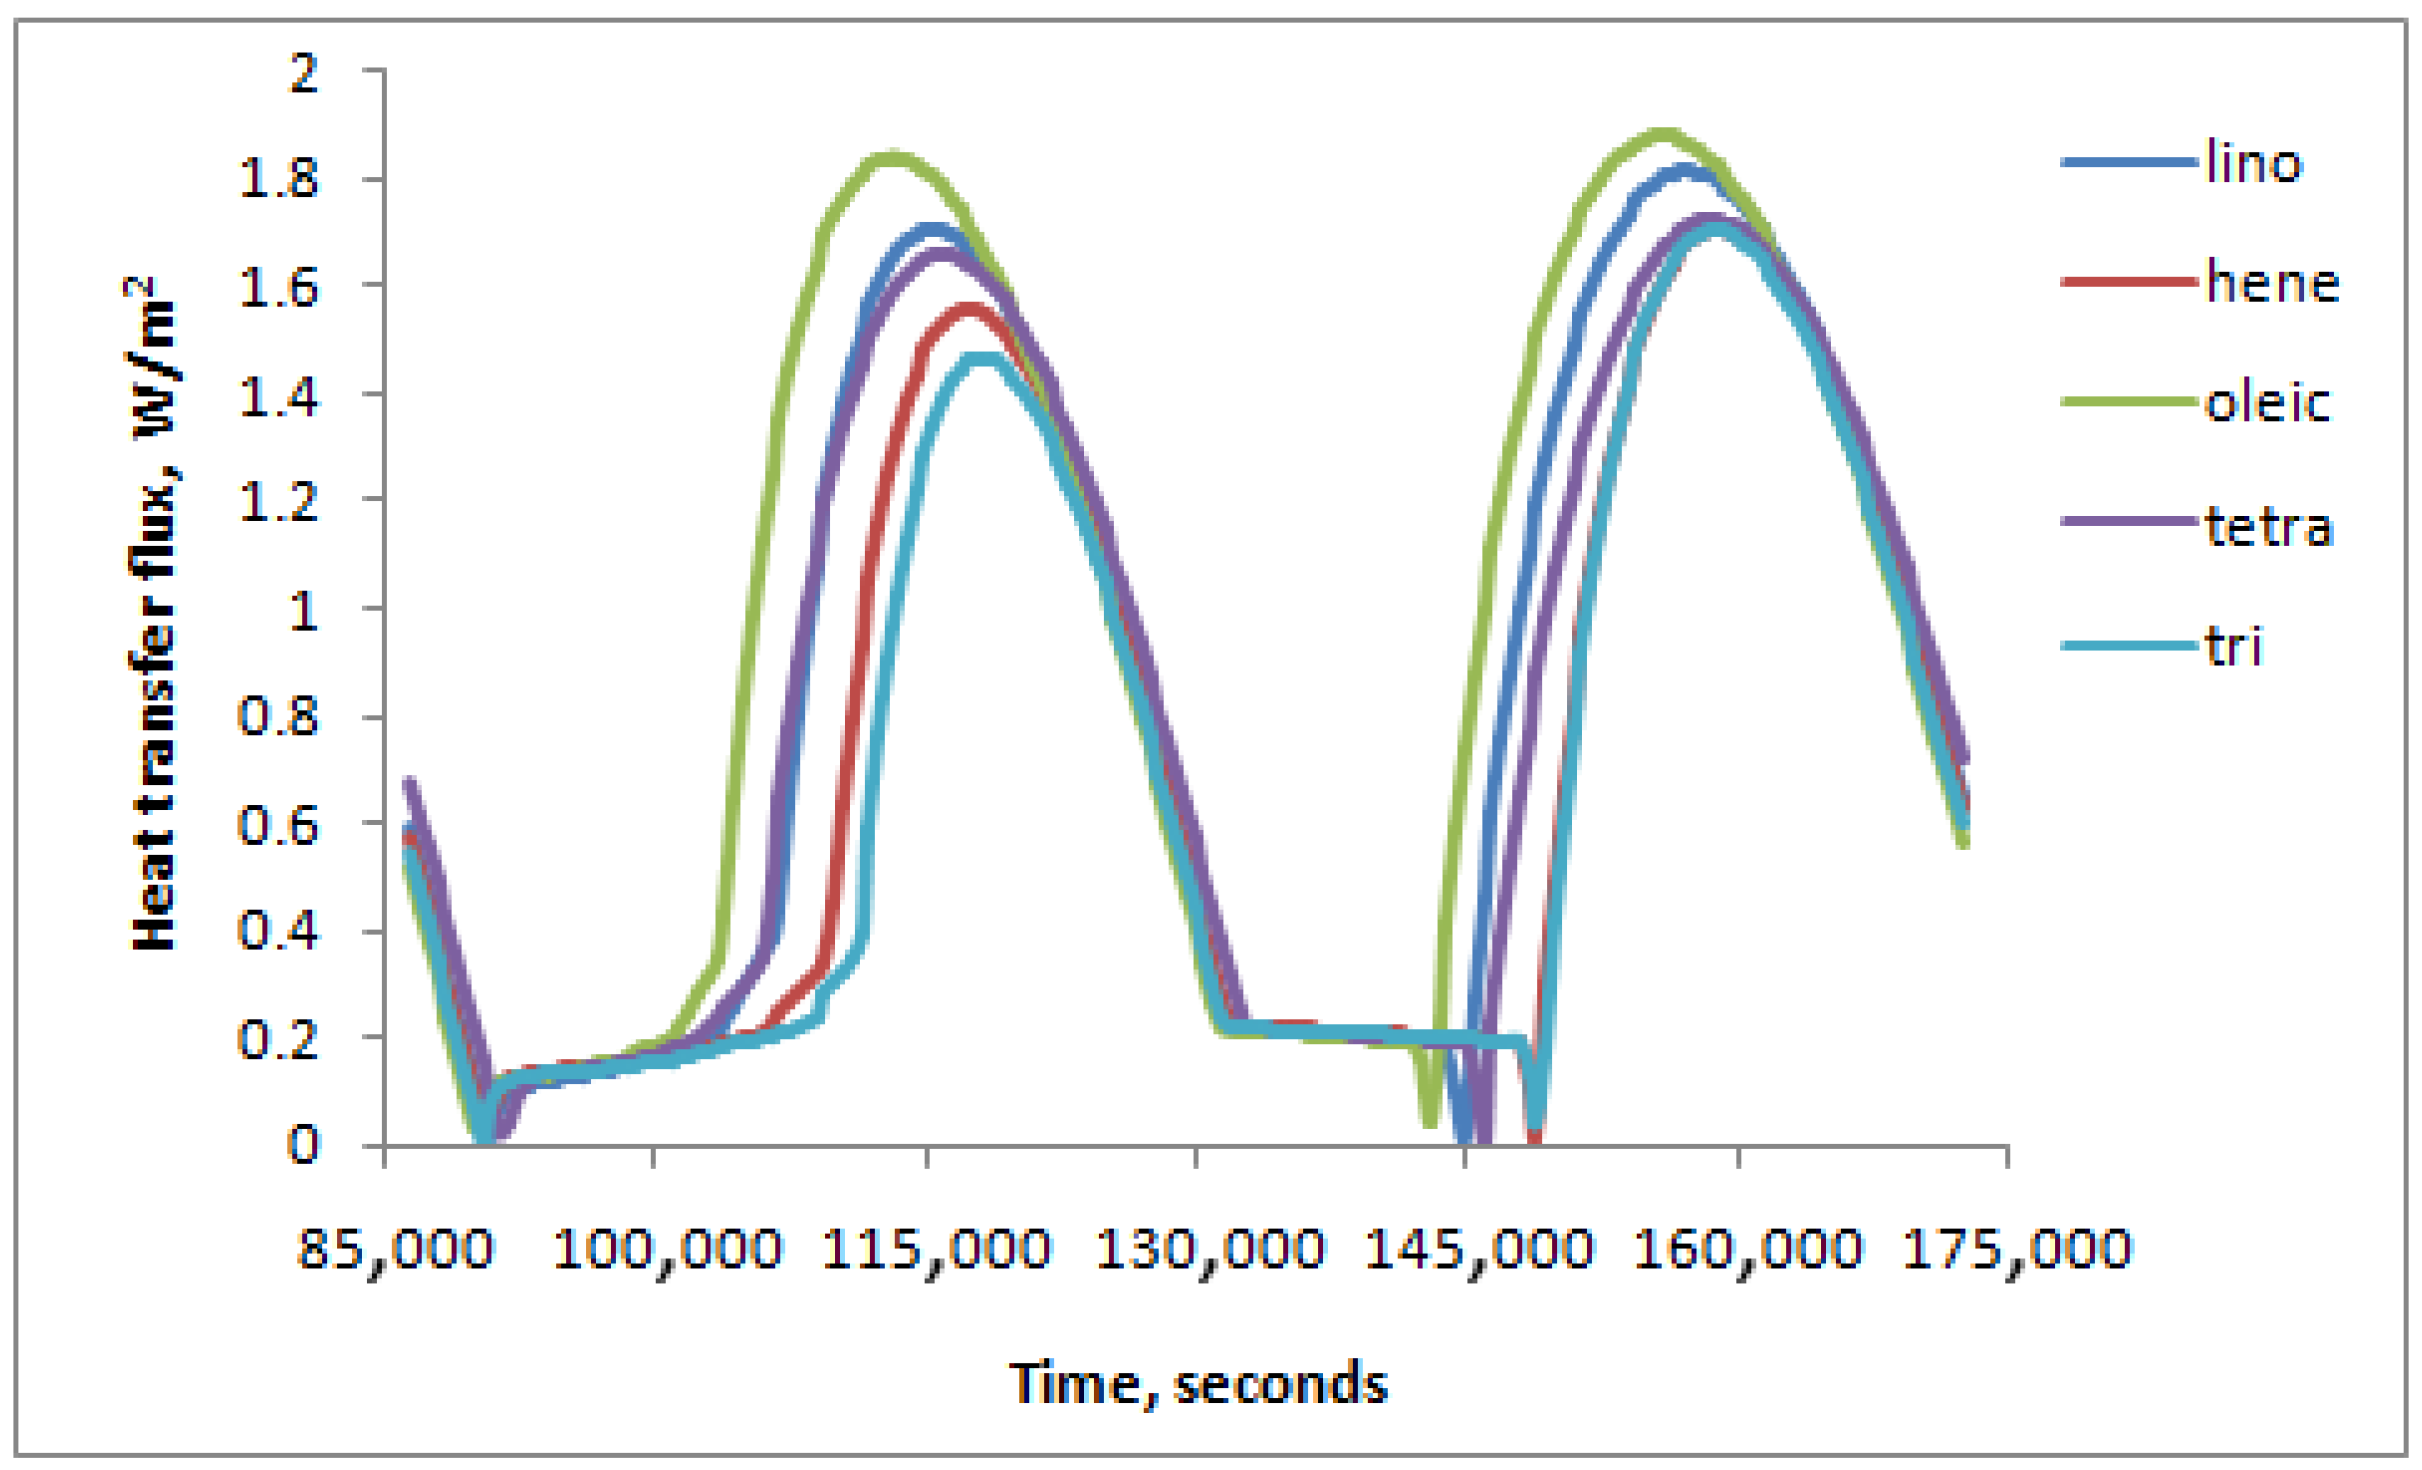
Figure 5 shows the right-side surface heat flux over a full day for different PCMs. It is obvious that Linoleic Acid provides the highest right-side surface heat flux while Tricosane provides the lowest. This could be explained by Linoleic Acid having the lowest melting temperature and the second-lowest heat diffusion ΔHf (in kJ/kg), while Tricosane has the second-highest melting temperature and the highest heat diffusion ΔHf (in kJ/kg). The heat transfer during the cooling period is taken as the absolute value. This is carried out to have correct efficiency calculations, and it is carried out for the right-side surface heat flux throughout the rest of this paper.
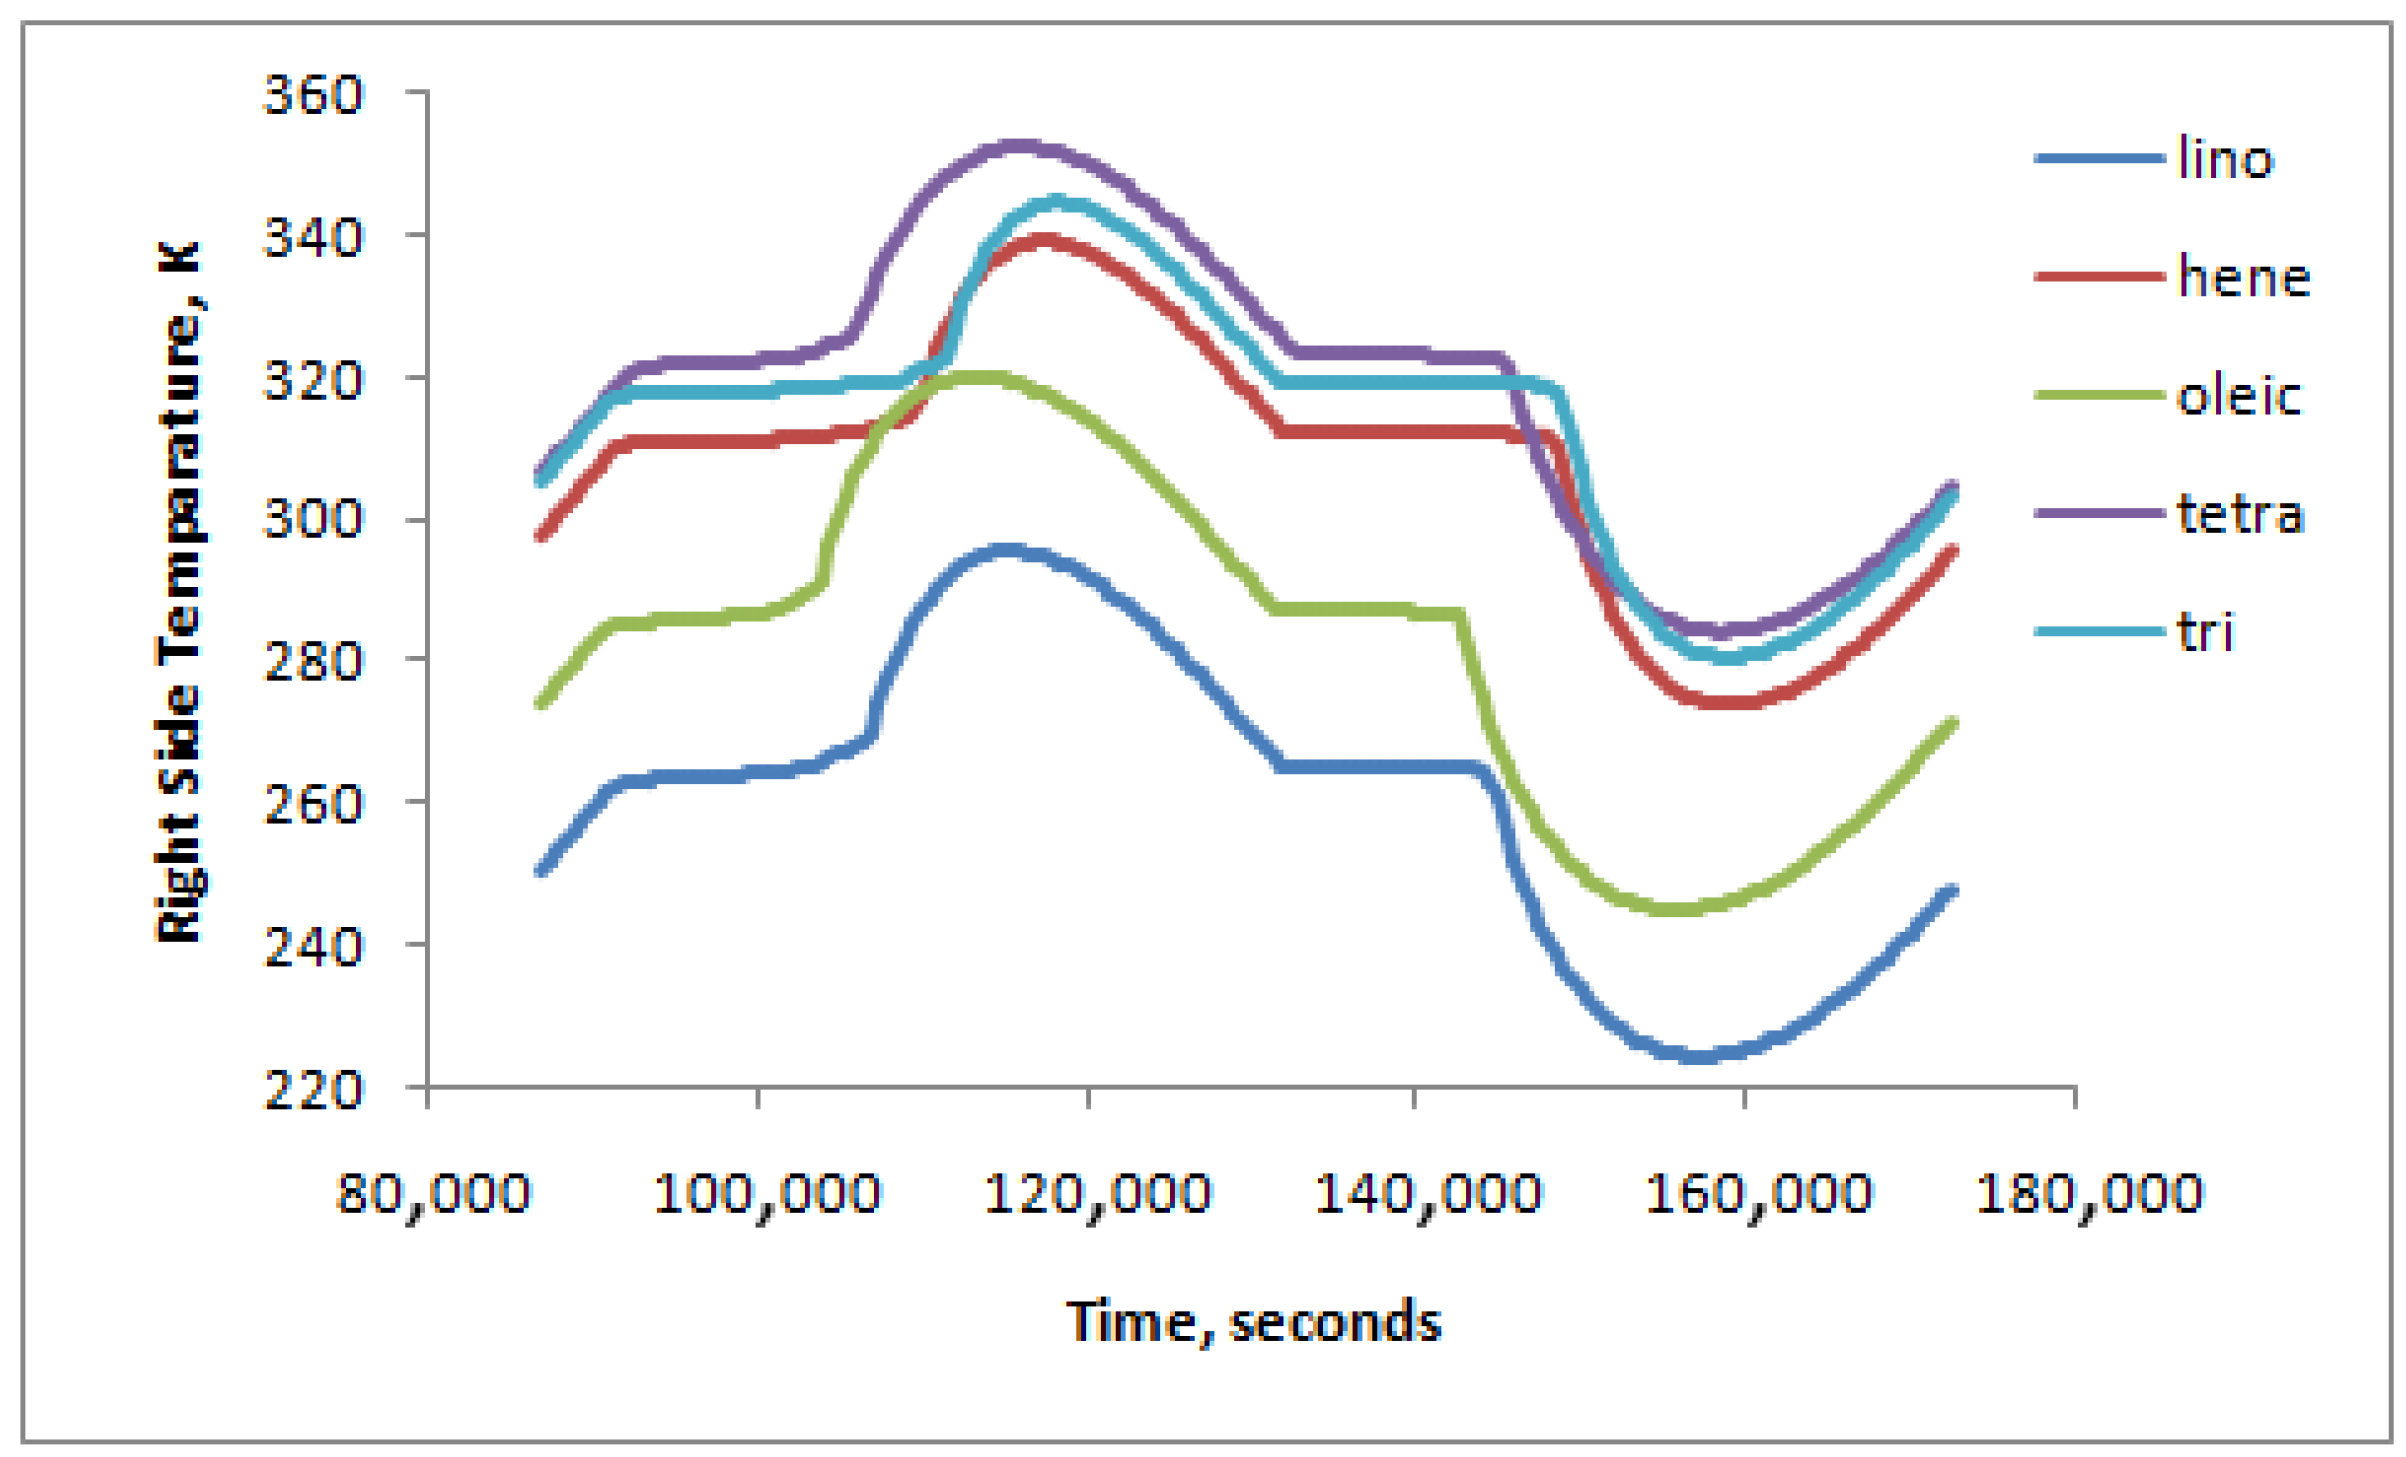
Figure 6 shows the right-side average surface temperature over a full day for different PCMs. Each PCM has its own melting temperature, and cases were run at initial and ambient temperatures 4 °C below its melting temperature. Liquidus and solidus temperatures are chosen to be 0.5 °C above the melting temperature. The properties of all PCMs used in this section are given in Table 6 [45]. Viscosity and thermal expansion are taken as 0.008 kg/m·s and 0.0005 K−1, respectively, for all PCMs. The heating of the liquid and the cooling of the solid can be seen easily with melting and solidification in between phases. The slight edge shown at the start of the second day is because the solid is reheated from the previous day.
Table 7 shows a comparison of the total energy gain by the PCM during the melting period and total energy release during the solidification period for a full day for different PCMs. It could be seen that the melting heat gain is at its maximum when using Linoleic Acid and Tricosane, while the lowest melting heat gain is for Tetracosane.
Figure 7 shows the right-side surface heat flux over a full day for different heat flux gains from the left side. It can be easily concluded that higher heat flux gain from the left side results in higher surface heat flux on the right side. The increased rate of right-side surface heat flux is almost proportional to that of heat flux gain from the left side.
Figure 8 shows the right-side average surface temperature over a full day for different heat flux gains from the left side. It could be easily seen that higher heat flux gain from the left side results in higher liquid temperatures and lower solid temperatures in the heating and cooling phases. It also could be seen that the melting and solidification time laps shorten as the heat flux gain from the left side increases. It should be noted that the heat flux gain from the left side, qo, was chosen to provide adequate melting and solidification processes for Heneicosane properties and conditions of the original case.
Table 8 shows a comparison of the total energy gain by the PCM during the melting period and total energy release during the solidification period for a full day for different heat flux gains. It could be seen that the melting heat gain is at its maximum when there is higher heat flux gain (left side), while it is lowest at lower heat flux gain.
Figure 9 and Figure 10 show the right-side surface heat flux and average surface temperature over a full day for different daytime hours, respectively. Longer daytime hours will expose the left side of the enclosure for a longer time to the heat flux gain from the left side, causing a change in melting and solidifying durations. A piecewise sinusoidal function was implemented to model different daytime hours during a full day, as shown in Equation (2). In the case of longer days (τq < 1), the PCM was in liquid form for a longer time but in solid form for a shorter time. In this case, the PCM stays in solid form towards the end of the day, which means that the next day will start while it is in solid form with low temperature. In case of shorter days (τq > 1), the PCM was in liquid form for a shorter time but in solid form for a longer time. In this case, it starts to liquidize again towards the end of the day.
Table 9 shows a comparison of the total energy gain by the PCM during the melting period and total energy release during the solidification period for a full day for different daytime hours. It could be seen that the melting heat gain is minimum for shorter daytime hours, while it is higher for longer daytime hours.

5. Conclusions

A 2-D numerical study was conducted on a PCM square enclosure containing Heneicosane and other different PCMs. The enclosure was exposed to solar radiation on one side (left) and indoor convection conditions on the other side (right). The grid test was conducted for a 2-dimensional model, and 100 × 100 cells resulted in temperature errors of less than 0.25%. A time step test was conducted, and a 5 s time step resulted in temperature errors of less than 0.5%. Eliminating the initial condition effect was achieved by running the case for four days. The second day showed temperature errors of less than 0.5%. The model was finally validated by comparison to existing experimental results from the literature. This project studied different PCMs, different heat flux gains, and different daytime hours. Linoleic Acid provided the highest inner surface heat flux, while Tricosane provided the lowest. Higher outer wall heat flux gain resulted in an increase in the inner surface heat flux on the right side. For longer daytime hours (t/τq < 1), the PCM was in a liquid form for a longer time but in a solid form for a shorter time. For shorter days (t/τq > 1), the PCM was in a liquid form for a shorter time but in a solid form for a longer time.
Additional work was conducted to calculate the total energy gain by the PCM during the melting period and the total energy release during the solidification period for a full day. This was carried out while changing all three different parameters: PCMs, heat flux gains, and daytime hours. It was concluded that Linoleic Acid and Tricosane have the highest melting heat gain, while Tetracosane had the lowest. Also, the melting heat gain has a proportional relation with the heat flux gain (left side). Finally, longer daytime hours provide more melting heat gain.
Summary:
  • Linoleic Acid provided the highest inner surface heat flux, while Tricosane provided the lowest.
  • Higher outer wall heat flux gain resulted in higher inner surface heat flux on the right side.
  • For longer daytime hours (t/τq < 1), the PCM was in a liquid form for a longer time, while it was solid for a longer time for shorter daytime hours (t/τq > 1).
  • Linoleic Acid and Tricosane have the highest melting heat gain, about 10% more than the energy released during the solidification period.
  • Melting heat gain has a proportional relation with the outer wall heat flux gain (left side). It could go up to 13% when doubling the outer wall heat flux gain.

Funding

This research received no external funding.

Acknowledgments

King Abdulaziz University for travel support, Villanova University for providing the necessary tools to finish this project, and supervision by Aaron Wemhoff of Villanova University are gratefully acknowledged.

Conflicts of Interest

The author declares no conflicts of interest.

Nomenclature

Cpthermal specific heat J/kg·K
Emtotal energy gains during melting timeW/m2
Estotal energy release during solidification timeW/m2
hoconvective heat transfer coefficientW/m2·K
hdaytime hoursh
Ggravitym/s2
kthermal conductivityW/m·K
PpressurePa
qouter wall heat flux W/m2
qoconstant component of outer wall heat transfer fluxW/m2
qrright-side heat fluxW/m2
TtemperatureK
Tmlliquidus temperatureK
Tmmelting temperatureK
Tmssolidus temperatureK
Tinner ambient temperatureK
ux-component velocitym/s
vy-component velocitym/s
xaxial directionm
yvertical directionm
Greek symbols
α t h thermal diffusivityKg/m·s
βthermal coefficient of expansionK−1
ΔHfmelting heatJ/K
μdynamic viscosityPa·s
ρdensityKg/m3
τqtime periods−1

References

  1. O’Connor, W.E.; Warzoha, R.; Weigand, R.; Fleischer, A.S.; Wemhoff, A.P. Thermal property prediction and measurement of organic phase change materials in the liquid phase near the melting point. Appl. Energy 2014, 132, 496–506. [Google Scholar] [CrossRef]
  2. O’Connor, W.E.; Wemhoff, A.P. Quantification of phase change material energy storage capability using multiphysics simulations. In International Electronic Packaging Technical Conference and Exhibition; American Society of Mechanical Engineers: San Francisco, CA, USA, 2015; Volume 56888, p. V001T09A065. [Google Scholar] [CrossRef]
  3. European Association for Storage of Energy. Available online: https://ease-storage.eu/wp-content/uploads/2023/09/2023.09.26-Thermal-Energy-Storage_for-distribution.pdf (accessed on 3 July 2025).
  4. Sarbu, I.; Sebarchievici, C. A comprehensive review of thermal energy storage. Sustainability 2018, 10, 191. [Google Scholar] [CrossRef]
  5. Tay, N.H.; Liu, M.; Belusko, M.; Bruno, F. Review on transportable phase change material in thermal energy storage systems. Renew. Sustain. Energy Rev. 2017, 75, 264–277. [Google Scholar] [CrossRef]
  6. Tehrmtest Instruments. Available online: https://thermtest.com/phase-change-material-pcm#:~:text=There%20are%203%20types%20of,paraffin%20compounds%20or%20fatty%20acids%20 (accessed on 3 July 2025).
  7. PCM Products. Available online: https://www.pcmproducts.net/Phase-Change-Material-Solutions.htm (accessed on 3 July 2025).
  8. Jian-you, L. Numerical and experimental investigation for heat transfer in triplex concentric tube with phase change material for thermal energy storage. Sol. Energy 2008, 82, 977–985. [Google Scholar] [CrossRef]
  9. Veerappan, M.; Kalaiselvam, S.; Iniyan, S.; Goic, R. Phase change characteristic study of spherical PCMs in solar energy storage. Sol. Energy 2009, 83, 1245–1252. [Google Scholar] [CrossRef]
  10. Hoshi, A.; Mills, D.R.; Bittar, A.; Saitoh, T.S. Screening of high melting point phase change materials (PCM) in solar thermal concentrating technology based on CLFR. Sol. Energy 2005, 79, 332–339. [Google Scholar] [CrossRef]
  11. Trp, A. An experimental and numerical investigation of heat transfer during technical grade paraffin melting and solidification in a shell-and-tube latent thermal energy storage unit. Sol. Energy 2005, 79, 648–660. [Google Scholar] [CrossRef]
  12. Medina, M.A.; King, J.B.; Zhang, M. On the heat transfer rate reduction of structural insulated panels (SIPs) outfitted with phase change materials (PCMs). Energy 2008, 33, 667–678. [Google Scholar] [CrossRef]
  13. Kenisarin, M.; Mahkamov, K. Solar energy storage using phase change materials. Renew. Sustain. Energy Rev. 2007, 11, 1913–1965. [Google Scholar] [CrossRef]
  14. Wang, Y.; Tang, B.; Zhang, S. Organic, cross-linking, and shape-stabilized solar thermal energy storage materials: A reversible phase transition driven by broadband visible light. Appl. Energy 2014, 113, 59–66. [Google Scholar] [CrossRef]
  15. Neeper, D.A. Thermal dynamics of wallboard with latent heat storage. Sol. Energy 2000, 68, 393–403. [Google Scholar] [CrossRef]
  16. Zhou, G.; Zhang, Y.; Zhang, Q.; Lin, K.; Di, H. Performance of a hybrid heating system with thermal storage using shape-stabilized phase-change material plates. Appl. Energy 2007, 84, 1068–1077. [Google Scholar] [CrossRef]
  17. Athienitis, A.K.; Liu, C.; Hawes, D.; Banu, D.; Feldman, D. Investigation of the thermal performance of a passive solar test-room with wall latent heat storage. Build. Environ. 1997, 32, 405–410. [Google Scholar] [CrossRef]
  18. Zhu, N.; Ma, Z.; Wang, S. Dynamic characteristics and energy performance of buildings using phase change materials: A review. Energy Convers. Manag. 2009, 50, 3169–3181. [Google Scholar] [CrossRef]
  19. Diaconu, B.M.; Cruceru, M. Novel concept of composite phase change material wall system for year-round thermal energy savings. Energy Build. 2010, 42, 1759–1772. [Google Scholar] [CrossRef]
  20. Cabeza, L.F.; Castellón, C.; Nogués, M.; Medrano, M.; Leppers, R.; Zubillaga, O. Use of microencapsulated PCM in concrete walls for energy savings. Energy Build. 2007, 39, 113–119. [Google Scholar] [CrossRef]
  21. Castellón, C.; Medrano, M.; Roca, J.; Cabeza, L.F.; Navarro, M.E.; Fernández, A.I.; Lázaro, A.; Zalba, B. Effect of microencapsulated phase change material in sandwich panels. Renew. Energy 2010, 35, 2370–2374. [Google Scholar] [CrossRef]
  22. Eddhahak-Ouni, A.; Drissi, S.; Colin, J.; Neji, J.; Care, S. Experimental and multi-scale analysis of the thermal properties of Portland cement concretes embedded with microencapsulated Phase Change Materials (PCMs). Appl. Therm. Eng. 2014, 64, 32–39. [Google Scholar] [CrossRef]
  23. Li, M.; Wu, Z.; Tan, J. Heat storage properties of the cement mortar incorporated with composite phase change material. Appl. Energy 2013, 103, 393–399. [Google Scholar] [CrossRef]
  24. Weinstein, R.D.; Kopec, T.C.; Fleischer, A.S.; D’Addio, E.; Bessel, C.A. The experimental exploration of embedding phase change materials with graphite nanofibers for the thermal management of electronics. J. Heat Transf. 2008, 130, 042405. [Google Scholar] [CrossRef]
  25. Garimella, S.V.; Fleischer, A.S.; Murthy, J.Y.; Keshavarzi, A.; Prasher, R.; Patel, C.; Bhavnani, S.H.; Venkatasubramanian, R.; Mahajan, R.; Joshi, Y.; et al. Thermal challenges in next-generation electronic systems. IEEE Trans. Compon. Packag. Technol. 2008, 31, 801–815. [Google Scholar] [CrossRef]
  26. Garimella, S.V. Advances in mesoscale thermal management technologies for microelectronics. Microelectron. J. 2006, 37, 1165–1185. [Google Scholar] [CrossRef]
  27. Bianco, V.; De Rosa, M.; Vafai, K. Phase-change materials for thermal management of electronic devices. Appl. Therm. Eng. 2022, 214, 118839. [Google Scholar] [CrossRef]
  28. Kandasamy, R.; Wang, X.Q.; Mujumdar, A.S. Application of phase change materials in thermal management of electronics. Appl. Therm. Eng. 2007, 27, 2822–2832. [Google Scholar] [CrossRef]
  29. Sikiru, S.; Oladosu, T.L.; Amosa, T.I.; Kolawole, S.Y.; Soleimani, H. Recent advances and impact of phase change materials on solar energy: A comprehensive review. J. Energy Storage 2022, 53, 105200. [Google Scholar] [CrossRef]
  30. Javadi, F.S.; Metselaar, H.S.; Ganesan, P.J. Performance improvement of solar thermal systems integrated with phase change materials (PCM), a review. Sol. Energy 2020, 206, 330–352. [Google Scholar] [CrossRef]
  31. Ismail, K.A.; Lino, F.A.; Machado, P.L.; Teggar, M.; Arıcı, M.; Alves, T.A.; Teles, M.P. New potential applications of phase change materials: A review. J. Energy Storage 2022, 53, 105202. [Google Scholar] [CrossRef]
  32. Faraj, K.; Khaled, M.; Faraj, J.; Hachem, F.; Castelain, C. Phase change material thermal energy storage systems for cooling applications in buildings: A review. Renew. Sustain. Energy Rev. 2020, 119, 109579. [Google Scholar] [CrossRef]
  33. Mahdaoui, M.; Hamdaoui, S.; Ait Msaad, A.; Kousksou, T.; El Rhafiki, T.; Jamil, A.; Ahachad, M. Building bricks with phase change material (PCM): Thermal performances. Constr. Build. Mater. 2021, 269, 121315. [Google Scholar] [CrossRef]
  34. Hawes, D.W.; Banu, D.; Feldman, D. Latent heat storage in concrete. Sol. Energy Mater. 1989, 19, 335–348. [Google Scholar] [CrossRef]
  35. Memon, S.A. Phase change materials integrated in building walls: A state of the art review. Renew. Sustain. Energy Rev. 2014, 31, 870–906. [Google Scholar] [CrossRef]
  36. Zhu, N.; Li, S.; Hu, P.; Wei, S.; Deng, R.; Lei, F. A review on applications of shape-stabilized phase change materials embedded in building enclosure in recent ten years. Sustain. Cities Soc. 2018, 43, 251–264. [Google Scholar] [CrossRef]
  37. Benyahia, I.; Abderrahmane, A.; Khetib, Y.; AAlazwari, M.; Younis, O.; Belazreg, A.; Laouedj, S. Enhancing Phase Change Material Efficiency in Wavy Trapezoidal Cavities: A Numerical Investigation of Nanoparticle Additives. Physics 2025, 7, 17. [Google Scholar] [CrossRef]
  38. Shaban, M.; Khan, T.I.; Anwar, M.; Alzaid, M.; Alanazi, R. Effect of asymmetric fins on thermal performance of phase change material-based thermal energy storage unit. Materials 2023, 16, 2567. [Google Scholar] [CrossRef]
  39. Wang, X.; Cheng, Q.; Wu, M.; Du, P.; Liu, C.; Rao, Z. Thermal properties optimization of lauric acid as phase change material with modified boron nitride nanosheets-sodium sulfate for thermal energy storage. J. Energy Storage 2023, 6, 106781. [Google Scholar] [CrossRef]
  40. Zhang, G.; Sun, Y.; Wu, C.; Yan, X.; Zhao, W.; Peng, C. Low-cost and highly thermally conductive lauric acid–paraffin–expanded graphite multifunctional composite phase change materials for quenching thermal runaway of lithium-ion battery. Energy Rep. 2023, 9, 2538–2547. [Google Scholar] [CrossRef]
  41. Ishak, S.; Mandal, S.; Lee, H.S.; Singh, J.K. pH-controlled synthesis of sustainable lauric acid/SiO2 phase change material for scalable thermal energy storage. Sci. Rep. 2021, 11, 15012. [Google Scholar]
  42. Jalghaf, H.K.; Kovács, E. Simulation of phase change materials in building walls using effective heat capacity model by recent numerical methods. J. Energy Storage 2024, 83, 110669. [Google Scholar] [CrossRef]
  43. Warzoha, R.J.; Weigand, R.M.; Fleischer, A.S. Temperature-dependent thermal properties of a paraffin phase change material embedded with herringbone style graphite nanofibers. Appl. Energy 2015, 137, 716–725. [Google Scholar] [CrossRef]
  44. Gau, C.; Viskanta, R.C. Melting and solidification of a pure metal on a vertical wall. J. Heat Transf. 1986, 108, 174–181. [Google Scholar] [CrossRef]
  45. O’Connor, W.E. Predictions of Phase Change Material Thermal Efficiency Using Multiscale Analysis. Master’s Thesis, Villanova University, Villanova, PA, USA, 2015. [Google Scholar]
  46. White, F.M.; Majdalani, J. Viscous Fluid Flow; McGraw-Hill: New York, NY, USA, 2006; Volume 3, pp. 433–434. [Google Scholar]
  47. Nikitin, E.D.; Pavlov, P.A.; Bessonova, N.V. Critical constants of n-alkanes with from 17 to 24 carbon atoms. J. Chem. Thermodyn. 1994, 26, 177–182. [Google Scholar] [CrossRef]
  48. CAMEO Chemicals. Database of Hazardous Materials; National Oceanic and Atmospheric Administration: Silver Spring, MD, USA, 2013. [Google Scholar]
  49. National Institutes of Health. PubChem; National Institutes of Health: Bethesda, MD, USA, 2013. [Google Scholar]
  50. Weast, R.C.; Graselli, J.G. CRC Handbook of Data on Organic Compounds, 2nd ed.; CRC Press, Inc: Boca Raton, FL, USA, 1989. [Google Scholar]
  51. LookChem. LookChem; LookChem: Hangzhou, China, 2013. [Google Scholar]
  52. Domalski, E.S.; Hearing, E.D. Heat capacities and entropies of organic compounds in the condensed phase. Volume III. J. Phys. Chem. Ref. Data 1996, 25, 1–525. [Google Scholar] [CrossRef]
  53. Jalal, I.M.; Zografi, G.; Rakshit, A.K.; Gunstone, F.D. Thermal analysis of fatty acids. Chem. Phys. Lipids 1982, 31, 395–404. [Google Scholar] [CrossRef]
  54. Grodzka, P.G. Study of Phase-Change Materials for a Thermal Control System; Huntsville, A., Ed.; Lockheed Missiles & Space Company: Sunnyvale, CA, USA, 1970. [Google Scholar]
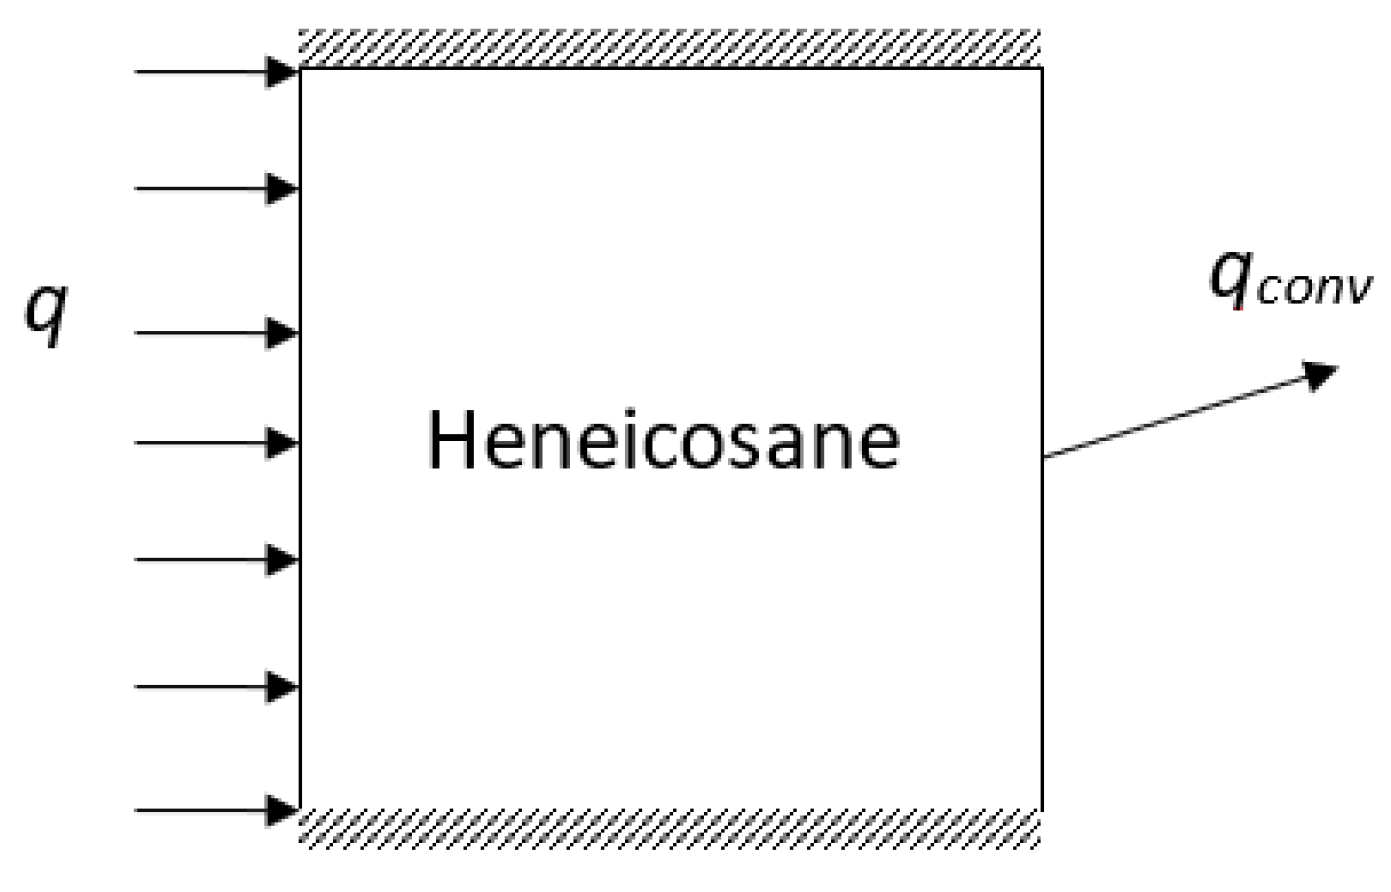
Figure 1. Schematic drawing for the model.
Computation 13 00209 g001
Figure 2. Grid test for 3 different mesh systems for comparison.
Computation 13 00209 g002
Figure 3. Average temperature on the right-hand side over a full day for 4 days.
Computation 13 00209 g003
Figure 4. Comparison between experimental and numerical results.
Computation 13 00209 g004
Figure 5. Effect of PCM on the right-side surface heat flux.
Computation 13 00209 g005
Figure 6. Effect of PCM on the right-side average surface temperature.
Computation 13 00209 g006
Figure 7. Effect of heat flux gain from the left side on the right-side heat transfer flux.
Computation 13 00209 g007
Figure 8. Effect of heat flux gain from the left side on the right-side average surface temperature.
Computation 13 00209 g008
Figure 9. Effect of daytime hours on the right-side surface heat flux over a full day.
Computation 13 00209 g009
Figure 10. Effect of daytime hours on the right-side average surface temperature over a full day.
Computation 13 00209 g010
Table 1. Heneicosane thermophysical properties.
PropertySymbolValueUnits
Densityρ772kg/m3
Thermal Specific HeatCp2390J/kg·K
Thermal Conductivityk0.145W/m·K
Dynamic Viscosityμ0.008kg/m·s
Thermal Coefficient of Expansionβ0.0005K−1
Melting HeatΔHf295,000J/kg
Solidus TemperatureTms311.5K
Liquidus TemperatureTml312.5K
Table 2. Errors for average temperature and efficiency parameters on the right side for different grid systems.
First-Day RunSecond-Day Run
Average parameters on right side along edge50 × 50100 × 10050 × 50100 × 100
Temperature, average error % compared to 200 × 2000.4684%0.2473%0.4877%0.2490%
Efficiency, average error % compared to 200 × 2000.04651%0.02765%0.05795%0.03083%
Table 3. Errors for average temperature and efficiency parameters on the right side using different time steps.
First-Day RunSecond-Day Run
Average parameters on right side along edge10 s5 s10 s5 s
Temperature, average error % compared to 3 s0.3235%0.04177%0.3388%0.05028%
Efficiency, average error % compared to 3 s0.04130%0.005230%0.04372%0.006251%
Table 4. Errors for average temperature and efficiency parameters on the right side for several days of operation.
Error Compared to 4th-Day Results
Average parameters on right-hand side
along edge
First daySecond dayThird day
Temperature, average error %
compared to 4th day
0.1763%0.01080%0.001704%
Heat transfer rate, average error %
compared to 4th day
26.58%0.1007%0.003386%
Efficiency, average error %
compared to 4th day
0.0009194%0.00006136%0.00000181%
Table 5. Gallium thermophysical properties.
PropertySymbolValueUnits
Liquid densityρ6093Kg/m3
Mass-based specific heatCp381.5J/kg·K
Thermal conductivityk32.0W/m·K
Dynamic viscosityμ1.81 × 10⁻³Pa.s
Thermal coefficient of expansionβ1.2 × 10⁻⁴K−1
Latent heat of fusionΔHf80.16kJ/kg
Melting temperatureTm302.93K
Table 6. Thermophysical properties for different PCMs [47,48,49,50,51,52,53,54].
PCMTm (K)ρ (kg/m3)Cp (kJ/kg·K)K (W/m·K)ΔHf (kJ/kg)
Heneicosane3127722.390.145295
Tricosane3197782.180.124303
Tetracosane3237742.920.137208
Oleic Acid2878711.740.103140
Linoleic Acid2659021.920.087170
Table 7. Total energy gain and release by PCM during a full day using different PCM materials.
Energy W/m2Linoleic AcidHeneicosaneOleic AcidTetracosaneTricosane
Em39,054.3431,667.6242,228.6736,582.2231,020.95
Es−35,404.06−31,253.53−404,73.03−36,508.74−28,189.34
Difference3650.28414.091755.6473.482831.61
% (Em − Es) × 100/Es10.31%1.32%4.34%0.20%10.04%
Table 8. Total energy gain and release by PCM during a full day for different outer wall heat flux gains.
Energy W/m2qo = 200qo = 250qo = 300qo = 350qo = 400
Em31,667.6244,176.0757,13670,161.6383,619.01
Es−31,253.5−41,708.4−52,170.2−62,864.6−73,635
Difference414.092467.6324965.7557296.9969983.967
% (Em − Es) × 100/Es1.32%5.92%9.52%11.61%13.56%
Table 9. Total energy gain and release by PCM during a full day for different daytime hours.
Energy W/m2t/Tq = 0.75t/Tq = 0.875t/Tq = 1.0t/Tq = 1.125t/Tq = 1.25
Em16,290.5427,036.6631,667.6225,749.3418,623.55
Es−46,114.85−38,710.06−31,253.53−24,570.23−19,233.81
Difference−29,824.30−11,673.40414.091179.11−610.26
% (Em − Es) × 100/Es−64.67%−30.16%1.32%4.80%−3.17%
Disclaimer/Publisher’s Note: The statements, opinions and data contained in all publications are solely those of the individual author(s) and contributor(s) and not of MDPI and/or the editor(s). MDPI and/or the editor(s) disclaim responsibility for any injury to people or property resulting from any ideas, methods, instructions or products referred to in the content.