To validate the effectiveness of Feedback-Based Validation Learning (FBVL), we conducted experiments on two datasets: the Iris dataset [
5] (a classic tabular dataset) and the Multimodal EmotionLines Dataset (MELD) [
1,
2] (a complex multimodal conversational dataset). The results were analyzed across accuracy, loss, F1-score, and comparisons with state-of-the-art models.
5.4.1. Performance Study Without Using FBVL
We evaluated the baseline neural network architecture (NNA) on the Iris dataset [
5] without FBVL. The model achieved a high training accuracy of 99.17% (loss: 0.05185) and a test accuracy of 93.33% (loss: 0.1346), as summarized in
Table 4 and
Table 5 as summarized in
Table 4 and
Table 5. Minor misclassifications occurred during training: two instances of versicolor and two of virginica (
Table 5). According to the classification report (
Table 6), performance was strong across all classes, with weighted and macro-averaged F1-scores of 0.95, indicating balanced precision and recall.. In the test phase, two virginica samples were misclassified (
Table 7). These results suggest the baseline model generalizes well but exhibits slight instability in distinguishing closely related species.
As shown in
Table 4, the test phase yielded a strong accuracy of 93.33% and a test loss of 0.1346. The performance across classes was consistently high, demonstrating the model’s reliable predictive ability on unseen data.
The confusion matrix in
Table 5 provides a detailed overview of the model’s performance on the training dataset of the Iris dataset without utilizing the Feedback-Based Validation Learning (FBVL) mechanism.
Table 6 presents the classification report for the IRIS test dataset without using FBVL, showcasing metrics such as precision, recall, F1-score, and support. The results highlight strong performance across all classes, with weighted and macro-averages closely aligned, indicating balanced accuracy, precision, and recall. The overall accuracy is 93%, demonstrating effective classification despite the absence of FBVL.
Table 7 presents the test confusion matrix results for the IRIS dataset without using FBVL, illustrating the model’s performance on unseen data with minimal misclassifications.
As shown in
Figure 2, the training/validation cost curve for the IRIS dataset without using FBVL demonstrates that the maximum value of the cost is reached at approximately 0 epochs, after which it diminishes as the number of epochs increases. The cost stabilizes at a low value of 0.05185, indicating effective learning and convergence.
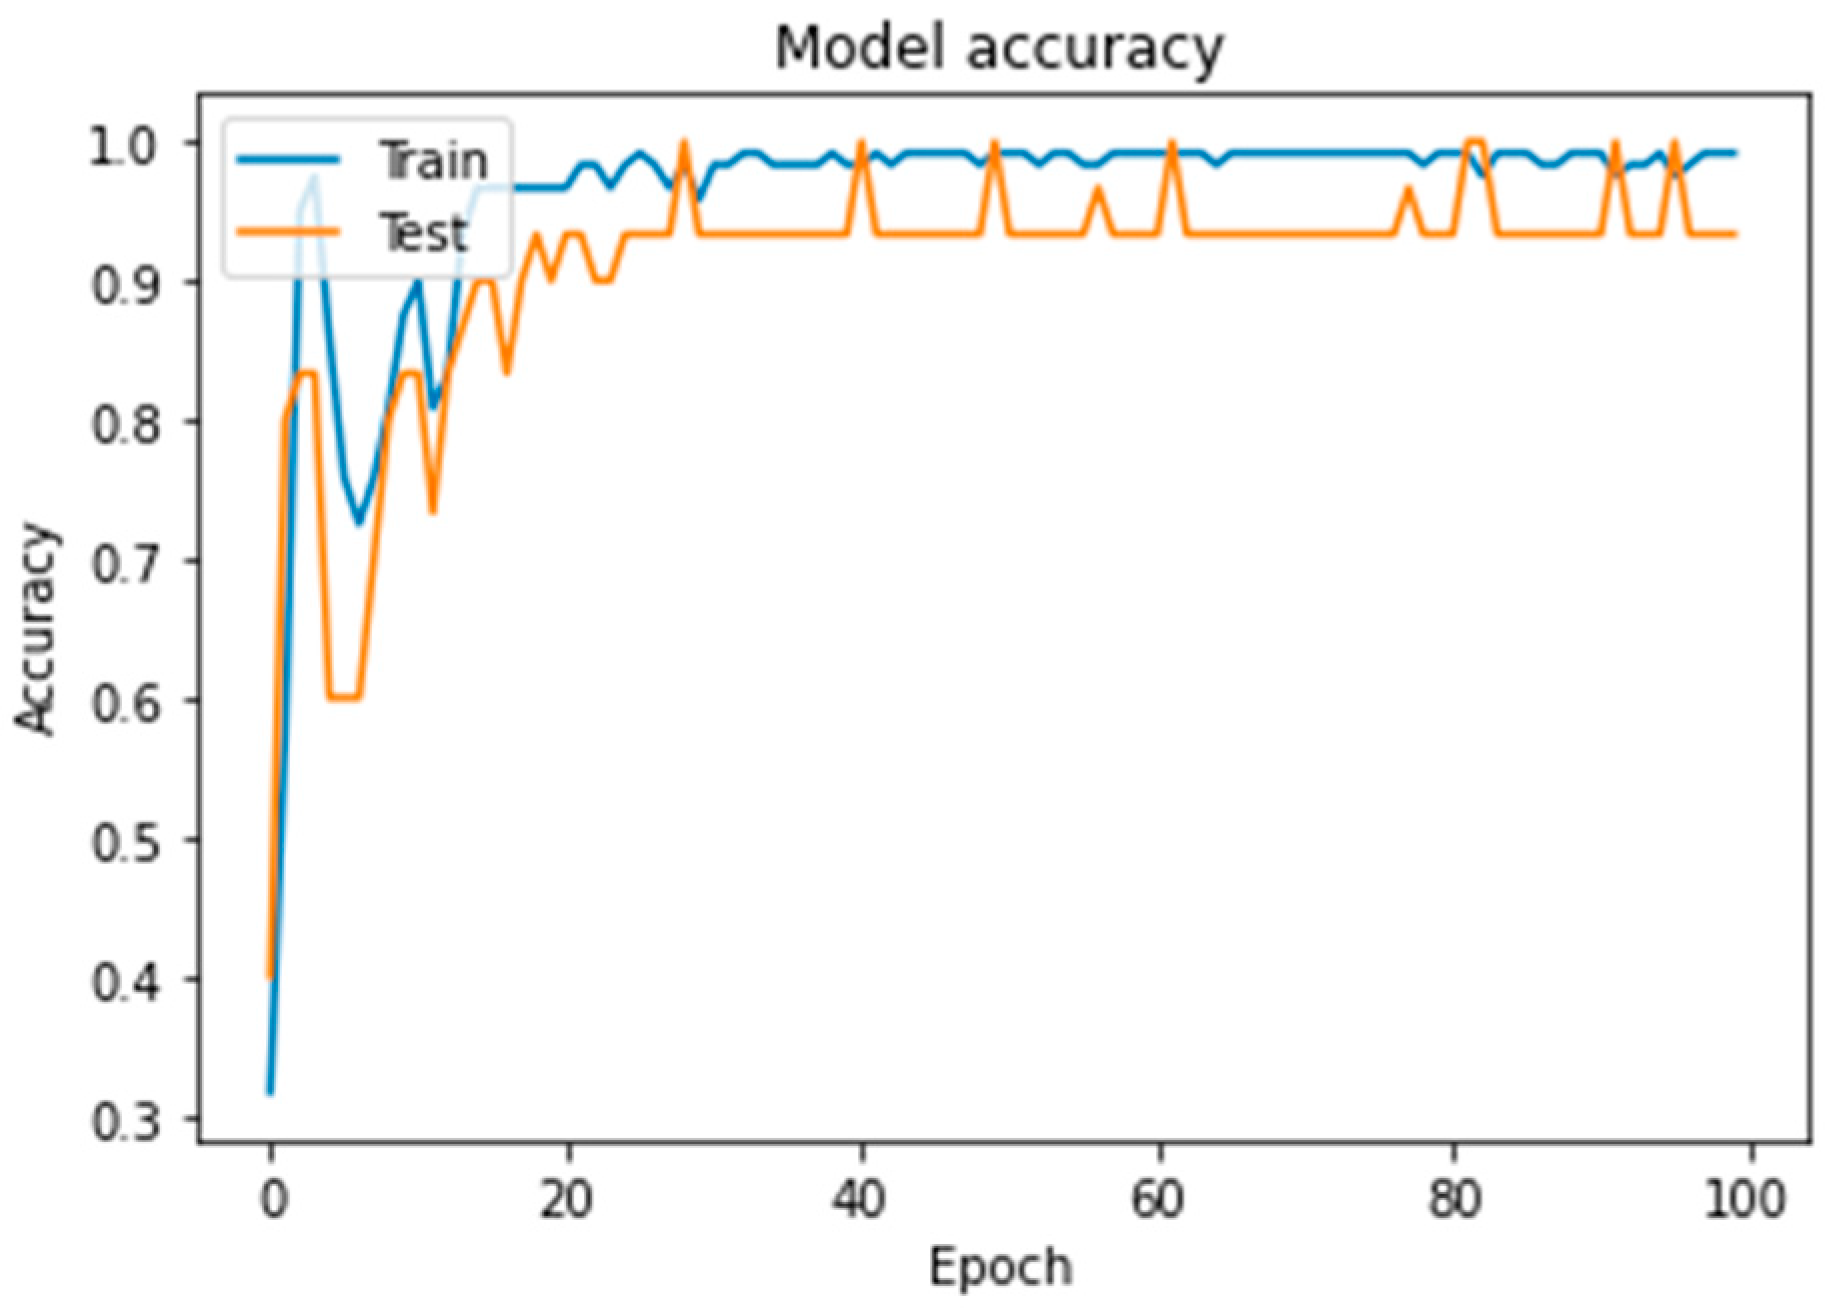
In
Figure 3, the training accuracy/validation accuracy curves reveal that the training accuracy initially reaches a peak but then experiences fluctuations before stabilizing around 99.17%. This behavior suggests that the model achieves high accuracy on the training data but may exhibit some instability during the early stages of training. The validation accuracy, however, shows consistent performance, aligning closely with the training accuracy, which indicates good generalization without significant overfitting.
5.4.2. Performance Study Using FBVL
Table 8 presents the classification report for the training dataset of the IRIS dataset using the Feedback-Based Validation Learning (FBVL) mechanism. The results demonstrate exceptional performance, with near-perfect precision, recall, and F1-scores for all classes. Specifically, the model achieves 100% precision and recall for the setosa class, while minor deviations are observed for the virginica and versicolor classes. The overall accuracy is 98%, with macro and weighted averages closely aligned at 0.98, indicating balanced and reliable classification across all classes. These findings underscore the effectiveness of FBVL in enhancing model performance during the training phase.
Table 9 presents the training confusion matrix results for the IRIS dataset using the Feedback-Based Validation Learning (FBVL) mechanism. This table highlights the model’s performance on the training data, showing near-perfect classification for the setosa and virginica classes, with only two misclassifications for versicolor.
The results in
Table 10 demonstrate perfect performance across all metrics, with precision, recall, and F1-score achieving 1.00 for all classes. The model exhibits flawless classification, as reflected in the confusion matrix, with no misclassifications observed. These outcomes highlight FBVL’s ability to optimize neural network performance, achieving 100% accuracy and balanced generalization.
Table 11 presents the test confusion matrix for the IRIS dataset using FBVL, showcasing perfect classification across all classes with no misclassifications.
It is evident from
Figure 4 that the maximum value of the cost curve is reached at approximately 0 epochs and diminishes as the number of epochs increases, eventually stabilizing at a cost of 0.0016. Regarding training accuracy (
Figure 5), we observe that after initially reaching a peak, there is a slight decline before it stabilizes and subsequently increases to 99.22% after a set number of epochs. Additionally, for class 1, the maximum value of the true label in the multimodal confusion matrix is 25448, representing the highest classification confidence for that class.
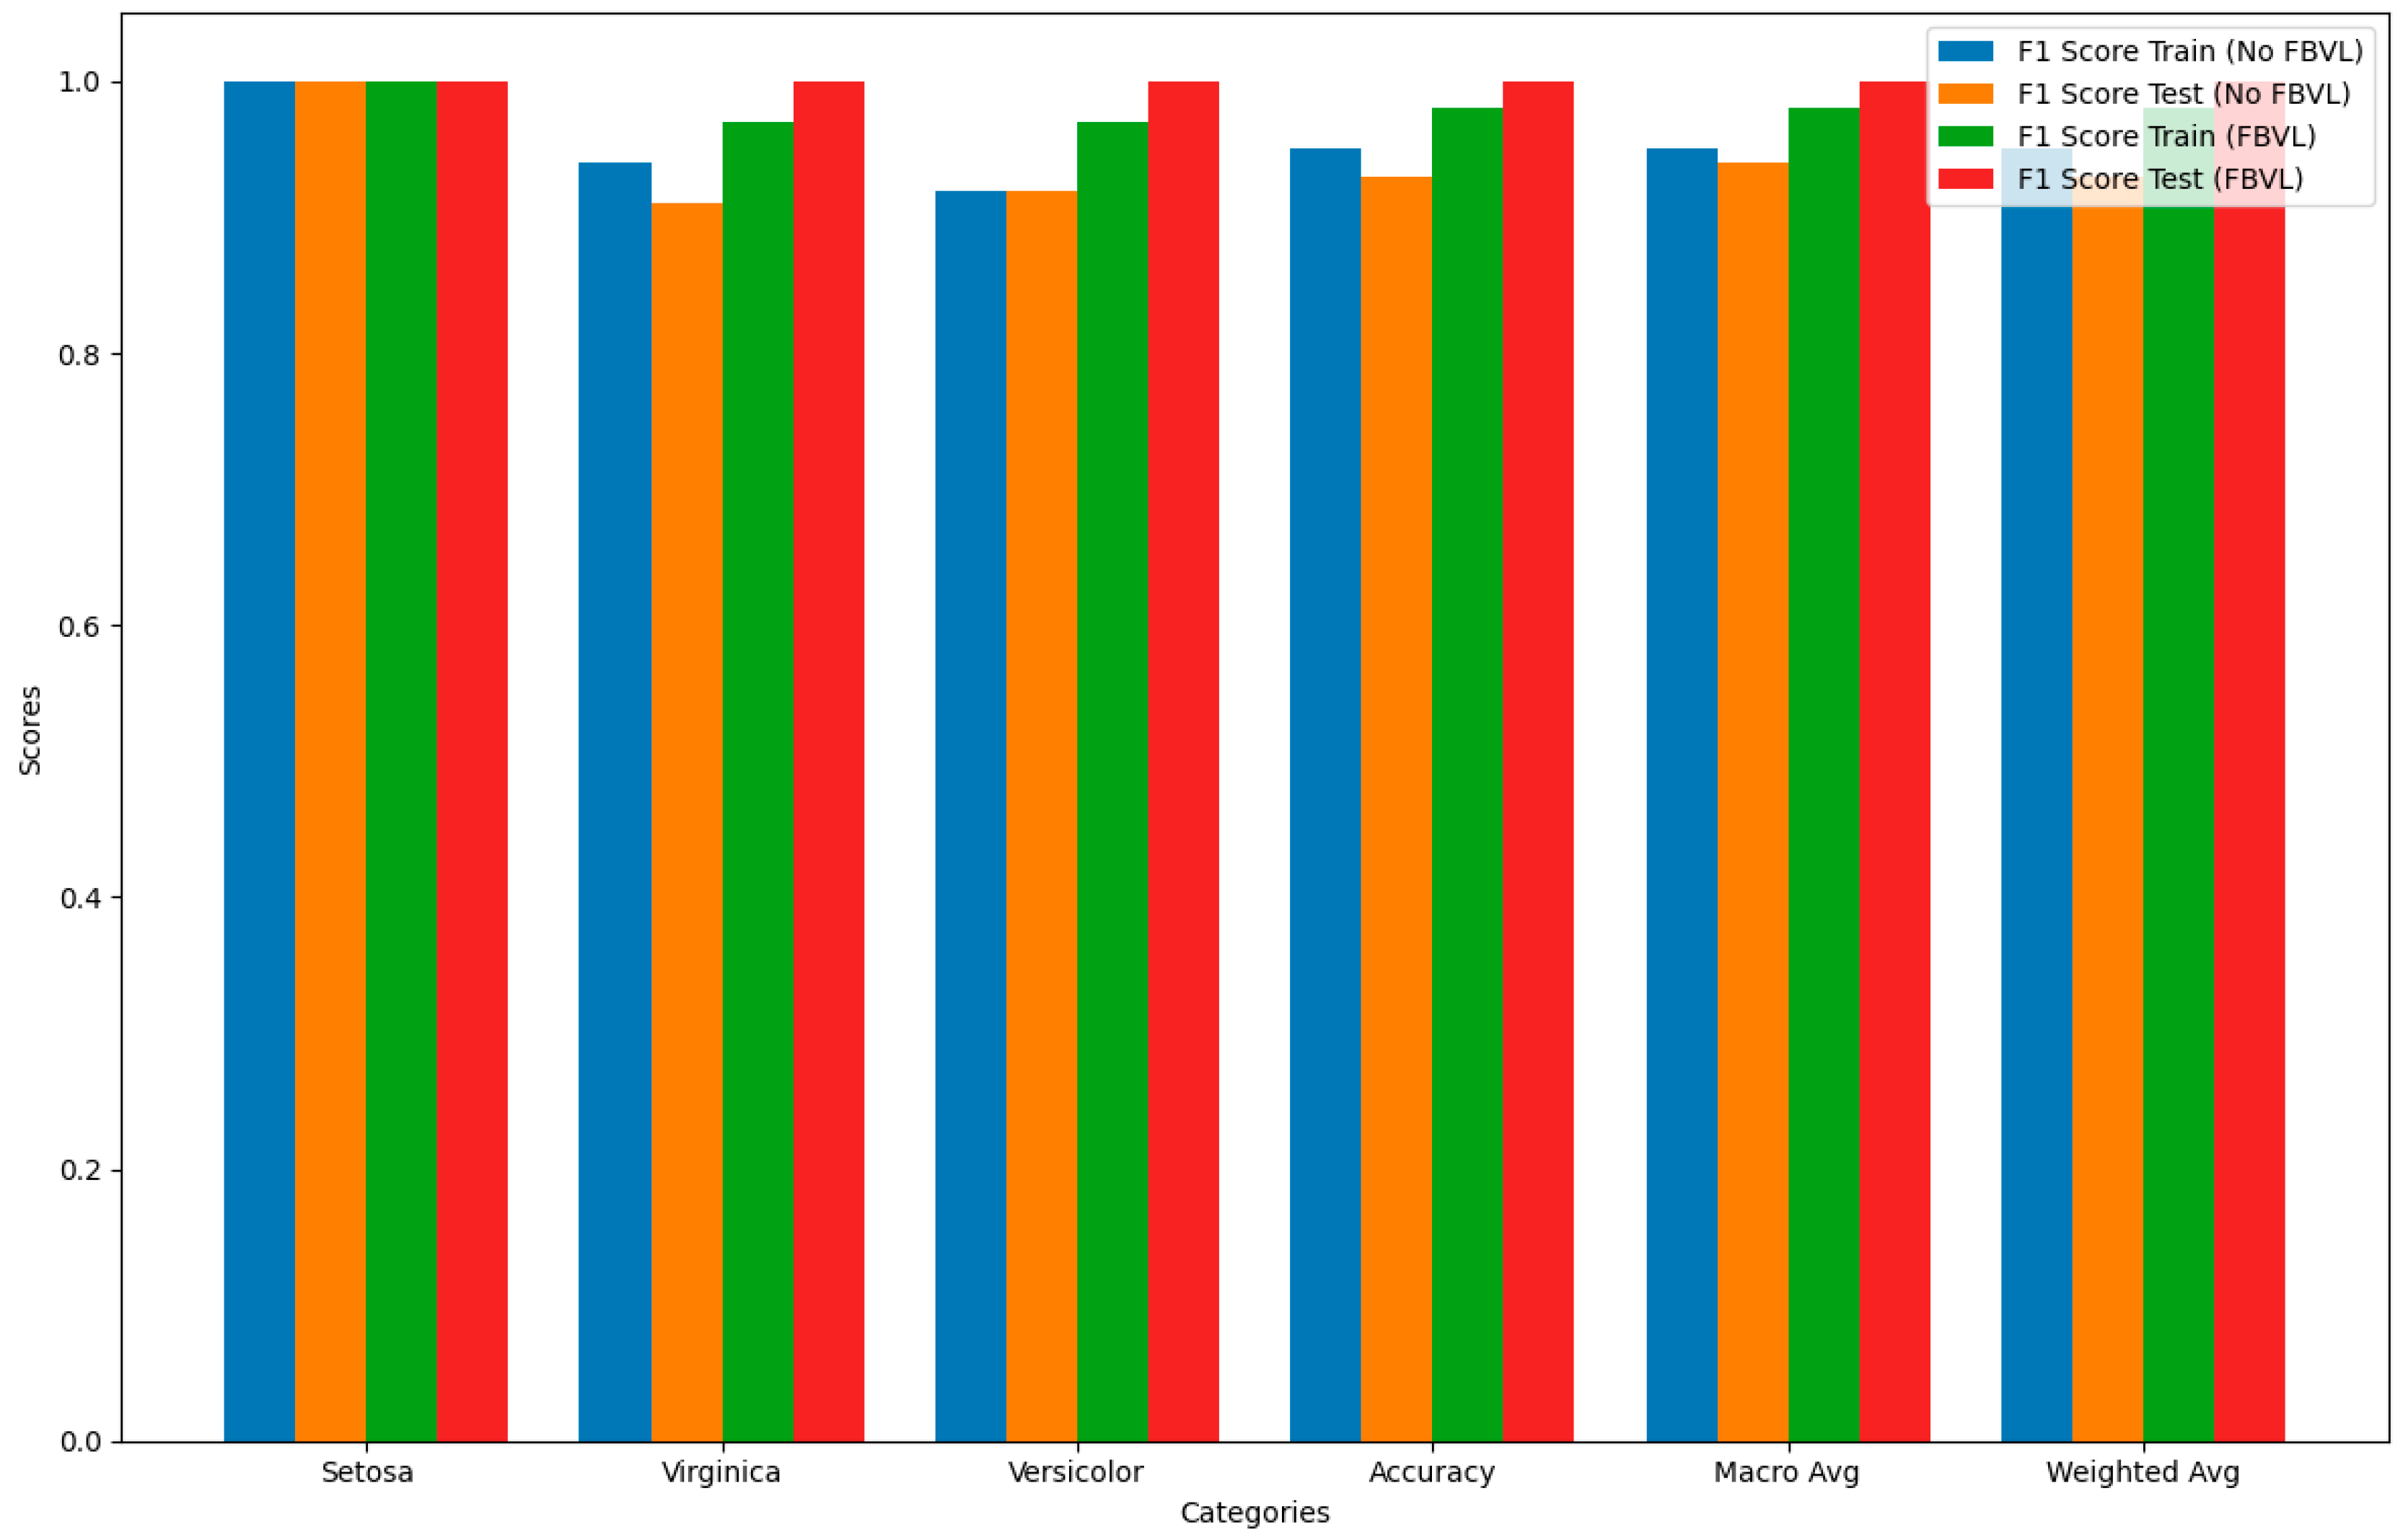
Figure 6 compares the F1 scores for each category between models using FBVL and those not using FBVL for both training and test datasets. The F1 score is chosen for this comparison because it provides a balanced measure of a model’s accuracy by considering both precision and recall. This makes it particularly useful for evaluating the overall performance of the models.
Training Data Without FBVL: Shows high F1 scores, but slightly lower for versicolor.
Test Data Without FBVL: F1 scores are generally high but slightly lower for virginica.
Training Data With FBVL: F1 scores are consistently high across all categories.
Test Data With FBVL: F1 scores are perfect across all categories.
The use of FBVL enhances the F1 scores, indicating a balanced improvement in both precision and recall across most categories. This is especially evident in the test dataset, which shows perfect scores, highlighting the effectiveness of FBVL in reducing overfitting and improving generalization.
By focusing on the F1 score, this graph provides a clear and comprehensive view of the model’s performance, demonstrating the significant benefits of incorporating Feedback-Based Validation Learning (FBVL). This comparison underscores the robustness and reliability of FBVL in various tasks, setting a new benchmark for future research in this domain.
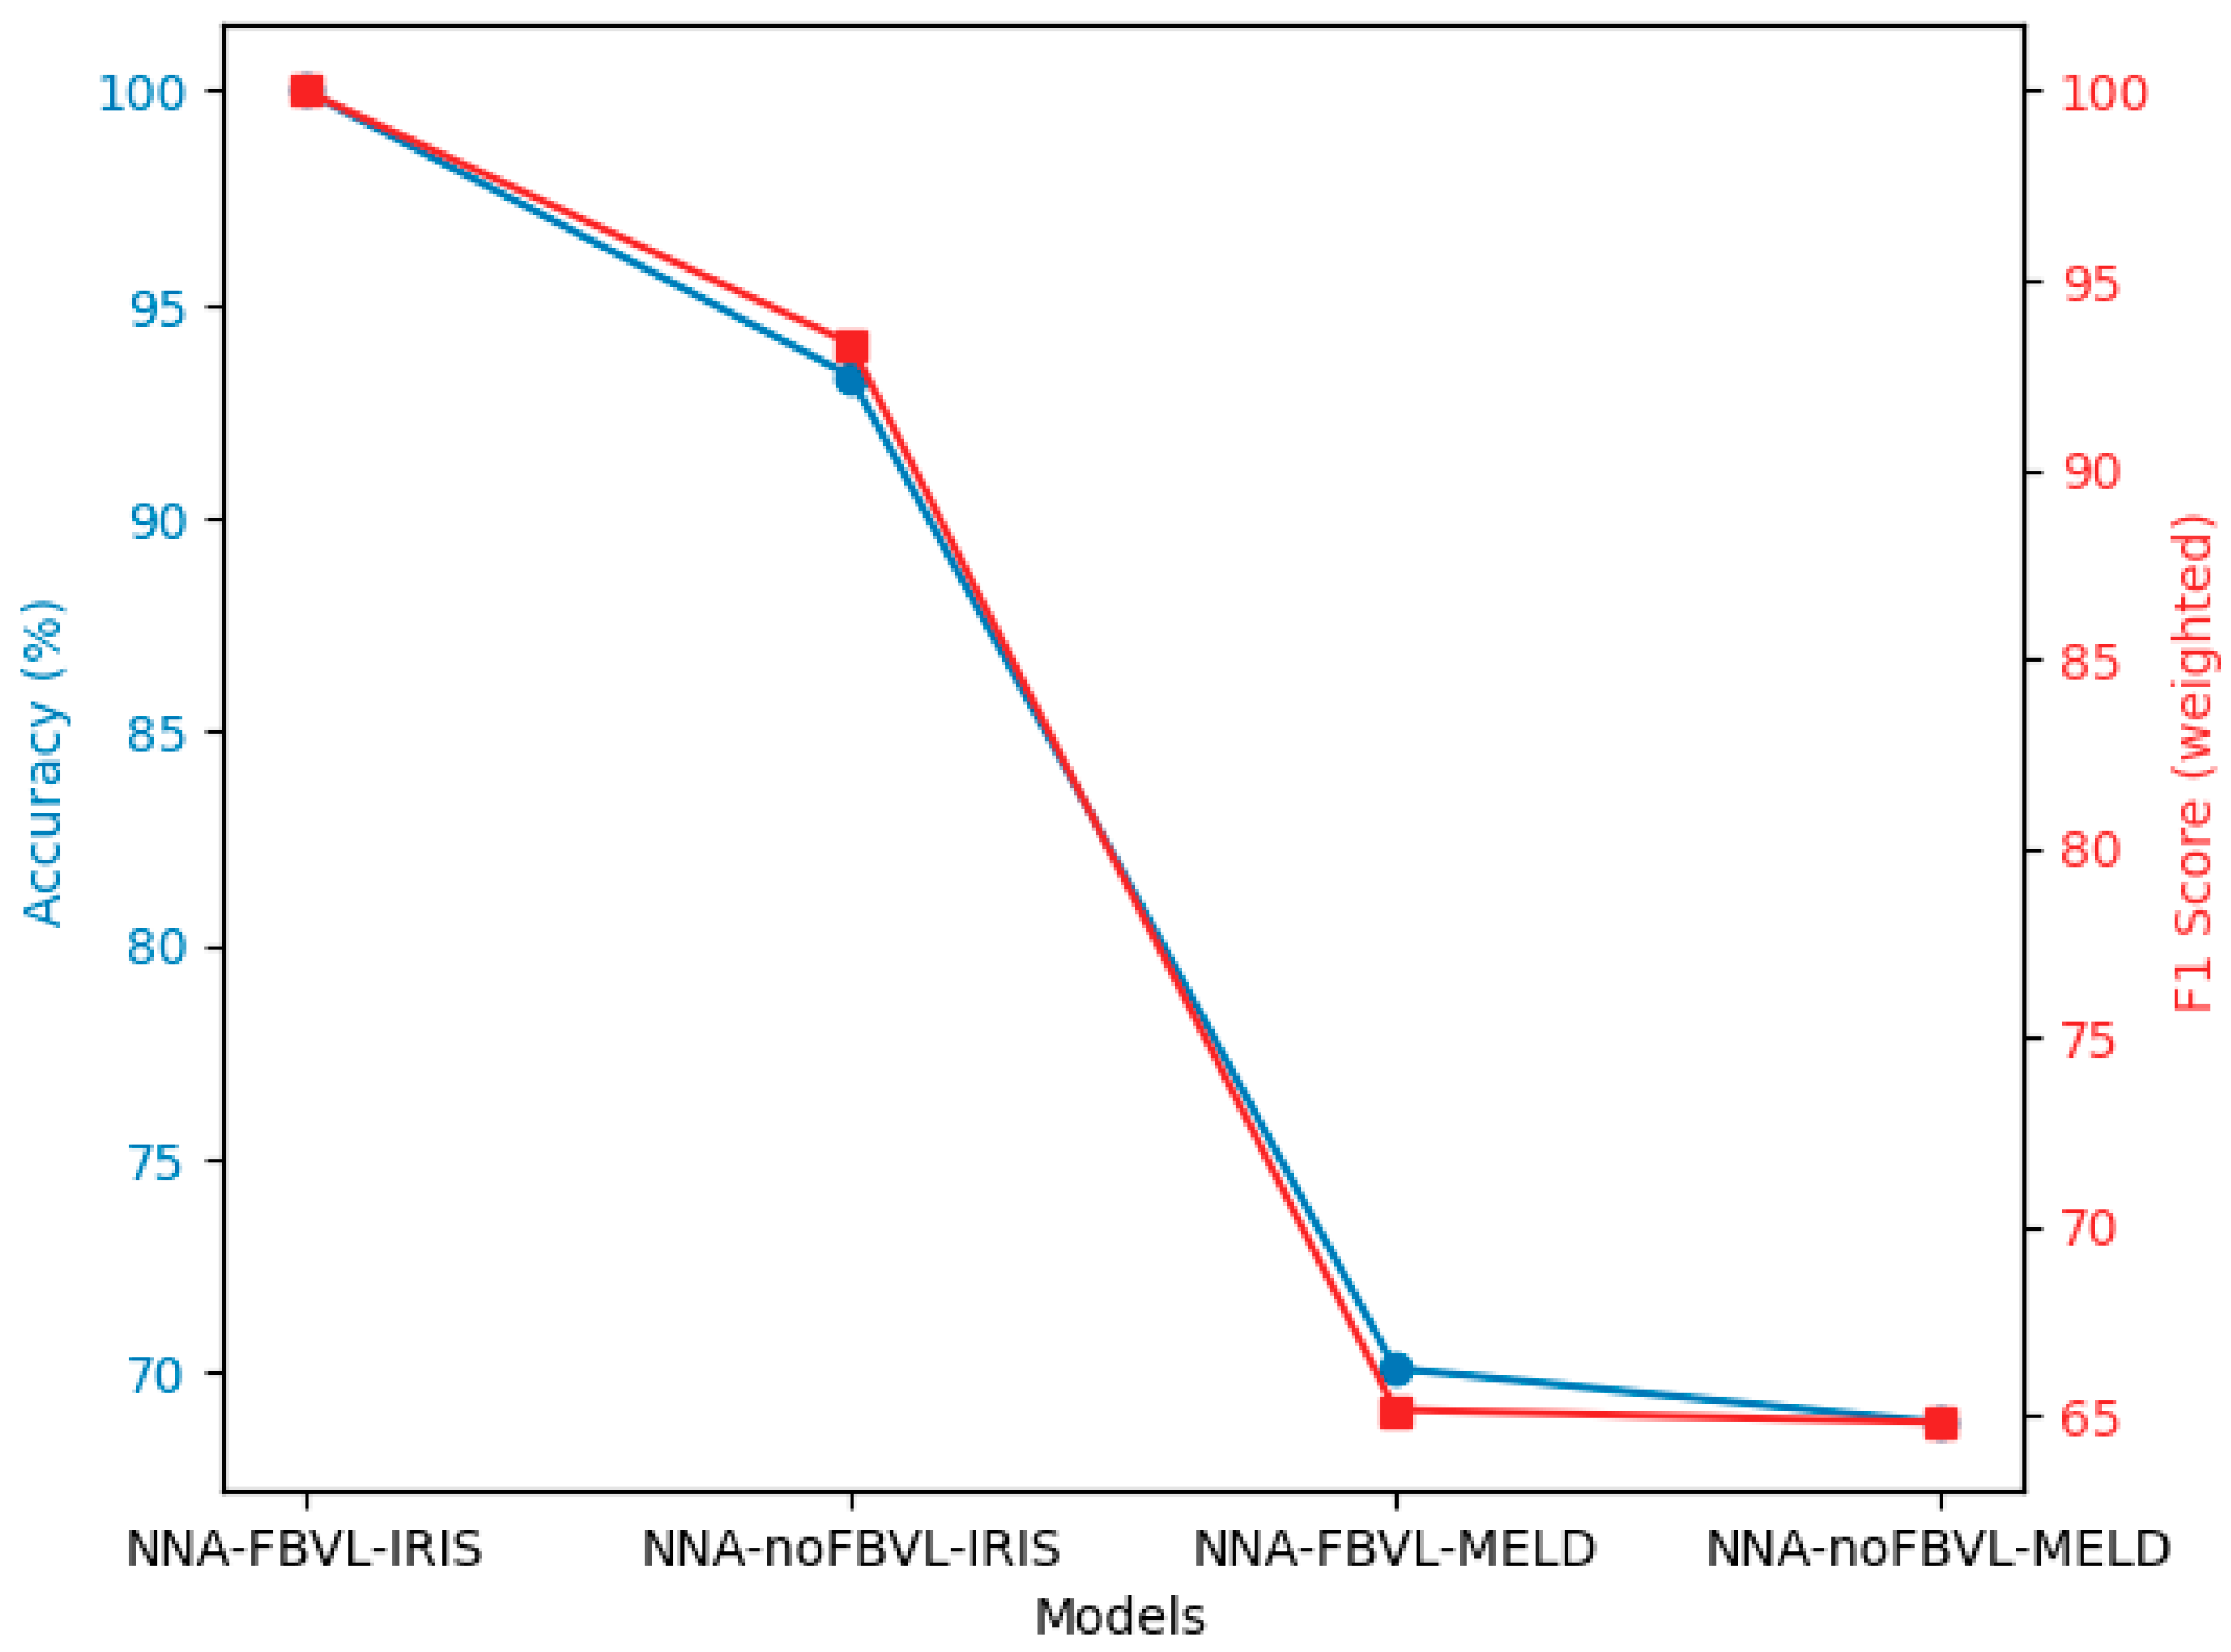
Table 12 shows the evaluation of our mechanism, FBVL, compared with a simple NNA without FBVL.
Figure 7 provides a visual comparison of the performance of neural network architectures with and without FBVL on the IRIS [
5] and MELD [
1,
2] datasets, focusing on two key metrics: Accuracy (%) and F1 Score (weighted).
The blue line represents the Accuracy (%) of each model. This metric indicates the proportion of correctly predicted instances out of the total instances, providing a measure of the overall effectiveness of each model.
The red line represents the F1 Score (weighted) of each model. The F1 Score is the harmonic mean of precision and recall, and the weighted version accounts for the support (the number of true instances) of each class, offering a balanced measure of a model’s accuracy in classifying different categories.
This visual representation clearly illustrates the degree of improvement achieved by the Feedback-Based Validation Learning (FBVL) model compared to a simple neural network architecture (NNA) without FBVL. The FBVL model shows superior performance in both accuracy and F1 Score (weighted), highlighting its effectiveness in enhancing model performance through the integration of real-time feedback from validation datasets. This comparison underscores the robustness and reliability of FBVL in various tasks, setting a new benchmark for future research in this domain.
As shown in
Table 13, the comparative evaluation highlights that the FBVL model demonstrates superior performance, achieving an Accuracy of 70.08%, alongside F1 Scores (micro and weighted) of 70.08% and 65.14%, respectively. This surpasses the accomplishments of SACL-LSTM [
9], M2FNet [
22], CFN-ESA [
23], EmotionIC [
24], UniMSE [
25], and MM-DFN [
26], as reported in their respective works introduced in 2022 and 2023. These advancements are indicative of FBVL’s robustness and its potential to redefine neural network training, potentially leading to more efficient and accurate models in the field of emotion recognition in conversations. The integration of the MELD [
1,
2] dataset, with its complex multi-party conversational data, was pivotal in validating the effectiveness of FBVL against the nuanced challenges presented in real-world datasets.
The graph in
Figure 8 provides a visual comparison of the performance of various models on the MELD [
1,
2] dataset, focusing on two key metrics: Accuracy (%) and F1 Score (weighted).
The blue line represents the Accuracy (%) of each model. This metric indicates the proportion of correctly predicted instances out of the total instances, providing a measure of the overall effectiveness of each model.
The red line represents the F1 Score (weighted) of each model. The F1 Score is the harmonic mean of precision and recall, and the weighted version accounts for the support (the number of true instances) of each class, offering a balanced measure of a model’s accuracy in classifying different categories.
This visual representation clearly illustrates the degree of improvement achieved by the Feedback-Based Validation Learning (FBVL) model compared to other methods. The FBVL model shows superior performance in both accuracy and F1 Score (weighted), highlighting its effectiveness in enhancing model performance through the integration of real-time feedback from validation datasets. This comparison underscores the robustness and reliability of FBVL in multimodal emotion recognition tasks, setting a new benchmark for future research in this domain.


