Article

Hybrid Machine Learning-Driven Automated Quality Prediction and Classification of Silicon Solar Modules in Production Lines

1
College of Materials Science and Engineering, Beijing University of Technology, Beijing 100124, China
2
Yingli Energy (China) Co., Ltd., Baoding 071051, China
3
National Key Laboratory of Photovoltaic Materials and Cells, Yingli Energy Development Co., Ltd., Baoding 071000, China
*
Authors to whom correspondence should be addressed.
These authors contributed equally to this work.
Computation 2025, 13(5), 125; https://doi.org/10.3390/computation13050125
Submission received: 8 April 2025 / Revised: 15 May 2025 / Accepted: 16 May 2025 / Published: 20 May 2025
(This article belongs to the Topic Advances in Computational Materials Sciences)

Abstract

:
This research introduces a novel hybrid machine learning framework for automated quality prediction and classification of silicon solar modules in production lines. Unlike conventional approaches that rely solely on encapsulation loss rate (ELR) for performance evaluation—a method limited to assessing encapsulation-related power loss—our framework integrates unsupervised clustering and supervised classification to achieve a comprehensive analysis. By leveraging six critical performance parameters (open circuit voltage (VOC), short circuit current (ISC), maximum output power (Pmax), voltage at maximum power point (VPM), current at maximum power point (IPM), and fill factor (FF)), we first employ k-means clustering to dynamically categorize modules into three performance classes: excellent performance (ELR: 0–0.77%), good performance (0.77–8.39%), and poor performance (>8.39%). This multidimensional clustering approach overcomes the narrow focus of traditional ELR-based methods by incorporating photoelectric conversion efficiency and electrical characteristics. Subsequently, five machine learning classifiers—decision trees (DT), random forest (RF), k-nearest neighbors (KNN), naive Bayes classifier (NBC), and support vector machines (SVMs)—are trained to classify modules, achieving 98.90% accuracy with RF demonstrating superior robustness. Pearson correlation analysis further identifies VOC, Pmax, and VPM as the most influential quality determinants, exhibiting strong negative correlations with ELR (−0.953, −0.993, −0.959). The proposed framework not only automates module quality assessment but also enhances production line efficiency by enabling real-time anomaly detection and yield optimization. This work represents a significant advancement in solar module evaluation, bridging the gap between data-driven automation and holistic performance analysis in photovoltaic manufacturing.

1. Introduction

In the context of the global energy transition and the increasingly severe issue of climate change, solar energy, as a clean and renewable energy source, has garnered widespread attention for its applications and efficiency improvements. Consequently, photovoltaic (PV) cells have become a popular research focus. Among these, monocrystalline silicon cells hold a significant position in the solar cell market due to their relatively high energy conversion efficiency and long lifespan [1]. However, monocrystalline silicon cells need to be encapsulated into modules in series to generate stable and reliable power. Therefore, studying the performance and key influencing factors of monocrystalline silicon modules has become an important issue [2,3]. Currently, the power loss from monocrystalline silicon cells to modules is evaluated by ELR, which is expressed as the percentage of the total power output of the module relative to the sum of the power of the individual cells (CTM). A higher CTM value indicates a lower degree of power loss during encapsulation, meaning a lower ELR. However, solely relying on ELR to evaluate module performance has certain limitations, as it mainly focuses on power loss during the encapsulation process. Such conventional methods often fail to account for the varying production capacities and quality distributions across different production lines. In addition, the performance of monocrystalline silicon modules is influenced by various factors, including the conversion efficiency of the cells, the optical performance of the module, electrical performance, thermal performance, and long-term stability. Therefore, accurately predicting the performance of monocrystalline silicon modules by comprehensively considering their optical and electrical performance, alongside the encapsulation loss rate, is crucial for achieving commercialization.
In recent years, with the rapid development of big data and artificial intelligence technologies, machine learning has been widely applied in fields such as material science [4,5,6,7,8], energy engineering [9,10,11], and production process optimization [12,13,14]. In the research of solar cells, machine learning has particularly demonstrated its advantages in data analysis and predictive model construction. This technological edge has been reflected in several recent studies, each highlighting the unique advantages of machine learning in solar cell research. For example, Mahmood et al. [15] explored the challenges in data-driven material design, especially in the field of organic solar cells. Fu et al. [16] proposed a deep learning-based quality assessment algorithm for defect detection in mono-like cast silicon wafers (MLC-Si), showing that their improved MVGG-19 network model achieved a 63% lower prediction error compared to the traditional VGG-19 model, demonstrating higher efficiency and accuracy. Buratti et al. [17] successfully predicted temperature-dependent defect parameters in silicon solar cells using deep learning techniques, overcoming the limitations of traditional methods. Additionally, Jaiswal et al. [18] utilized machine learning for the optimization and quality prediction of commercial silicon solar cells, enhancing prediction accuracy and reducing computational costs. These studies indicate that machine learning can not only improve the production efficiency of solar cells but also optimize device performance through precise prediction and quality control.
In particular, in the prediction of the encapsulation loss rate of monocrystalline silicon cells, studies have successfully applied classification algorithms such as decision trees and random forests to predict energy loss during the encapsulation process by analyzing production and testing data. Kamat et al. [19] modeled the characteristics of randomly textured series-connected silicon solar cells using a decision tree model, successfully revealing the strong correlation between key parameters such as the “fill factor” and “a-Si layer thickness” with cell efficiency. Biau et al. [20] conducted an in-depth analysis of the statistical properties of the random forest model. They demonstrated that the model is consistent and adapts to sparsity, with its convergence rate depending only on the number of strong features rather than the number of noise variables. This characteristic shows its potential in handling high-dimensional data scenarios where sparse data are common. Furthermore, Nagy et al. [21] used ensemble models to accurately predict the probability distribution of solar and wind power generation, showcasing the potential of this method in energy loss prediction. Scornet et al. [22] discussed the consistency of random forests in the context of additive regression models. They pointed out that although random forests are widely used in practice, their mathematical properties are not well-understood due to the complexity of analyzing the randomization process and tree structure simultaneously. Additionally, artificial neural networks [23] and neural network models optimized by genetic algorithms [24] have shown higher accuracy and robustness in handling non-linear and complex relationships, making these methods more comprehensive in terms of prediction accuracy and application scope.
In this paper, we develop an innovative hybrid machine learning method for predicting and analyzing the performance of monocrystalline silicon solar modules. Unlike conventional approaches limited to ELR evaluation, our framework integrates unsupervised clustering (k-means) and supervised classification (e.g., random forest) to achieve holistic quality assessment. Initially, clustering algorithms categorize production line modules into three groups: “excellent performance” (Class 1), “good performance” (Class 2), and “poor performance” (Class 3), based on six critical parameters (VOC, ISC, Pmax, VPM, IPM, FF), enabling dynamic classification that reflects both photoelectric conversion efficiency and encapsulation loss. This classification leverages observed production data to dynamically assess module quality, overcoming the narrow scope of traditional ELR-centric methods. Subsequently, a suite of machine learning models—including DT, RF, SVM, KNN, and NBC—are employed to further classify and predict module performance. Among these, RF demonstrated superior robustness, achieving 98.90% accuracy in classification, significantly outperforming existing evaluation methods. The generalization capabilities of these models are thoroughly assessed to ensure robust performance predictions. Finally, the Pearson correlation coefficient analysis is utilized to identify and examine the critical factors impacting module performance, revealing VOC, Pmax, and VPM as dominant determinants with strong negative correlations to ELR (r = −0.953, −0.993, and −0.959, respectively), providing actionable insights for process optimization. The proposed framework not only enhances real-time anomaly detection in production lines but also offers a scalable solution to improve yield management and reduce waste in photovoltaic manufacturing, bridging the gap between academic research and industrial application.

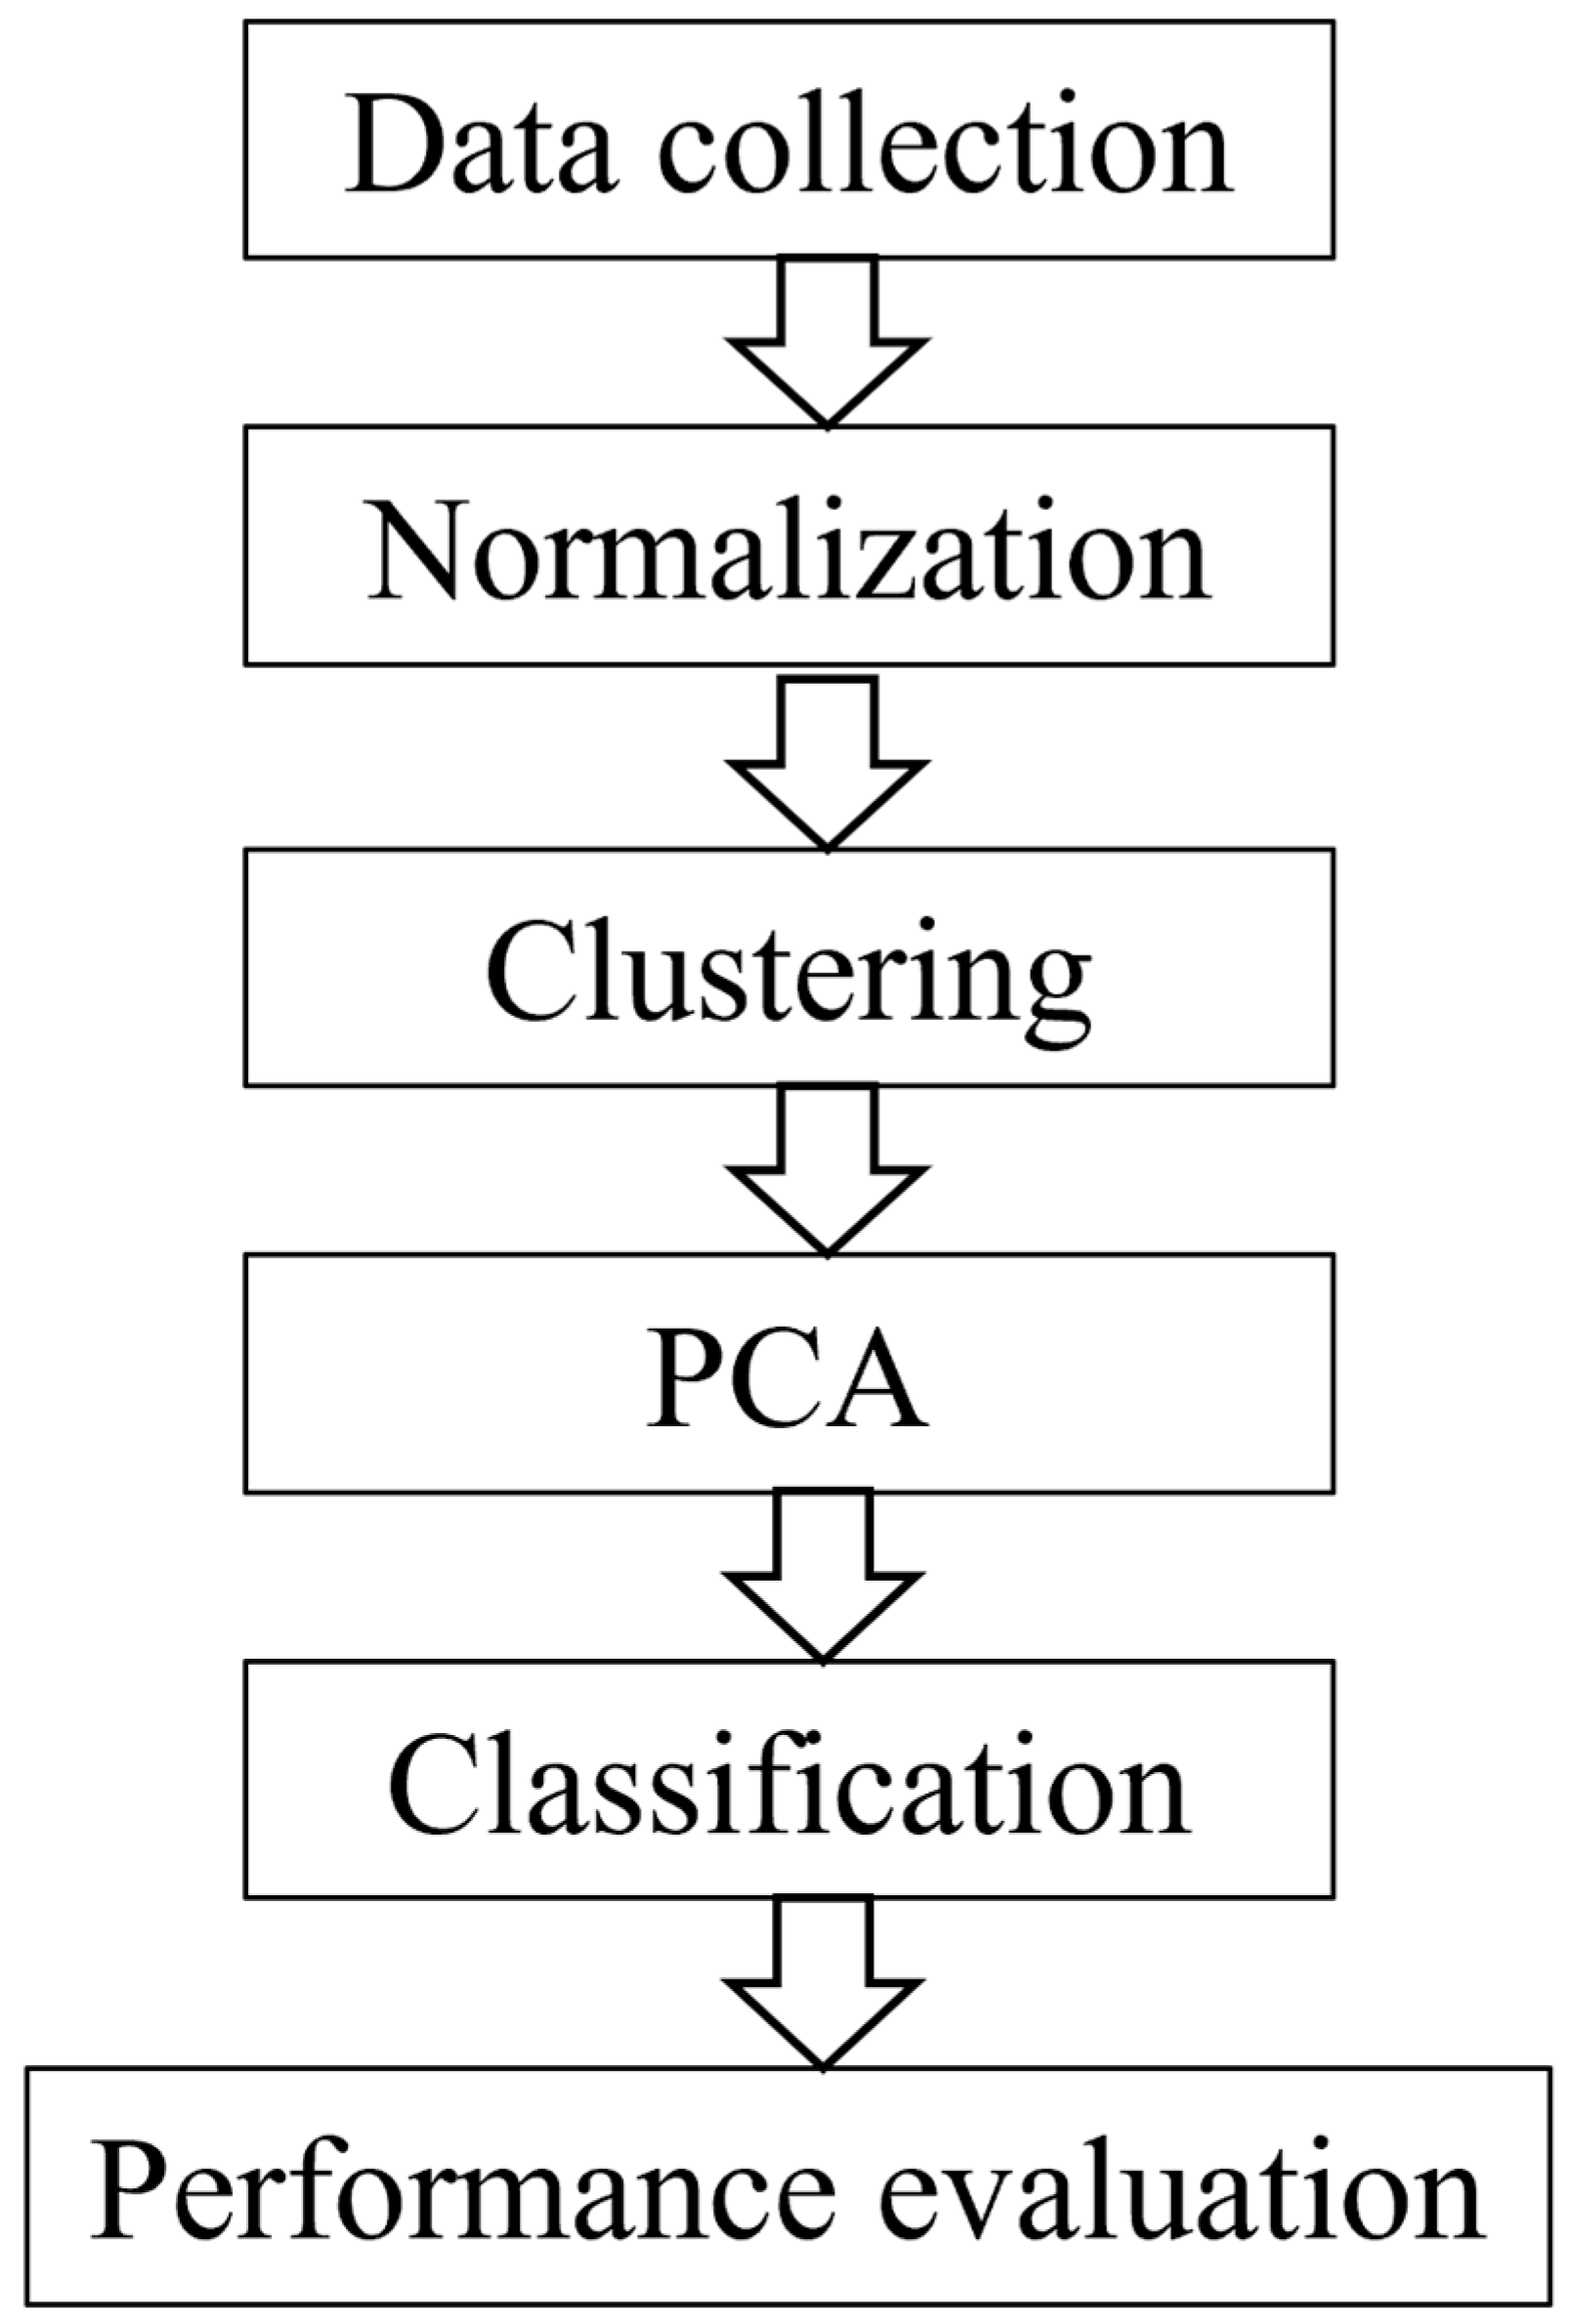
2. Data Processing and Theoretical Foundations

In this section, the subjects analyzed in this experiment and the data collection methods are presented. Different machine learning methods are used in the study for clustering and classification discussion. And the methodologies of monocrystalline silicon module performance testing and the performance evaluation indexes are described.
All machine learning workflows were executed in MATLAB R2020a using built-in functions for clustering (k-means), dimensionality reduction (principal component analysis (PCA)), and classification.

2.1. Data Processing

Through the performance testing of encapsulated monocrystalline silicon modules, the VOC, ISC, Pmax, VPM, IPM, FF, and ELR of the cells are recorded, and the data are filtered and divided, and are used for the clustering and classification machine learning process.
The overall workflow of our hybrid machine learning framework follows a systematic pipeline (Figure 1) comprising six key stages: (1) data collection of module performance parameters from production line testing, (2) normalization to ensure feature comparability, (3) unsupervised clustering for initial quality categorization, (4) dimensionality reduction via PCA to enhance computational efficiency, (5) supervised classification for performance prediction, and (6) comprehensive performance evaluation through statistical metrics and correlation analysis.

2.2. Monocrystalline Silicon Photovoltaic Module Performance Analysis Methods

2.2.1. Performance Parameters

The performance parameters of monocrystalline silicon photovoltaic modules are the key indicators for evaluating their photovoltaic conversion efficiency and power generation performance, of which the typical performance parameters include photovoltaic conversion efficiency, fill factor, open circuit voltage, short circuit current, maximum output power, maximum output power point voltage, maximum output power point current, and encapsulation loss rate. These parameters are calculated as follows:
(1)
Photoelectric conversion efficiency. Photoelectric conversion efficiency is an important parameter that measures the ability of a solar cell or photoelectric conversion material to convert light energy into electricity, usually expressed as a percentage and calculated by the formula [25]:
η = P m a x E s u n × A × 100 %
where P m a x is the maximum output power of the monocrystalline silicon module, E s u n denotes the solar irradiance per unit area (W/m2), and A is the total area of the monocrystalline silicon module.
(2)
Encapsulation loss rate. E L R refers to the difference between the actual power and the theoretical power of PV cells after they are encapsulated in series into a module, usually expressed as a percentage and calculated by the formula [26]:
E L R = 1 C T M
C T M = P m a x P × 100 %
wherein E L R denotes the encapsulation loss rate from cell to module, and C T M is used to measure the efficiency loss brought about by the encapsulation of the cell into the module, which is expressed by the ratio of the actual maximum output power of the module to the theoretical sum of the power of the cell, P, so as to calculate the encapsulation loss rate from the cell to the module, and the higher the value of C T M , the lower the degree of loss of encapsulated power of the module is indicated.
(3)
Short circuit current. I S C reflects the maximum current generated by a solar cell when its external circuit is shorted (i.e., load resistance is zero). It is primarily determined by the photogenerated carrier density and collection efficiency. Specifically, the short-circuit current increases with enhancing light intensity, as expressed by the following relationship:
I S C = I L I 0 e q V O C n k T 1
I L represents the photogenerated current, I 0 denotes the reverse saturation current, q is the elementary charge, n refers to the diode ideality factor, k corresponds to the Boltzmann constant, and T indicates the absolute temperature. The photogenerated current ( I L ) exhibits a direct proportional relationship with I S C , where an increase in I L leads to a corresponding rise in I S C .
(4)
Open circuit voltage. VOC of a solar cell represents the maximum output voltage under no external load (i.e., an open circuit condition). It reflects the ultimate potential difference generated by photogenerated carrier separation, which is determined by both the intrinsic properties of the semiconductor material (e.g., bandgap) and device parameters (e.g., diode characteristics, series resistance). Notably, V O C exhibits significant temperature dependence: as the operating temperature increases, lattice thermal expansion and enhanced electron–phonon interactions reduce the semiconductor bandgap, thereby directly suppressing V O C . This relationship is quantitatively described by the following:
V O C = V O C 0 K V T T 0
In the equation, V O C 0 represents the reference open circuit voltage at the reference temperature T 0 (typically 25 °C), while K V denotes the voltage temperature coefficient, defining the voltage variation per degree of temperature change. Here, T indicates the current operating temperature. As the operational temperature of photovoltaic cells increases, V O C decreases, thereby reducing the output voltage under high-temperature conditions and consequently degrading the overall system efficiency.
(5)
Filling factor. FF reflects to a certain extent the effective filling degree of photogenerated charge carriers inside the cell and is an important parameter for measuring the output characteristics of solar cells. The closer its value is to 100%, the better the performance of the cell. The formula [27] is as follows:
F F = V P M × I P M V O C × I S C × 100 %
where FF denotes the fill factor, and VPM and IPM denote the maximum output power point voltage and maximum output power point current, respectively.

2.2.2. Performance Evaluation Indicators

The performance of monocrystalline silicon modules is comprehensively evaluated through several key parameters, including VOC, ISC, VPM, IPM, Pmax, and FF. These parameters not only reflect the photoelectric conversion efficiency and output capability of the modules but also indicate their stability, material quality, and manufacturing process standards.
In contrast, while ELR is important, it only assesses the energy loss during the encapsulation process and fails to provide a holistic view of the module’s overall performance. The aforementioned parameters form a multidimensional evaluation system, enabling a more accurate assessment of the module’s power generation capacity, economic efficiency, and potential issues in real-world applications.
Therefore, by comprehensively considering these parameters, we can gain a more thorough understanding of the performance of monocrystalline silicon modules. This insight supports the optimization of module design, enhances performance, and guides practical applications effectively. This paper explores the application of machine learning techniques to predict and analyze the performance of monocrystalline silicon modules. By using a multidimensional evaluation framework, we aim to provide robust methods for improving the overall performance and economic benefits of these modules, offering valuable support for the solar energy industry.

2.3. Machine Learning Methods

2.3.1. Clustering and Dimensionality Reduction Algorithms

The samples are clustered and analyzed according to a single seal loss rate as well as performance test data with multidimensional features using clustering algorithm.
Clustering as an unsupervised learning algorithm is used to divide the samples in a dataset into groups or clusters such that samples within the same cluster are as similar as possible and samples in different clusters are as different as possible. One of these algorithms, k-means clustering, is based on a distance metric (e.g., Euclidean distance) to assign data points to the nearest cluster centers and minimize the sum of intra-cluster variance by iteratively optimizing the location of cluster centers. Such algorithms are popular for their simplicity as well as ease of implementation and fast convergence in most cases. When processing multi-dimensional data samples, in order to better visualize and analyze the data, a dimensionality reduction algorithm is usually used to map the high-dimensional data to a low-dimensional space. PCA, as a widely used linear dimensionality reduction technique, reduces the dimensionality of the data by preserving the main features (i.e., principal components) in the data while retaining as much as possible the important information of the data. PCA was selected for dimensionality reduction due to its computational efficiency, interpretability, and ability to preserve global variance—critical for handling large-scale production data. Unlike t-SNE or UMAP, which prioritize local non-linear structures, PCA’s linear transformation aligns with our goal of identifying dominant performance parameters for real-time quality assessment. PCA was applied globally to the normalized dataset to ensure consistent feature space representation across all modules. The choice of PCA over non-linear alternatives (e.g., t-SNE, UMAP) was further validated by its superior performance in retaining 95% of the original variance with fewer components, as required for efficient clustering and classification.

2.3.2. Classification Algorithm

After conducting clustering analysis on samples in both dimensions, it was observed that the samples clustered based on multidimensional features exhibited not only good differentiation in terms of ELR but also a more comprehensive performance evaluation compared to relying solely on ELR. By using these clustered results to categorize the samples, various classification methods—including RF, DT, SVM, KNN, and NBC—were applied to process the data, aiming to train models with strong generalization capabilities for predicting and analyzing the comprehensive performance of monocrystalline silicon modules.
DT is a common machine learning method. As a non-parametric supervised learning algorithm, DT simulates the human decision-making process through a tree structure, consisting of internal nodes (decision nodes) and leaf nodes (classification or regression outcomes). Each internal node represents a test on an attribute, and each branch represents a possible outcome of the test. DT is advantageous due to its ease of understanding, high accuracy, and good visualization. Constructed based on the classification and regression trees (CART) algorithm, DT employs a greedy algorithm to select and split input variables, minimizing the cost function during this process. Splitting typically terminates when the count of training instances reaches a minimum threshold. Finally, tree pruning is employed to cut redundant leaf nodes and enhance performance. In this study, we utilized the fitctree function to create a decision tree model. We did not explicitly set hyperparameters such as the maximum depth and the minimum number of samples required to be at a leaf node; instead, we adopted the default parameters. The decision tree model under the default settings can be rapidly constructed and used for classification prediction. In the experiments of this study, it also achieved good results, with an accuracy rate of 98.13%.
RF builds on the concept of decision trees by using bagging integration and introducing random attribute selection during the training of decision trees. The output of RF is based on the majority decision of the trees in the forest, making RF less prone to overfitting compared to single decision trees. In this study, the RF method is applied to the classification problem of ELR and compared with other methods. When constructing the RF model, we used the fitcensemble function with the option ‘Method’, ‘Bag’ to create a bagging-based RF classifier. In the current phase, an RF model was used with default hyperparameters, as preliminary experiments showed remarkable performance (98.90% accuracy), meeting the basic requirements. In future work, hyperparameter optimization (e.g., grid search or random search) will be explored to further improve predictive accuracy. Key parameters such as the number of trees and feature selection criteria will be tuned to enhance the model’s effectiveness in predicting silicon solar module performance.
SVM is a supervised machine learning algorithm used for classification problems. SVM separates different classes of samples in the training set by dividing the sample space with a hyperplane that maximizes the margin between the two classes. The hyperplane is chosen based on the extreme points, known as support vectors, hence the name SVM. In this context, the hyperplane is found by maximizing the distance between two classes using a kernel function. When training the SVM model, we specified the training parameters as options = ‘-s 0 -t 2 -c 0.25 -g 0.01’. The support vector machine (SVM) model’s training parameters, namely “-s 0 -t 2 -c 0.25 -g 0.01”, were determined based on prior experience and preliminary experiments. Specifically, “-s 0” selects the C-Support Vector Classification (SVC) classification model, while “-t 2” chooses the radial basis function (RBF) as the kernel function. The RBF kernel function was selected because it excels in handling non-linear classification problems and is well-suited to the complex data patterns encountered in the performance classification of silicon solar modules in this study. The parameter “-c 0.25” sets the penalty parameter C, which serves to balance classification errors and model complexity, and “-g 0.01” represents the coefficient of the RBF kernel function. Nevertheless, the experimental results indicate that the performance of the SVM model in certain categories (e.g., Class 2) remains suboptimal and can be further improved. In future research, grid search or random search algorithms will be employed to systematically optimize these hyperparameters, aiming to identify the optimal parameter combination and thereby enhance the overall performance of the model.
KNN is a simple yet powerful non-parametric classification method. KNN makes predictions based on the information of the k-nearest neighbors. During the training phase, labeled data are stored in a database. When handling classification problems, new data points are classified based on the majority vote of their k-nearest neighbors, where k is a user-defined parameter. We used the fitcknn function to build the KNN model. In this experiment, we set k = 5. This value was determined based on experience and preliminary experiments. In the future, we will conduct a comprehensive search for the value of k through cross-validation to optimize the model.
NBC is a probabilistic classifier based on Bayes’ theorem, assuming independence among features given the class label. Despite this assumption often being violated in practical applications, it greatly simplifies the computation process. As a result, the naive Bayes classifier is advantageous for its simple logic, ease of implementation, and high classification efficiency. In this study, the fitcnb function was used to create a naive Bayes classifier. Currently, the default hyperparameters are adopted. In the follow-up, the impact of different settings such as smoothing parameters on the model performance will be explored.
This paper explores the application of these machine learning techniques for the prediction and analysis of the performance of monocrystalline silicon modules. By utilizing a multidimensional evaluation framework, we aim to provide robust methods for improving the overall performance and economic benefits of these modules, offering valuable support for the solar energy industry.

3. Results and Discussion

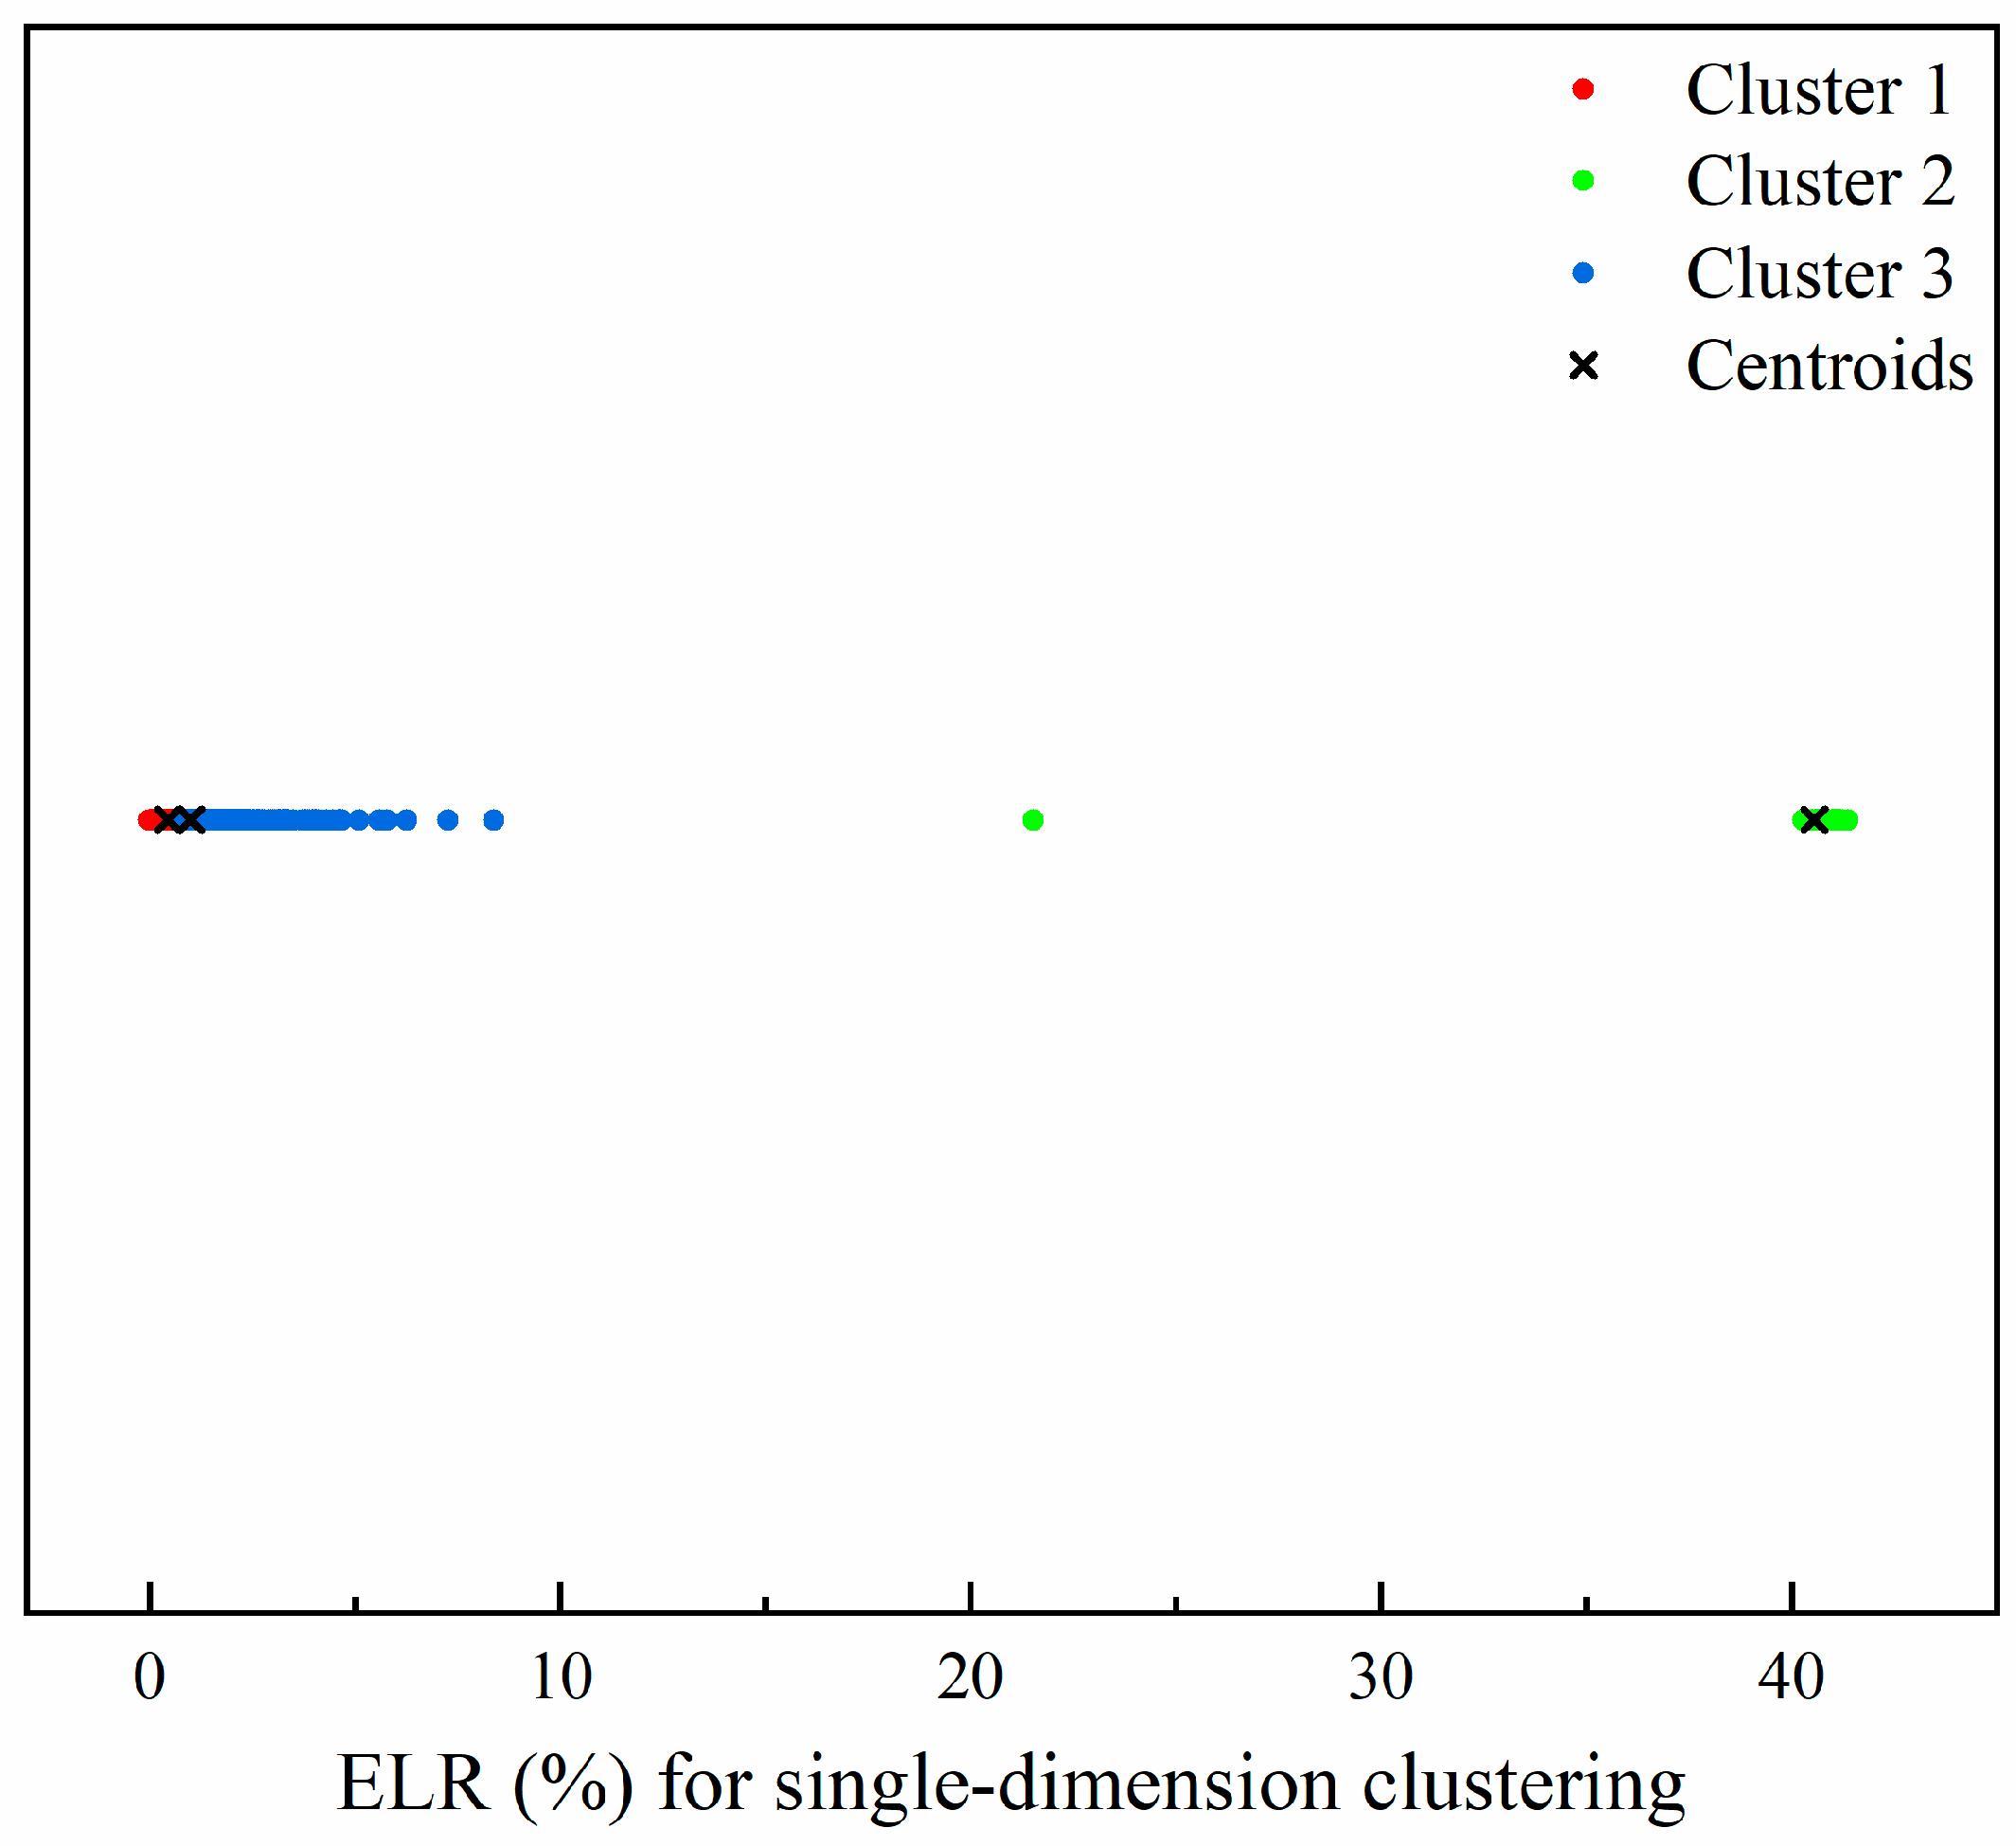
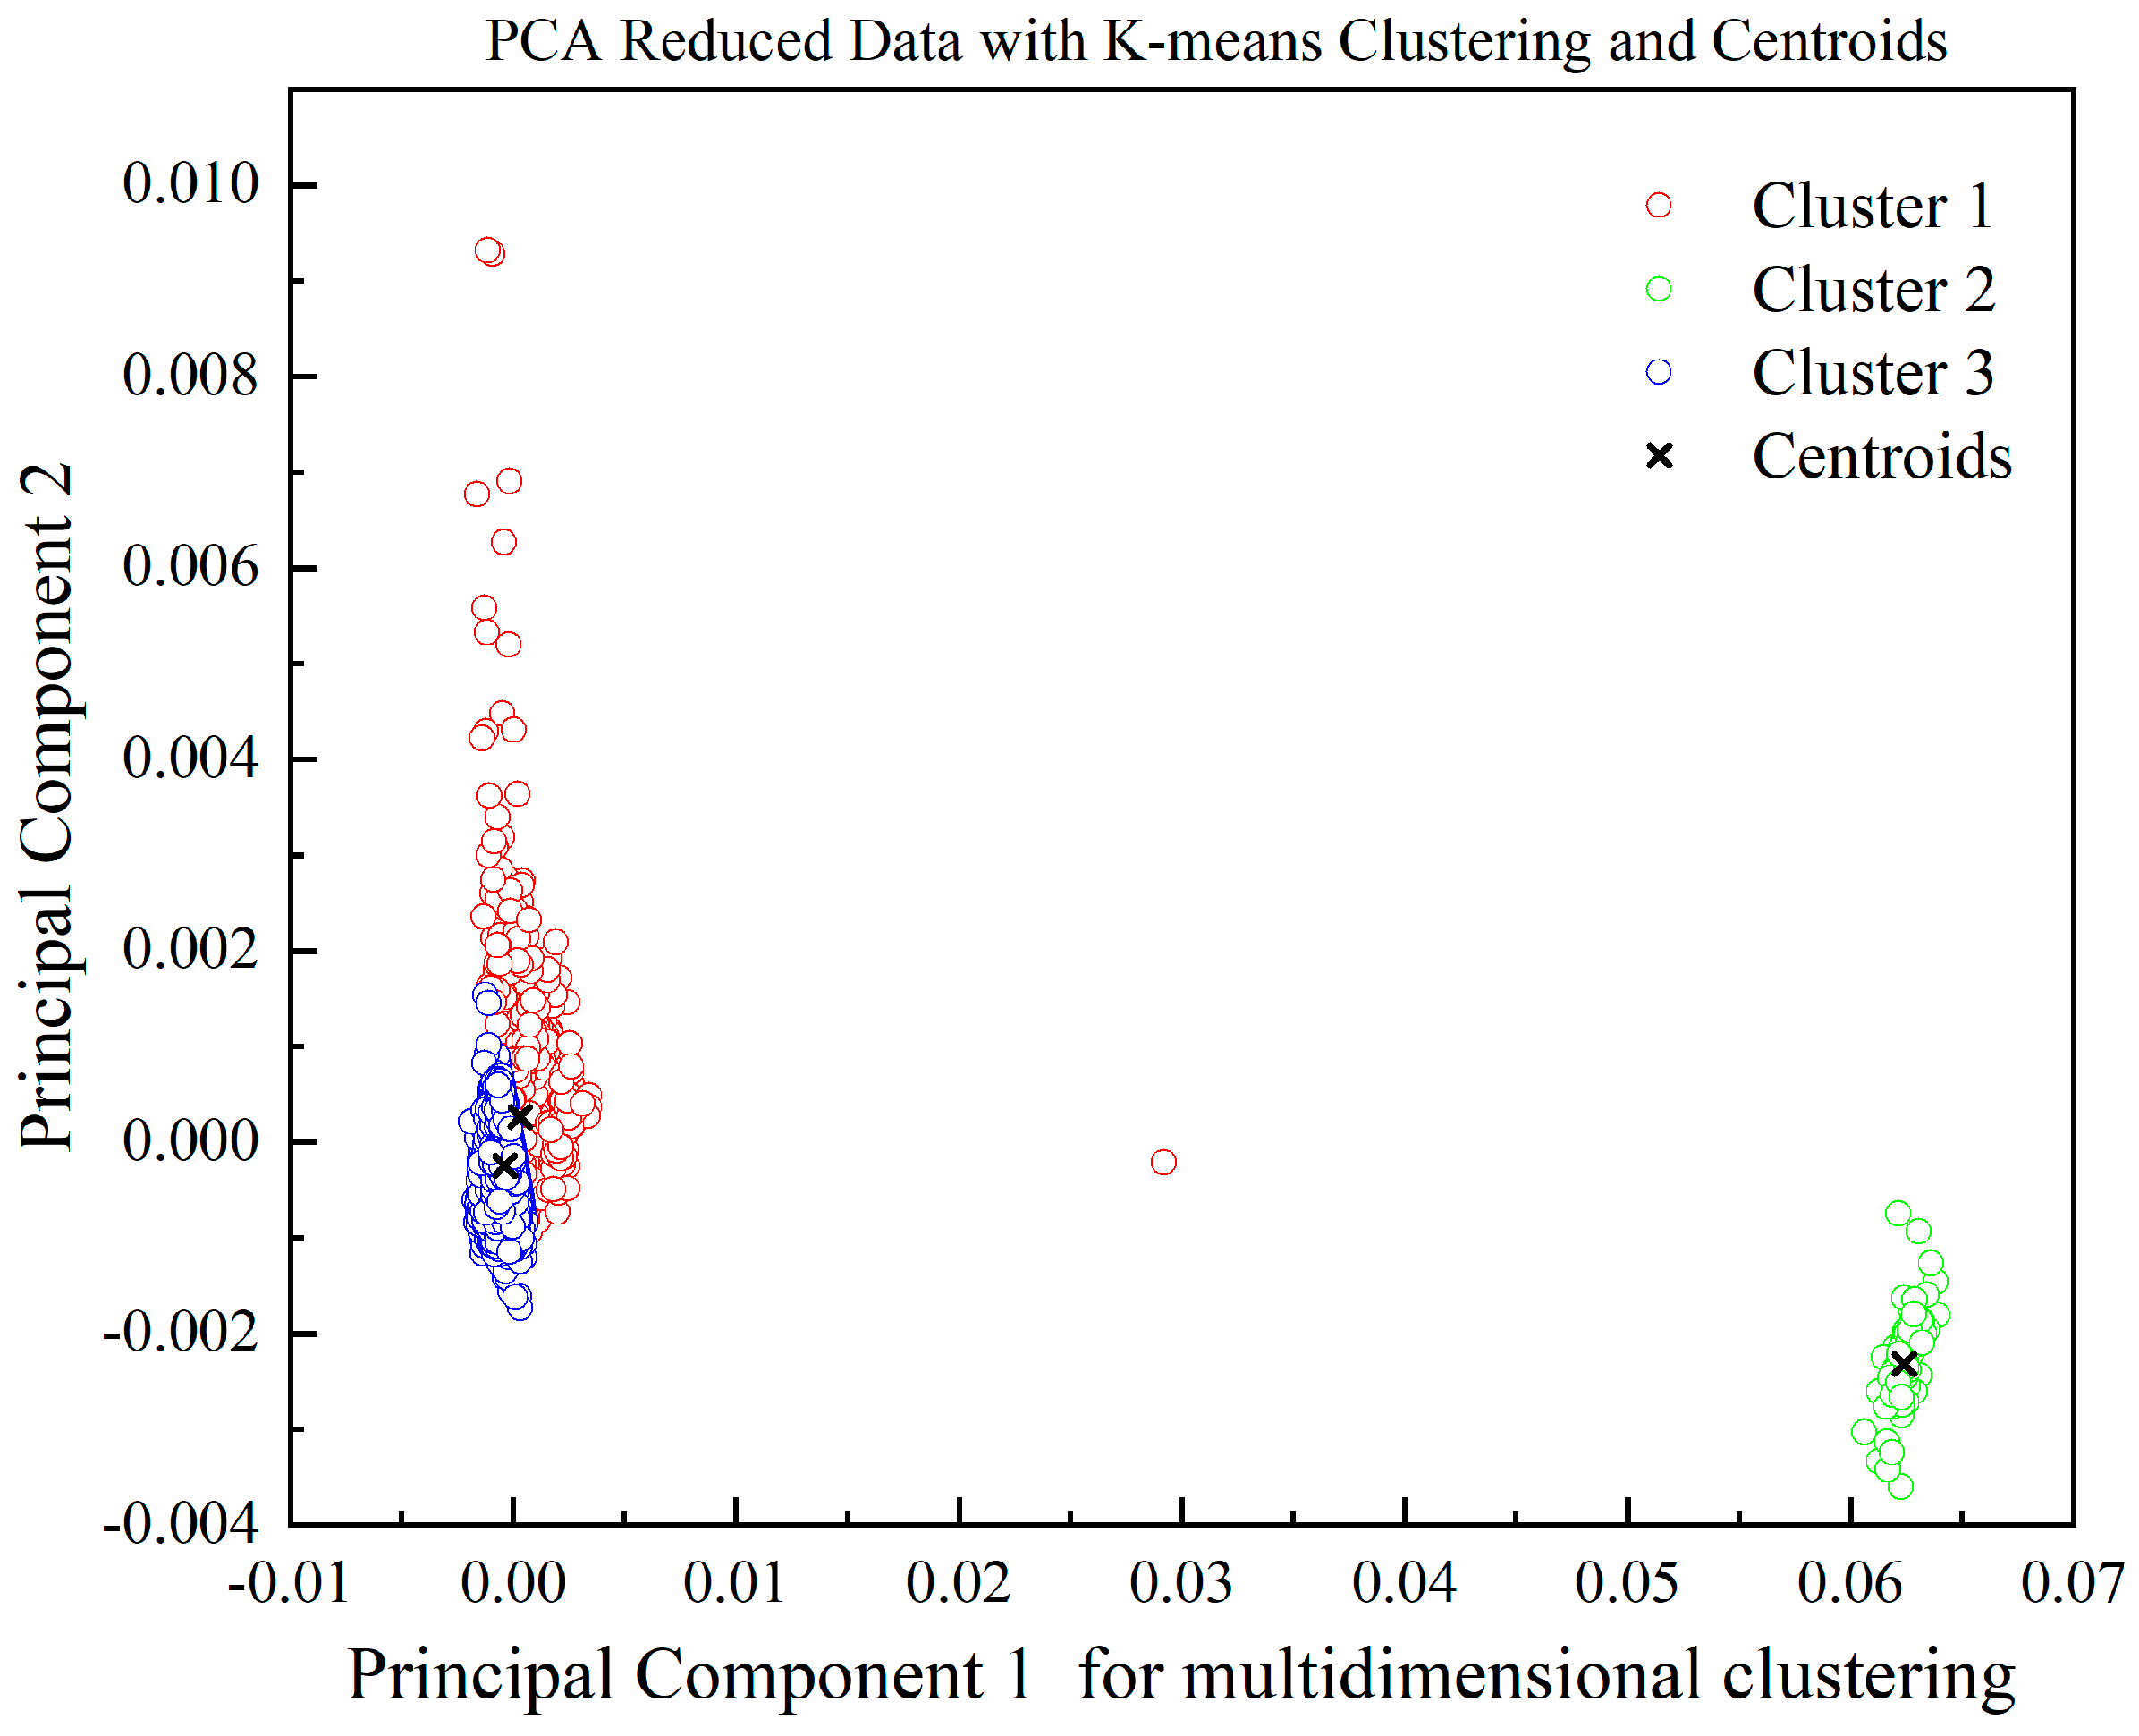
3.1. Cluster Analysis

The experiment included a total of 119,654 valid samples. Initially, all samples were subjected to k-means clustering based solely on the ELR, with k set to 3. The samples were divided into three categories according to ELR: 0–0.74%, 0.74–8.39%, and >8.39%, as shown in Figure 2. The distribution of samples was 59.47% for the 0–0.74% range, 40.46% for the 0.74–8.39% range, and the remainder for >8.39%. Although clustering based on a single ELR dimension can reflect the encapsulation quality or some form of damage to monocrystalline silicon modules, it does not comprehensively and accurately assess overall performance, as the evaluation dimension is relatively narrow. The ELR does not directly reflect photoelectric conversion efficiency, one of the core performance indicators of solar cell modules.
To more comprehensively and accurately reflect the overall performance of monocrystalline silicon solar modules, this experiment utilized six performance indicators from factory tests—VOC, ISC, Pmax, VPM, IPM, and FF—for multidimensional data analysis. After normalizing and performing PCA for dimensionality reduction, k-means clustering was applied again with k set to 3. The results are shown in Figure 3. The study demonstrated that clustering using multidimensional features achieved results comparable to single-parameter ELR-based clustering while enabling more accurate classification of monocrystalline silicon modules based on their overall performance. The corresponding ELR ranges were 0–0.77%, 0.77–8.39%, and >8.39%, with sample distributions of 64.17%, 35.76%, and the remainder, respectively. These results were generally consistent with the single ELR-based clustering but offered more practical application value by incorporating photoelectric conversion efficiency into the analysis. Thus, clustering based on multidimensional data provides a more accurate reflection of the overall performance of monocrystalline silicon modules, compared to analysis based solely on the ELR.

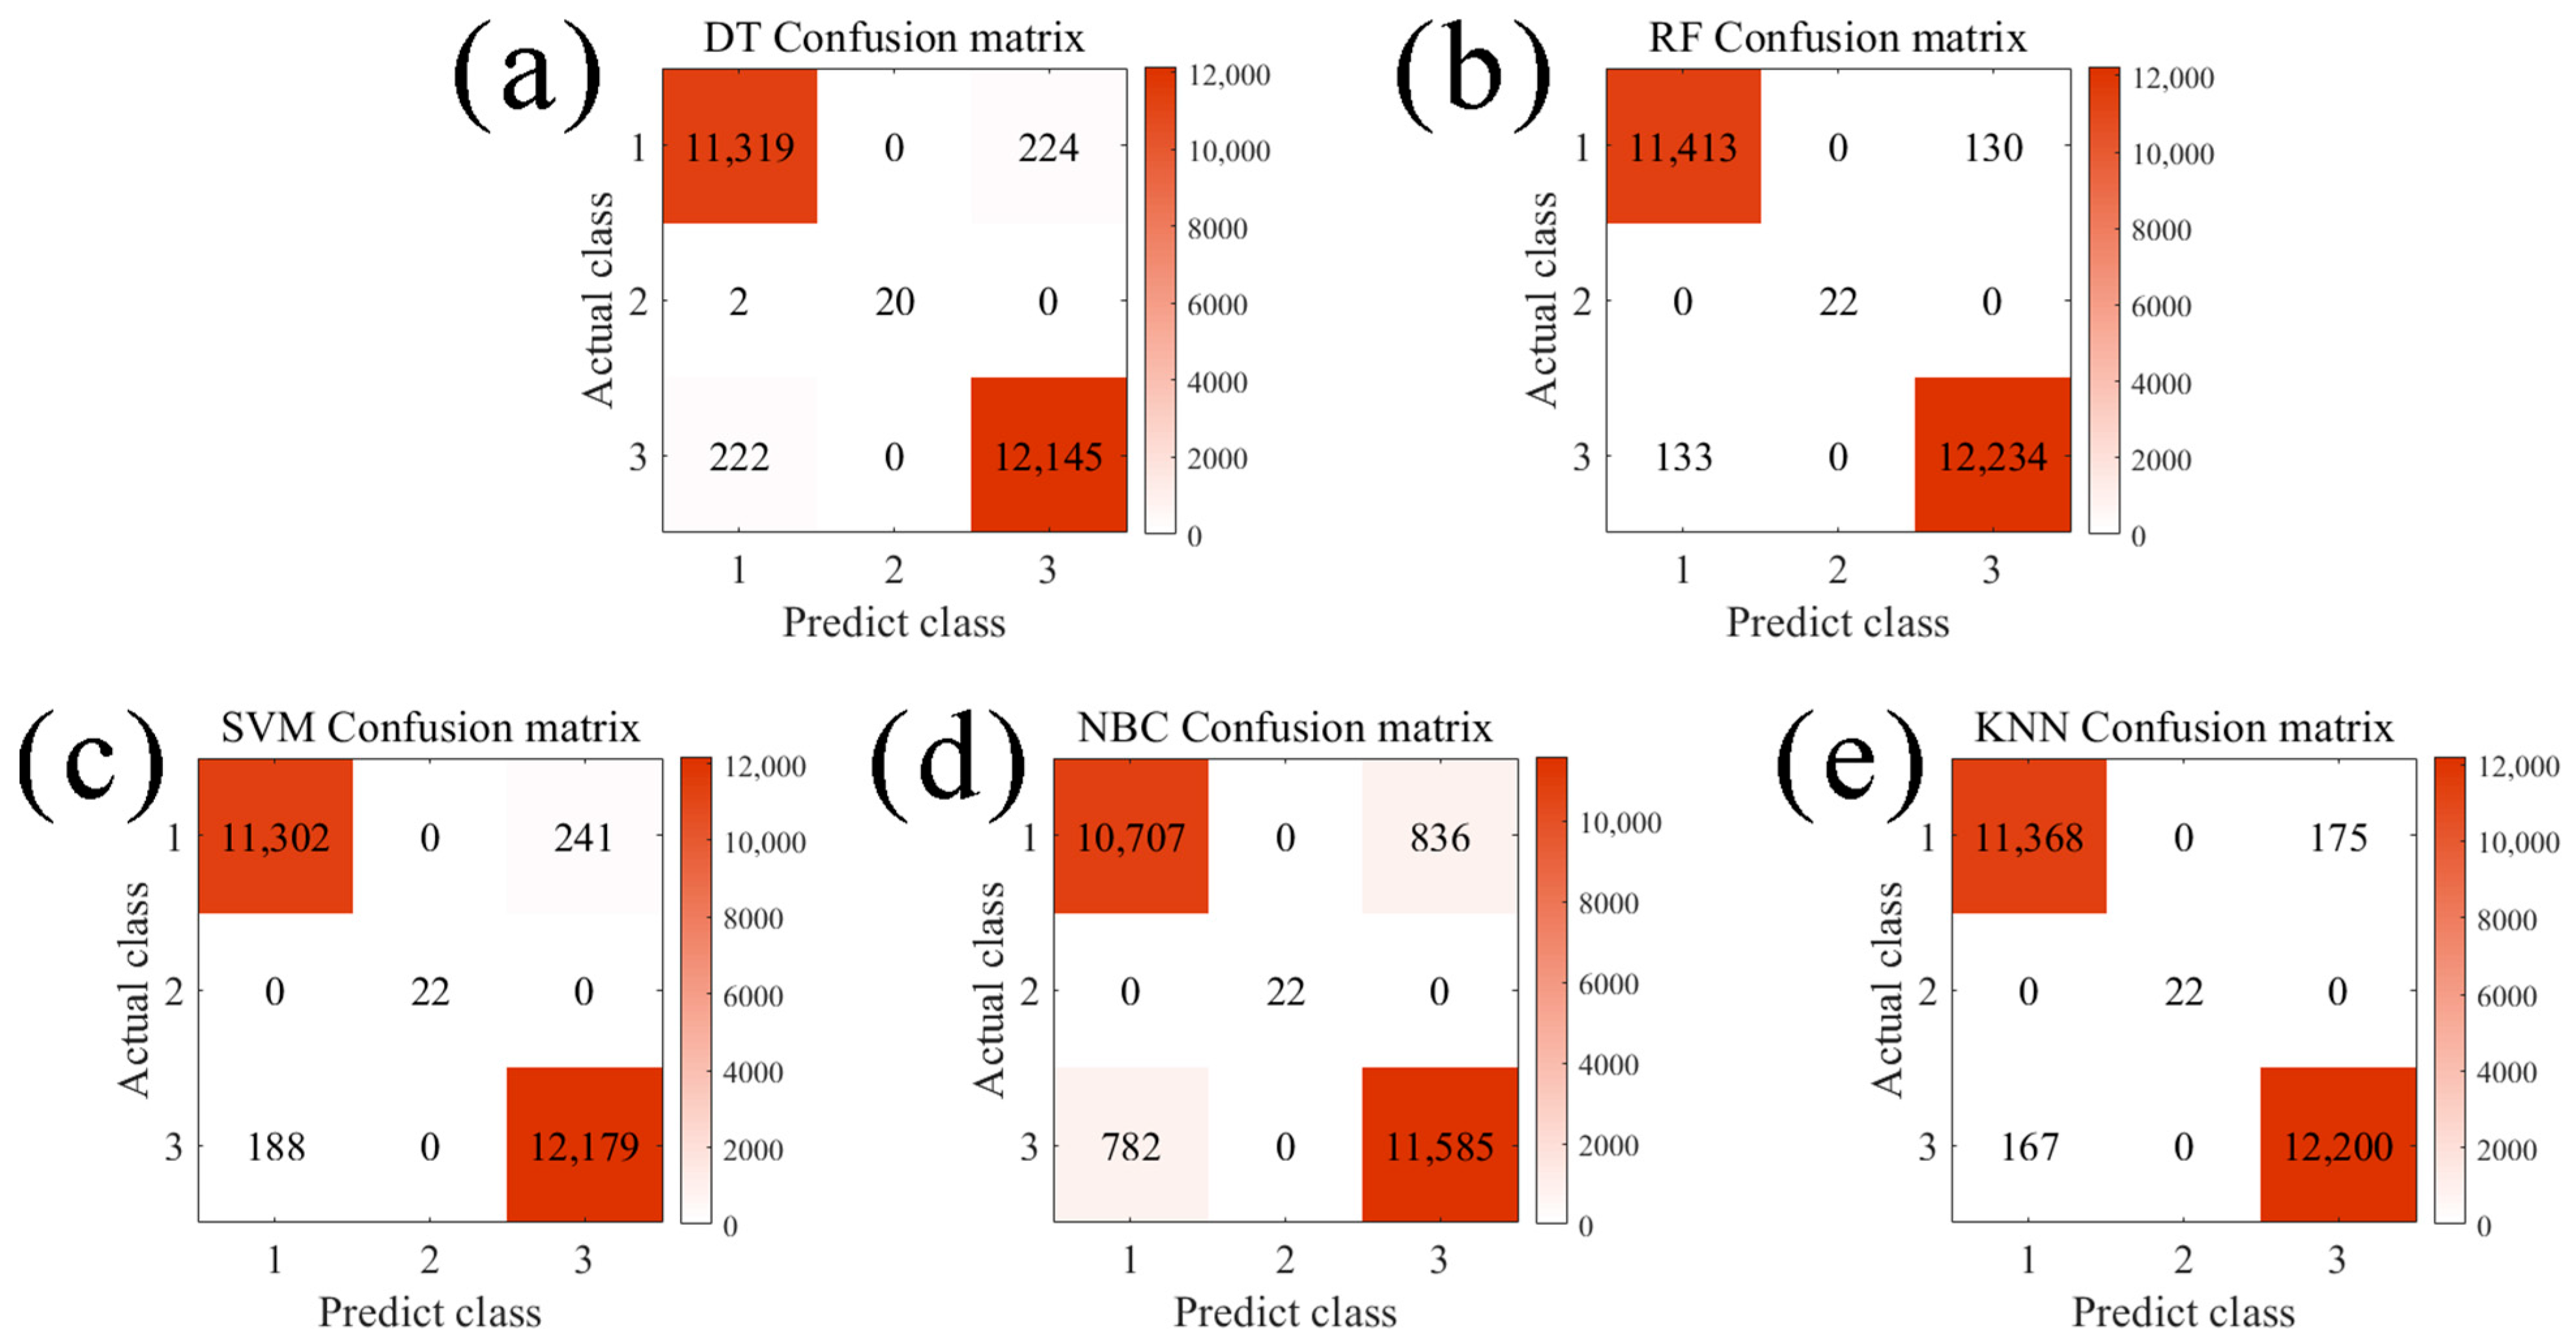
3.2. Classification Algorithm Predicts Overall Performance of Monocrystalline Silicon Modules

To visualize the strength and direction of the linear relationships between variables, this study plotted Pearson correlation coefficient diagrams, as shown in Figure 4. The Pearson correlation coefficients between the open circuit voltage (VOC), maximum output power (Pmax), and maximum output power point voltage (VPM) and encapsulation loss rate (ELR) are −0.953, −0.993, and −0.959, respectively. These values indicate a strong negative correlation among these variables, meaning that as VOC, Pmax, and VPM increase, the encapsulation loss rate tends to decrease. Among all features, VOC, Pmax, and VPM exhibit the highest linear correlations with ELR. The Pearson correlation coefficients between VOC, Pmax, VPM, and ELR are −0.953 (95% confidence interval (CI): −0.9542 to −0.9523), −0.993 (95% CI: −0.9932 to −0.9929), and −0.959 (95% CI: −0.9594 to −0.9585), respectively, confirming statistically significant (p < 0.001) strong negative correlations.
Additionally, the correlation coefficients between the FF and both Pmax and VPM are 0.682 and 0.700, respectively. These values signify a strong positive correlation, indicating that as Pmax increases, FF also increases significantly.
To address the limitations of evaluating monocrystalline silicon module performance based solely on encapsulation loss rate (ELR), this experiment utilized performance test data from the modules to train models. These models were then employed to assess the comprehensive performance of the modules, providing a more thorough and accurate evaluation of their overall capabilities. The 119,654 samples were categorized into three classes based on six performance features: excellent performance (Class 1), good performance (Class 2), and poor performance (Class 3).
The accuracy of various classification algorithms, including DT, RF, SVM, KNN, and NBC, was evaluated. The precision of these methods was calculated and compared. Additionally, k-fold cross-validation was employed to enhance model performance and generalization capability.
Cross-validation is a statistical method used to assess the performance of machine learning models, aiming to prevent overfitting and underfitting while providing an estimate of model generalization. The most commonly used cross-validation method is k-fold cross-validation. This approach involves dividing the dataset into k equal-sized subsets. In each iteration, one subset is used as the validation data, and the remaining k-1 subsets are used for training. This process is repeated k times, with each subset being used for validation once. The accuracy and recall rates from these k iterations are then computed to estimate model performance. In this study, a classic parameter of k = 5 was selected and applied to various classification methods to mitigate the risk of data overfitting, particularly given the relatively small size of the dataset.
The training and testing accuracy results of the different classification methods are presented in Table 1.
TPR is the true positive rate, also known as recall. PPV is the positive predictive value, also known as precision. Accuracy is the overall accuracy of the algorithm. Accuracy, TPR, and PPV can be calculated as follows:
A c c u r a c y = T P + T N T P + F P + F N + T N
T P R = T P T P + F N
P P V = T P T P + F P
F 1 = 2 T P 2 T P + F P + F N
where TP is the true positive value, TN is the true negative value, FP is the false positive value, and FN is the false negative value.
Table 1 shows the true positive rate (TPR), positive predictive value (PPV), and F1-score of five models, namely DT, RF, SVM, NBC, and KNN, across three categories (Cluster1, Cluster2, and Cluster3), as well as the overall accuracy of the models. The RF and KNN models perform relatively outstandingly, leading in most of the indicators with good stability and accuracy; the RF model achieved the highest accuracy of 98.90% (95% CI: 98.77–99.03%) with perfect F1-scores (100%) for Class 2, indicating exceptional generalizability. Other models exhibited slightly lower yet competitive performance, with KNN reaching an accuracy of 98.57% (95% CI: 98.42–98.72%). The DT model shows good overall performance but is slightly inferior; the SVM performs similarly to the DT, with room for improvement in the Cluster1 category; the NBC is relatively weak overall, especially in the Cluster1 category. From the perspective of categories, all models have strong recognition ability for Cluster2, and the classification of Cluster1 is more difficult with significant differences in model performance; for Cluster3, the overall classification ability of the models is relatively good, but there are still performance differences among the models. Overall, the RF demonstrated the highest accuracy rate of 98.90%. Figure 5 illustrates the ROC curves for different categories under various algorithms. The ROC curves show the performance of classification models across different thresholds, and the Area Under the Curve (AUC) has also been computed. As shown in Figure 5a, for Class 1, RF achieved the highest AUC value of 1. SVM and KNN also showed high AUC values of 0.999. For Class 2, all models except the SVM achieved an AUC of 1. The AUC for Class 2 in SVM is 0, mainly due to class imbalance (Class 2: 35.76%). For Class 3, the RF, DT, NBC, and KNN all achieved high AUC values above 0.9, whereas the AUC of the SVM was only 0.585, indicating that the SVM model performed better than random guessing but was not perfect. The random forest classifier achieved perfect classification performance (AUC = 1.0) across all categories, demonstrating excellent separability. In contrast, the support vector machine (SVM) failed to distinguish samples in category 2 (AUC = 0), indicating poor predictive capability for moderately performing modules.
Considering the overall accuracy and AUC values across clusters, RF demonstrated the best performance.
When evaluating the performance of classification models, the Confusion Matrix is an essential and intuitive tool. It displays the discrepancies between the model’s predictions and the actual outcomes, with each cell representing the combination of true and predicted classes. Figure 6 illustrates the confusion matrices of five classification models—DT, RF, SVM, KNN, and NBC—evaluated across three performance classes: excellent performance (Class 1), good performance (Class 2), and poor performance (Class 3). The DT model (Figure 6a) achieves a high Class 1 precision of 98.06% and Class 2 precision of 100.00%, but misclassifies 10% of Class 2 samples as Class 1, likely due to overlapping feature distributions in good performance modules and excellent performance modules. RF (Figure 6b) exhibits the highest diagonal concentration, with an overall accuracy of 98.90% and exceptional Class 3 precision of 98.95%, demonstrating its robustness in handling imbalanced data. In contrast, NBC (Figure 6d) shows significant off-diagonal dispersion in Class 1, with a TPR of 92.76% and PPV of 93.19%, indicating limited generalization capability for excellent performance modules.
The higher accuracy of the RF model can be attributed to its lack of reliance on prior assumptions about the data, allowing it to adapt to various types of datasets. RF excels at capturing interactions between variables by aggregating multiple decision trees, which enhances prediction accuracy, reduces the risk of overfitting, and improves the model’s generalization capabilities. Its straightforward interpretability, fast computation speed, and robustness contribute to its widespread application.
The observed strong correlation between Pmax and ELR (r = −0.993, p < 0.001) demonstrates that Pmax can effectively serve as a real-time proxy for ELR during production monitoring. This relationship enables early identification of potential encapsulation defects (e.g., delamination or cell mismatch) without undergoing final ELR testing, potentially reducing quality control delays by up to 48 h in typical production cycles. Furthermore, the three-tier classification system (Class 1: 0–0.77% ELR; Class 2: 0.77–8.39%; Class 3: >8.39%) derived from our clustering analysis provides an actionable framework for dynamic module routing:
(1)
Class 1 modules (64.17% of production) can be prioritized for high-efficiency product lines.
(2)
Class 3 modules (0.07% of production) are automatically flagged for rework.
This data-driven approach bridges our analytical findings with practical manufacturing optimization, setting the stage for the industrial implementation strategies discussed in Section 4.

4. Innovations, Limitations, and Scalability of the Hybrid Machine Learning Framework

This study introduces a pioneering hybrid machine learning framework for automated quality prediction and classification of silicon solar modules, combining unsupervised clustering with supervised classification to enhance interpretability and accuracy. By leveraging a dual-stage architecture—first utilizing k-means clustering to dynamically categorize modules into three performance classes (0–0.77%, 0.77–8.39%, and >8.39% ELR) and then employing algorithms like random forest for classification—the framework eliminates reliance on fixed thresholds, enabling adaptive quality assessment aligned with production line variability. The integration of six critical parameters (VOC, ISC, Pmax, VPM, IPM, FF) alongside ELR addresses the limitations of traditional single-dimensional analysis, with PCA dimensionality reduction ensuring efficient handling of high-dimensional data while retaining 95% variance. Industry-driven insights reveal VOC, Pmax, and VPM as dominant predictors of module quality, exhibiting strong negative correlations with ELR (Pearson coefficients: −0.953, −0.993, −0.959), which directly guide defect detection and process optimization. The RF model achieves 98.90% accuracy, validating the framework’s robustness for real-time industrial deployment and offering a scalable solution for yield management in solar manufacturing.
Despite its strengths, the framework faces several limitations. The dataset, comprising 119,654 samples from a single manufacturer, may restrict generalizability to heterogeneous production environments, necessitating future validation with cross-manufacturer data. While the study focuses on electrical parameters (e.g., VOC, Pmax), it excludes thermal stability and environmental degradation factors, which could refine predictions if incorporated. Additionally, computational demands during training phases (e.g., SVM requiring 45.6 min) may challenge smaller manufacturers with limited resources, despite real-time inference speeds (<0.1 ms per sample). These constraints highlight opportunities for expanding feature engineering and optimizing computational efficiency for broader accessibility.
The framework demonstrates significant potential for industrial scalability. Lightweight models like DT (3.2 min training time) enable seamless integration into existing production systems without major hardware upgrades, supported by compatibility with edge computing devices for low-latency quality inspection. Its modular design allows the incorporation of additional parameters, such as thermal imaging data or material batch IDs, to enhance predictive granularity. Furthermore, the methodology is transferable to other photovoltaic technologies (e.g., thin-film, perovskite) and energy storage systems with minimal adjustments, underscoring cross-industry applicability. By reducing ELR-related waste and optimizing yield, the framework aligns with global clean energy goals, offering a sustainable pathway for scalable solar manufacturing.

5. Conclusions

This study proposes a novel machine learning framework for automated quality prediction and classification of silicon solar modules, integrating unsupervised clustering (k-means) and supervised classification algorithms (particularly RF) to dynamically categorize modules into three performance classes (“excellent performance”, “good performance”, and “poor performance”) based on multidimensional parameters, including VOC, Pmax, and FF. Notably, experimental results demonstrate an overall classification accuracy of 98.90%. Pearson correlation analysis reveals particularly strong negative correlations between VOC, Pmax, VPM, and ELR, with coefficients of −0.953, −0.993, and −0.959, respectively, representing a significant improvement over conventional single-dimensional ELR analysis. The core contribution lies in establishing a data-driven adaptive quality assessment system that replaces fixed numerical thresholds, offering a comprehensive and dynamic solution for defect detection and yield management in photovoltaic manufacturing. However, this study has two main limitations: (1) the dataset (119,654 samples) was sourced exclusively from a single manufacturer, which may limit cross-production-line generalizability; and (2) the thermal stability and environmental degradation factors were excluded, which may compromise prediction comprehensiveness. Future work will focus on cross-manufacturer data validation, multimodal feature expansion (e.g., thermal imaging data, environmental stress metrics), and lightweight model optimization to enhance industrial applicability and advance sustainable clean energy manufacturing.

Author Contributions

Investigation, K.W., C.M., Y.L. (Ying Liu), B.H., and X.W.; data curation, J.Z., M.W., and J.S.; writing—original draft, Y.L. (Yuxiang Liu) and X.X.; writing—review and editing, B.Y., B.W. (Bo Wang), R.W., and B.W. (Bing Wang). All authors have read and agreed to the published version of the manuscript.

Funding

This work was funded by the Baoding Science and Technology Plan Project (2394Z001).

Data Availability Statement

Some data are proprietary; however, sharable data are available from the authors upon request.

Acknowledgments

We are grateful to the four anonymous reviewers, whose criticism helped to improve the presentation of this work.

Conflicts of Interest

The authors declare that the research was conducted in the absence of any commercial or financial relationships that could be construed as a potential conflict of interest. Xinzhong Xia, Kun Wang, Mengmeng Wu, Chao Ma, Ying Liu, Boyang Hu and Xinying Wang were employed by Yingli Energy (China) Co., Ltd. Bo Yu and Jinchao Shi were employed by Yingli Energy Development Co., Ltd.

References

  1. Depauw, V.; Trompoukis, C.; Massiot, I.; Chen, W.; Dmitriev, A.; Cabarrocas, P.; Gordon, I.; Poortmans, J. Sunlight-thin nanophotonic monocrystalline silicon solar cells. Nano Futures 2017, 1, 021001. [Google Scholar] [CrossRef]
  2. Han, K.; Lee, H.; Cho, J.; Park, S.; Yun, J.; Yoon, K.; Yoo, J. Fabrication and characterization of monocrystalline-like silicon solar cells. J. Korean Phys. Soc. 2012, 61, 1279–1282. [Google Scholar] [CrossRef]
  3. Sun, J.; Zuo, Y.; Sun, R.; Zhou, L. Research on the conversion efficiency and preparation technology of monocrystalline silicon cells based on statistical distribution. Sustain. Energy Technol. Assess. 2021, 47, 101482. [Google Scholar] [CrossRef]
  4. Bock, F.E.; Aydin, R.C.; Cyron, C.J.; Huber, N.; Kalidindi, S.; Klusemann, B. A Review of the Application of Machine Learning and Data Mining Approaches in Continuum Materials. Mech. Front. Mater. 2019, 6, 110. [Google Scholar] [CrossRef]
  5. Cai, J.; Chu, X.; Xu, K.; Li, H.; Wei, J. Machine learning-driven new material discovery. Nanoscale Adv. 2020, 2, 3115–3130. [Google Scholar] [CrossRef]
  6. Gao, C.; Min, X.; Fang, M.; Tao, T.; Zheng, X.; Liu, Y.; Wu, X.; Huang, Z. Innovative Materials Science via Machine Learning. Adv. Funct. Mater. 2021, 32, 2108044. [Google Scholar] [CrossRef]
  7. Liu, Y.; Zhao, T.; Ju, W.; Shi, S. Materials discovery and design using machine learning. J. Mater. 2017, 3, 159–177. [Google Scholar] [CrossRef]
  8. Zhang, Y.; Ling, C. A strategy to apply machine learning to small datasets in materials science. NPJ Comput. Mater. 2018, 4, 25. [Google Scholar] [CrossRef]
  9. Forootan, M.M.; Larki, I.; Zahedi, R.; Ahmadi, A. Machine Learning and Deep Learning in Energy Systems: A Review. Sustainability 2022, 14, 4832. [Google Scholar] [CrossRef]
  10. Gao, T.; Lu, W. Machine learning toward advanced energy storage devices and systems. Iscience 2021, 24, 101936. [Google Scholar] [CrossRef]
  11. Shen, Z.H.; Liu, H.X.; Shen, Y.; Hu, J.M.; Chen, L.Q.; Nan, C.W. Machine learning in energy storage materials. Interdiscip. Mater. 2022, 1, 175–195. [Google Scholar] [CrossRef]
  12. Almanei, M.; Oleghe, O.; Jagtap, S.; Salonitis, K. Machine Learning Algorithms Comparison for Manufacturing Applications. In Advances in Manufacturing Technology XXXIV; IOS Press: Amsterdam, The Netherlands, 2021; Volume 15, pp. 377–382. [Google Scholar]
  13. Rai, R.; Tiwari, M.K.; Ivanov, D.; Dolgui, A. Machine learning in manufacturing and industry 4.0 applications. Int. J. Prod. Res. 2021, 59, 4773–4778. [Google Scholar] [CrossRef]
  14. Wang, C.; Tan, X.P.; Tor, S.B.; Lim, C.S. Machine learning in additive manufacturing: State-of-the-art and perspectives. Addit. Manuf. 2020, 36, 101538. [Google Scholar] [CrossRef]
  15. Mahmood, A.; Wang, J.L. Machine learning for high performance organic solar cells: Current scenario and future prospects. Energy Environ. Sci. 2021, 14, 90–105. [Google Scholar] [CrossRef]
  16. Fu, Y.; Li, X.; Ma, X. Deep-Learning-Based Defect Evaluation of Mono-Like Cast Silicon Wafers. Photonics 2021, 8, 426. [Google Scholar] [CrossRef]
  17. Buratti, Y.; Dick, J.; Gia, Q.L.; Hameiri, Z. Deep Learning Extraction of the Temperature-Dependent Parameters of Bulk Defects. ACS Appl. Mater. Interfaces 2022, 14, 48647–48657. [Google Scholar] [CrossRef]
  18. Jaiswal, R.; Martinez-Ramon, M.; Busani, T. Recent Advances in Silicon Solar Cell Research Using Data Science-Based Learning. IEEE J. Photovolt. 2023, 13, 2–15. [Google Scholar] [CrossRef]
  19. Kamath, R.S.; Kamat, R.K. Modelling of Random Textured Tandem Silicon Solar Cells Characteristics: Decision Tree Approach. J. Nano-Electron. Phys. 2016, 8, 04021. [Google Scholar] [CrossRef]
  20. Biau, G. Analysis of a Random Forests Model. J. Mach. Learn. Res. 2012, 13, 1063–1095. [Google Scholar]
  21. Nagy, G.I.; Barta, G.; Kazi, S.; Borbély, G.; Simon, G. GEFCom2014: Probabilistic solar and wind power forecasting using a generalized additive tree ensemble approach. Int. J. Forecast. 2016, 32, 1087–1093. [Google Scholar] [CrossRef]
  22. Scornet, E.; Biau, G.; Vert, J.P. Consistency of random forests. Ann. Stat. 2015, 43, 1716–1741. [Google Scholar] [CrossRef]
  23. Ding, S.; Xu, L.; Su, C.; Zhu, H. Using Genetic Algorithms to Optimize Artificial Neural Networks. J. Converg. Inf. Technol. 2010, 5, 54–62. [Google Scholar]
  24. Ding, S.; Xu, X.; Zhu, H. Studies on Optimization Algorithms for Some Artificial Neural Networks Based on Genetic Algorithm (GA). J. Comput. 2011, 6, 939–946. [Google Scholar] [CrossRef]
  25. Park, N. High Efficiency Perovskite Solar Cells: Materials and Devices Engineering. Trans. Electr. Electron. Mater. 2020, 21, 1–15. [Google Scholar] [CrossRef]
  26. Roy, J. Comprehensive analysis and modeling of cell to module (CTM) conversion loss during c-Si Solar Photovoltaic (SPV) module manufacturing. Sol. Energy 2016, 130, 184–192. [Google Scholar] [CrossRef]
  27. Gupta, D.; Mukhopadhyay, S.; Narayan, K. Fill factor in organic solar cells. Sol. Energy Mater. Sol. Cells 2010, 94, 1309–1313. [Google Scholar] [CrossRef]
Figure 1. Workflow of the hybrid machine learning framework: data collection, normalization, k-means clustering, PCA, classification, and evaluation.
Computation 13 00125 g001
Figure 2. ELR-only clustering results (3 clusters: 0–0.74%, 0.74−8.39%, and >8.39% ELR).
Computation 13 00125 g002
Figure 3. Multidimensional clustering (6 parameters) outperforms ELR-only, yielding dynamic clusters (0–0.77%, 0.77–8.39%, and >8.39% ELR).
Computation 13 00125 g003
Figure 4. Correlation heatmap: VOC, Pmax, and VPM strongly anti-correlate with ELR (−0.95 to −0.99).
Computation 13 00125 g004
Figure 5. Comparative ROC analysis of classification algorithms across performance categories with corresponding AUC values: (a) Class 1; (b) Class 2; (c) Class 3.
Computation 13 00125 g005
Figure 6. Confusion matrices of five models for solar module quality classification: (a) DT; (b) RF; (c) SVM; (d) NBC; (e) KNN.
Computation 13 00125 g006
Table 1. Model performance. RF excels (98.90% accuracy, 100% F1 for Cluster2); NBC lags in Cluster1 (F1 = 92.97%).
MethodsCluster1Cluster2Cluster3Accuracy
TPRPPVF1TPRPPVF1TPRPPVF1
DT98.06%98.06%98.06%90.91%100.00%95.24%98.20%98.19%98.20%98.13%
RF98.87%98.85%98.86%100.00%100.00%100.00%98.92%98.95%98.94%98.90%
SVM97.91%98.36%98.14%100.00%100.00%100.00%98.48%98.06%98.27%98.21%
NBC92.76%93.19%92.97%100.00%100.00%100.00%93.68%93.27%93.47%93.24%
KNN98.48%98.55%98.52%100.00%100.00%100.00%98.65%98.59%98.62%98.57%
Disclaimer/Publisher’s Note: The statements, opinions and data contained in all publications are solely those of the individual author(s) and contributor(s) and not of MDPI and/or the editor(s). MDPI and/or the editor(s) disclaim responsibility for any injury to people or property resulting from any ideas, methods, instructions or products referred to in the content.

