Article

Battery Sizing Method for Microgrids—A Colombian Application Case

by
Andres Felipe Zamora-Muñoz
1,
Martha Lucia Orozco-Gutierrez
1,*,
Dany Mauricio Lopez-Santiago
2,
Jhoan Alejandro Montenegro-Oviedo
1 and
Carlos Andres Ramos-Paja
3
1
Escuela de Ingeniería Eléctrica y Electrónica, Universidad del Valle, Cali 760042, Colombia
2
Grupo de Investigación GITICAP, Potencia y Tecnologías Incorporadas S.A., Carrera 56, 2-50, Cali 760042, Colombia
3
Facultad de Minas, Universidad Nacional de Colombia, Medellin 050041, Colombia
*
Author to whom correspondence should be addressed.
Computation 2025, 13(5), 114; https://doi.org/10.3390/computation13050114
Submission received: 10 April 2025 / Revised: 30 April 2025 / Accepted: 8 May 2025 / Published: 10 May 2025
(This article belongs to the Section Computational Engineering)

Abstract

:
The introduction of renewable energy sources in microgrids increases energy reliability, especially in small communities that operate disconnected from the main power grid. A battery energy storage system (BESS) plays an important role in microgrids because it helps mitigate the problems caused by the variability of renewable energy sources, such as unattended demand and voltage instability. However, a BESS increases the cost of a microgrid due to the initial investment and maintenance, requiring a cost–benefit analysis to determine its size for each application. This paper addresses this problem by formulating a method that combines economic and technical approaches to provide favorable relations between costs and performances. Mixed integer linear programming (MILP) is used as optimization algorithm to size BESS, which is applied to an isolated community in Colombia located at Isla Múcura. The results indicate that the optimal BESS requires a maximum power of 17.6 kW and a capacity of 76.61 kWh, which is significantly smaller than the existing 480 kWh system. Thus, a reduction of 83.33% in the number of batteries is obtained. This optimized size reduces operational costs while maintaining technical reliability. The proposed method aims to solve an important problem concerning state policy and the universalization of electrical services, providing more opportunities to decision makers in minimizing the costs and efforts in the implementation of energy storage systems for isolated microgrids.

1. Introduction

In recent decades, as energy consumption continues to grow worldwide, there has been an increasing interest in incorporating renewable energy sources into power systems. Although renewable energy has many benefits for the environment, these sources bring some challenges to the electric grid due to its intermittent nature. In this new scenario, battery energy storage systems (BESSs) help mitigate power system reliability problems, because they store energy in periods with surpluses and release energy in lower generation periods [1]. BESSs have a critical role in isolated autonomous electrical systems, such as microgrids, in which there is no robustness and availability of the power system, so reliability is completely dependent on energy management between generators and load variations [1]. Different works have highlighted the control problems in microgrids, such as [2,3]. In [2], a distributed control strategy is proposed for a direct current microgrid that focuses on improving the control efficiency and communication latency parameters. Meanwhile, in [3], an energy management strategy is proposed for a multi-energetic rural microgrid, which incorporates irrigation and biomass fermentation systems. In that work, stochastic uncertainties are included in an energy management model. However, a starting point for reducing control problems is the adequate design of a microgrid storage system. Therefore, the adequate BESS size must be determined in microgrids applications, many of which have limited data infrastructure and economic constraints.
The optimal BESS size is a key factor to establishing a project’s viability, because economy and technical constraints must be balanced. On the technical side, the size of the BESS determines the storage capacity, which impacts the operation, flexibility, and reliability of an electric system. On the other hand, the BESS’s size affects investments and operational costs. Therefore, the main aim of BESS optimal sizing is to make BESS projects feasible by targeting the reduction in operational costs. There is a need to address this equilibrium, particularly in the context of isolated microgrids regarding economic parameters, technical issues, and microgrid dynamics [4].
The problem of BESS sizing has attracted researchers’ attention, resulting in different optimization approaches with diverse statement functions, restrictions, and input data. Classical algorithms, heuristics, or their combinations are used in the literature. For example, mixed integer linear programming (MILP) is often used by researchers. The works reported in [5,6] use MILP to fix the size, technology, and maximum depth of the discharge of a BESS. For their part, the authors of [7] propose an optimal scheduling and cost–benefit analysis of a vanadium redox battery system, focusing on economic factors. Some authors include heuristic algorithms, such as [8,9,10]. In [8], an optimal economic analysis of BESS installed in a microgrid is proposed, where a Self-Adaptive Bee Swarm Optimization Algorithm and Net Present Value Assessment are used to optimize the operation strategies and BESS capacity used. A bi-level optimization problem is presented in [9], which is solved by a hybrid algorithm based on binary particle swarm optimization and Karush–Kuhn–Tucker quadratic programming. On the other hand, the work reported in [10] proposes a BESS sizing method based on genetic algorithms with a fuzzy subsystem to control the power output.
Other authors have introduced more elaborate algorithms to determine the size of the BESSs. In [11], a new version of the bat algorithm, improving its searching capability through a self-adaptive learning technique, is proposed to optimize BESS sizing. In the same way, the size of BESS in [12] is addressed by a cost-based model formulation and an optimization based on the gray wolf approach. In [13], the BESS size in microgrids is determined using a two-step cost-based technique with convex optimization. In [14], the authors refined the problem of BESS sizing by modifying the shuffled frog leaping algorithm. Finally, the work in [15] combined Accelerated Particle Swarm Optimization, the Jaya optimization technique, and Linear Programming-Based Interior Point Algorithms to optimize the energy management of a microgrid at minimum operating costs.
Some papers present BESS sizing techniques for specific cases, such as microgrids that include renewable energy sources; microgrids for isolated areas; and microgrids in multienergetic systems, urban industries or homes, or critical facilities [2,3,16,17,18,19,20,21]. Likewise, the literature highlights the role of storage systems in microgrids for developing countries, which are focused on energy supply for isolated areas [22,23,24]. In [16], an analysis for large-scale photovoltaic (PV) plants with BESS is developed, which uses daily checkpoints to guarantee continuous energy supply. In [17], a multicriteria approach based on particle swarm optimization is used to size a BESS. The work reported in [18], in addition to sizing a BESS, also addresses its optimal location by iterative evaluation for on/off-grid cases. In [19], the BESS’s sizing is developed by a genetic algorithm to improve the load profile and reduce losses. Meanwhile, battery degradation is taken into account to size the BESS in [21]. Research focused on a developing country is presented in [22], which proposes a model that includes resilience and renewable penetration indicators relative to data centers. This model is used to determine the optimal size of the BESS in front of blackout events. In a similar way, ref. [23] uses a hybrid genetic algorithm to minimize annual costs and the probability of supply interruption by considering several renewable energy sources. In [24], the size of a BESS is evaluated under peak-shaving strategies. Finally, the work reported in [20] proposes a model for hybrid storage systems formed by batteries and hydrogen generators, which are used at a university campus in Egypt. In that case, the BESS’s size is optimized using simulation tools and taking into account large-scale economic analyses. Table 1 summarizes the methods used to size BESSs, highlighting advantages, disadvantages, and application cases.
Despite advances in algorithms and methods for BESS sizing, most of them require extensive data on environmental conditions and detailed load profiles, which represents a challenge for isolated regions and communities. For example, in Colombia, isolated areas are named Non-Interconnected Zones (ZNIs), and these correspond to nearly 53% of the territory. In a ZNI, there is almost no telemetry infrastructure, so real-time information of the local electric system is not available. Therefore, there is a gap between the existing techniques used to determine the BESS size and the data required to feed these techniques.
The previous problem is faced in this paper by developing an optimal BESS sizing method for ZNI applications, which minimizes data and telemetry requirements. The proposed method uses the MILP algorithm to optimize an objective function based on cost indicators, where constraints related to operation conditions are applied to the optimization problem. The main contribution of this work consists in adapting the MILP-based sizing process to contexts with limited information by simplifying data requirements, formalizing a structured six-step method, and demonstrating its robustness with a sensitivity analysis. In contrast to other works that assume access to high-resolution time series, the proposed method relies on representative average profiles derived from minimal data inputs, making it particularly suitable for remote and underserved communities. A case study based on Isla Múcura, Colombia, is used to validate the proposed method and to illustrate its applicability. The proposed method is made up of six steps, which are explained in applications for ZNI in Colombia. However, the technique is able to be applied to isolated regions in other parts of the world facing similar data and infrastructure limitations.
The rest of the paper is organized as follow. In Section 2, the microgrid structure in Colombia is presented. Section 3 details the model optimization problem. In Section 4, the proposed method is introduced, and in Section 5, the method is applied to the case of this study. Finally, this paper finalizes the conclusions in Section 6.

2. Microgrids in the Colombian Context

The quest for more efficient, stable, and reliable power systems has led to the evolution of today’s power system architecture, which has migrated towards a more flexible environment of small-scale distributed low-voltage grids, named microgrids, which have the potential to connect to large-scale power systems. A microgrid can be defined as an autonomous or semi-autonomous power system formed by distributed energy resources (DERs), such as diesel generators (DGs), microgenerators, and renewable energy sources like PV systems, in addition to loads and storage units [25,26]. An example of a microgrid structure is depicted in Figure 1. The U.S. Department of Energy defines a microgrid as “a group of interconnected loads and DERs within clearly defined electrical boundaries that acts as a single controllable entity with respect to the grid” [27]. In Colombia, as a result of the different works conducted with actors of the national sector, sustainable microgrids are defined as “electrical systems integrating demand and DERs with the capacity to operate during a period of time and with different levels of automation and coordination, either isolated or interconnected to a main grid, under technical, economic and cultural criteria” [28].
In order to define cases of rural and urban microgrids, it is first necessary to determine the limitations of rural and urban environments. Therefore, an urban locality can be defined as a geographical area limited by agreements of the Municipal Council. This corresponds to the place where the administrative headquarters of a municipality is located. In contrast, a rural area is formed by houses and farms scattered throughout the area, which do not have declared streets, roads, avenues, and so forth [28], this being the case of interest in this paper.
Off-grid microgrids are frequently utilized to provide energy in regions where the total demand does not justify the extension of the national power grid. However, the number of residences and other properties makes feasible the installation of grids with local generation. Therefore, for the case study of microgrids in rural areas, the isolated operation mode is selected.
According to the evaluation performed by the Colombian energy and mining planing unit (UPME), the use of microgrids is justified if the concentration of homes in ZNI exceeds 25 units within a radius of 1 km, with a potential electricity demand higher than 90 kWh/month [28]. Consequently, the characterization of a ZNI is carried out by the Colombian Institute for Planning and Promotion of Energy Solutions (IPSE) in conjunction with the monitoring of localities utilizing telemetry. Such telemetry is defined as “a technology that allows for the remote measurement of electrical energy and subsequent transmission of this information to a centralized monitoring system”. In this sense, Table 2 shows a review of the energy matrix with contributions from renewable sources monitored using telemetry by the IPSE in Colombian ZNIs. The values in Table 2 are based on data from the IPSE Telemetry Report [29], which provides descriptions of the electrical infrastructure installed in multiple ZNI locations in Colombia, including PV, DG, and BESSs. Such a table shows locations with small power systems, e.g., Isla Múcura with 43 users, and locations with large power systems, like Inírida with 6159 users. These power systems have different relations between PV and DG: from 14% (Inírida) to 71.6% (Nazareth). Moreover, almost all localities have BESSs, which must be carefully sized. This work will select one locality to evaluate the optimal BESS size and later compare such an optimal solution with the real BESS installed.

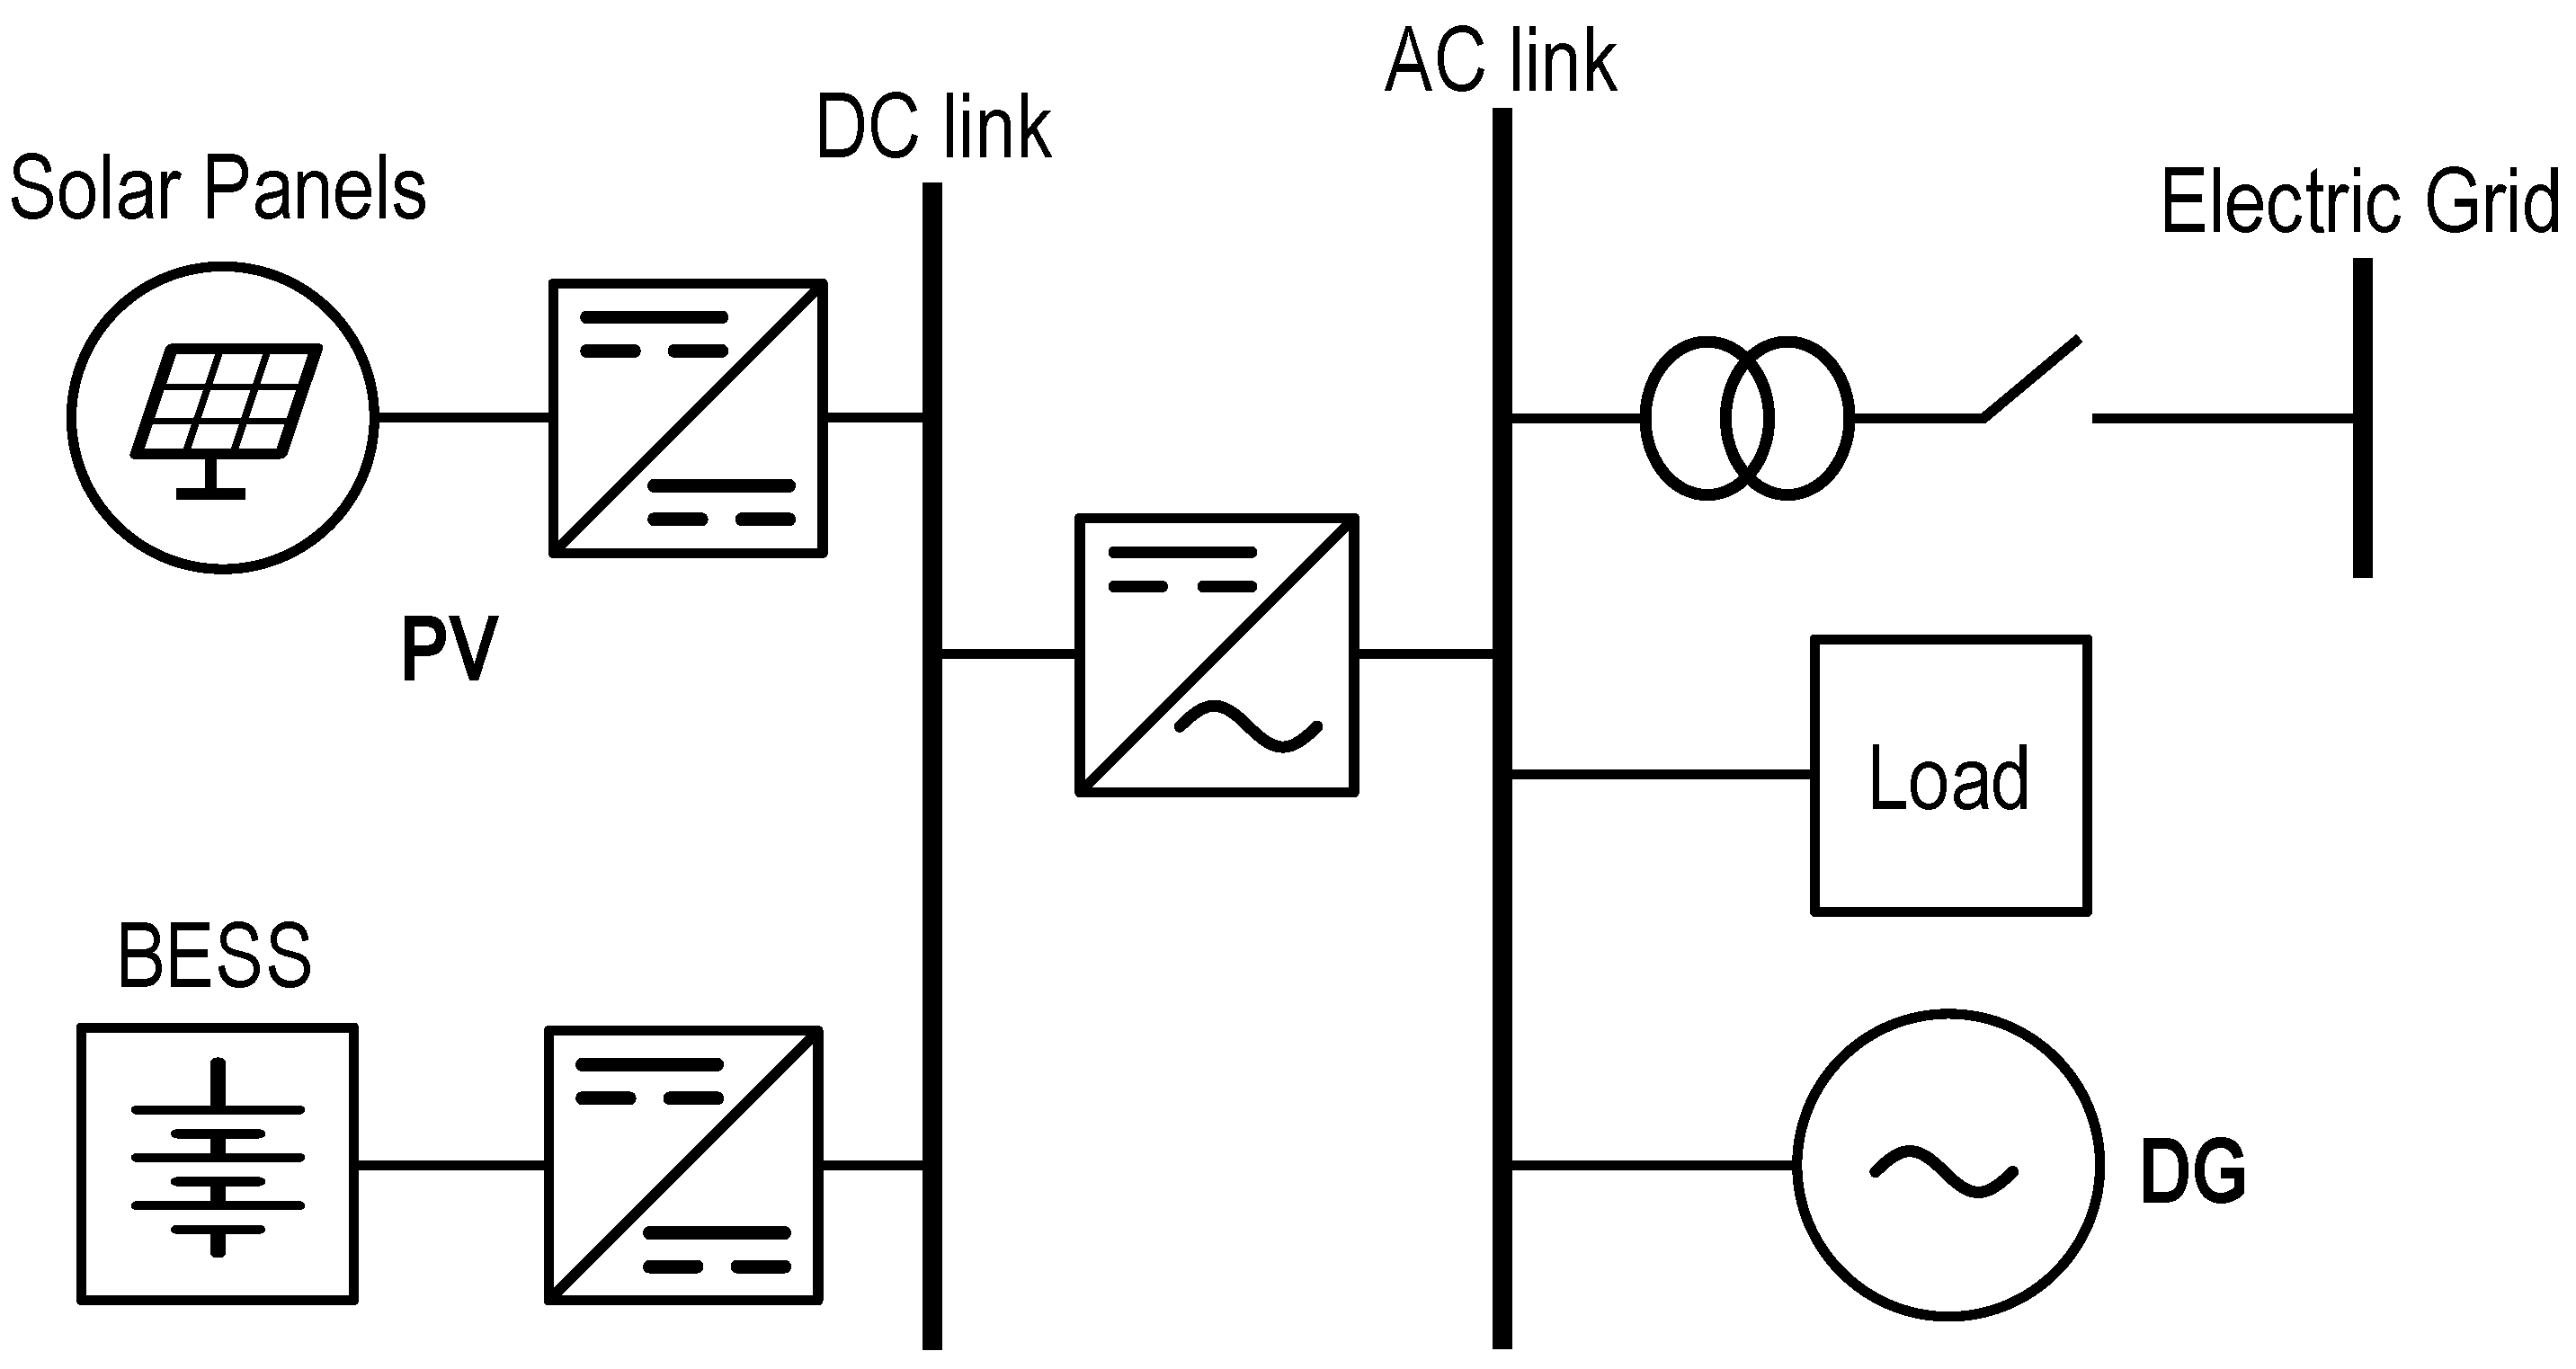
3. Model of the Optimization Problem

MILP was chosen as the more appropriate optimization approach for this case study because of the DG [30] behavior. This algorithm was selected to deal with discontinuous operating points. MILP incorporates both continuous and discrete variables in its structure, making it possible to represent discontinuous search spaces. The decision variables and the objective function, as well as the constraints, model the solution of the optimization problem. The decision variables are the output power of the DG and the on/off state of the generator, as well as the charging and discharging power of the BESS. In this case, the objective function incorporates the total cost of the microgrid, which includes diesel fuel costs, generator startup costs, and battery usage costs. The optimization problem is solved with constraints on the power balance and the operating constraints of the generator and the BESS.

3.1. Decision Variables

The decision variables include the power supplied by the DG P D , v ( t ) , the binary variable for DG power B D , v ( t ) , the on-off status of the DG C S T D G ( t ) , power discharged by the BESS P B D ( t ) , and the power charged in the BESS P B C ( t ) . In addition, Z B D ( t ) and Z B C ( t ) are binary variables for the discharge and charge states of the BESS, respectively.

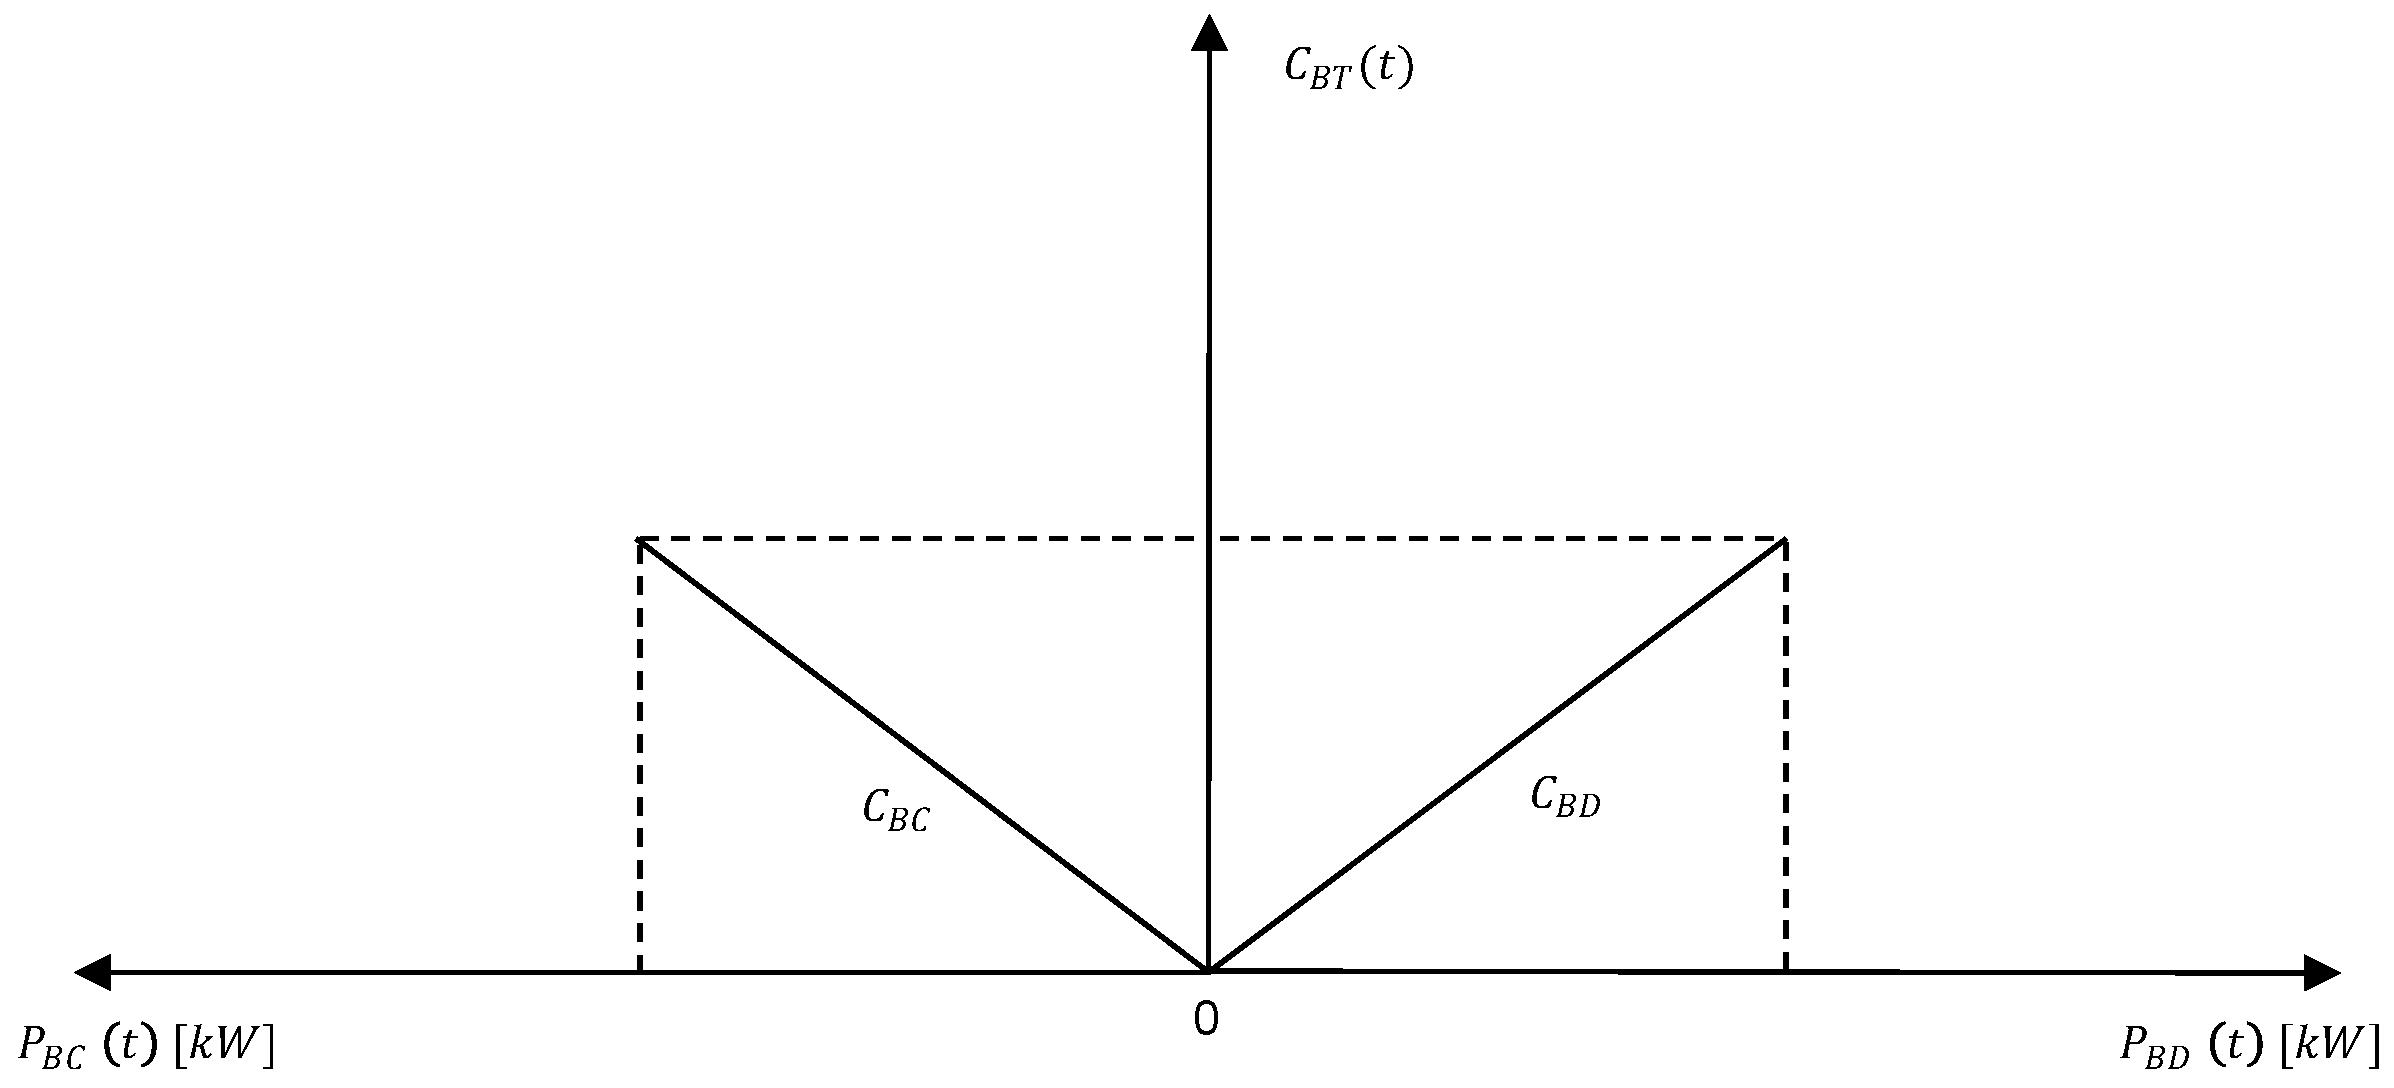
3.2. Objective Function

The objective function C ( t ) is sum of all costs involved in the project, and it is expressed in (1), where C F D G ( t ) is the cost of diesel fuel, C S T D G ( t ) is the startup cost of the DG, and C B T ( t ) is the BESS usage cost.
C ( t ) = C F D G ( t ) + C S T D G ( t ) + C B T ( t )
The use of PV systems implies that the available solar resource should be used at the maximum in all periods of the system’s operation. Therefore, their use does not introduce an operational cost, and thus, these resources do not influence the optimization process.
The fuel consumption of the DG is approximated by a non-convex function with n v linear segments [31]. Such a fuel consumption function q ( t ) is defined in (2), which represents the fuel consumption in liters. In this function, α v denotes the slope in liters per kilowatts, β v is the intercept on the ordinate axis in liters, P D , v ( t ) represents the power supplied by the DG in kilowatts as a continuous variable, and B D , v ( t ) is a binary variable that activates or deactivates the sections according to the DG power. Figure 2 shows the behavior of q ( t ) .
q ( t ) = v = 1 n v ( α v · P D , v ( t ) + β v · B D , v ( t ) )
The total diesel fuel cost C F D G ( t ) is defined in (3), where C f u e l is the diesel fuel cost in Colombian pesos (COP) per liter.
C F D G ( t ) = C f u e l · q ( t )
The DG power dispatch requires a pre-startup process that generates fuel consumption without providing useful energy. In this work, a fixed startup cost C s t u p is considered for each generator, regardless of how long it has been off. This modeling approach uses the binary variable B D , v ( t ) , defined in (2), which indicates the operation of the generator at the current time, and the binary variable B D , v ( t 1 ) , which records the state at the previous time instant. The startup cost is applied only when the generator was off at the previous time instant, and it is turned on at the present time [31]. Therefore, the startup cost of the DG is formalized in (4): This condition defines that only a single segment of the DG operating curve is active at each time; hence, only one transition is considered per time step. This behavior is guaranteed by constraints (10) and (11), which prevent multiple segments from being active simultaneously.
C S T D G ( t ) = 0 v = 1 n v ( B D , v ( t ) B D , v ( t 1 ) ) = 0 C s t u p v = 1 n v ( B D , v ( t ) B D , v ( t 1 ) ) = 1
The BESS discharging and charging costs are modeled by the two linear segments defined in (5) and (6), respectively. The dimensionless parameters γ B D and γ B C correspond to scaling factors that determine the influence of discharging and charging operations in the cost model. Those factors represent directional coefficients that align the slope orientation of the cost function with the discharging γ B D and charging γ B C behaviors, ensuring consistency in the linear modeling of cost variations as a function of power. The slopes C B D and C B C are expressed in COP per kilowatt, and these represent the BESS discharge and charge costs, respectively, while λ B D and λ B C are the ordinate axis intercepts in COP. P B D ( t ) refers to the discharge power, and P B C ( t ) refers to the charge power. The binary variables Z B D ( t ) and Z B C ( t ) are used to activate or deactivate the intercepts according to the requirements of the microgrid. The total cost of the BESS operation, denoted as C B T ( t ) , is obtained by adding the BESS’s discharge and charge costs, as given in (7). Finally, Figure 3 shows the behavior of the BESS cost function.
C B D T ( t ) = γ B D · C B D · P B D ( t ) + λ B D · Z B D ( t )
C B C T ( t ) = γ B C · C B C · P B C ( t ) + λ B C · Z B C ( t )
C B T ( t ) = C B D T ( t ) + C B C T ( t )

3.3. Constraints

The constraints reflect the technical limitations of the power system. The minimization of the operating costs is conditioned by the following constraints.
The constraint for power balance in the system is defined in (8), where P D , v ( t ) represents the power generated by the DG, P B D ( t ) represents the power supplied by the BESS, P B C ( t ) represents the power absorbed by the BESS, P L ( t ) represents the power required by the load, and P P V ( t ) represents the power generated by the PV system. This equation states that the sum of the DG power and the BESS’s discharge and charge must satisfy the net demand, defined as the difference between load consumption and PV generation.
P D , v ( t ) + P B D ( t ) + P B C ( t ) = P L ( t ) P P V ( t )
The operational constraints for the DG power P D , v ( t ) are given in (9), where P D , v M i n and P D , v M a x represent the minimum and maximum limits of P D , v ( t ) , respectively. The binary variable B D , v ( t ) , defined in (2), turns linear segment v on or off according to the power generated by the DG. This constraint ensures that P D , v ( t ) is kept within the set limits depending on the active linear segment.
P D , v M i n · B D , v ( t ) P D , v ( t ) P D , v M a x · B D , v ( t )
The constraints for the operational constraints and the cost function of the DG are formalized in (10)–(12). In these equations, B D , v ( t ) and B D , v ( t 1 ) are binary variables indicating the active linear segment of the fuel consumption curve at instants t and t 1 , respectively. Constraints (10) and (11) ensure that only one linear segment is active at each instant. Constraint (12) establishes that the startup cost C S T D G ( t ) is equal to C s t u p only when the DG state changes from off to on. In any other case, this cost is zero, i.e., the DG remains on or off.
v = 1 n v B D , v ( t ) 1
v = 1 n v B D , v ( t 1 ) 1
C S T D G ( t ) C s t u p · v = 1 n v B D , v ( t ) v = 1 n v B D , v ( t 1 )
The BESS discharge and charge power must satisfy the constraints given in (13) and (14). In these equations, P B D M i n and P B C M i n are the minimum discharge and charge power, respectively, where P B D M i n is equal to zero. P B D M a x and P B C M a x are the maximum discharge and charge power, respectively, where P B C M a x is equal to zero. The binary variables Z B D ( t ) and Z B C ( t ) enable the discharge or charge actions, respectively. Such constraints ensure that the BESS operates within the maximum and minimum power limits for discharging or charging processes.
P B D M i n · Z B D ( t ) P B D ( t ) P B D M a x · Z B D ( t )
P B C M i n · Z B C ( t ) P B C ( t ) P B C M a x · Z B C ( t )
The operational constraints of the BESS are described in (15) and (16), where Z B D ( t ) and Z B C ( t ) are the binary variables that indicate whether the BESS is currently in the discharge or charge mode. Hence, this constraint prevents the BESS from being simultaneously in both modes. Expression (16) represents the energy stored in the BESS at the current time E B ( t ) , which is determined from the energy previously stored in the BESS E B ( t 1 ) , the BESS discharge power P B D ( t ) affected by the discharge efficiency η B D , and the BESS charge power P B C ( t ) affected by the charge efficiency η B C . It is important to note that, by modeling conventions, P B C ( t ) is defined as a negative value, which justifies its subtraction in the energy balance constraint, and it is consistent with the BESS’s cost function, as observed in Figure 3. Then, constraint (17) ensures that the energy stored in the battery must remain within the operating limits E B M i n and E B M a x .
Z B D + Z B C 1
E B ( t ) = E B ( t 1 ) 1 η B D · P B D ( t ) η B C · P B C ( t )
E B M i n E B ( t ) E B M a x

4. Proposed Method for BESS Sizing

The proposed method for BESS sizing in microgrid applications is summarized in Figure 4. This method consists of six steps, starting with searching the relevant locations for integrating BESSs. The proposed method incorporates technical, economic, and contextual criteria.
Each step of the sizing method is explained in detail:
  • Define search criteria: Establish the search criteria of exiting microgrid projects. Information on microgrid projects should exist in document or digital forms. In Colombia, the IPSE is the institution that gathers information about the microgrids in ZNIs. For example, the search criteria of microgrid projects may include areas with renewable energy potential, a heavy dependence on DGs, favorable government policies, high populations or energy consumption, and conflict-stricken areas, among others.
  • Conduct database query: Investigate relevant data from existing electrical system projects in ZNIs to find suitable locations for including or optimizing BESSs. Relevant data include load and power source profiles.
  • Select the case study: Select cases that satisfy the requirements of the defined search criteria.
  • Characterize the case study: Elaborate the consumption profile and energy potential of the location regarding loads and the energy matrix.
  • Parameterize the optimization problem: Identify the parameters of the models and cost function established in the optimization problem; this is based on the MILP algorithm.
  • Analysis of results: BESS sizing is analyzed using the resulting data. Decision makers should provide a recommendation about the inclusion of a BESS in the microgrid of the case study.

5. Application of the Proposed Method for BESS Sizing in a Colombian Case

In Colombia, DGs are often used to provide energy to ZNIs, which are expensive and have high environmental impact. However, the country has important solar energy potential, which can be used in microgrid applications. In addition, the government provides regulations and incentives to use this type of energy resource. Therefore, the described method to size a BESS is applied to a ZNI in Colombia, which typically uses solar energy resources and DGs. In the following, the results of each step of the proposed method are described.

5.1. Define Search Criteria

Two criteria are defined to select the case study. The first criterion is the identification of locations with PV systems. These PV systems are defined as a primary renewable energy source for ZNIs in the “IPSE Project Structuring” document [32]. The second criterion consists of identifying locations where DG systems are included in the electrical system. This last criterion is included because DGs are susceptible to being replaced by a BESS; in addition, DGs have high operational costs and environmental impacts.

5.2. Conduct Database Query

For this step, the “IPSE Telemetry Report” [29] was consulted to find locations (cases) fitting the established criteria: locations with solar and diesel energy generation. From this document, nine potential cases were identified: Isla Fuerte (Cartagena-Bolívar), Isla Múcura (Cartagena-Bolívar), Santa Cruz del Islote (Cartagena-Bolívar), San Francisco (Acandí-Chocó), San Roque (Medio Atrato-Chocó), Unguía (Unguía-Chocó), Barranco Minas (Barranco Minas-Guainía), Inírida (Inírida-Guaina), and Nazareth (Uribia-La Guajira). The characteristics of these localities are summarized in Table 2.

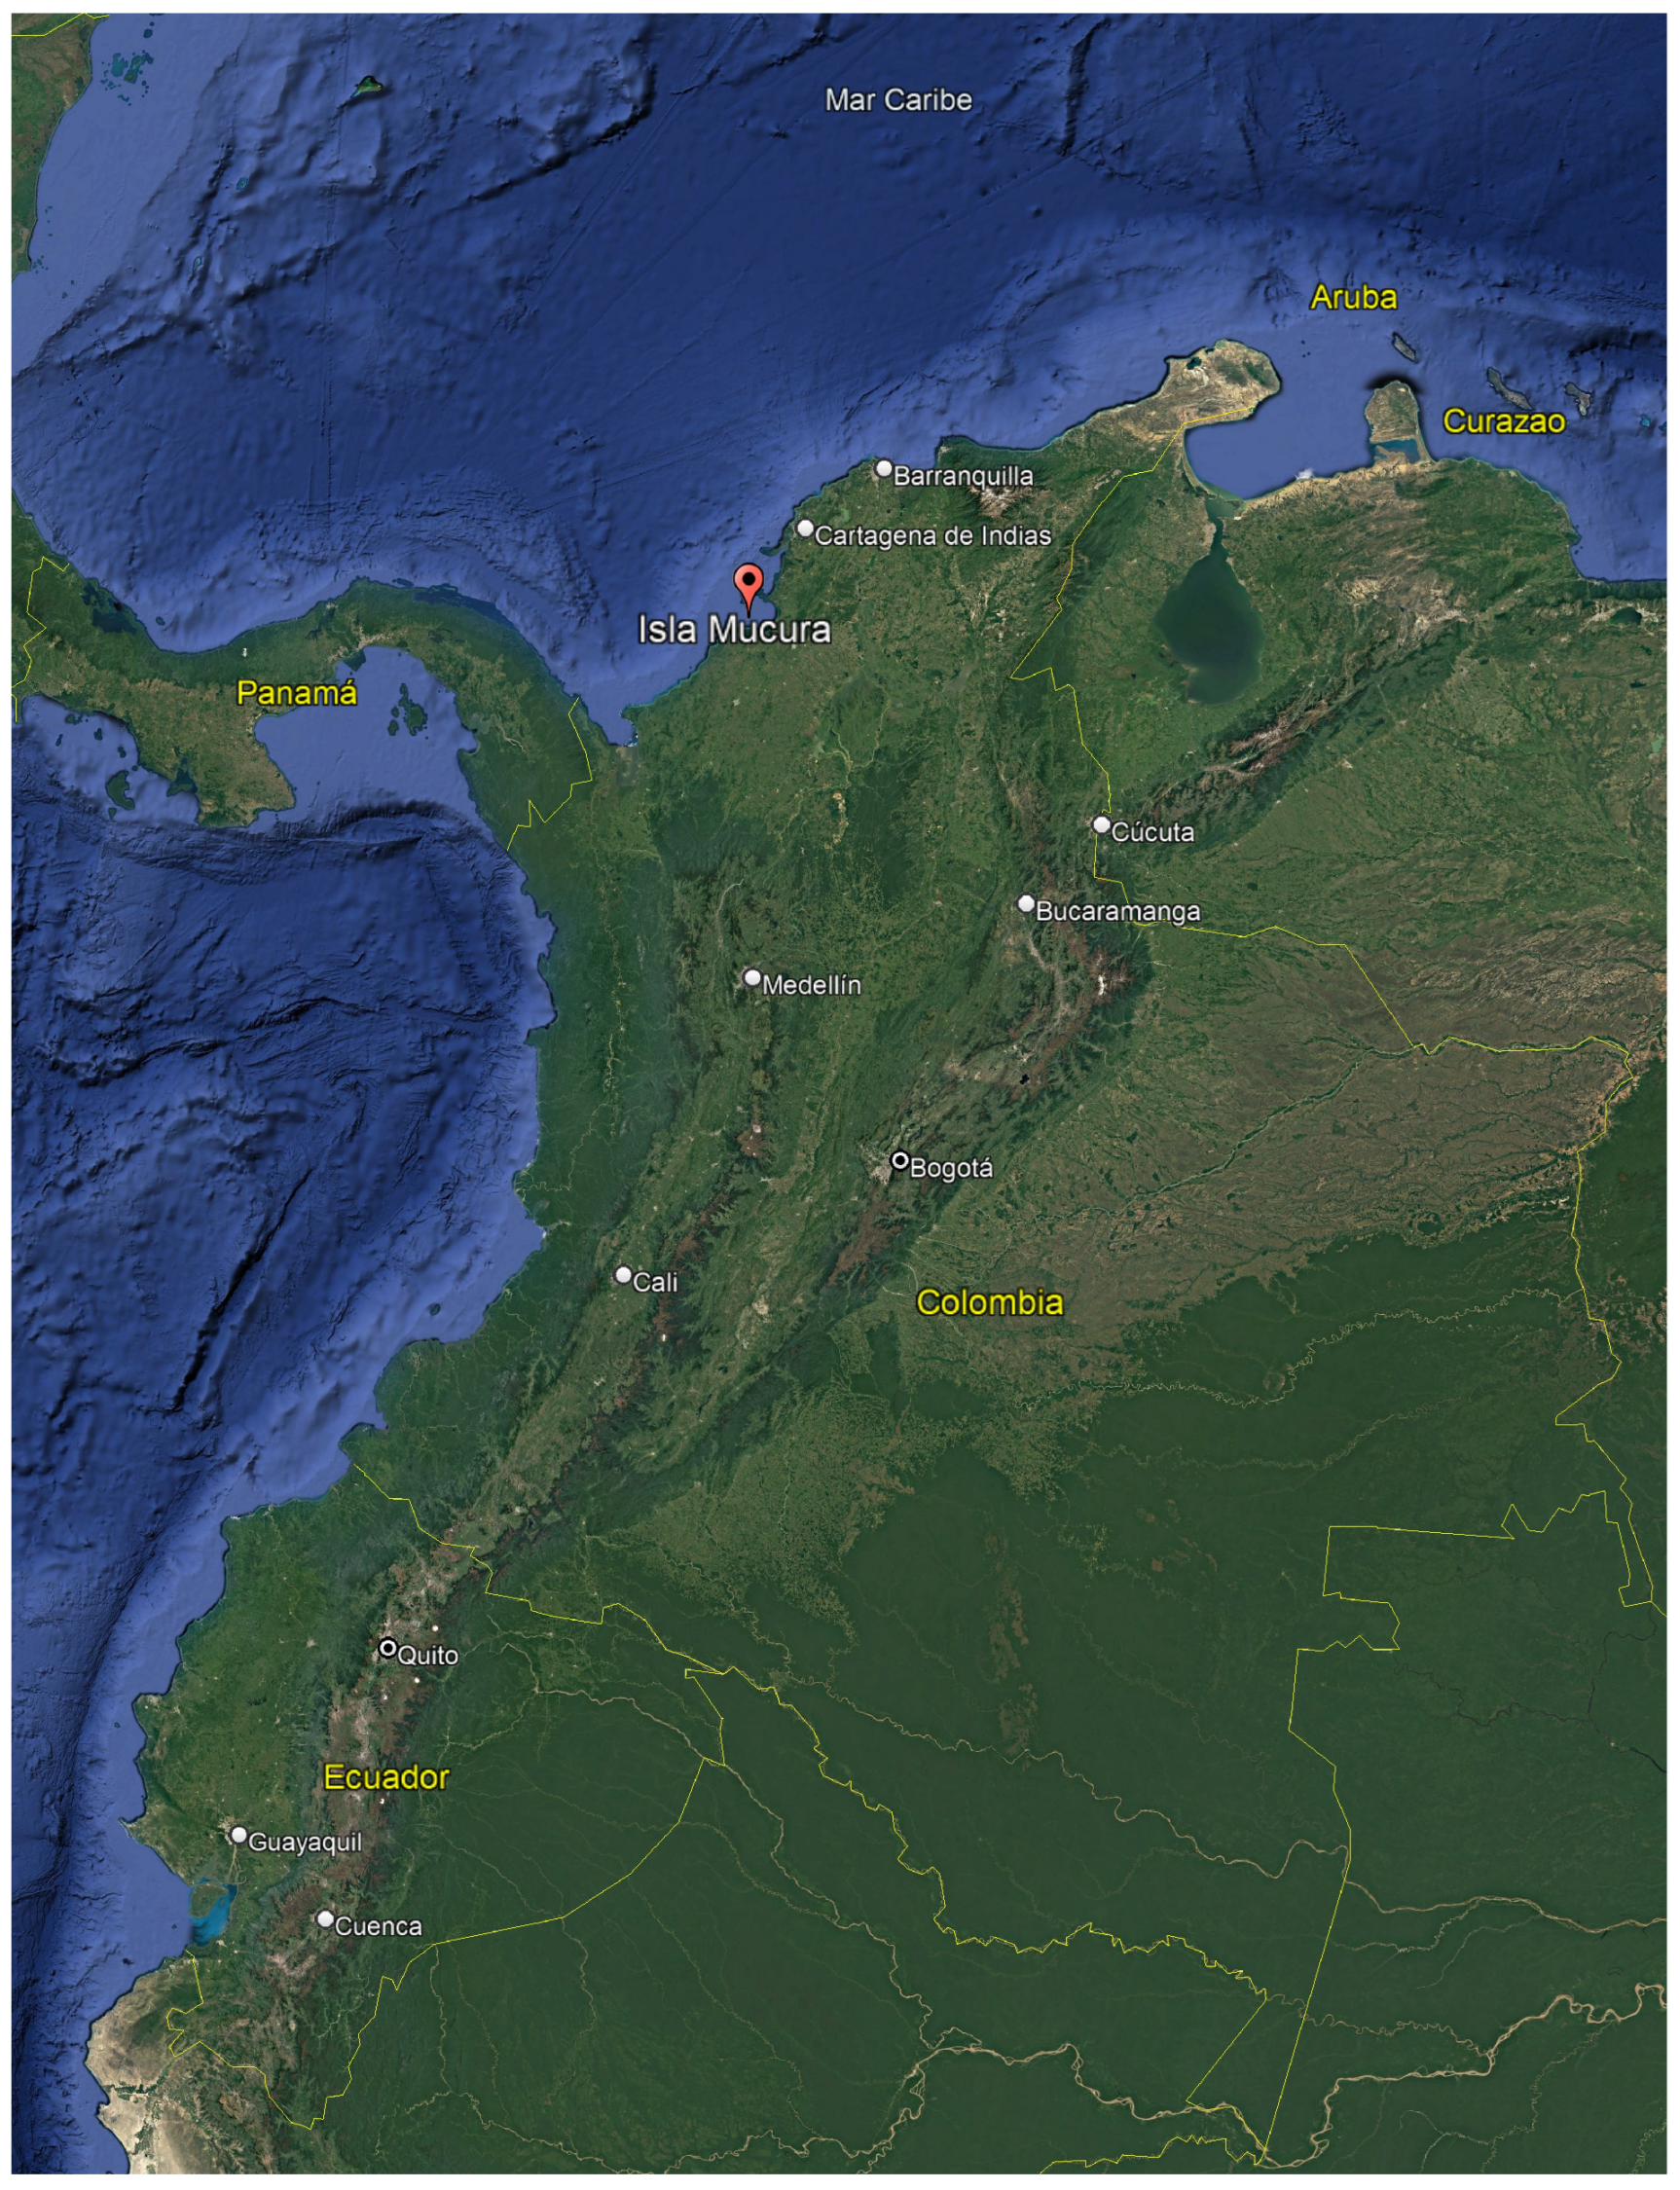
5.3. Select a Case Study

Isla Múcura (Cartagena-Bolívar) is selected because the demand curve shows high consumption during night hours, reducing consumption during the day. Thus, BESSs are required to support PV generation. Isla Múcura is located at the Gulf of Morrosquillo in the Caribbean Sea, as shown in Figure 5. The island registers 43 electrical users who depend on a hybrid energy system formed by a 30 kW PV system and 24.8 kW Caterpillar DG. This electric system provides a limited service of 15 h per day, and the maximum average power peak is 19 kW [29].
This scenario is appropriate for including a BESS to store the high amount of energy provided by the PV system during the day, and the system can deliver energy during the evening. This is a case where introducing a BESS can minimize the use of DG. Isla Múcura is a ZNI in Colombia, with limited data coverage because the telemetry systems have poor responses.

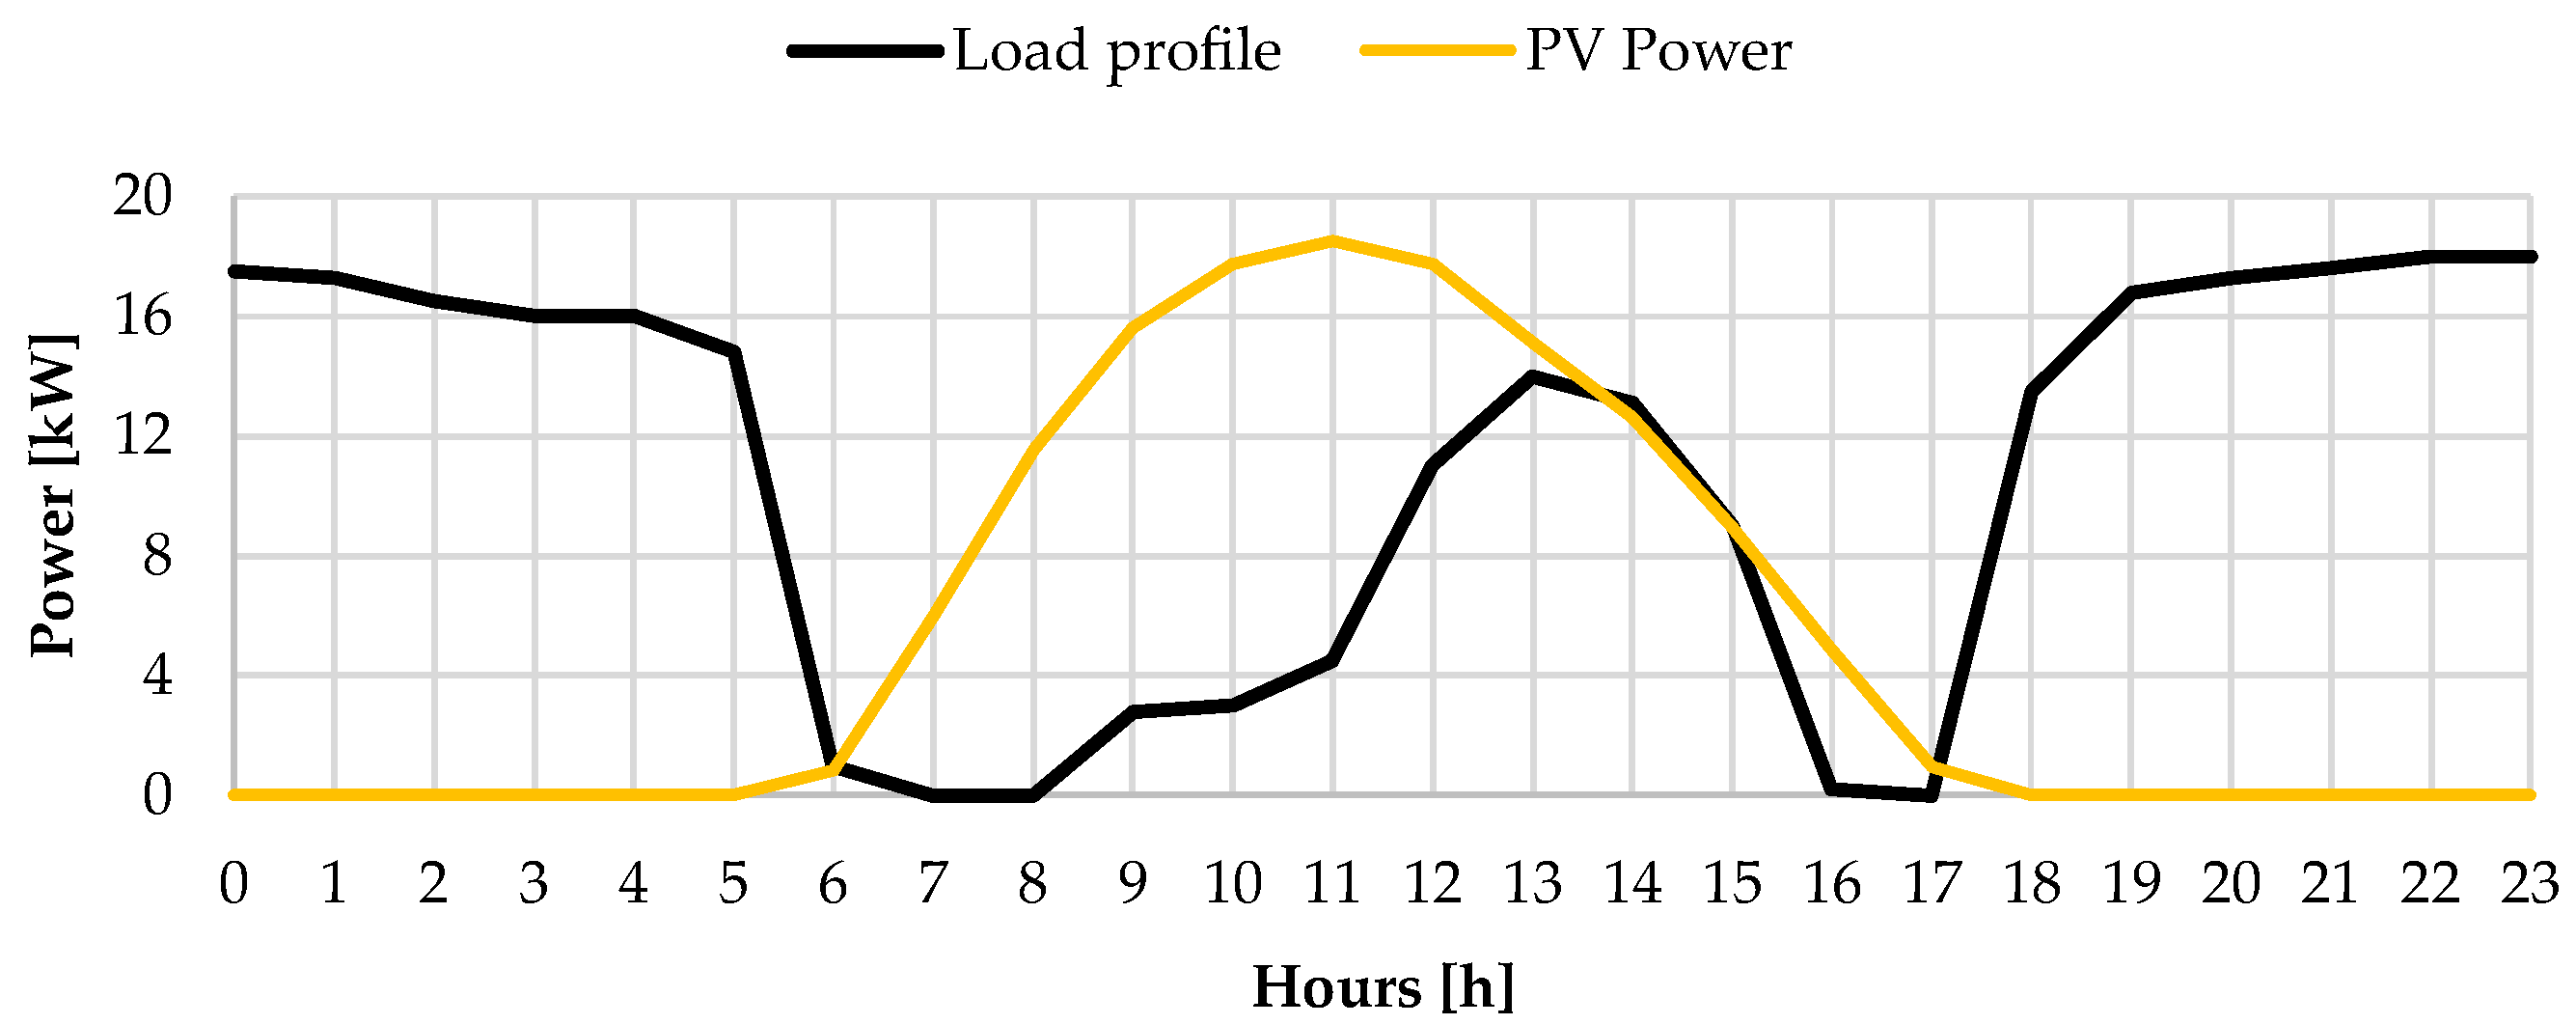
5.4. Characterize the Case Study

The load profile is taken from the monthly average daily load curves recorded in [29] by the governmental IPSE institution. Due to the lack of continuous and reliable telemetry data, the strategy of selecting the month with the highest energy consumption out of the last twelve months is adopted. The resulting curve provides a profile of 24 h of consumption, where some hours have zero loads, which could be the result of the low sensitivity of the measurement devices or real null consumption. The local potential of PV energy is determined from [29]. Then, the Renewables.ninja simulation tool, given in [33], is used to predict the PV power from the installed PV capacity and geographical location.
The month with the maximum average daily energy consumption, during the last one-year period of Isla Múcura, is March [29]. Moreover, the local energy potential is obtained from [33]. The PV power potential and consumption profiles for this location are shown in Figure 6, where it is observed that in the morning (6 am to 12 pm), PV solar power is higher than consumption power. Meanwhile, the DG is required for operation during the evening.

5.5. Parameterization of the Solution Model

The cost function of the optimization problem is defined in (1). Relevant to this, the diesel fuel cost C F D G ( t ) is calculated by (3), in which C f u e l is equal to COP 2.382 per liter, following the data given in [34]. The diesel fuel consumption function q ( t ) is given in (2), which requires several parameters given by the DG manufacturer. In this case, its parameterization is based on the DG Cummins AC165 at 132 kW [35], which is similar to the 124.8 kW DG located in Isla Múcura. As observed in the fuel consumption curve of Figure 7, the DG exhibits three n v operating linear segments; from these, the slope α v and intercept β v required in (2) are obtained. The pair values ( α and β ) for the three segments are as follows: ( 0.2424 , 3 ), ( 0.2121 , 4 ), and (0.2424, 2).
On the other hand, the DG startup cost C S T D G ( t ) in (1) depends on the DG’s operating constraints, which are defined in (9). The upper and lower limits ( P D , v M a x and P D , v M i n ) of the operating segments are determined from Figure 7. By the generator model, the maximum power corresponds to the upper limit of the third operative segment P D , 3 M a x , which is equal to 132 kW. The lower limit of the first operative segment P D , 1 M i n is defined by the minimum power of DG. For this value, the manufacturer recommends a limit of 10% of the nominal power, which results in P D , 1 M i n being equal to 13.2 kW. The interception between the first and second segments of the fuel consumption function provides the maximum and minimum limits of the first and second operating segments, respectively. These parameters are P D , 1 M a x and P D , 2 M i n , which are equal to 33 kW. In a similar way, the values of P D , 2 M a x and P D , 3 M i n are calculated as 66 kW.
The DG startup cost C S T D G is calculated from (4), and this depends on fixed ignition cost C s t u p , which is determined from the fuel cost needed to reach the minimum technical power required to operate the DG. As it is shown in (18), this value corresponds to 9% of the nominal power ( 0.09 · P D , 3 M a x ). The values α 1 , β 1 , and P D , 3 M a x were previously discussed. Hence, C s t u p is equal to COP 14,006.16.
C s t u p = [ α 1 · ( 0.09 · P D , 3 M a x ) + β 1 ] · C f u e l
On the other hand, the parameters of the operative cost model for the BESS, C B T ( t ) , are calculated as follows. The parameter γ B D in (5) is 1 for considering positive power for the discharging mode. Meanwhile, γ B C in (6) adopts the value of 1 to represent the charging power as negative. The intercepts λ B D and λ B C are adjusted to COP zero, which means that the energy stored at the BESS is not penalized. In addition, the operating constraints of the discharging and charging modes of the BESS, defined in (13) and (14), respectively, are as follows: The maximum power of discharging P B D M a x is calculated by (19), which represents the BESS power required to satisfy the peak demand; in Isla Múcura, this peak is 18 kW, as observed in Figure 6. In the same way, the minimum charge power P B C M i n is defined in (20), which corresponds to the maximum energy generated by the PV system during the highest supply periods; from Figure 6, it is equal to −18.83 kW.
P B D M a x = M a x ( P L ( t ) )
P B C M a x = M a x ( P P V ( t ) )
A sensitivity analysis is carried out to evaluate the influence of the BESS’s operative cost on its optimal size. Figure 8 reports such analyses, where the operative costs of the BESS are changed from 0 % to 100 % of C f u e l ; these operative costs correspond to the cost of charging and discharging the BESS, i.e., those defined in (5) and (6), which in turn modify the cost function of the DG, C f u e l . Both operative costs are changed in the same proportion. The results, reported in Figure 8, show that the BESS’s sizing remains stable relative to the changes in the BESS’s operative costs, demonstrating the robustness of the MILP algorithm for this problem.
Finally, the parameters of the stored energy function E B ( t ) (16) are set to 100 % for the discharging efficiency and 90 % for the charging efficiency [36]. The constraints of E B ( t ) (17) are set to 0 kWh for the minimum stored energy E B M i n , and they are set to 10 10 for the maximum stored energy, which avoids restricting the size of the BESS during the optimization process.
The parameterization values of the Colombian case study are summarized in Table 3.

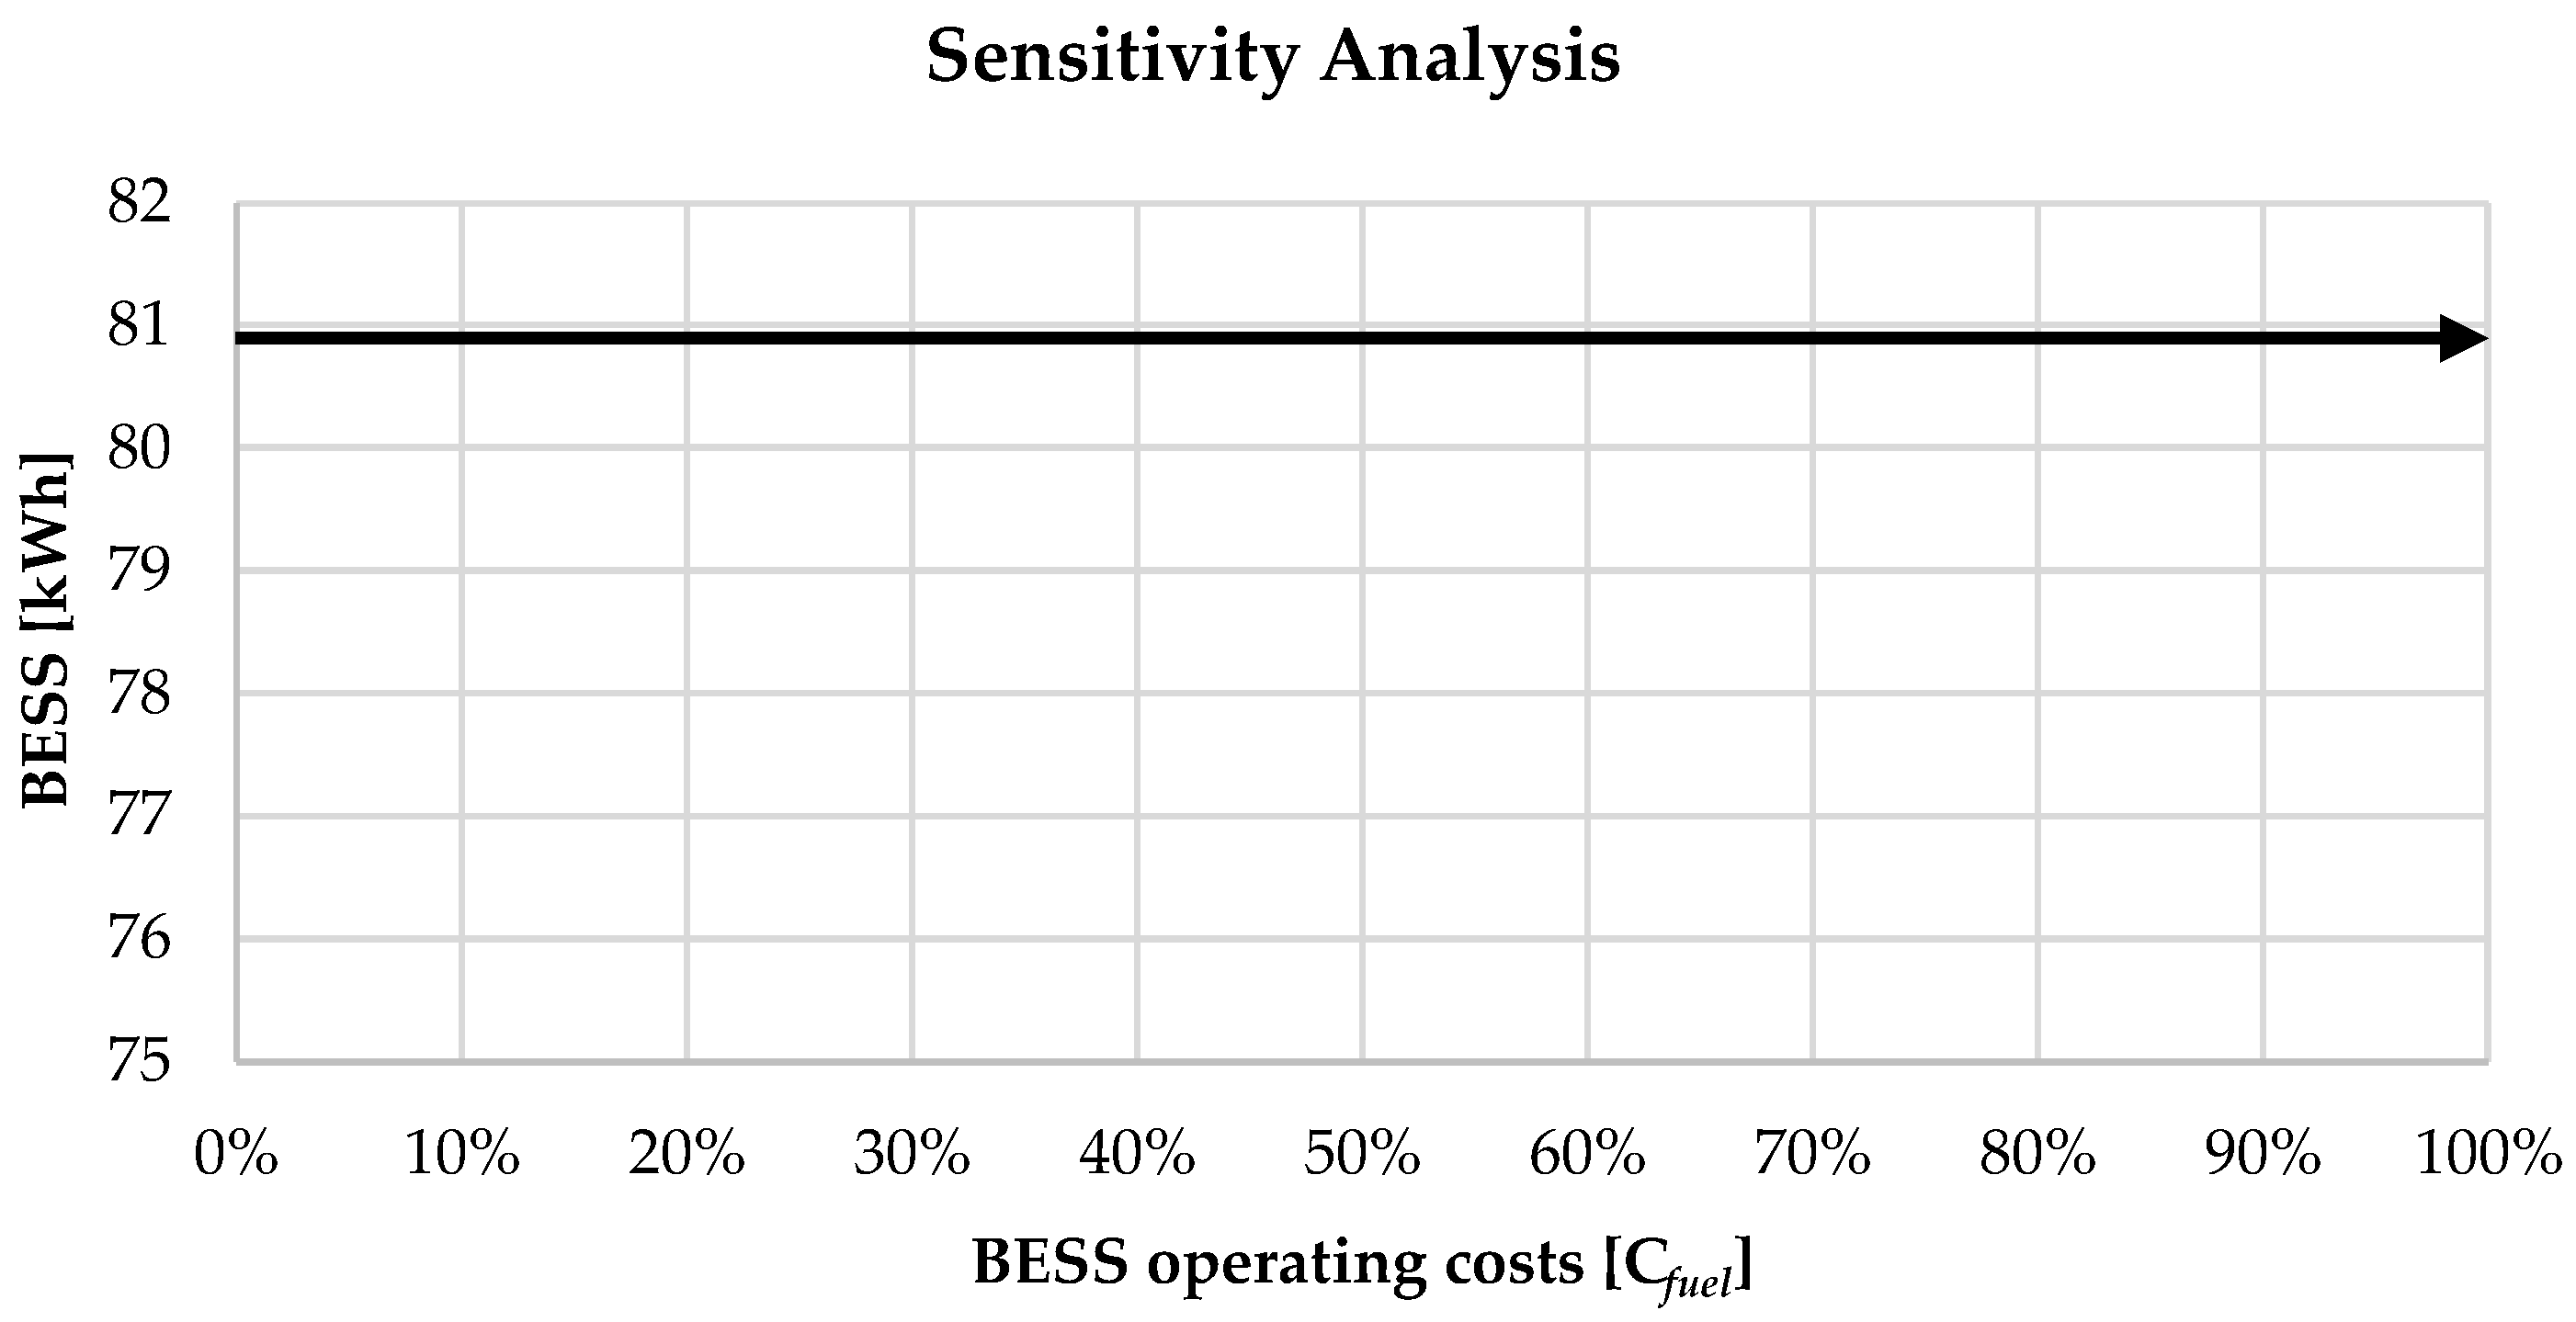
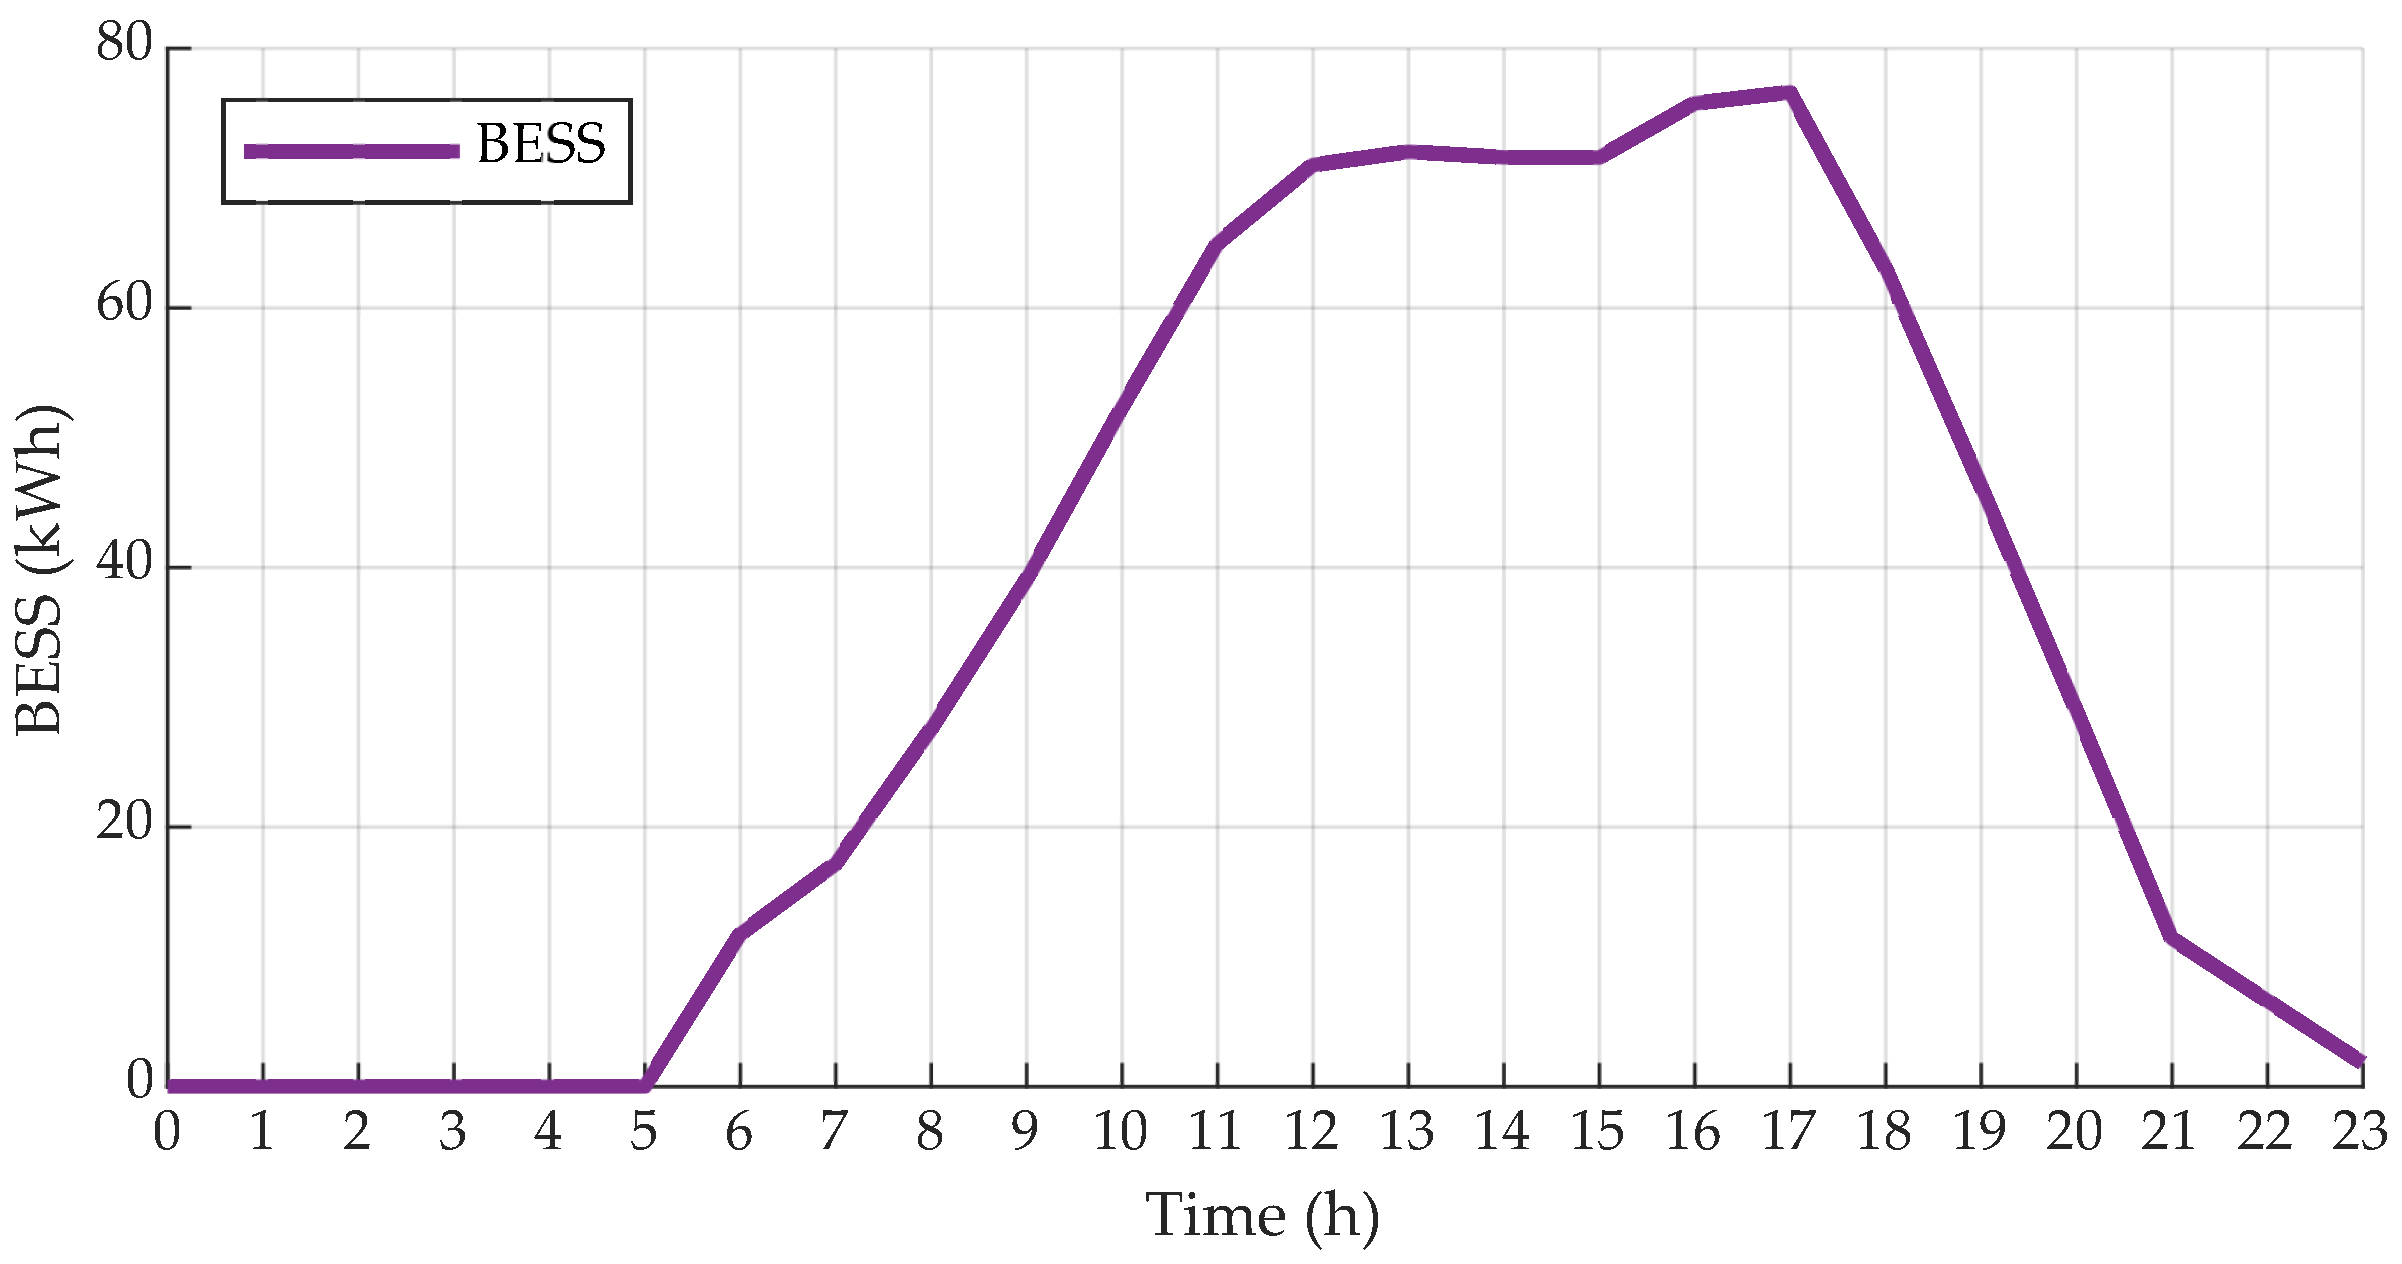
5.6. Analysis of Results for the Case Study

The optimization model is programmed using Matlab software (Version R2024b). The results are reported in Figure 9 and Figure 10, which show the hourly profile of the BESS in blue, the load profile in black, the PV profile in yellow, the DG profile in green, and the stored energy in the BESS in magenta (Figure 10).
It is observed that between 00:00 and 5:00, the demand is completely satisfied by DG generation, since there is no stored energy in the BESS. From 5:00 to 6:00, PV generation only covers a fraction of the load. Because the demand is below the minimum operating level of the DG, the DG generates enough energy to satisfy the demand and produce a surplus that is stored in the BESS. Between 6:00 and 17:00, photovoltaic generation exceeds the demand, thus covering the load demand and charging the BESS with surplus energy. From 17:00 to 21:00, the demand must be covered by the energy stored in the BESS due to a reduction in PV generation. Finally, from 21:00 to 23:00, the remaining energy in the BESS is not enough to cover the total demand, requiring the operation of the DG at its minimum level.
Based on the maximum charging and discharging power of the BESS presented in Figure 9, as well as the difference between the maximum and minimum energy stored in the BESS, as presented in Figure 10, it is determined that the optimum power and capacity of the BESS for the Isla Múcura case are 17.6 kW and 76.61 kWh, respectively. The resulting size of the BESS is significantly smaller than the system currently installed at Isla Múcura, which, as reported in Table 2, consists of 96 batteries rated at 2500 Ah/2 V each, providing a total installed capacity of 480 kWh. The BESS size reduction implies a proportional reduction in the maintenance costs of the BESS, corresponding diverse activities such as periodic charging and discharging for the capacity tests of batteries, the inspection of terminal connections and corrosion, the rental of storage locations, and the servicing of refrigeration areas [37]. In the case of Isla Múcura, based on the 2500 Ah/2 V batteries, the required capacity of 76.61 kWh reduces the number of batteries from 96 to 16, thus generating a proportional reduction of 83.33% relative to the maintenance costs associated with the BESS’s components. In addition, this reduction impacts, in proportional way, the charging and discharging tests since the number of batteries to be tested decreases proportionally. The same applies to the periodic inspections of terminal connections and corrosion, the frequency of which is reduced as the number of batteries decreases, thereby reducing maintenance costs. In terms of storage space, considering a commercial 2500 Ah/2 V battery with dimensions of 712 mm (length), 353 mm (width), and 342 mm (height), as reported in [38], and a vertical layout of two-level shelving with 20% additional separation between the batteries and 30% more for operational safety, the area required for the 16 batteries is reduced to 3.14 m2 compared to 18.82 m2 for the 96 batteries, which implies a proportional decrease in renting space and, therefore, a decrease in the costs associated with storage. Finally, to determine the cost of cooling the BESS, the frigorie (fg) unit is used, which is the unit of power used to measure the absorption of thermal energy in an enclosure. It is estimated that approximately 100 fg per square meter is required to maintain the temperature in a given space. Therefore, the cost of cooling is also reduced, given that an area of 3.14 m2 requires 314 fg compared to the 1882 fg needed for a space of 18.82 m2, resulting in a proportional decrease in cooling costs and in the total maintenance cost [39]. This means that the currently installed solution involves higher maintenance costs, while the size obtained with the proposed solution allows a reduction in costs without affecting the technical requirements of the microgrid.

6. Conclusions

This work proposed and illustrated a method for determining the BESS size for microgrids. The method requires developing six steps. The first two steps involve searching for information on existing microgrids in which a BESS could help mitigate technical, financial, or environmental problems, among others. Steps three and four are related to characterizing the case study; this means obtaining relevant information on a specific existing microgrid. The parameterization of the optimization problem is developed in step five, which requires the cost information of the different sources that form the microgrid. The implementation of the proposed optimization algorithm should be realized using specialized software, and the results are analyzed in the proposed step six. The algorithm provides a BESS size that satisfies the operational requirements of a load, taking into account the load and source profiles for the worst-case scenario. The proposed method was tested for the case study of Isla Múcura, resulting in an optimal BESS power of 17.6 kW and a capacity of 76.61 kWh, which is lower than the existing 480 kWh system. This reduction in the BESS’s size also implies a reduction in maintenance costs, because a lower number of batteries requires fewer tests, reduced rental space, and smaller refrigeration units. An analysis using commercial batteries of 2500 Ah/2 V provided reductions of 83.33% relative to the costs associated with the BESS tests, the area required to install the batteries, and the cooling units.
Mixed integer linear programming (MILP) was selected as the optimization algorithm because it is appropriate for dealing with discontinuous operating points, which is a characteristic of diesel generators (DGs), these being the most common sources in the off-grid regions of Colombia. Moreover, a sensitivity analysis demonstrated that the MILP algorithm provides robustness in the sizing process under varying economic conditions. The objective function for the optimization problem was based on cost parameters, which are related to the sources forming the microgrid. The proposed model incorporates technical aspects of the microgrid and the constraints of local infrastructure. This approach provided a BESS size that guarantees the technical operation of the microgrid; this means that it fits the specific energy needs and constraints of the specific microgrid.
The proposed method was tested on a ZNI in Colombia. However, it is suitable for application in other regions of the word. The method involves the definition of the microgrid’s topology and the development of a solution model that incorporates technical aspects and includes local infrastructure. This method is particularly suited for environments with limited data and telemetry, offering a flexible approach to BESS sizing decisions. By focusing on technical and economic parameters, the method ensures that the resulting BESS configuration is technically and economically viable, contributing to the sustainable development of microgrids in the ZNI of Colombia.
Future work may focus on extending the proposed method to multi-objective optimization approaches, which simultaneously consider not only cost minimization but also environmental impacts, reliability indicators, and system resilience. Additionally, by incorporating real-time scheduling algorithms, a dynamic adaption of the optimization model to demand and generation variability is possible, which is particularly relevant for microgrids in isolated regions. Furthermore, incorporating degradation models into the optimization process would provide more accurate sizing results, and this is because the usable energy and lifespan of batteries are affected by different degradation mechanisms.

Author Contributions

Conceptualization, A.F.Z.-M., M.L.O.-G. and D.M.L.-S.; methodology, A.F.Z.-M., M.L.O.-G. and D.M.L.-S.; software, A.F.Z.-M.; validation, A.F.Z.-M.; formal analysis, A.F.Z.-M., D.M.L.-S., C.A.R.-P. and J.A.M.-O.; writing—original draft preparation, A.F.Z.-M., C.A.R.-P. and J.A.M.-O.; writing—review and editing, A.F.Z.-M., M.L.O.-G., D.M.L.-S., C.A.R.-P. and J.A.M.-O.; supervision, M.L.O.-G., D.M.L.-S. and C.A.R.-P. All authors have read and agreed to the published version of the manuscript.

Funding

This research was funded by Minciencias, Universidad del Valle, Universidad Nacional de Colombia, and Instituto Tecnológico Metropolitano under the research project “Métodos y Herramientas para el Diseño, Dimensionamiento y Control de Sistemas de Almacenamiento de Energía en sistemas eléctricos basados en fuentes renovables no convencionales, para zonas urbanas y rurales” (Minciencias code 70634, Sicop Code C.I. 21154), which belongs to the research program “Estrategias para el desarrollo de sistemas energéticos sostenibles, confiables, eficientes y accesibles para el futuro de Colombia” (Minciencias code 1150-852-70378; Hermes code 46771; Sicop codes C.I. 21154, 21173, and 21174; and ITM code RC 80740-178-2021-1).

Data Availability Statement

Data are contained within the article.

Conflicts of Interest

The authors declare no conflicts of interest.

Nomenclature

Symbols
C ( t ) Objective function cost
C F D G ( t ) Cost of diesel fuel
C S T D G ( t ) Cost of starting the diesel generator
C B T ( t ) Cost of using the battery
P D , v ( t ) Power delivered by the diesel generator
B D , v ( t ) Binary variable for the diesel generator
B D , v ( t 1 )       Binary variable for the diesel generator at a previous time step
q ( t ) Diesel fuel consumption
vLinear segment in the diesel fuel consumption function
n v Number of linear segments in the diesel fuel consumption function
α v Slope of the diesel fuel consumption function
β v Intercept of the diesel fuel consumption function
C f u e l Cost of diesel fuel in Colombian Pesos per liter
C s t u p Cost of starting the diesel generator
C B D T ( t ) Battery discharge cost function
C B C T ( t ) Battery charge cost function
P B D ( t ) Power delivered by the battery
P B C ( t ) Power absorbed by the battery
Z B D ( t ) Binary variable for battery discharge
Z B C ( t ) Binary variable for battery charge
γ B D Unitary factor for battery discharge cost
γ B C Unitary factor for battery charge cost
λ B D Intercept for battery discharge cost
λ B C Intercept for battery charge cost
C B D Battery discharge cost
C B C Battery charge cost
P P V ( t ) Power delivered by the photovoltaic array
P L ( t ) Power demand by the load
P D , v M i n Minimum power of diesel generator
P D , v M a x Maximum power of diesel generator
P B D M i n Minimum discharge power of the battery
P B D M a x Maximum discharge power of the battery
P B C M i n Minimum charge power of the battery
P B C M a x Maximum charge power of the battery
E B ( t ) Energy stored in the battery
E B ( t 1 ) Energy stored in the battery at previous time step
η B D Discharge efficiency of battery
η B C Charge efficiency of battery
Abbreviations
BESSBattery energy storage system
ZNINon-interconnected zones
DERsDistributed energy resources
DGDiesel generator
PVPhotovoltaic
IPSEInstitute for the Planning and Promotion of Energy Solutions
MILPMixed integer linear programming

References

  1. Chen, S.X.; Gooi, H.B.; Wang, M.Q. Sizing of Energy Storage for Microgrids. IEEE Trans. Smart Grid 2012, 3, 142–151. [Google Scholar] [CrossRef]
  2. Li, X.; Hu, C.; Luo, S.; Lu, H.; Piao, Z.; Jing, L. Distributed Hybrid-Triggered Observer-Based Secondary Control of Multi-Bus DC Microgrids Over Directed Networks. IEEE Trans. Circuits Syst. I Regul. Pap. 2025, 72, 2467–2480. [Google Scholar] [CrossRef]
  3. Li, W.; Zou, Y.; Yang, H.; Fu, X.; Xiang, S.; Li, Z. Two-Stage Stochastic Energy Scheduling for Multi-Energy Rural Microgrids With Irrigation Systems and Biomass Fermentation. IEEE Trans. Smart Grid 2025, 16, 1075–1087. [Google Scholar] [CrossRef]
  4. Bahramirad, S.; Reder, W.; Khodaei, A. Reliability-Constrained Optimal Sizing of Energy Storage System in a Microgrid. IEEE Trans. Smart Grid 2012, 3, 2056–2062. [Google Scholar] [CrossRef]
  5. Alsaidan, I.; Khodaei, A.; Gao, W. A Comprehensive Battery Energy Storage Optimal Sizing Model for Microgrid Applications. IEEE Trans. Power Syst. 2018, 33, 3968–3980. [Google Scholar] [CrossRef]
  6. Amini, M.; Khorsandi, A.; Vahidi, B.; Hosseinian, S.H.; Malakmahmoudi, A. Optimal sizing of battery energy storage in a microgrid considering capacity degradation and replacement year. Electr. Power Syst. Res. 2021, 195, 107170. [Google Scholar] [CrossRef]
  7. Nguyen, T.A.; Crow, M.L.; Elmore, A.C. Optimal Sizing of a Vanadium Redox Battery System for Microgrid Systems. IEEE Trans. Sustain. Energy 2015, 6, 729–737. [Google Scholar] [CrossRef]
  8. Mozafari, B.; Mohammadi, S. Optimal sizing of energy storage system for microgrids. Sadhana 2014, 39, 819–841. [Google Scholar] [CrossRef]
  9. Takano, H.; Hayashi, R.; Asano, H.; Goda, T. Optimal Sizing of Battery Energy Storage Systems Considering Cooperative Operation with Microgrid Components. Energies 2021, 14, 7442. [Google Scholar] [CrossRef]
  10. Fossati, J.P.; Galarza, A.; Martín-Villate, A.; Fontán, L. A method for optimal sizing energy storage systems for microgrids. Renew. Energy 2015, 77, 539–549. [Google Scholar] [CrossRef]
  11. Bahmani-Firouzi, B.; Azizipanah-Abarghooee, R. Optimal sizing of battery energy storage for micro-grid operation management using a new improved bat algorithm. Int. J. Electr. Power Energy Syst. 2014, 56, 42–54. [Google Scholar] [CrossRef]
  12. Sharma, S.; Bhattacharjee, S.; Bhattacharya, A. Grey wolf optimisation for optimal sizing of battery energy storage device to minimise operation cost of microgrid. IET Gener. Transm. Distrib. 2016, 10, 625–637. [Google Scholar] [CrossRef]
  13. Zolfaghari, M.; Ghaffarzadeh, N.; Ardakani, A.J. Optimal sizing of battery energy storage systems in off-grid micro grids using convex optimization. J. Energy Storage 2019, 23, 44–56. [Google Scholar] [CrossRef]
  14. Quynh, N.V.; Ali, Z.M.; Alhaider, M.M.; Rezvani, A.; Suzuki, K. Optimal energy management strategy for a renewable-based microgrid considering sizing of battery energy storage with control policies. Int. J. Energy Res. 2021, 45, 5766–5780. [Google Scholar] [CrossRef]
  15. Vaka, S.S.K.R.; Matam, S.K. Optimal Sizing and Management of Battery Energy Storage Systems in Microgrids for Operating Cost Minimization. Electr. Power Compon. Syst. 2021, 49, 1319–1332. [Google Scholar] [CrossRef]
  16. Tejero-Gómez, J.A.; Bayod-Rújula, Á.A. Analysis of Grid-Scale Photovoltaic Plants Incorporating Battery Storage with Daily Constant Setpoints. Energies 2024, 17, 6117. [Google Scholar] [CrossRef]
  17. Bade, S.O.; Tomomewo, O.S.; Meenakshisundaram, A.; Dey, M.; Alamooti, M.; Halwany, N. Multi-Criteria Optimization of a Hybrid Renewable Energy System Using Particle Swarm Optimization for Optimal Sizing and Performance Evaluation. Clean Technol. 2025, 7, 23. [Google Scholar] [CrossRef]
  18. Alshamri, H.; Cockerill, T.; Tomlin, A.S.; Al-Damook, M.; Al Qubeissi, M. On–off-Grid Optimal Hybrid Renewable Energy Systems for House Units in Iraq. Clean Technol. 2024, 6, 602–624. [Google Scholar] [CrossRef]
  19. Trivić, B.; Savić, A. Optimal Allocation and Sizing of BESS in a Distribution Network with High PV Production Using NSGA-II and LP Optimization Methods. Energies 2025, 18, 1076. [Google Scholar] [CrossRef]
  20. Saleeb, H.; El-Rifaie, A.M.; Sayed, K.; Accouche, O.; Mohamed, S.A.; Kassem, R. Optimal Sizing and Techno-Economic Feasibility of Hybrid Microgrid. Processes 2025, 13, 1209. [Google Scholar] [CrossRef]
  21. Rus-Casas, C.; Gilabert-Torres, C.; Fernández-Carrasco, J.I. Optimizing Energy Management and Sizing of Photovoltaic Batteries for a Household in Granada, Spain: A Novel Approach Considering Time Resolution. Batteries 2024, 10, 358. [Google Scholar] [CrossRef]
  22. Amin, S.M.M.; Hossain, N.; Lipu, M.S.H.; Urooj, S.; Akter, A. Development of a PV/Battery Micro-Grid for a Data Center in Bangladesh: Resilience and Sustainability Analysis. Sustainability 2023, 15, 15691. [Google Scholar] [CrossRef]
  23. Jarso, A.K.; Jin, G.; Ahn, J. Hybrid Genetic Algorithm-Based Optimal Sizing of a PV–Wind–Diesel–Battery Microgrid: A Case Study for the ICT Center, Ethiopia. Mathematics 2025, 13, 985. [Google Scholar] [CrossRef]
  24. Guamán-Molina, J.; Pesantez, P.; Chavez-Fuentez, C.; Ríos, A. Industrial Application of Photovoltaic Systems with Storage for Peak Shaving: Ecuador Case Study. Eng. Proc. 2023, 47, 15. [Google Scholar] [CrossRef]
  25. La Bella, A.; Cominesi, S.R.; Sandroni, C.; Scattolini, R. Hierarchical predictive control of microgrids in islanded operation. IEEE Trans. Autom. Sci. Eng. 2016, 14, 536–546. [Google Scholar] [CrossRef]
  26. Hannan, M.; Faisal, M.; Ker, P.J.; Begum, R.; Dong, Z.; Zhang, C. Review of optimal methods and algorithms for sizing energy storage systems to achieve decarbonization in microgrid applications. Renew. Sustain. Energy Rev. 2020, 131, 110022. [Google Scholar] [CrossRef]
  27. Ton, D.T.; Smith, M.A. The U.S. Department of Energy’s Microgrid Initiative. Electr. J. 2012, 25, 84–94. [Google Scholar] [CrossRef]
  28. UPME. Plan Indicativo de Expansión de Cobertura de Energía Eléctrica—PIEC 2019–2023. Available online: https://www1.upme.gov.co/siel/Pages/Plan-indicativo-expansion-cobertura-EE-PIEC.aspx (accessed on 20 April 2024).
  29. IPSE. Centro Nacional de Monitoreo. Available online: https://ipse.gov.co/cnm/ (accessed on 20 April 2024).
  30. Linderoth, J.T.; Lodi, A. MILP software. Wiley Encycl. Oper. Res. Manag. Sci. 2010, 5, 3239–3248. [Google Scholar]
  31. Palma-Behnke, R.; Benavides, C.; Lanas, F.; Severino, B.; Reyes, L.; Llanos, J.; Sáez, D. A Microgrid Energy Management System Based on the Rolling Horizon Strategy. IEEE Trans. Smart Grid 2013, 4, 996–1006. [Google Scholar] [CrossRef]
  32. IPSE. Guía Practica de Estructuración de Proyectos. Available online: https://ipse.gov.co/guia-practica-de-estructuracion-de-proyectos/ (accessed on 20 April 2024).
  33. Renewables.ninja. Solar Photovoltaic Power. Available online: https://www.renewables.ninja/ (accessed on 20 April 2024).
  34. GlobalPetrolPrices. Colombia Precios del Diesel. Available online: https://es.globalpetrolprices.com/Colombia/diesel_prices/ (accessed on 20 April 2024).
  35. Distribuidora, G.G. Catalogo Plantas Eléctricas. Available online: https://gedisa.com.ve/recientes_aun/catalogos/electricos/libreria_planta/ConjuntoMarco_01.html (accessed on 20 April 2024).
  36. Hu, C.; Luo, S.; Li, Z.; Wang, X.; Sun, L. Energy Coordinative Optimization of Wind-Storage-Load Microgrids Based on Short-Term Prediction. Energies 2015, 8, 1505–1528. [Google Scholar] [CrossRef]
  37. Megger. Battery Testing Guide. Available online: https://megger.widen.net/s/cdtz6qcgg5/batterytesting-guide_en_v02 (accessed on 24 April 2025).
  38. Made in China. Batería Solar de Plomo-ácido Sellada SMF de 2V 2500ah Cspower. Available online: https://es.made-in-china.com/co_cspower/product_Cspower-2V-2500ah-SMF-Sealed-Lead-Acid-Battery-Solar-Battery_rnoinnuug.html (accessed on 24 April 2025).
  39. HITACHI. ¿Cómo Calcular la Potencia de Aire Acondicionado para una Superficie Determinada? Available online: https://www.hitachiaircon.com/es/noticias/descubre-como-calcular-la-potencia-de-aire-acondicionado-que-necesitas-para-tu-casa (accessed on 24 April 2025).
Figure 1. Example structure of a microgrid.
Computation 13 00114 g001
Figure 2. Fuel consumption function for DG.
Computation 13 00114 g002
Figure 3. Cost function of using BESS.
Computation 13 00114 g003
Figure 4. Flowchart of the BESS sizing method for ZNIs in Colombia.
Computation 13 00114 g004
Figure 5. Geographical location of Isla Mucura.
Computation 13 00114 g005
Figure 6. Load and PV power profiles of Isla Múcura.
Computation 13 00114 g006
Figure 7. Fuel consumption curve of the DG in Isla Múcura.
Computation 13 00114 g007
Figure 8. Sensitivity analysis of BESS sizing.
Computation 13 00114 g008
Figure 9. Hourly Power profile of the microgrid.
Computation 13 00114 g009
Figure 10. Hourly stored energy profile.
Computation 13 00114 g010
Table 1. BESS sizing methods for different applications.
Ref.AdvantagesDisadvantagesApplication Cases
[5]Determine the size of the BESS considering different technologies, degradation, and discharge depth.Require annual hourly demand profiles, energy flow models, and financial parameters.Projects of energy expansion in non-interconnect zones, systems with advanced monitoring and historical data.
[10]Integrate an energy management system with a BESS sizing strategy.Focused on energy systems with high wind generation penetration. Require annual hourly demand, generation, and financial data.Interconnected microgrids able to work in isolated mode.
[16]Determine the BESS size to improve the reliability in PV systems.Focused on large-scale photovoltaic plants; hence, it is limited to small-scale rural applications.Grid-connected solar plants to ensure reliable power for participating in intraday markets.
[22]Integrate resilient cost and renewable energy penetration indicators in a BESS and PV size method.Focused on data centers in urban areas; hence, it has limited application on ZNI or rural zones with reduced data available.Critical infrastructure in urban areas with vulnerable or unstable electrical grids.
[24]Evaluate self-consumption and peak-shaving strategies through technical–economic analysis, comparing investment, energy savings, and financial viability.Limited to interconnected systems. Low robustness in front of multiple constraints.Grid-connected industries facing peak usage penalties, where regulations allow peak-shaving strategies.
[19]Simultaneous multi-objective optimization of costs and technical indicators such as energy losses and voltage deviation.Require data infrastructure, such as demand distribution and solar production by node, limiting its practical application to grid-connected networks with monitoring systems.Medium-voltage distribution networks with high PV penetration, in which technical performance and efficiency are improved through energy storage.
[13]Guarantee globally optimal solutions, minimizing operational costs and achieving rapid convergence compared to heuristic algorithms.Require dynamic restrictions for the diesel generator; thus, monitoring is required. Due to some restrictions, there is a reduced fidelity in startups and switching operating modes.Isolated microgrids formed by different sources, with high monitoring capacity.
[7]Size power and capacity in systems with vanadium redox batteries. Optimize the daily operation through dynamic programming to maximize efficiency and minimize operating costs.Require specific parameters of the vanadium redox battery system, such as temperature, electrolyte voltage, and absorption curve.Critical and high-budget facilities. Advanced system instrumentation for the vanadium redox batteries is required.
[6]Consider degradation and optimal replacement cycle for multiple technologies, enabling long-term technical and economic selection of the BESS.Grid-connected operation with occasional island operation. Require annual hourly demand and generation profiles.Urban or industrial areas with high data availability, in which long-term strategic planning and economic analysis of the BESS are required.
[20]Integrate batteries for short-term storage and hydrogen generators for long-term storage, improving energy resilience in front of solar variability.Focused on grid-connected systems with occasional island operation mode.Grid-connected regions with high solar irradiance, green hydrogen potential, and unstable power grids.
[9]Bi-level optimization model that simultaneously determines the optimal size of BESS and optimal operating schedule of the controllable resources.Focused on grid-connected microgrids. Minimize penalties for power imbalance and consider controllable loads, which is uncommon in ZNI.Urban or industrial microgrids with controllable loads.
[8]Optimize the economic return by maximizing the net present value considering hourly prices, operation, and costs of the BESS.Focused on grid-connected microgrids, limiting its applicability in isolated areas.Microgrids connected to the power grid focused on maximize economic returns through energy arbitrage.
[21]High sizing accuracy by considering nonlinear degradation and a 5-minute time resolution in consumption and generation data, improving the profitability and useful life of a BESS.Require real-time and high-frequency monitoring, which is not feasible in rural communities.Grid-connected urban homes with advanced metering systems.
[11,12,14,15]Satisfactory reduction in operating costs, convergence times, and standard deviations compared to some heuristic methods.Formulation focused on microgrids interconnected to the electrical grid, which limits its applicability in isolated operating contexts.Interconnected microgrids with differentiated tariffs, energy exchange taxes, and reserve requirements supported by the main grid.
[17,18,23]Multi-objective optimization, including metrics such as annualized cost, and probability of supply interruption.Optimize the sizing of all components without in-depth technical and economic analysis of the BESS. This requires high-resolution hourly data for a full year, both for resources and the load profile.Microgrids in the planning stage where no pre-installed resources exist, requiring an optimal configuration design of the entire system.
Table 2. Renewable energy contributions in ZNI locations monitored using telemetry. Data from [29].
LocalitiesUsersDG [kW]PV [kW]BESS
Isla fuerte
(Cartagena-Bolívar)
431800175432 batteries
3.850 Ah/2 V
Isla Múcura
(Cartagena-Bolívar)
431253096 batteries
2.500 Ah/2 V
Santa cruz del islote
(Cartagena-Bolívar)
12710068144 batteries
4.800 Ah/2 V
San Francisco
(Acandí-Choco)
279224120No
San Roque
(Medio Atrato (Beté)-Choco)
208224120No
Unguía
(Unguía-Choco)
2.5361.540779116 kWp
24.800 Ah/2 V
Barranco Minas
(Barranco Minas-Guainía)
355225121No
Inírida
(Inírida-Guainía)
6.1599.2501.300No
Nazareth
(Uribia-La Guajira)
146600430576 batteries
3.350 Ah/2 V
Table 3. Parameters of the solution model for the Isla Múcura Case.
DGBESS
C f u e l [COP/l]2382.00 γ B D 1.00
α 1 [l/kW]0.24 γ B C −1.00
β 1 [l]3.00 λ B D [COP]0.00
α 2 [l/kW]0.21 λ B C [COP]0.00
β 2 [l]4.00 P B D M a x [kW]18.00
α 3 [l/kW]0.24 P B C M i n [kW]−18.83
β 3 [l]2.00 η B D [%]100.00
P D , 3 M a x [kW]132.00 η B C [%] 90.00
P D , 2 M a x and P D , 3 M i n [kW]66.00 E B M i n [kWh]0.00
P D , 1 M a x and P D , 2 M i n [kW]33.00 E B M a x [kWh] 10 10
P D , 1 M i n [kW]13.20
C s t u p [COP]14,006.16
Disclaimer/Publisher’s Note: The statements, opinions and data contained in all publications are solely those of the individual author(s) and contributor(s) and not of MDPI and/or the editor(s). MDPI and/or the editor(s) disclaim responsibility for any injury to people or property resulting from any ideas, methods, instructions or products referred to in the content.

