
Research on a Method for Identifying Key Fault Information in Substations

 and
and
Abstract
1. Introduction
- 1.
- A hybrid method for identifying key fault information in substations is proposed, combining a scalable time window adjustment mechanism with Principal Component Analysis (PCA). The time window adapts to the alarm density observed in real time, enabling data capture under varying fault conditions.
- 2.
- The method includes a structured alarm event grouping and timestamp alignment process, which allows temporally overlapping events to be clustered and synchronized based on correlation, improving the temporal consistency of the input data.
- 3.
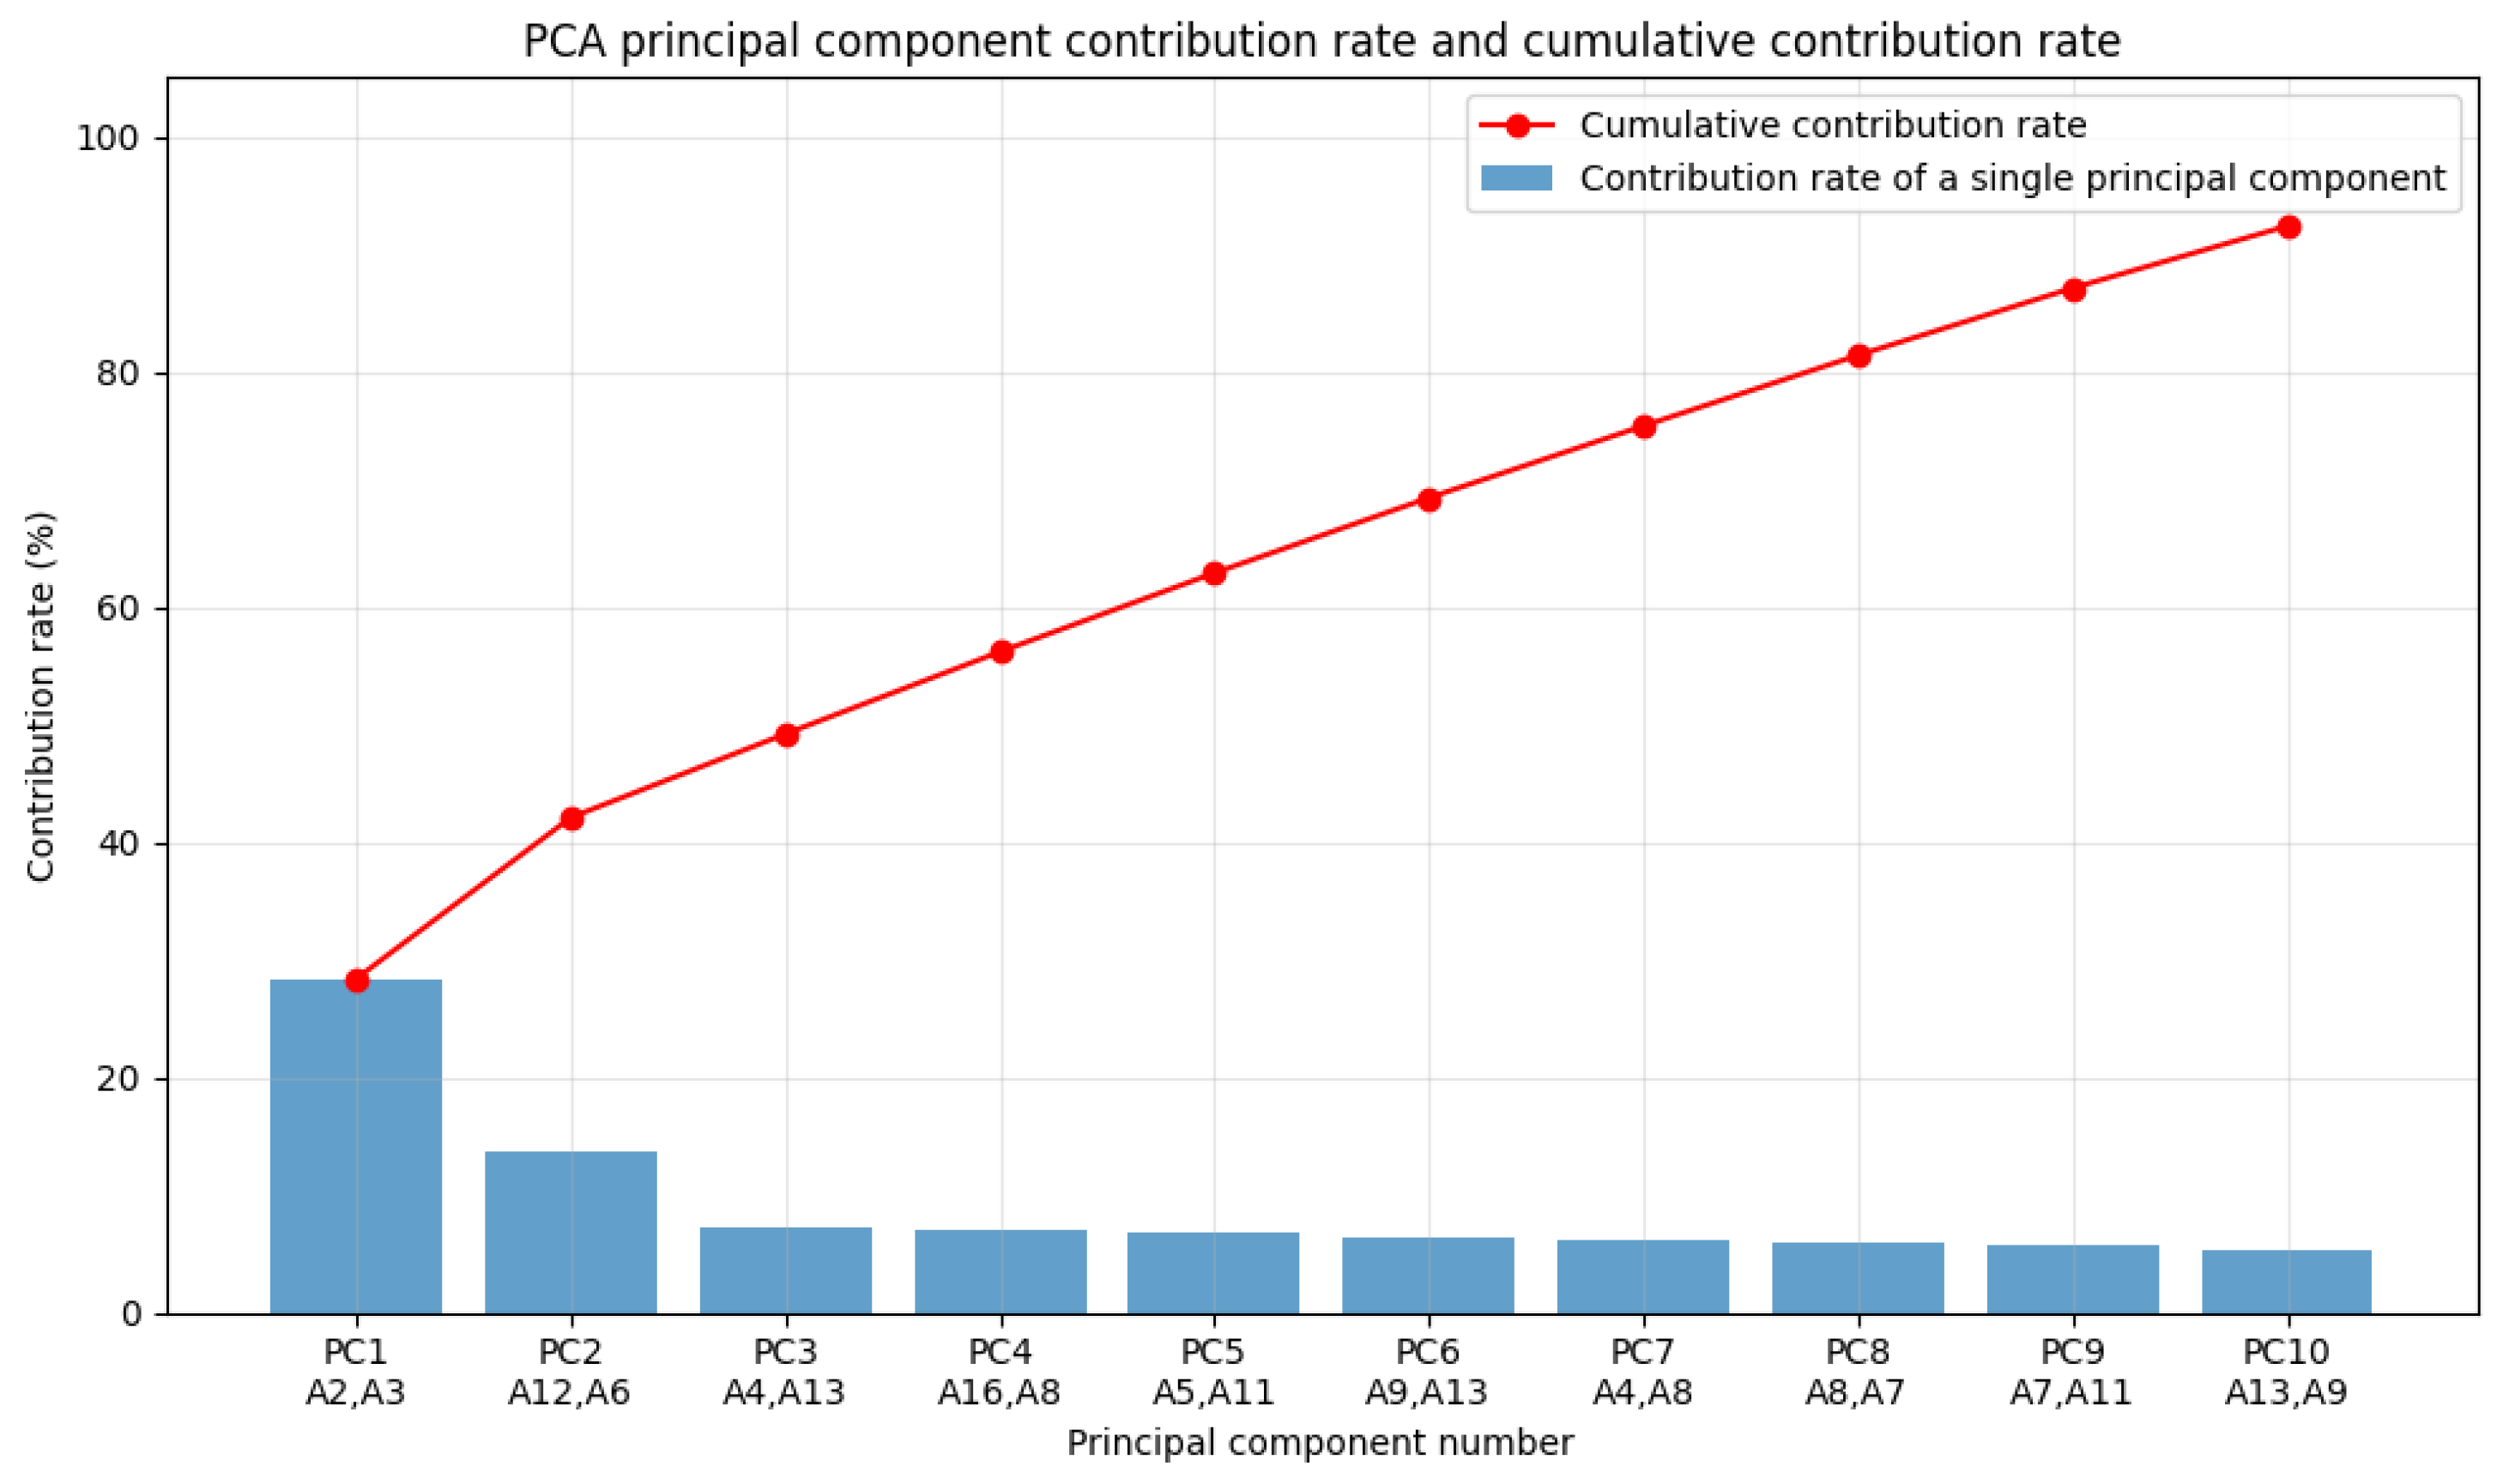
- Validation on an actual substation alarm dataset showed that retaining 10 principal components can retain 90% of the total variance, which demonstrated its effective dimensionality reduction and noise filtering in a data redundancy environment while maintaining interpretability and computational efficiency.
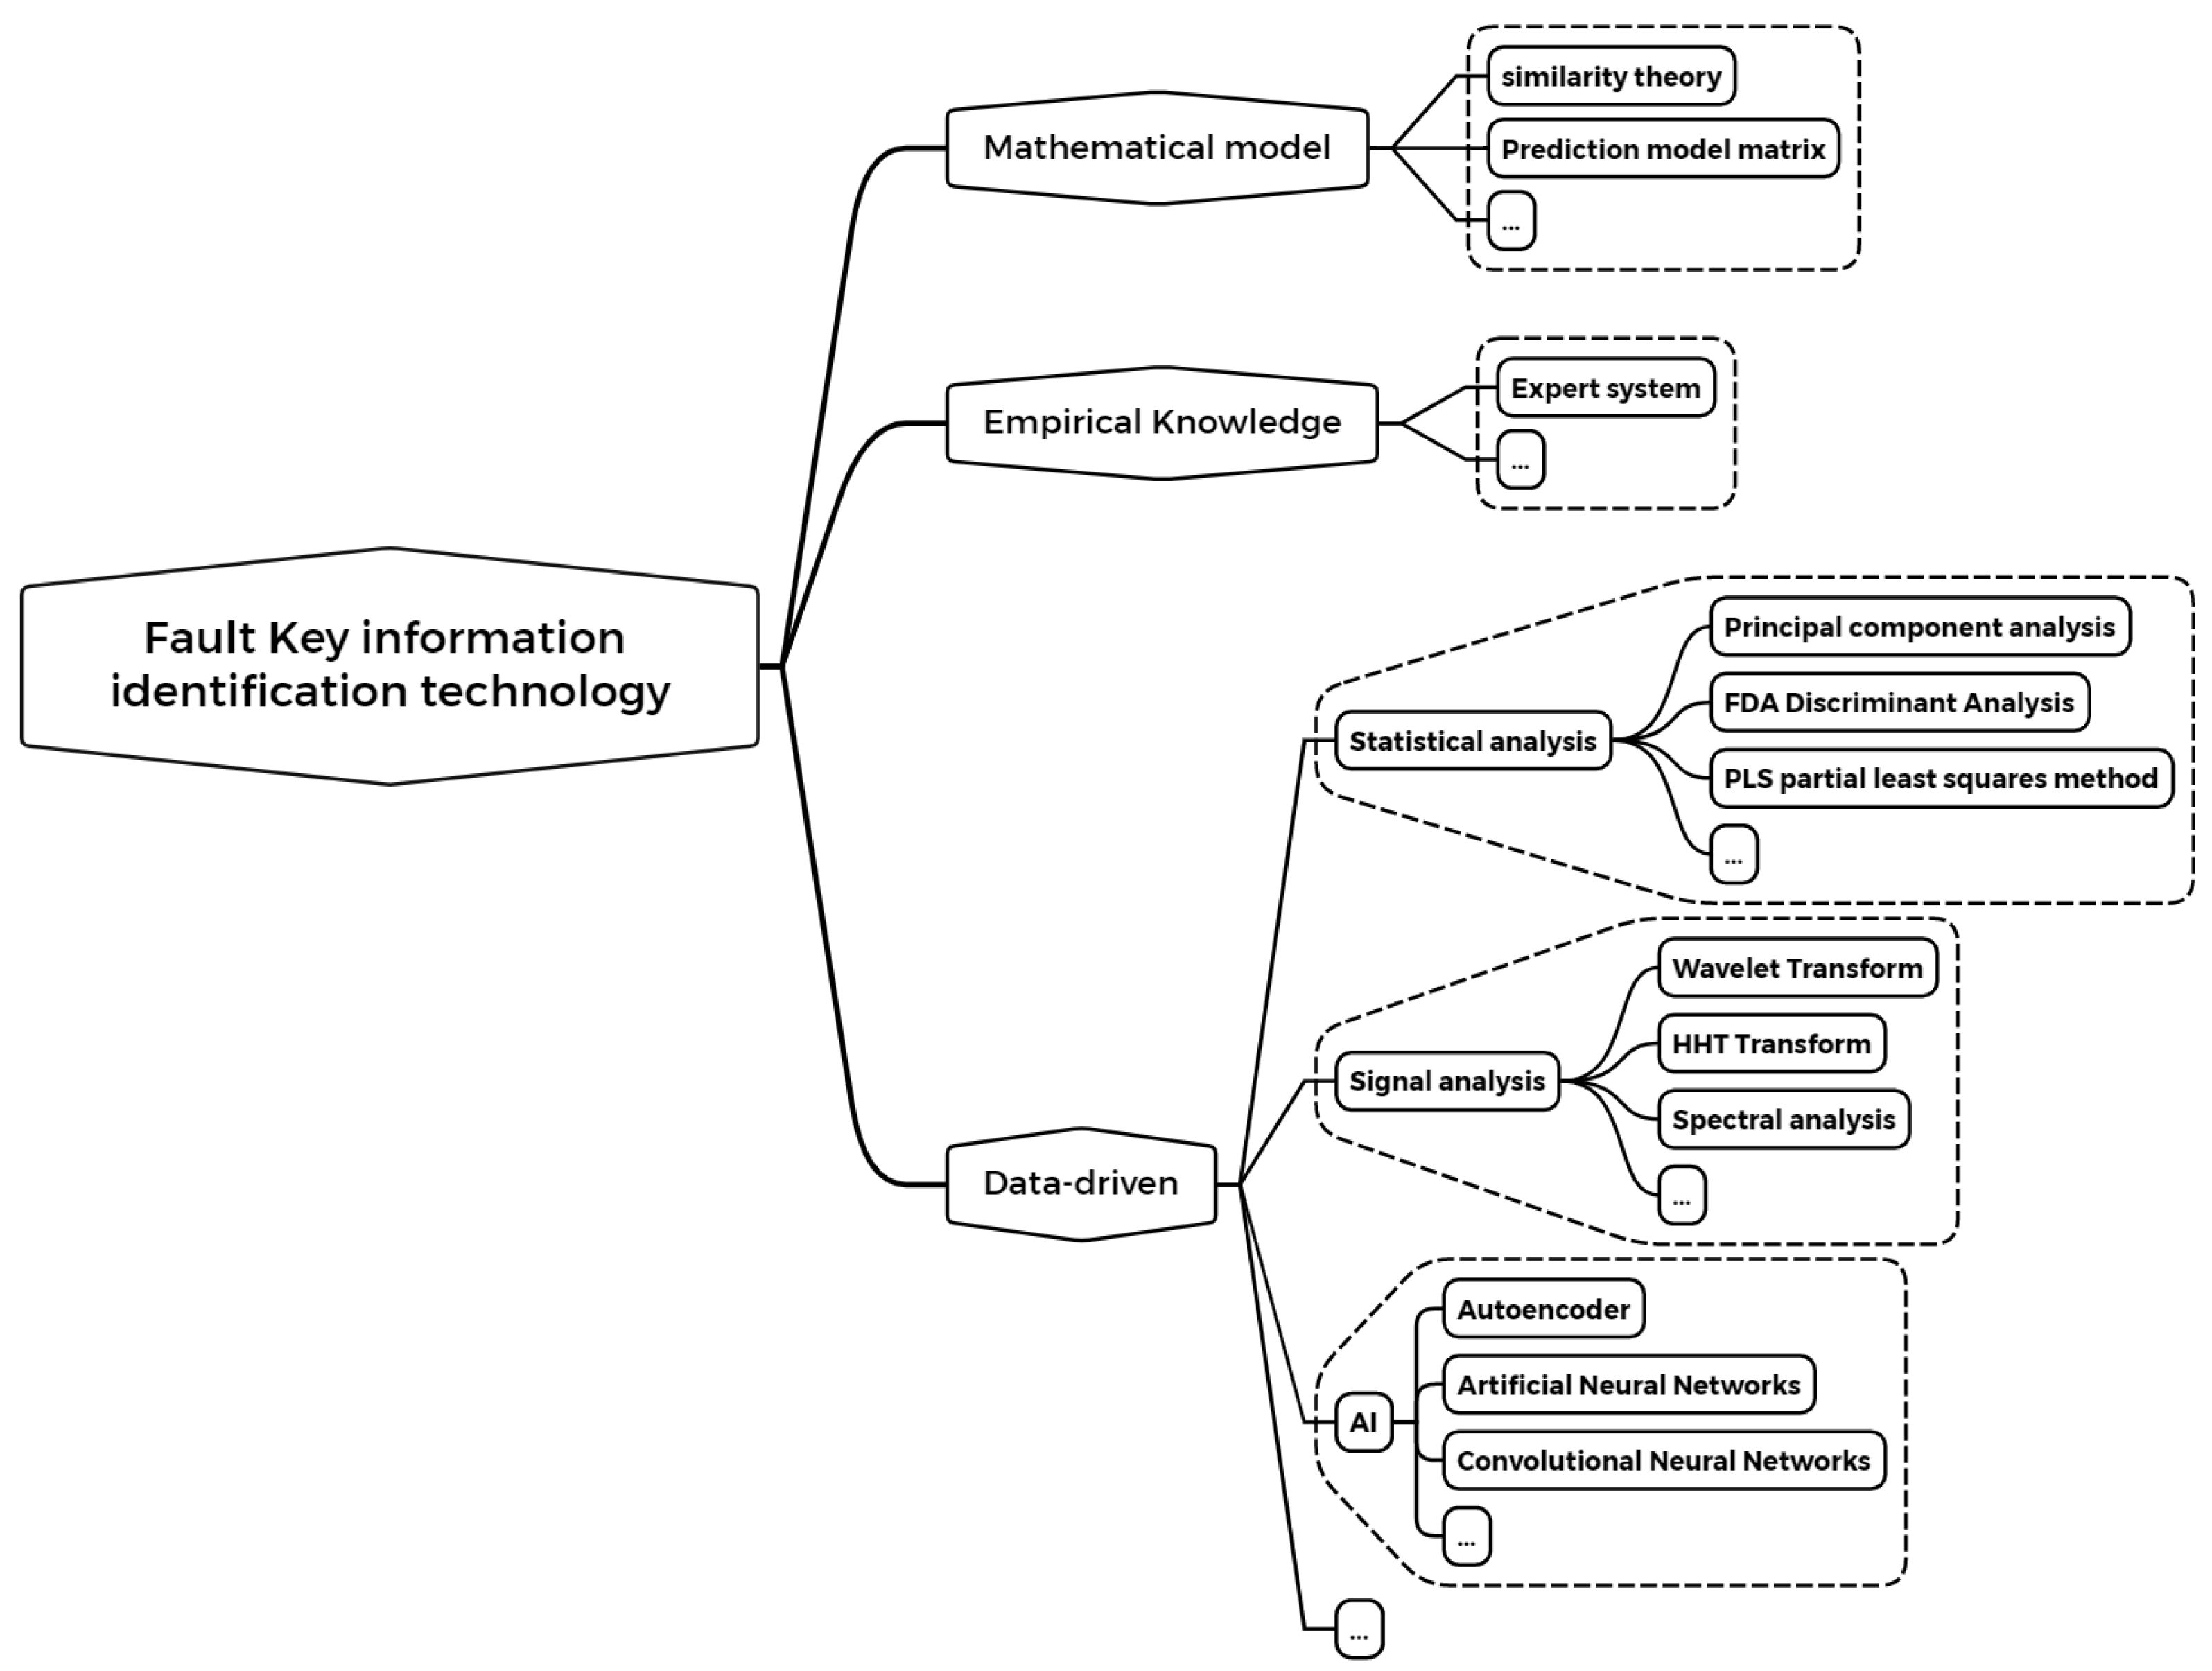
2. Related Works
2.1. Mathematical Model-Based Methods
2.2. Empirical Knowledge-Based Methods
2.3. Data-Driven Methods
3. Scalable Time Window–PCA Key Fault Information Identification
3.1. Data Preprocessing—Scalable Time Window Correction
3.1.1. Scalable Time Window Adjustment
3.1.2. Event Grouping via Time Window Clustering
- (1)
- Alarm severity: Events with high severity levels are prioritized for grouping.
- (2)
- Temporal proximity: Events occurring within the same time window are evaluated for correlation.
- (3)
- Fault type similarity: Similar fault types within a specific period are clustered.
- (1)
- If events are correlated, they are grouped together.
- (2)
- If events are uncorrelated, they are assigned to separate groups.
- (3)
- If multiple alarm events originate from the same root cause, they are combined into a single fault group.
- (4)
- If multiple alarm events stem from different sources, they are processed separately for independent fault analysis.
3.1.3. Unified Time Correction for Fault Groups
3.2. Feature Extraction—Principal Component Analysis (PCA)
3.2.1. Data Standardization
3.2.2. Covariance Matrix Computation
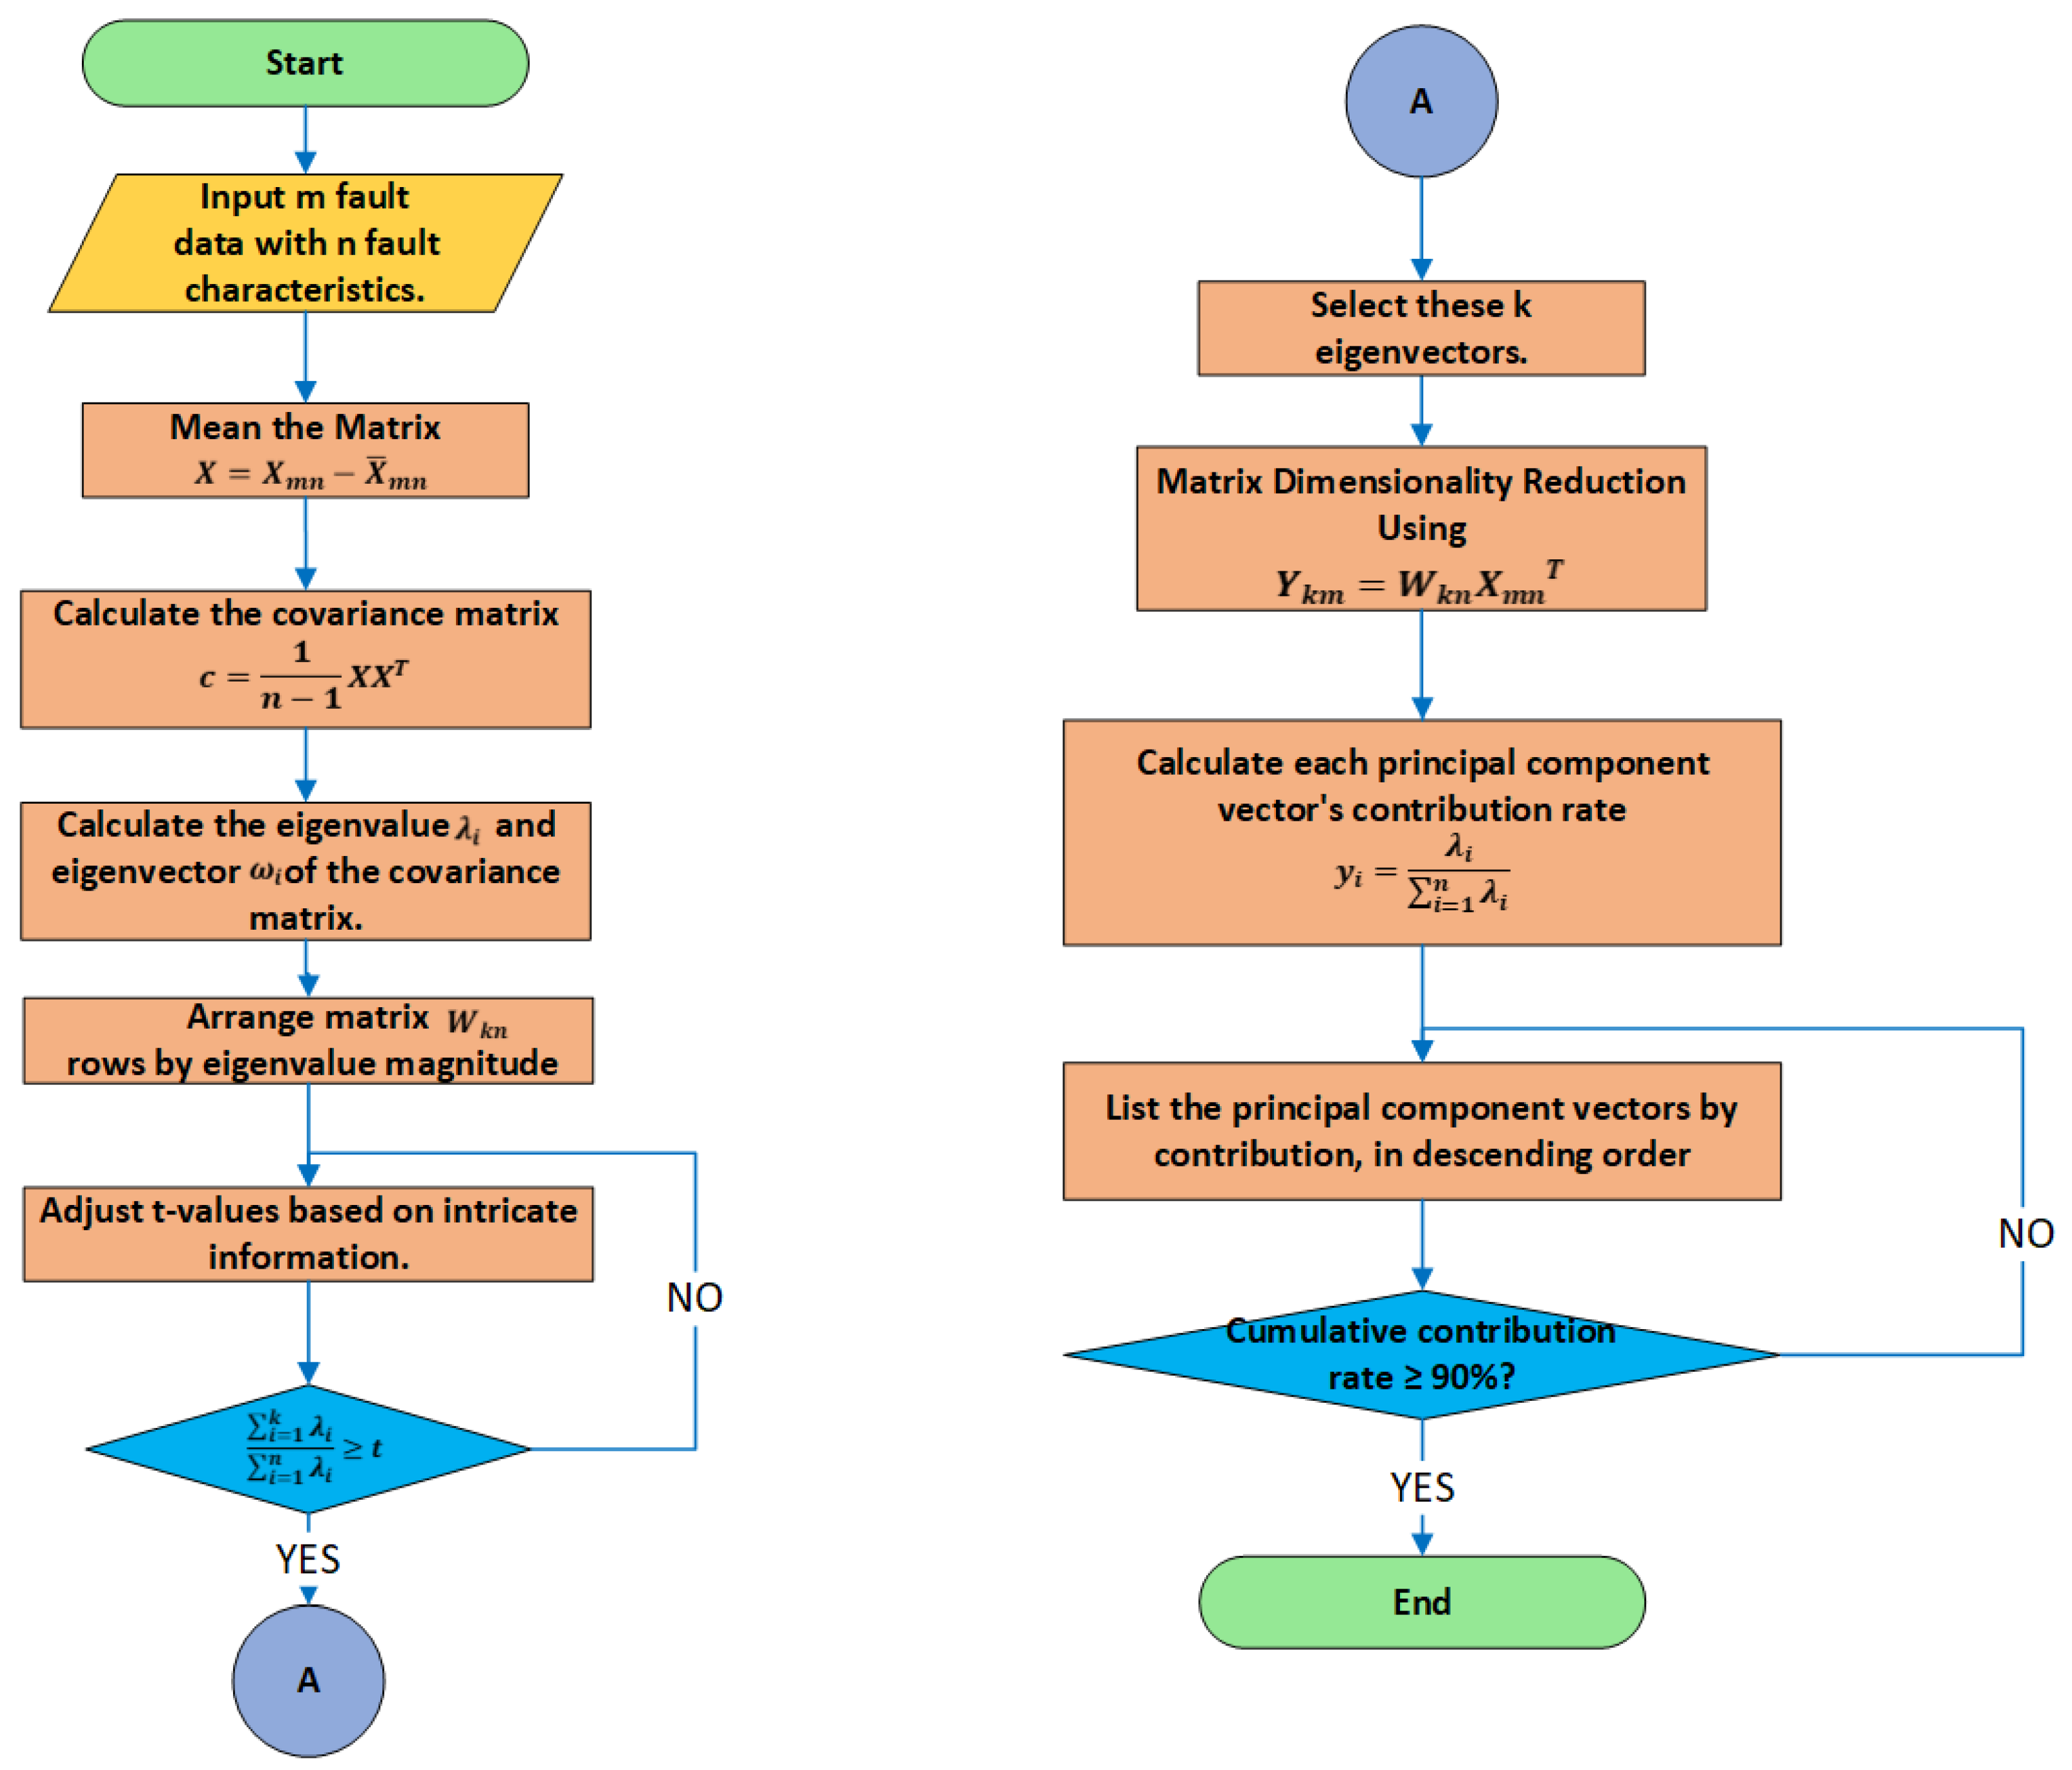
3.2.3. Eigenvalue and Eigenvector Computation
3.2.4. Principal Component Selection
3.2.5. Data Transformation and Dimensionality Reduction
3.2.6. Selection of Key Fault Features
4. Case Analysis and Experiments
4.1. Case Analysis
- (1)
- Alarm Event Filtering:
- (2)
- Formation of Event Clusters and Groups:
- (3)
- Correlation Analysis:
- ➀
- Their contribution rates in PCA analysis (e.g., A3 and A2 having high eigenvalue loadings).
- ➁
- And expert knowledge from substation engineers confirming their diagnostic significance.
4.2. Experiment
- (1)
- PCA-Based Feature Extraction and Analysis
- ➀
- Data standardization: The selected fault feature dataset was normalized to ensure consistency.
- ➁
- Mean calculation: The dataset was averaged.
- ➂
- Covariance matrix computation: The covariance matrix was derived from the standardized dataset, as described by the formula .
- ➃
- Eigenvalue and eigenvector calculation: The eigenvalues and eigenvectors of he covariance matrix were computed.
- ➄
- Dimensionality reduction: The original data matrix was projected onto a lower-dimensional space, using the transformation .
- ➅
- Principal component contribution analysis: The contribution rates of all the principal components were calculated and arranged in descending order. The PCA outcomes are illustrated in Figure 7.
- (2)
- Principal Component Contribution Analysis
- (3)
- Parameter DiscussionTo explore how to choose the threshold t, we conducted an experimental study; the results are summarized in Table 4.
- (4)
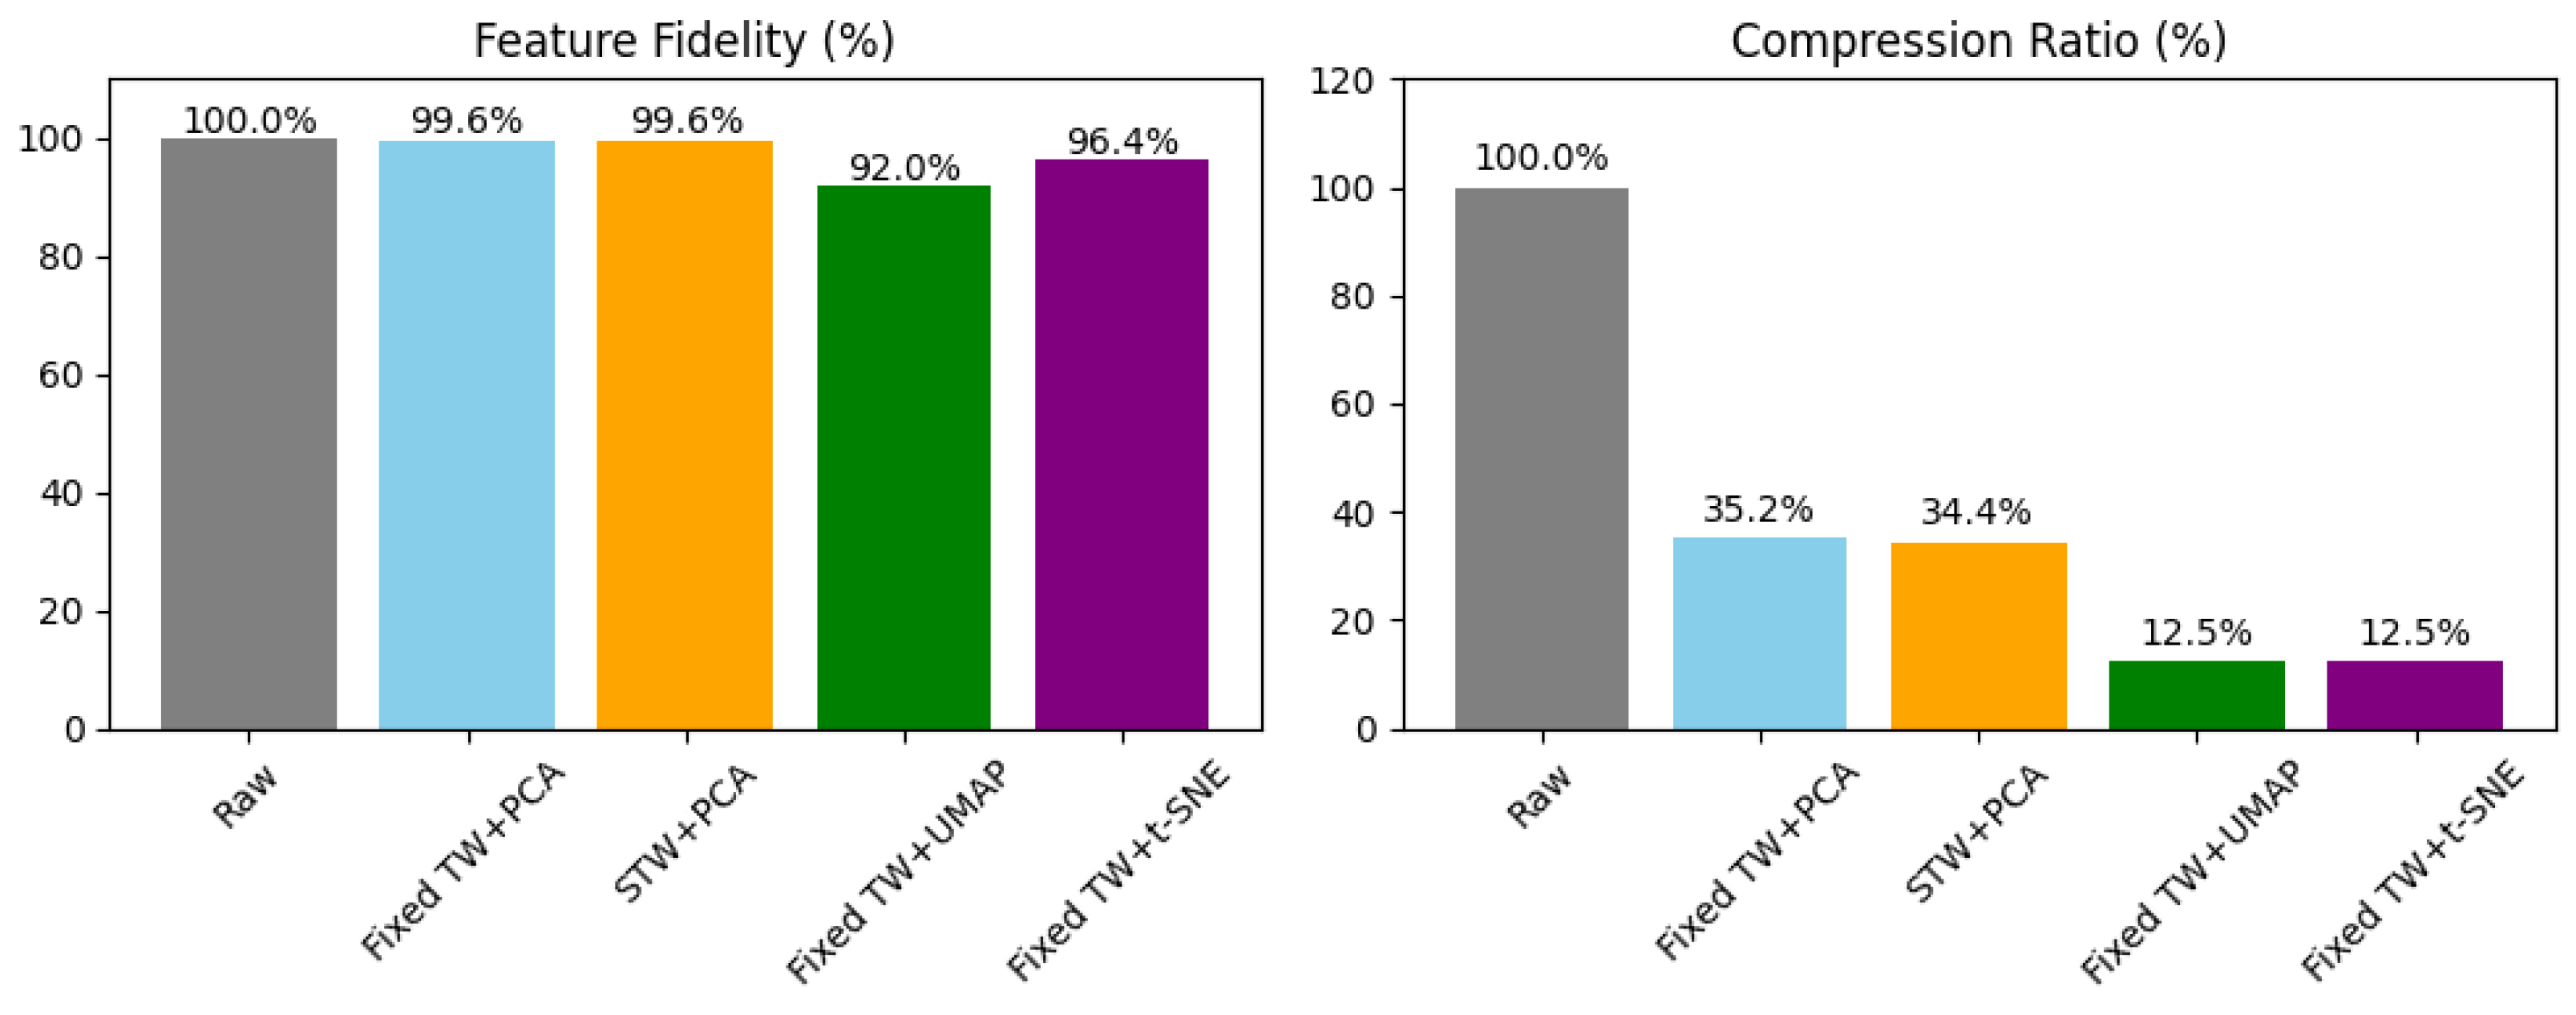
- Comparative Study
- (5)
- Limitation
5. Conclusions
Author Contributions
Funding
Data Availability Statement
Conflicts of Interest
References
- Ke, T.; Tian, S.; Zhou, H. Research on Fault Diagnosis Model of Small Substation Based on Cooperative Game and Cloud Model. Electr. Drive 2024, 54, 82–87. [Google Scholar]
- Ding, W. Research on Fault Diagnosis of Intelligent Substation Protection System. Master’s Thesis, Shandong University, Jinan, China, 2023. [Google Scholar]
- Zhan, Z.; Gong, D.; Wang, C.; Yang, D.; Wang, J.; Hao, J. Transformer Fault Diagnosis Method Integrating D-SEvidence Theory and Fuzzy Logic. Transformer 2023, 60, 10–16. [Google Scholar]
- Dai, Y.; Wang, J.; Tong, X. Line Trip Fault Identification Method Based on Big Data and Multi-Information Sources. Microcomput. Appl. 2024, 40, 221–224+232. [Google Scholar]
- Zhou, W. Application of Intelligent Technology in SubstationFault Diagnosis. Integr. Circuit Appl. 2024, 41, 130–131. [Google Scholar]
- Du, J.Q.; Zhao, M.; Yin, J.; Gu, W. Review of fault diagnosis methods for power plant. Yunnan Electr. Power 2018, 46, 88–96. [Google Scholar]
- Chang, J.; Gao, M. Failure prognostic system of power generatingequipment based on similarity modeling. J. Mech. Electr. Eng. 2012, 29, 576–579. [Google Scholar]
- Li, A.; Zhang, L.; Li, C. Mathematical Morphology-Based Fault Identification for Distribution Network with DFIG. In Proceedings of the 2024 The 9th International Conference on Power and Renewable Energy (ICPRE), Guangzhou, China, 20–23 September 2024; IEEE: Piscataway, NJ, USA, 2024; pp. 752–757. [Google Scholar]
- Zhang, C.; Xiong, D.; Xia, X.; Pan, J.; Yan, Y.; Xu, A. Study on the Diagnostic Method of Fault Current and Excitation inrush Current. In Proceedings of the 2023 4th International Conference on Smart Grid and Energy Engineering (SGEE), Zhengzhou, China, 24–26 November 2023; IEEE: Piscataway, NJ, USA, 2023; pp. 361–365. [Google Scholar]
- Feng, Y.; Yang, W.; Jiang, D. Fault Recognition Method for Gear Case of Wind Power Generator Based on Decision Tree Classification Algorithm and Expert System. Guangdong Electr. Power 2013, 26, 17–21. [Google Scholar]
- Ji, Y. Research and Implementation of Power Grid Fault Diagnosis Expert System Based on Fuzzy Recognition. Master’s Thesis, Jilin University, Changchun, China, 2011. [Google Scholar]
- Li, B.; You, J.; Liu, X.; Wang, R.; Leng, G.; Ma, J. Research on Substation Fault Diagnosis Method Based on Alarm Information and CNN. Coal Mine Mach. 2024, 45, 161–164. [Google Scholar]
- Zhou, W. Research on Fault Identification Method for Secondary Circuit of Relay Protection in Intelligent Substations. Electr. Technol. Econ. 2024, 324–327. [Google Scholar]
- Huang, H.; Ji, H.; Meng, F. Fault Identification and Location of Shore Power Systems in Oilfield Clusters Based on Key Data Information. Equip. Manag. Maint. 2024, 171–175. [Google Scholar]
- Yu, Y.; Wang, T.; Wang, W.; Yang, R. Research on intelligent fault detection and identification method of relay protection device in digital substation. Electron. Des. Eng. 2024, 32, 113–117. [Google Scholar]
- Li, Z.; Ding, X.; Du, W. Research on potential fault location and early warning of substation based on digital twin. Electr. Eng. 2022, 35–38. [Google Scholar]
- Wang, H.; He, H.; Huang, R.; Gao, P.; Zhou, N.; Ren, B. Fault diagnosis of intelligent substation protection system based on artificial neural network. New Technol. Electr. Eng. Energy 2023, 42, 97–104. [Google Scholar]
- Lozano, J.; Koneru, K.; Castellanos, J.H.; Cardenas, A.A. Timing Analysis of GOOSE in a Real-World Substation. In Proceedings of the 2022 IEEE International Conference on Communications, Control, and Computing Technologies for Smart Grids (SmartGridComm), Singapore, 25–28 October 2022; IEEE: Piscataway, NJ, USA, 2022; pp. 160–165. [Google Scholar]


| Alarm Time | Event Type | Related Equipment | Alarm Description | Data Source |
|---|---|---|---|---|
| t1 | Line protection action | 500 kV Line A | Line protection device tripped | Line protection device |
| t2 | Switch protection action | Station 1 Switch B | Station 1 switch protection device tripped | Switch protection device |
| t3 | Switch protection action | Station 2 Switch C | Station 2 switch protection device tripped | Switch protection device |
| t4 | Abnormal current | 500 kV Line A | The line current is abnormal and exceeds the rated value | WAMS system |
| t5 | Voltage sag | 500 kV Line A | The voltage drops rapidly and is momentarily lost | Wave recording device |
| t6 | Abnormal vibration signal | Station 1 Transformer | Transformer vibration abnormal, possible mechanical failure | Monitoring Sensors |
| t7 | Abnormal waveform | 500 kV Line A | Recorded waveform has abnormal frequency | Wave recording device |
| t8 | Abnormal switch signal | Station 2 Switch C | Switch signal abnormal, possible malfunction | Switch signal system |
| t9 | Switch signal recovery | Station 1 Switch B | Switch signal returns to normal | Switch signal system |
| t10 | Current recovery | 500 kV Line A | Line current returns to normal | WAMS system |
| t11 | Voltage recovery | 500 kV Line A | Voltage returns to normal level | Wave recording device |
| Fault Number | Substation Status | Training Set | Test Set |
|---|---|---|---|
| D1 | Normal | 55 | 25 |
| D2 | Circuit breaker tripping | 48 | 22 |
| D3 | Control circuit disconnection fault | 34 | 15 |
| D4 | Low oil (gas) pressure → lockout and closing fault | 45 | 15 |
| D5 | Hydraulic mechanism oil pump pressure timeout | 42 | 22 |
| D6 | Circuit breaker arc chamber explosion | 70 | 30 |
| D7 | Protection action → circuit breaker refuses to open | 32 | 12 |
| D8 | SF6 gas low pressure fault | 24 | 9 |
| Feature Number | Fault Characteristics | D6 Relevance |
|---|---|---|
| A1 | Circuit breaker position | YES |
| A2 | Circuit breaker current is zero | YES |
| A3 | Circuit breaker voltage is zero | YES |
| A4 | Circuit breaker position closed | — |
| A5 | Fault interval protection action signal | — |
| A6 | Main protection action | YES |
| A7 | Control circuit disconnection | — |
| A8 | Monitoring circuit breaker control circuit signal light is off | — |
| A9 | No protection action signal received | — |
| A10 | Low oil (gas) pressure alarm of operating mechanism | YES |
| A11 | Locking reclosing | — |
| A12 | Low pressure lockout signal | YES |
| A13 | Oil pump pressure timeout alarm | — |
| A14 | SF6 gas low pressure alarm signal | YES |
| A15 | SF6 density relay indicates abnormality | YES |
| A16 | Partial discharge level exceeds threshold | YES |
| Threshold (%) | PCs | Fidelity (%) | MSE | Global Compression (%) | Time (ms) |
|---|---|---|---|---|---|
| 80 | 8 | 81.38 | 0.1862 | 50.00 | 1.40 |
| 80 | 9 | 87.09 | 0.1291 | 56.25 | 0.96 |
| 80 | 10 | 92.37 | 0.0763 | 62.50 | 0.85 |
| 80 | 11 | 96.39 | 0.0361 | 68.75 | 0.86 |
| Method | Event Integrity (%) | Feature Fidelity (%) | Avg. Window Compression (%) |
|---|---|---|---|
| Raw Features | 100.0 | 100.0 | 100.0 |
| Fixed TW + PCA | 40.0 | 99.6 | 35.2 |
| STW + PCA | 100.0 | 99.6 | 34.4 |
Disclaimer/Publisher’s Note: The statements, opinions and data contained in all publications are solely those of the individual author(s) and contributor(s) and not of MDPI and/or the editor(s). MDPI and/or the editor(s) disclaim responsibility for any injury to people or property resulting from any ideas, methods, instructions or products referred to in the content. |
© 2025 by the authors. Licensee MDPI, Basel, Switzerland. This article is an open access article distributed under the terms and conditions of the Creative Commons Attribution (CC BY) license (https://creativecommons.org/licenses/by/4.0/).
Share and Cite
Zhang, P.; Guo, L.; Huang, Z.; Rao, Z.; Zhang, Y.; Sun, Z.; Xu, R.; Li, D. Research on a Method for Identifying Key Fault Information in Substations. Computation 2025, 13, 109. https://doi.org/10.3390/computation13050109
Zhang P, Guo L, Huang Z, Rao Z, Zhang Y, Sun Z, Xu R, Li D. Research on a Method for Identifying Key Fault Information in Substations. Computation. 2025; 13(5):109. https://doi.org/10.3390/computation13050109
Chicago/Turabian StyleZhang, Pan, Lei Guo, Zhicheng Huang, Zhoupeng Rao, Ying Zhang, Zhi Sun, Rui Xu, and Deng Li. 2025. "Research on a Method for Identifying Key Fault Information in Substations" Computation 13, no. 5: 109. https://doi.org/10.3390/computation13050109
APA StyleZhang, P., Guo, L., Huang, Z., Rao, Z., Zhang, Y., Sun, Z., Xu, R., & Li, D. (2025). Research on a Method for Identifying Key Fault Information in Substations. Computation, 13(5), 109. https://doi.org/10.3390/computation13050109