1. Introduction
Labor and birth are crucial life events that have multiple impacts on both the mother and the child. The way in which the birth unfolds and the number of medical interventions used will have both physical and psychological consequences for the woman and her baby. Evidence suggests that some commonly used medical interventions during the intrapartum period, such as the use of synthetic oxytocin, antibiotics, instrumental births, and caesarean sections (CSs), might not be innocuous. The potential negative consequences for mother and child arise from a variety of fields, including epigenetics [
1], neurobiology [
2], immunology [
3], and endocrinology [
4], among others.
In addition to the physical and physiological effects of childbirth and potential obstetric interventions, multiple psychological effects can also be found, particularly for the mother, depending on whether she perceives the experience as positive or negative [
5]. Positive birth experiences have been associated with a better relationship with the baby, a positive attitude towards parenthood, and a number of lost-lasting psychological benefits, including an increase in the birthing person’s self-esteem and their sentiment of accomplishment [
6,
7].
The impact of childbirth in the physical and mental health of both mother and child has been widely studied and argued. Some of the factors are difficult to quantify, particularly the subjective perception of the birthing woman, who might live her birth as a positive or negative experience depending on whether she felt respected, listened to, informed, confident, etc. This perception might be affected by (but it is not necessarily determined by) the type of birth and the medical interventions that were used.
However, there are other factors that are easier to measure and that have demonstrated consequences. The easiest number that can be considered is the CS rate, or the percentage of women that gave birth via a CS. Besides the negative consequences of not giving birth vaginally that were discussed above, a CS is a major surgery that puts under strain both the body of the mother and the medical health system since the costs of the surgery are higher than the costs of a vaginal birth, and the recovery is more difficult, needing in general longer hospital stays, more medication, and physiotherapy. There are short and long-term risks associated with CSs; they can affect not only the current delivery but also the health of the woman, the child and future pregnancies [
8].
Among the short-term complications associated with CS, one can find an increased risk of needing a blood transfusion, anaesthesia complications, injury of other organs during the surgery, infection, neonatal respiratory distress, and thromboembolic disease [
8]. In the long term, cesarean deliveries have been linked with an increased risk of asthma and obesity in children, complications in subsequent pregnancies (such as uterine rupture and placenta accreta, increta, and previa), ectopic pregnancy, infertility, intra-abdominal adhesions, and hysterectomy. The risk of these morbidities increases progressively as the number of previous CS [
9].
According to the last report from Luxembourg’s Laboratoire National de la Santé (LNS) “Surveillance de la Santé Perinatal au Luxembourg 2017–2019” [
10], the CS Rate in Luxembourg is of over 30%, which is between twice and three times higher than the ideal rate considered by the World Health Organization [
11]. The number of other medical interventions reported is also incredibly high, with only six out of ten women going into labor spontaneously. Evidently, lowering the number of unnecessary cesarean deliveries is a matter of public interest that will impact positively on both the individual physical and mental health of women, and on the health system, reducing the expenses associated with CS both in the short and the long run. The first step towards lowering the CS rate is correctly understanding the different factors that might impact it, which is one of the principal motivations of this work.
The goal of this work is, on the one hand, to analyze the impact of different variables on the chances that a person will have a vaginal or a cesarean delivery. We analyze both medical factors such as the use of synthetic oxytocin during labor and social factors such as the language(s) spoken by the birthing person. On the other hand, we will also see how the type of delivery might affect the perception of the experience as negative or positive. Additionally, this study intends to show the possibility of training machine learning (ML) models to predict CS rates based on various factors leading up to the birth. Depending on different stakeholders, different strategies are needed. This warrants training different models to investigate their pros and cons.
1.1. Luxembourg: A Small Multilingual and Multicultural Country
Before we move on to the technical aspects of our work, we would like to briefly review the demographics of Luxembourg to help the reader understand why its situation is so particular.
The Grand Duchy of Luxembourg is a small country in Europe whose territory covers a total area of
. At the beginning of 2024, it had 672,050 inhabitants. However, of this population, almost half (
) of the people are foreigners (not having a Luxembourgish nationality), and this rate increases to almost
in the city of Luxembourg, its capital, with 170 different nationalities recorded throughout the country. In addition, 233,300 non-resident cross-border workers commute to Luxembourg, among which 119,900 come from France, 54,500 come from Germany, and 52,400 come from Belgium [
12]. Many of these cross-border workers will go on to give birth in Luxembourg.
The country has three official languages: French, German, and Luxembourgish [
13]. Amongst Luxembourg’s inhabitants,
speak Luxembourgish,
speak French, and
speak German [
13]. In addition to the three official languages,
of the population speaks Portuguese, and
speak some other language [
13]. In contrast to other plurilingual countries, in Luxembourg, the three languages are spoken in all the country, and it is not uncommon to have social interactions in two or three languages in one place (including English). This makes for a very particular environment, and when one thinks of the medical attention that women receive when they give birth, this might mean that they do not share a common language with their providers, particularly nurses and midwives working in the hospital. Even if they do have one language in common in which they could communicate, it is not uncommon that conversations between providers occur in a different language, which the birthing person might not speak, leaving them out of the loop when it comes to discussing their situation. The situation is also enhanced by the fact that many of the hospital staff are themselves cross-border workers (who might, for example, speak either French or German depending on which country they come from).
1.2. Machine Learning Techniques Applied to Pregnancy and Childbirth
Several studies have been conducted in recent years, using ML to predict the type of delivery, i.e., vaginal or cesarean section. A personalized prediction tool was developed [
14] using ML to predict the delivery type based on the first delivery that was performed using a cesarean section. However, this study only focuses on subsequent deliveries only after the first delivery that resulted from CS; hence, it has a limited application. A study was carried out to look at several factors of women pre-pregnancy, during pregnancy, medical factors, and social factors such as poverty, education, socio-economic status, etc., to predict CS in women [
15]. This study was carried out on women giving birth in 15 hospitals in Sargodha, Pakistan, to establish a relationship between the different factors that result in high chances of cesarean deliveries. A relevant work conducted on women giving birth in Canada [
16] considered several factors to predict type of birth, including social factors such as education, household income, poverty. However, most of these studies take only medical factors into account. Additionally, there are few instances of such a multilingual context.
A review study [
17] conducted in 2022 studies the different algorithms used in predicting delivery types (cesarean/vaginal). It shows that the most used ML algorithms are decision tree, logistic regression, support vector machine, and random forest. Additionally, the same study shows that ensemble models such as AdaBoost, and gradient boosting algorithms are the second-preferred choice. Additionally, the study also shows the usage of Generalized Linear Modeling, naive Bayes, and univariate analysis are popular as well [
17]. Additionally, a study was conducted in Bangladesh [
18], where four different models were explored to predict CS rates in women based medical factors. Hence, in the current work, we consider four different models to explore different possibilities. Another systemic review [
19] conducted in 2022 shows that, quote, features used to predict perinatal complications were primarily electronic medical records (
), medical images (
), and biological markers (
), while
were based on other types of features, such as sensors and fetal heart rate, end quote. This study clearly shows a gap where social or demographic factors are included in such studies. Additionally, the study also shows that
of the articles considered in the systemic review were of exploratory type. This is very important to highlight that, because of the unique multilingual and demographic context of Luxembourg, an exploratory study is needed to narrow down the scope of future studies.
The current work intends to explore the influence of several factors, such as language spoken, medical history, medical interventions, and other demographic factors on cesarean deliveries. This is carried out via statistical analysis, where we employ Generalized Linear Modeling to study the direction and scale of the factors, and ANOVA to study the variances amongst the several factors. Additionally, we train four different models, namely, Logistic Regression, AdaBoost, CatBoost, and XgBoost. These models are trained on the original data with class imbalance, as well as augmented data with perfect class balance. The current study intends to explore the unique circumstances in Luxembourg and point out disparities due to these different factors. Additionally, the current study shows the viability of training ML models and their possible usage in decision-making processes. This article points out several gaps in the knowledge, specifically relating to nonmedical factors, and makes a case for further study. This is because Luxembourg offers a unique multilingual, multicultural, and international environment to study births. Such information can be very useful, not only for the healthcare system and women in Luxembourg but all over the world. Due to globalization, more and more places are becoming multilingual and multicultural, and the current study is also perfectly suited for women in such environments.
2. Materials and Methods
The current work has three contributions, namely, the data collection of women giving birth in Luxembourg through an online survey, the statistical analysis of the collected data to explore several relationships, and, finally, the machine learning part trained on the collected data to predict the type of birth.
2.1. Data Collection
The steps involved in the data collection and data clean are described in the following sub-sections. The cohort summary is given in
Table 1.
2.1.1. The Online Survey
The data were collected through an online survey that consisted of 16 questions: 15 of the questions were mandatory multiple-choice questions, and the last one was an optional text box where participants could leave a comment if they wanted to. The survey was designed to be completely anonymous: email IDs were not collected, and age (when the birth occurred) was the only personal information asked. The survey was targeted to women that had given birth in one of Luxembourg’s four maternity hospitals, and the questions asked different details about the labor and birth. The survey was GDPR-compliant, and participants were informed that no personal data were going to be collected. The survey was distributed in 2022, and 504 responses were collected between March and September of that year.
2.1.2. The Participants
Participants were reached through social media. Women were never contacted individually: the survey was posted on different social media, and women who saw the posts could decide whether they wanted to participate in the study by filling out the form. Given the multilingual quality of Luxembourg, the survey was designed in English and posted on English-speaking Facebook and WhatsApp groups. It was also shared around by participants that decided to do so on their own accord. The only criteria asked before filling out the survey was that the birth that it referred to had to have taken place in Luxembourg. Other than that, there were no other selection criteria for participants.
The fact that the survey circulated more on international environments might mean that the data collected does not necessarily reflect the Luxembourgish society as a whole but are very significant in Luxembourg nonetheless (see
Section 1.1). The current work points out disparities through statistical analysis and shows a proof of concept for predicting CS rates using ML models. Thus, the study suggests collecting more data, where women from different backgrounds and environments are reached, by making the survey available in different languages and through different platforms.
2.1.3. The Questions
The questions were of three different kinds. The first questions asked details about the birthing person: the age at the moment of the birth, the hospital that the woman gave birth in, and the moment of the birth. The specific date of the birth was not asked; participants only needed to indicate if the birth had occurred in the previous 2 years, 2–5 years, 5–10 years or over 10 years prior. The reason for this was not to be able to pinpoint an individual with their age plus the date they gave birth on. Then, they were asked which language(s) they could speak. They could choose several options between French, German, Luxembourgish, English, Portuguese, Spanish, and Others. We chose the specific languages based on the ones most spoken in the groups that the survey was shared on in a way that was not too specific so that it could lead to sabotaging the anonymity of the participants.
Then, participants were asked if the birth they were referring to was their first birth and whether it had been a vaginal delivery or a CS. Then, they were asked whether they have had at least one prior CS, and whether they had any medical condition during pregnancy (they just could reply Yes or No; no details on the medical conditions were asked).
The next five questions asked the participants about the interventions they received during their births, the use of an epidural, the freedom of movement, and the “golden hour”. The two last questions, that they could answer with Yes or No, asked whether they felt happy about their experience and if they felt respected through the process. Finally, participants had the possibility of leaving a written comment if they wanted to. Almost half of them decided to do so (206 out of 504).
2.1.4. The Data
In the previous sections, we discussed how the data was collected and who were the participants. In the current section, we describe the collected data further; additionally, we discuss how the data were cleaned and processed for further study.
The collected data consisted of the responses from the women in string format. As the survey was conducted in different languages, the responses from these surveys were collated into a single comma separated value (CSV) file. The raw data were not suitable for statistical analysis or machine learning purposes; hence, the raw data were processed using R. The responses with options of “yes” and “no” were set to 1 if response was “yes” and 0 if response was “no”. These include vaginal birth, first birth, health condition, induced labor, epidural, golden hour, feelings respected, and feeling happy. The languages spoken were given in a string, for example, “German, Luxembourgish, French”, “English, Spanish”, etc. Based on the demographic distribution [
13], Luxembourgish, French, German, English, Portuguese, and Spanish were identified to be most spoken. Hence, columns for these languages were added, along with an additional column for other languages.
If the response consisted of the string for the particular language, it was set to 1 (the language is spoken by the surveyed), or else it was set to 0 (the language is not spoken by the surveyed). Similarly, interventions had six options, namely, artificial rupture of water, oxytocin administration, episiotomy, use of instruments, kristeller (doctor or midwife pressing down the belly of the patient), and other. Each intervention was given a column, and it was set to 1 if the intervention was administered or 0 if not administered. An additional column for no interventions was added; it was set to 1 if no interventions administered or else 0. The previous CSs were set to 0 if all the previous births were vaginal, or else it was set to 1 for at least one CS in previous births. The age was rounded off to the closest integer. The hospital was in string format, which was converted into factors. Additionally, the data were cleaned off of any responses with invalid or wrong responses based on the survey questions. Furthermore, any entries with missing data were removed. Finally, a copy of processed data was exported as a CSV file for future use.
2.2. Statistical Analysis
While machine learning (ML) models can effectively identify patterns and make predictions, they often function as “black boxes” that provide limited interpretability regarding underlying relationships among variables. Statistical analysis, in contrast, offers insight into these relationships, allowing us to understand how specific factors independently and collectively influence the likelihood of a CS. By combining statistical analysis with ML, we aim to both predict CS outcomes and examine the social and linguistic factors driving these predictions, providing a balanced approach that enhances interpretability. Additionally, statistical techniques enable us to validate the results derived from ML by examining consistency across different analytical approaches.
Before diving into advanced statistical methods, we conducted Exploratory Data Analysis (EDA) to gain an initial understanding of the dataset’s structure and characteristics. EDA helps identify underlying patterns, detect potential outliers, and assess the distribution of variables, ensuring that our data are suitable for subsequent analysis. We visualized the data to compare distributions of variables across different groups, such as language spoken, type of birth, and subjective experiences of respect and happiness. This step is critical as it allows us to make informed decisions about which statistical models to apply and whether any transformations are needed to meet model assumptions.
To explore the relationships between key variables in the dataset, we performed an exploratory data analysis using a correlation plot, which visually represents the strength and direction of pairwise correlations among selected numerical and binary variables. We calculated the Pearson correlation coefficients. Additionally, we assessed the statistical significance of these correlations using
p-values calculated with the
rcorr function from the
Hmisc package [
20].
To quantify the relationship between linguistic, social, and medical factors and key outcomes during childbirth, we employed Generalized Linear Modeling (GLM). This process was executed in R using the
glm function in the
stats package [
21]. GLMs are versatile tools that extend traditional linear models to allow for response variables with non-normal error distributions, making them suitable for binary, count, and categorical outcomes [
22]. We applied GLMs to model the likelihood of undergoing a CS (a binary outcome) as well as the factors influencing subjective experiences of respect and happiness during birth. For the CS model, we used a binomial error distribution, incorporating independent variables such as language spoken, feelings of happiness, respect, and medical interventions. In separate GLM models for respect and happiness, these variables were treated as dependent outcomes, and we examined which social, linguistic, and medical factors were associated with higher or lower reported levels of each. By fitting these models, we were able to assess the statistical significance and strength of each predictor while controlling for potential confounders, thus identifying the most influential factors not only on CS outcomes but also on the subjective experiences of respect and happiness. This multi-faceted analysis provides deeper insights into both the medical and social dynamics at play during childbirth.
To further explore the associations between categorical predictors and continuous or ordinal outcomes, such as respect and happiness ratings, we used Analysis of Variance (ANOVA) and Multivariate Analysis of Variance (MANOVA). ANOVA was applied when examining individual outcomes, while MANOVA allowed us to assess multiple outcomes simultaneously, capturing the broader effects of independent variables. These methods are particularly valuable when exploring differences across language groups and birth types. By using ANOVA/MANOVA, we could rigorously assess whether factors like language spoken or type of intervention significantly affected the outcome variables. This analysis complements GLM by highlighting patterns across groups and pinpointing variations in experiences among different language communities.
In our analysis, we employed ANOVA and MANOVA to rigorously examine the impact of linguistic, social, and medical factors on outcomes like CS occurrence, respect, and happiness ratings. ANOVA was conducted separately for each dependent variable: CS, happiness, and respect, using each of these as a response variable in relation to independent variables such as languages spoken and medical interventions. In R, the
aov() function from the
stats package was used to fit these models [
21]. This approach allowed us to determine whether these predictors influenced each outcome individually, assessing statistical significance based on F-tests at a pre-specified significance level (typically 0.05) [
23,
24].
For MANOVA, we considered the multivariate response of interventions jointly to account for the potential correlation between these medical practices based on the language spoken. By using MANOVA, we captured broader, simultaneous effects of predictors across multiple dependent variables, providing a more nuanced understanding of how different experiences during birth might vary across language groups and intervention types [
25]. In R, the
manova() function was used to fit these models [
21]. This dual application of ANOVA and MANOVA strengthened our insights by combining univariate and multivariate perspectives, illuminating both individual and collective trends within our dataset.
2.3. Machine Learning Models
In the machine learning component of this study, our primary aim was to predict the likelihood of a CS, utilizing data on languages spoken, health conditions and history, and specific medical interventions. While the statistical analysis explored numerous relationships, the machine learning analysis focused specifically on CS due to the dual nature of these procedures: while often essential and life-saving, overuse of CS can carry health risks for both mothers and infants (see above). Thus, accurately predicting the likelihood of CS based on social, linguistic, and medical factors may offer insights into potential biases or systemic trends affecting birthing practices. To ensure a robust analysis, we selected four machine learning models: Logistic Regression, AdaBoost, CatBoost, and XGBoost. Each model offers unique algorithmic strengths, allowing for comprehensive assessment and comparison.
Logistic Regression is a foundational and interpretable model; Logistic Regression is commonly used for binary classification as it predicts the probability of an event occurring (in our case, cesarean vs. vaginal delivery) based on input variables [
26]. This model establishes a baseline for accuracy and interpretability as it is straightforward to understand and widely accepted in binary outcome prediction contexts.
Adaptive Boosting (AdaBoost) is an ensemble method that creates a strong classifier by combining multiple weak learners (in this case, decision stumps). AdaBoost iteratively trains weak learners by focusing more on misclassified instances from previous rounds, improving the model’s accuracy by minimizing errors iteratively [
27].
CatBoost is a gradient-boosting algorithm specifically optimized for handling categorical features directly without requiring extensive preprocessing [
28].
Gradient Boosting (XGBoost) is another powerful ensemble learning method that optimizes gradient boosting through regularization techniques to avoid overfitting [
29].
By applying a variety of ML models, we can explore different strengths and approaches to predicting CS, thereby increasing confidence in our findings. Additionally, comparing the performance of these models provides a comprehensive perspective on which algorithms best capture the relevant relationships within the data.
To train each model, we implemented a 10-fold cross-validation procedure. This method divides the data into 10 subsets, using nine for training and one for validation, iterating across all subsets. This approach enhances the model’s robustness by minimizing variance as each data point is used for validation exactly once, providing a reliable estimate of model performance on unseen data. Cross-validation ensures that our models generalize well, and it is widely considered the gold standard for model evaluation in machine learning [
30]. Each 10-fold cross-validation is done under the same random stat, thus ensuring identical splits when training different models.
Our dataset exhibited an imbalance in the CS (minority) versus vaginal birth (majority) classes. To address this, we applied Synthetic Minority Over-sampling Technique (SMOTE) to create a balanced dataset [
31]. SMOTE works by generating synthetic samples for the minority class, rather than duplicating instances, which helps to reduce overfitting. It identifies the nearest neighbors of a minority class instance and generates new instances along the line segments joining them. This method helps mitigate class imbalance, thereby improving model performance and predictive accuracy for CS. We retrained each model on the SMOTE-augmented data to assess the effect of balanced data on predictive power.
This comparative approach allows us to analyze whether the augmentation improves performance across different model types and assess which model performs best in accurately predicting CS likelihood.
2.4. Potential Confounders
Potential confounders are variables that are related to both the exposure (e.g., language spoken) and the outcome (e.g., C-section rates), which can bias the observed associations if not properly controlled. In this study, potential confounders include age, previous C-section, health conditions, hospital, use of induction and epidural, and various medical interventions during birth. These factors can influence the likelihood of a C-section independently of linguistic or social differences and are, therefore, considered in the statistical modeling to minimize bias.
In order to mitigate the effects of confounding, these variables were included as covariates in the GLMs and ANOVA presented in
Section 3.3,
Section 3.4 and
Section 3.5. This allowed us to assess the independent association between languages, and other variables and C-section rates, while statistically adjusting for potential confounders such as age, previous CS, hospital, and relevant medical interventions.
Age:
- –
Older mothers are generally at higher risk of C-sections.
- –
Age can be associated with different social, cultural, and linguistic groups.
Previous C-section:
- –
A major determinant of the likelihood of having a repeat C-section.
Health Conditions:
- –
Women with certain health conditions may require C-sections.
- –
Some conditions could be more prevalent in certain social or linguistic groups.
Hospital:
- –
Different hospitals might have different C-section rates or guidelines.
- –
Language barriers or familiarity with specific hospitals may influence the choice of hospital.
Induction and Epidural Usage:
- –
These interventions might be associated with higher C-section rates.
- –
Their usage could be more frequent among certain linguistic groups.
Interventions During Birth:
- –
Medical interventions such as rupture of membranes, oxytocin administration, episiotomy, use of instruments, and Kristeller maneuver might be associated with increased C-section rates.
Language Itself:
- –
As identified, Spanish-speaking women have higher C-section rates.
- –
However, language alone might not be the cause; it could be related to socioeconomic factors, communication barriers, or hospital practices.
Socioeconomic Factors (If Available):
- –
Although not explicitly examined in this study, socioeconomic status could play a significant role.
- –
It is often linked to language, cultural differences, and access to healthcare.
3. Results of Statistical Analysis
3.1. Comparison Between Vaginal Birth and C-Section Groups
To investigate the disparities between vaginal birth and C-section groups, we conducted statistical tests and visualized the differences in key variables. Descriptive statistics for each group are presented in
Table 2 and
Table 3.
To better understand the differences between women who had vaginal births and those who underwent cesarean sections (CSs), we conducted statistical comparisons using
t-tests, chi-square tests, and Wilcoxon rank sum tests across various demographic, medical, and linguistic factors. These analyses provide an overview of key variables that may influence birth outcomes presented in
Appendix A.
3.1.1. Hospital and Language Factors
The t-tests suggest that language may play a role in CS rates, with Spanish-speaking women showing a significant association (p = 0.01256). The chi-square tests further support this trend, highlighting German and Spanish speakers as having statistically significant differences in CS rates. However, other languages, such as French, Luxembourgish, and Portuguese, did not show strong associations.
3.1.2. Medical Factors
Previous CS (p < 0.001), epidural use (p = 0.001), and first birth (p = 0.0046) were all significantly associated with higher CS rates in chi-square tests. Additionally, interventions such as episiotomy (p < 0.001), instrument-assisted delivery (p < 0.001), and Kristeller maneuvers (p = 0.0031) were more common in CS cases, suggesting that these interventions might either predict or contribute to the likelihood of undergoing a CS.
3.1.3. Age and Induction
A Wilcoxon rank sum test revealed that women who underwent CS were slightly older on average (p = 0.0177). Induction was not strongly significant (p = 0.091), though it showed a trend towards higher CS rates.
These results lay the foundation for further analysis using GLM, ANOVA, and Machine Learning models, which are discussed in the following sections. The statistical tests suggest that both linguistic and medical factors play a role in CS rates, warranting deeper investigation into the interplay between these variables.
3.2. Exploratory Data Analysis
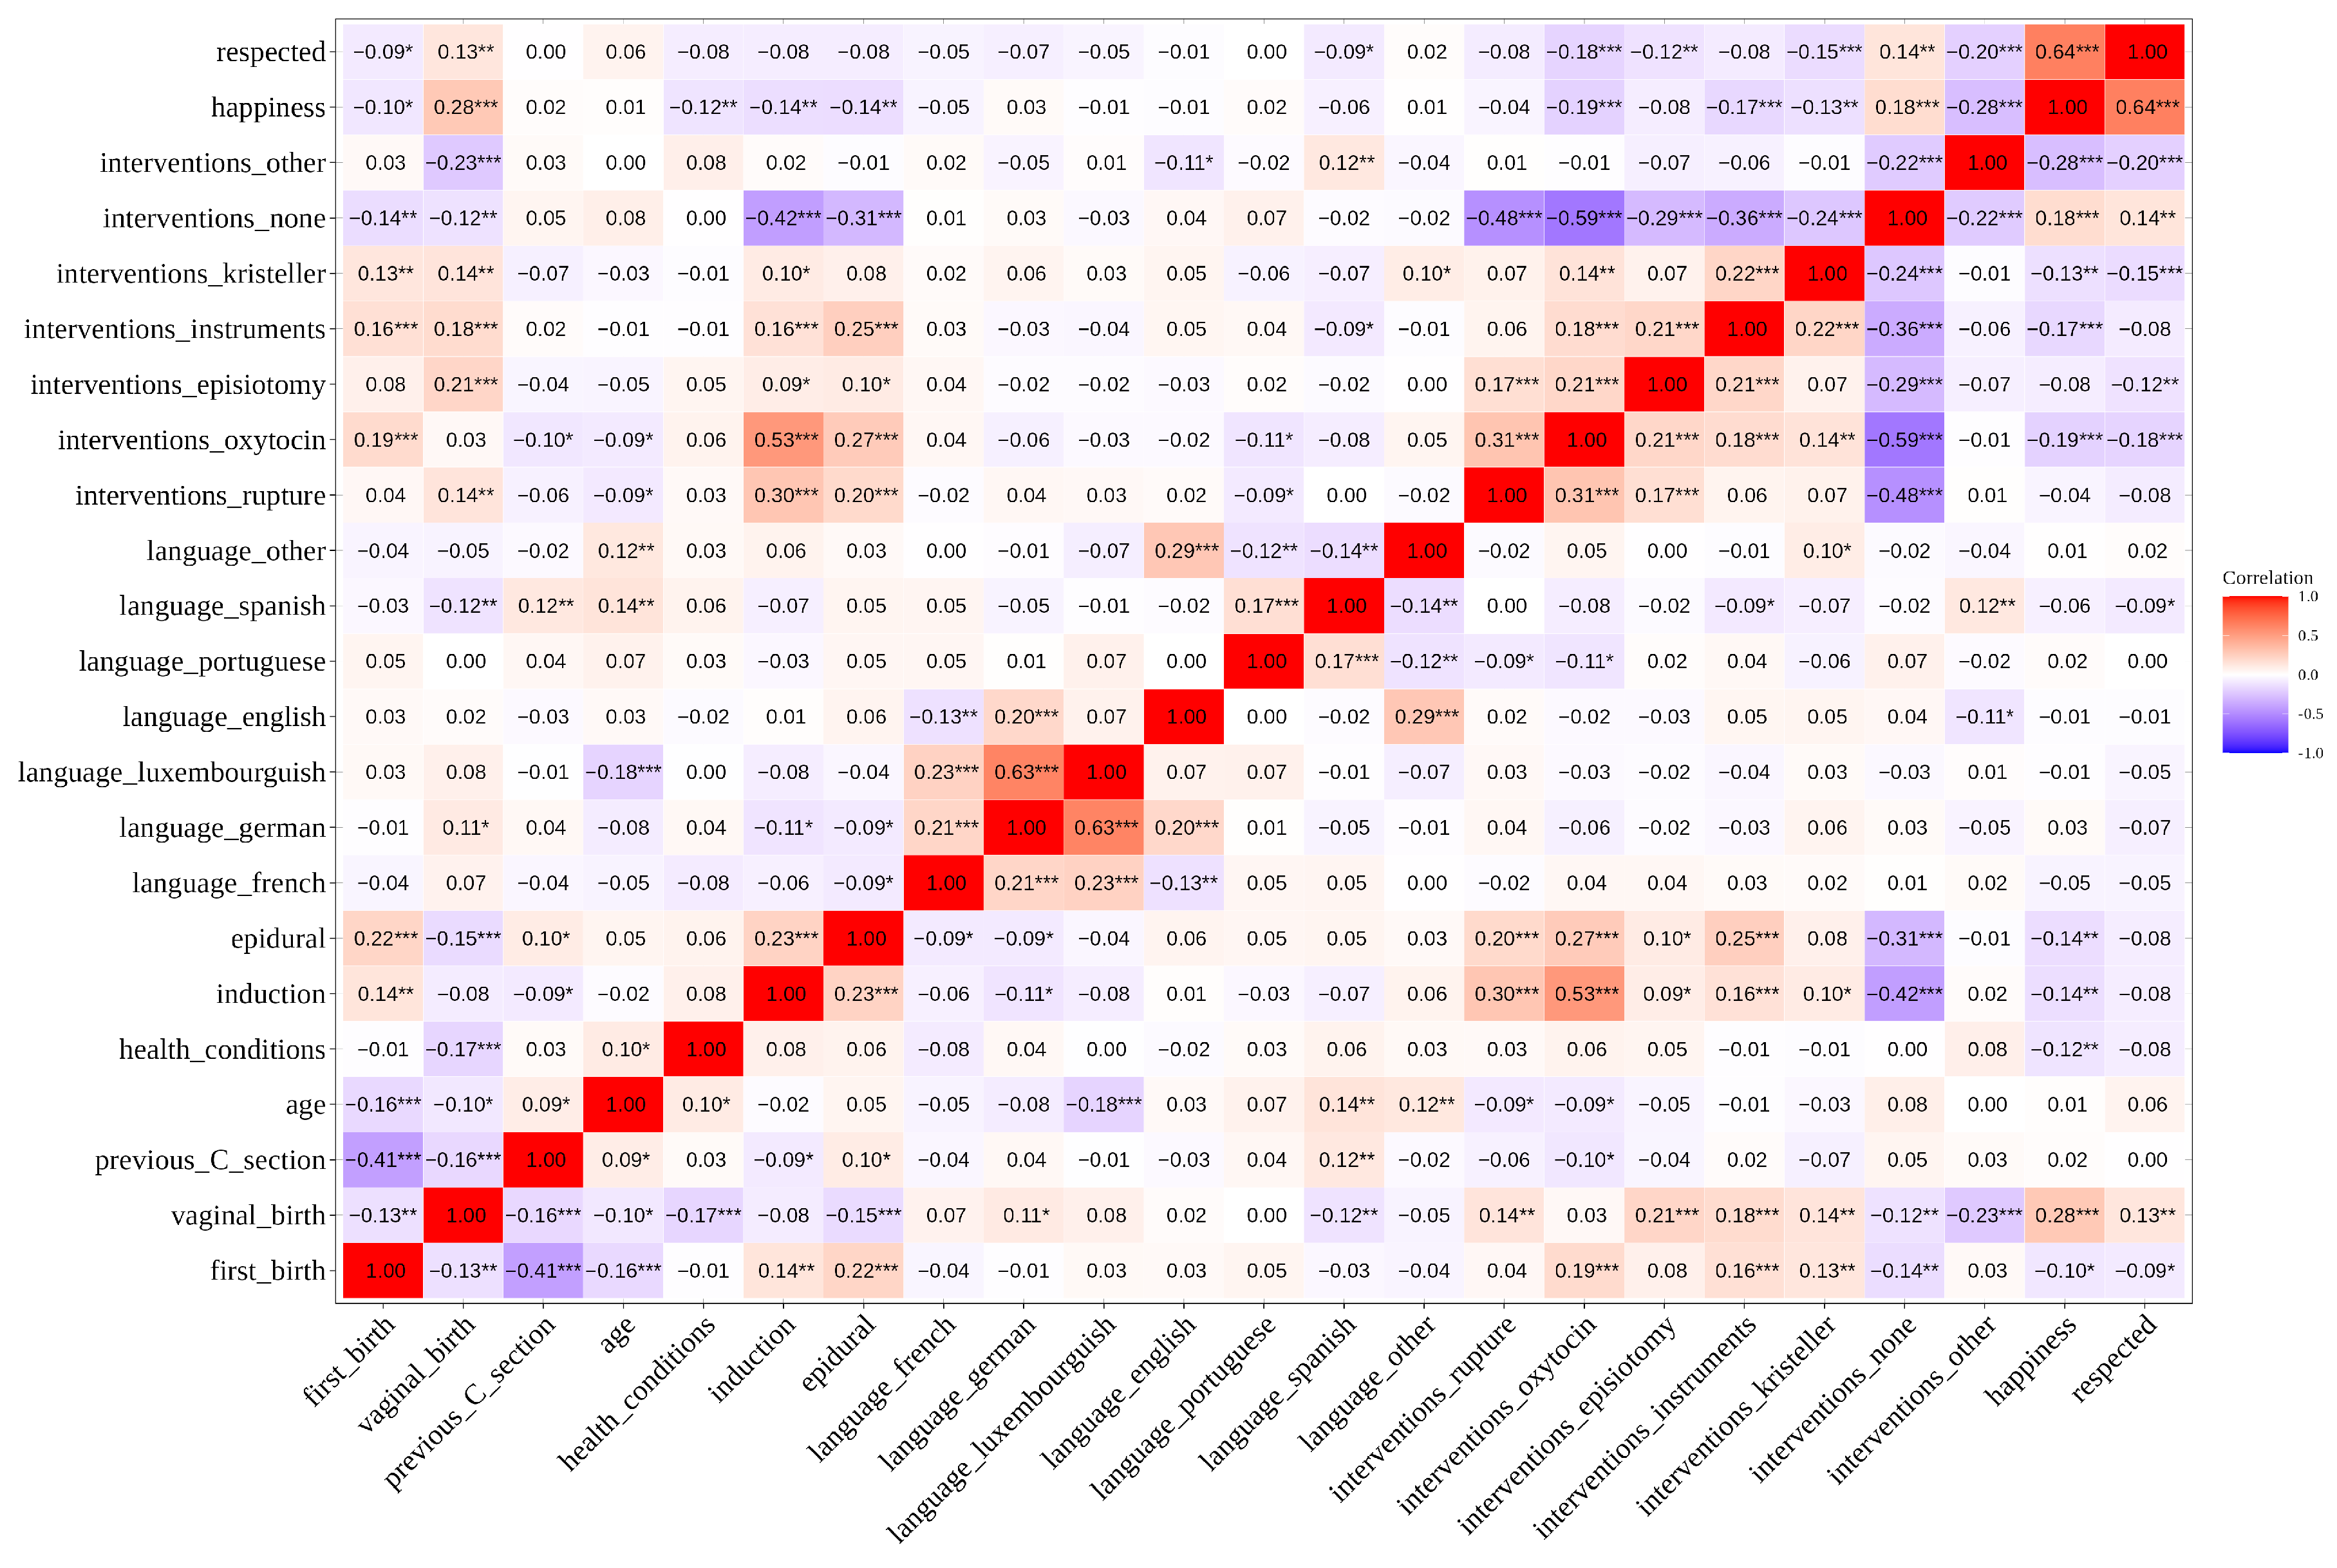
The correlation analysis provides an initial understanding of the relationships between various linguistic, medical, and social factors influencing childbirth outcomes. As seen in the correlation matrix in
Figure 1, a strong positive correlation (r = 0.64) exists between feelings of respect and happiness, suggesting that these emotional responses during childbirth may be closely linked. This relationship indicates that women who feel respected during childbirth are also more likely to report higher levels of happiness.
Furthermore, notable correlations are observed between certain medical interventions and the likelihood of undergoing a CS. For example, the use of oxytocin shows a significant positive correlation with CS rates (r = 0.31), indicating that oxytocin administration is more prevalent in deliveries that end in a CS. Similarly, the Kristeller maneuver, which involves applying pressure on the abdomen during labor, correlates positively with CS incidence (r = 0.16), albeit at a lower level. These findings underscore the importance of including specific interventions as predictors when modeling CS outcomes through GLM as they may provide insights into how particular medical practices influence childbirth outcomes. In this specific case, these results might highlight the fact that most healthcare practitioners will use the Kristeller manouver (which is controversial and even forbidden in some countries) as a last resort to try and prevent the birth ending in a CS.
Linguistic factors also display meaningful relationships with childbirth interventions. For instance, the “language luxembourguish” variable exhibits a moderate positive correlation with oxytocin usage (r = 0.23) and Kristeller maneuver (r = 0.16). This suggests that women speaking Luxembourgish might experience certain interventions at different rates, which could have implications for understanding disparities in childbirth experiences across language groups. These observations provide a rationale for conducting ANOVA and MANOVA analyses, particularly with language and medical interventions as independent variables, to investigate whether language influences intervention rates or affects feelings of respect and happiness during childbirth.
In light of these correlations, we proceed with Generalized Linear Models (GLMs) to model CS using social, linguistic, and medical variables, aiming to identify key predictors of this outcome. These analyses build on the correlation findings, allowing us to rigorously test the significance and strength of these relationships across different dimensions.
3.3. Generalized Linear Modeling to Assess Factors Influencing CS
In this section, we present the results of a Generalized Linear Model (GLM) applied to predict the likelihood of a CS. The model has CS as dependent variable and includes independent variables such as language, hospital, and various medical and demographic factors as predictors, as presented in
Table 4 and
Table 5. By examining the significance and magnitude of the coefficients, we aim to identify which factors are most strongly associated with CS outcomes, providing insights into potential influences from language, prior medical conditions, and childbirth interventions. To control for potential confounding, the following variables were included in the GLM as covariates: age, previous C-section, hospital, medical interventions (such as induction, epidural, rupture, oxytocin, etc.), and language. This ensures that the estimated associations between language and C-section rates are not biased by these known risk factors.
The first model, presented in
Table 4, investigates the relationship between social and demographic factors and the likelihood of a CS. Among language variables, speaking Spanish is associated with a higher likelihood of CS (
,
). This suggests that Spanish-speaking women may face different childbirth experiences, potentially influenced by social or cultural factors, or medical factors linked to language barriers. In contrast, other language variables do not show statistically significant associations, implying minimal or no influence on CS rates for these groups. Other languages (e.g., French, German, and Portuguese) are not significantly associated with CS, indicating these groups may not experience similar disparities in this dataset.
For hospital-related predictors, presented in
Table 4, none of the hospitals exhibit significant effects, suggesting that hospital choice alone is not a strong determinant of CS rates when adjusting for social factors. Previous CS shows the highest impact (
,
), reflecting the common practice of repeat CS among women with a history of CS deliveries. However, vaginal births after cesareans (VBACs) are still shown to be supported by providers, with a success rate of
.
The second model, presented in
Table 5, focuses on medical interventions and physiological conditions. Here, several predictors show highly significant effects. First birth (
,
) and previous CS (
,
) remain significant, reaffirming their critical roles in determining CS outcomes. Medical factors such as being induced (
,
), the use of epidural analgesia (
,
), and having prior health conditions (
,
) are positively associated with the likelihood of having a CS.
On the other hand, certain intervention categories have negative coefficients. For example, the artificial rupture of membranes (Intervention Rupture, , ) and the use of instruments such as vacuum or forceps for the delivery (Intervention Instruments, , ) decrease the likelihood of CS. This may suggest that these interventions are more common in successful vaginal deliveries, potentially reflecting different obstetric strategies. Similarly, having an episiotomy (Intervention Episiotomy, , ) significantly lowers the probability of CS, possibly due to its role in facilitating vaginal delivery. The predictor Interventions Other (, ) demonstrates a strong positive effect, warranting further exploration of what constitutes these “other” interventions and their implications for surgical delivery.
The residual deviance and Akaike information criterion (AIC) scores suggest that the second model (focused on medical factors) provides a better fit to the data compared to the socio-demographic model. The socio-demographic model (AIC = 539.66) has higher residual deviance than the medical model (AIC = 427.41), indicating that medical factors provide a better explanatory framework for cesarean outcomes. However, the social model highlights disparities that may not be visible in purely clinical contexts, such as the unique association between Spanish speakers and higher cesarean rates. This suggests a need for deeper investigations into how language and culture influence medical interactions and decision-making.
These results have critical implications for healthcare policies and clinical practices. The significant association between language and CS rates in the first model underscores the importance of addressing linguistic and cultural barriers in healthcare. Spanish-speaking women may face unique challenges or biases that warrant targeted interventions to ensure equitable treatment. Moreover, the dominance of medical factors in predicting CS likelihood emphasizes the need for clear, evidence-based protocols to minimize unnecessary surgical deliveries. The marginal association of age and epidural use calls for nuanced clinical guidelines to ensure interventions are tailored to individual risk profiles without over-reliance on surgical delivery.
Overall, these models highlight the significant influence of specific medical and demographic factors, alongside the potential impact of language, particularly for Spanish speakers. These findings set the foundation for further investigation through ANOVA and MANOVA, which will explore how different interventions, social, and emotional factors may vary across language and medical groups.
3.4. Insights into the Happiness and Respect Experienced by Women Through GLM
In this section, the reported happiness and respect are considered as dependent variables, whereas the other factors are considered as independent variables. To control for potential confounding, the following variables were included in the GLM as covariates: age, previous C-section, hospital, medical interventions (such as induction, epidural, rupture, oxytocin, etc.), and language. This ensures that the estimated associations between language and the reported feeling of happiness or respect are not biased by these known risk factors.
The first model, presented in
Table A1, examines factors influencing women’s reported happiness during childbirth. The predictors include language, hospital, induction, health conditions, first birth, and vaginal birth. The results indicate that women who delivered vaginally reported significantly higher happiness scores (
,
), highlighting the positive emotional impact of vaginal births. Induction of labor was associated with a significant reduction in happiness (
,
), suggesting that inductions might introduce stress or dissatisfaction for women. Additionally, women speaking French had significantly lower happiness levels compared to the reference language group (
,
). Other predictors, including hospital type, health conditions, and other languages, were not significant. Interestingly, the high standard errors and extreme coefficients for some hospitals suggest potential data sparsity for certain hospital categories, which should be addressed in further analysis.
Another GLM model was run where the influence of the medical factors was considered on the feeling of happiness. The results for the same are presented in
Table A2. The analysis highlights several medical factors significantly influencing the happiness experienced by women during childbirth. Notably, interventions such as the use of oxytocin, instruments and other unspecified interventions negatively impacted happiness. Among these, “other interventions” showed the strongest negative association (
), suggesting that less conventional or unexpected interventions may lead to a diminished sense of well-being. Additionally, epidural use also exhibited a modest but significant negative effect (
), potentially reflecting unmet expectations or a dissatisfaction with the reduced mobility or other side effects of the anesthesia. On the other hand, hospital choice and induction showed no significant impact on happiness, indicating that in different contexts, the statistical significance of induction changes. This is to be expected as induction is not a severe medical procedure as compared to the other interventions and procedure; however, in the socio-demographic context, it has statistical significance. These findings underscore the importance of considering women’s preferences and the psychological effects of medical procedures when designing care protocols.
The model, presented in
Table A3, assesses the factors influencing feelings of respect during childbirth based on socio-demographic factors. Vaginal birth was again a significant positive predictor (
,
), emphasizing its impact on women’s emotional wellbeing. Spanish-speaking women tended to report lower levels of respect, with the effect approaching significance (
,
), raising concerns about cultural or communication barriers impacting perceived respect. Other predictors, such as hospital choice, induction, and health conditions, were not significant. The model’s residual deviance (439.07 on 486 degrees of freedom) and AIC (471.07) indicate a better fit compared to the happiness model, suggesting that the factors included in this model may better explain the variance in feelings of respect.
A modified model, presented in
Table A4, assesses the factors influencing feelings of respect during childbirth based on socio-demographic factors. The results highlight the significant influence of certain medical interventions on respect scores. Specifically, the use of oxytocin during labor shows a strong negative association with respect (
,
). Episiotomies and Kristeller maneuvers also negatively impact the feeling of being respected, with statistically significant effects (
and
, respectively). Other medical interventions, including “other” interventions (
,
), also demonstrate a pronounced negative association with perceived respect. While factors like induction or epidural usage do not show significant effects, the consistent negative associations for multiple interventions suggest that medical procedures during childbirth may impact the subjective experience of the laboring person of feeling respected. These findings emphasize the need for careful consideration of interventions during labor and a review of the way the need for such intervention is presented to the woman. An improvement in the communication between medical practitioners and their patients might be key to promote respectful and positive birthing experiences.
The models highlight vaginal birth as a consistent positive influence on women’s childbirth experiences, affecting both happiness and respect. Conversely, being induced and language barriers (e.g., French for happiness and Spanish for respect) seem to negatively influence these outcomes. These findings highlight the importance of fostering culturally sensitive communication and prioritizing vaginal births when safe and possible.
3.5. ANOVA
ANOVA (Analysis of Variance) is used to test the significance of the differences between group means for categorical predictors or the effects of numerical predictors on the dependent variable. While Generalized Linear Models (GLMs) provide insights into the magnitude and direction of relationships (via coefficients), ANOVA focuses on testing whether variability in the dependent variable (e.g., CS rates) can be attributed to specific predictors. ANOVA complements GLMs by helping identify which factors significantly influence variability in the outcome, thus deepening our understanding of underlying phenomena such as linguistic, medical, and demographic effects on childbirth outcomes. The ANOVA results for investigating the influence of socio-demographic and medical factors (independent variables) on CS (dependent variable) are presented in
Table A5 and
Table A6, respectively. To control for potential confounding, the following variables were included in the ANOVA as covariates: age, previous C-section, hospital, medical interventions (such as induction, epidural, rupture, oxytocin, etc.), and language. This ensures that the estimated associations between language and C-section rates are not biased by these known risk factors.
In the socio-demographic model,
Table A5, significant factors include language (German and Spanish), health conditions, first birth, and previous CS history. Among these, Spanish-speaking women had a particularly high F-value (F = 7.644,
), suggesting a strong association between language and the likelihood of a CS. Similarly, health conditions (F = 12.89,
) and previous CS history (F = 28.42,
) show robust effects, indicating their critical role in determining delivery mode. Several predictors approach statistical significance, such as women speaking other languages (
) and induction (
), suggesting potential trends that might warrant further investigation. However, predictors such as epidural and English-speaking women show no significant impact on CS variability, aligning with findings in the GLM model. The results also highlight that age, while nearing significance (
), and hospital, which shows some variability (
), contribute to differences but not at a statistically significant level. These results suggest potential trends that might warrant further investigation.
The medical model,
Table A6, identifies hospital, induction, health conditions, previous CS history, and a range of delivery interventions (e.g., artificial rupture of the membranes, episiotomy, use of artificial oxytocin, and Kristeller maneuvers) as significant contributors. Interventions such as episiotomy (F = 28.63,
), instrumental delivery (F = 27.82,
), and other interventions (F = 24.80,
) are particularly notable. These results underscore the procedural and clinical aspects of CS likelihood.
In the GLM for CS, the coefficients provided detailed directional effects and their strengths, revealing similar predictors as significant (e.g., Spanish-speaking women, previous CS, and health conditions). However, ANOVA differs by emphasizing the total variance explained by each predictor rather than focusing on the direction of the effect. For example, Spanish-speaking women shows high significance in both models, but ANOVA allows us to quantify its contribution to variance. Combining insights from both approaches, we see that socio-demographic factors like language and medical interventions both independently and interactively contribute to CS rates. These findings suggest potential avenues for targeted interventions, particularly in multilingual contexts like Luxembourg, where communication barriers and socio-cultural factors might influence medical decision-making.
3.6. MANOVA
We performed a Multivariate Analysis of Variance (MANOVA) to examine the relationship between the language spoken by participants (independent variables) and the likelihood of various medical interventions during childbirth (dependent variables), presented in
Table 6. The interventions analyzed included artificial rupture of waters, oxytocin administration, episiotomy, use of instruments, Kristeller maneuver, no intervention, and other interventions. Pillai’s trace was used as the test statistic, and
p-values were assessed to determine the significance of each language group.
The results showed that the language spoken by participants had varying degrees of association with intervention patterns. Specifically, Spanish-speaking women exhibited a significant multivariate effect on medical interventions (Pillai = 0.0371, F(7, 488) = 2.686, and ), indicating that this group experienced a distinct pattern of interventions compared to others. Portuguese-speaking women demonstrated a marginal effect (Pillai = 0.0249, F(7, 488) = 1.778, and ), suggesting a weak trend worth further exploration. However, no significant effects were observed for women speaking French, German, Luxembourgish, English, or other languages ().
4. Results of Machine Learning Models to Predict CS
The following section presents the results of various machine learning models applied to the dataset to predict CS outcomes based on social and procedural factors. Specifically, the metrics of Logistic Regression, AdaBoost, CatBoost, and XGBoost models are analyzed to evaluate their effectiveness. For each model, key performance metrics, including accuracy, precision, recall, and F1 score, are reported across 10-fold cross-validation for both training and test datasets. This analysis highlights the strengths and limitations of each model in identifying patterns within the data.
4.1. Cross-Validation Results for Models Trained on Non-Augmented Data
The metrics for the Logistic Regression model are presented in the
Table A7. The Logistic Regression model demonstrates consistent training accuracy across the folds, with a mean of 82.9%. However, it struggles with recall, particularly on the test set, where it averages only 44.7%, leading to a lower F1 score of 53.0%. While the training precision is reasonably high (76.2%), the test precision of 70.7% indicates a moderate decline in performance when applied to unseen data. The imbalance between precision and recall suggests the model favors predicting the majority class over accurately identifying minority cases.
The metrics for the AdaBoost model are presented in the
Table A8. The AdaBoost model exhibits slightly better test metrics than Logistic Regression. It achieves an average test accuracy of 79.9% and a higher F1 score of 57.2%. However, recall on the test set remains low at 51.5%, indicating difficulty in identifying positive cases. The model’s strength lies in its precision (66.0%), reflecting fewer false positives in its predictions. The higher complexity of AdaBoost compared to Logistic Regression may explain its superior performance, yet the overall recall still hinders its reliability in identifying minority instances.
The metrics for the CatBoost model are presented in the
Table A9. The CatBoost model showcases the best precision among the models, with a mean test precision of 77.8%. However, this comes at the expense of recall, which is notably the lowest at 35.6%. This imbalance results in a mean test F1 score of 47.9%. The higher training accuracy (84.5%) suggests good model fitting, but the drop in recall and F1 score for the test data highlights potential overfitting or sensitivity to the class imbalance in the data.
The metrics for the XGBoost model are presented in the
Table A10. The XGBoost model demonstrates a balanced trade-off between training and test performance, with a mean test F1 score of 48.8%, slightly better than CatBoost. It has comparable test recall (38.7%) and test precision (70.6%) to CatBoost but shows less overfitting, evidenced by a narrower gap between training and test metrics. XGBoost’s robust handling of class imbalance may explain its relatively consistent performance across metrics.
When comparing the models, XGBoost and AdaBoost show a slightly better overall test performance than Logistic Regression and CatBoost, particularly in terms of recall and F1 score. XGBoost edges out CatBoost due to its balanced approach between precision and recall, while CatBoost emphasizes precision at the cost of low recall. Logistic Regression lags in performance, especially in test recall, highlighting its limitations in capturing complex relationships. AdaBoost offers a reasonable trade-off but still struggles with low recall.
In terms of strengths, CatBoost’s high precision is valuable for applications where minimizing false positives is critical. On the other hand, XGBoost and AdaBoost, with their slightly better recall, are more suitable for cases where identifying minority instances (e.g., positive CS cases) is important. Logistic Regression’s simplicity and interpretability are its strengths, although its performance is suboptimal compared to ensemble methods.
The primary shortfall across all models is the low recall and F1 score, especially on the test data. This reflects their difficulty in identifying the minority class (CS cases). This issue likely arises from the inherent class imbalance in the dataset, where vaginal deliveries dominate, leading the models to favor the majority class. Additionally, the social factors included in the dataset may not have strong predictive power individually, limiting the models’ ability to achieve higher performance.
The results indicate that the models are better at predicting the majority class (vaginal delivery) but struggle to reliably identify CS cases. In a real-world healthcare context, this suggests that relying solely on these models could lead to missed predictions of CS, potentially impacting planning and resource allocation in hospitals. The high precision of some models, such as CatBoost, may reduce unnecessary interventions or misclassification of vaginal deliveries as CS, but the low recall raises concerns about under-identifying patients requiring CS.
4.2. Cross-Validation Results for Models Trained on Augmented Data
The findings presented in the previous section underscore the importance of addressing class imbalance. Hence, we use SMOTE [
31] to augment the data. The original dataset has 370 vaginal births and 132 CS. After the augmentation, we have 370 vaginal births and CS. This augmentation ensured an equal representation of CS and vaginal delivery cases, potentially improving recall and F1 scores by mitigating class imbalance.
The metrics for the Logistic Regression model trained on augmented data are summarized in
Table 7. After augmentation, the model exhibits an improved balance between precision and recall. The mean test recall increased significantly to 80.6%, compared to 44.7% in the non-augmented scenario. Consequently, the mean test F1 score also improved to 79.8%, highlighting the model’s enhanced ability to identify CS cases effectively. Additionally, the precision increased from 70.7% to 79.3% on the test data, indicating a decrease in false positives. Overall, the augmentation allows the Logistic Regression model to become more reliable in identifying minority cases while maintaining a competitive accuracy of 79.6% on test data. As shown in
Table 8, the AdaBoost model also benefits from data augmentation. The mean test recall improved to 79.5%, a notable enhancement from its previous performance of 51.5%. The F1 score increased correspondingly to 78.8%, reflecting a better balance between precision and recall. The test precision remained stable at 78.3%, demonstrating that the augmentation did not overly compromise the model’s ability to avoid false positives. However, while test accuracy slightly decreased from 79.9% to 78.5%, the improvement in recall makes AdaBoost a more suitable model for predicting minority outcomes, particularly in contexts where identifying CS is crucial.
The CatBoost model’s performance on augmented data, detailed in
Table 9, shows significant improvements in recall and overall balance. The mean test recall surged to 80.4%, a remarkable increase compared to the prior recall of 35.6%. The F1 score also rose from 47.9% to 79.3%. Interestingly, CatBoost maintained its high precision of 78.9%, slightly reduced from its earlier performance on non-augmented data. This trade-off highlights the model’s versatility as it achieves a strong balance between avoiding false positives and capturing the minority class. The improved recall and F1 scores position CatBoost as a highly effective model for predicting CS outcomes with augmented data.
The XGBoost model’s performance on augmented data is summarized in
Table 10. After augmentation, the model achieved a balanced improvement in its metrics, with a mean test recall of 82.1%, a significant increase compared to the 38.7% in non-augmented scenario. The mean test F1 score rose from 48.8% to 79.7%, indicating the model’s enhanced ability to capture minority cases effectively. Additionally, the mean test precision increased from 70.6% at 78.2%; this reflects the model’s ability to avoid an excessive number of false positives despite the changes introduced by augmentation. The consistent mean test accuracy of 79.3% further underscores the model’s robustness, showing that it maintains a strong generalization capability across folds. These results position XGBoost as a reliable model for predicting CS outcomes, particularly in complex, imbalanced datasets where nuanced interactions between features play a critical role.
4.3. Confusion Matrix
To thoroughly evaluate the performance of predictive models, it is crucial to go beyond aggregate metrics such as accuracy, precision, recall, or F1 score. While these metrics provide a high-level summary of model performance, they often fail to capture the nuances and variability in model predictions across different classes. The confusion matrix offers a more detailed breakdown by showing the distribution of true positives, true negatives, false positives, and false negatives. Studying confusion matrix results allows us to understand how well the model performs for each class and identify potential biases or systematic errors, such as a tendency to overpredict or underpredict certain outcomes. This level of granularity is especially important in applications where specific errors carry different weights or implications, offering deeper insights compared to aggregate metrics alone.
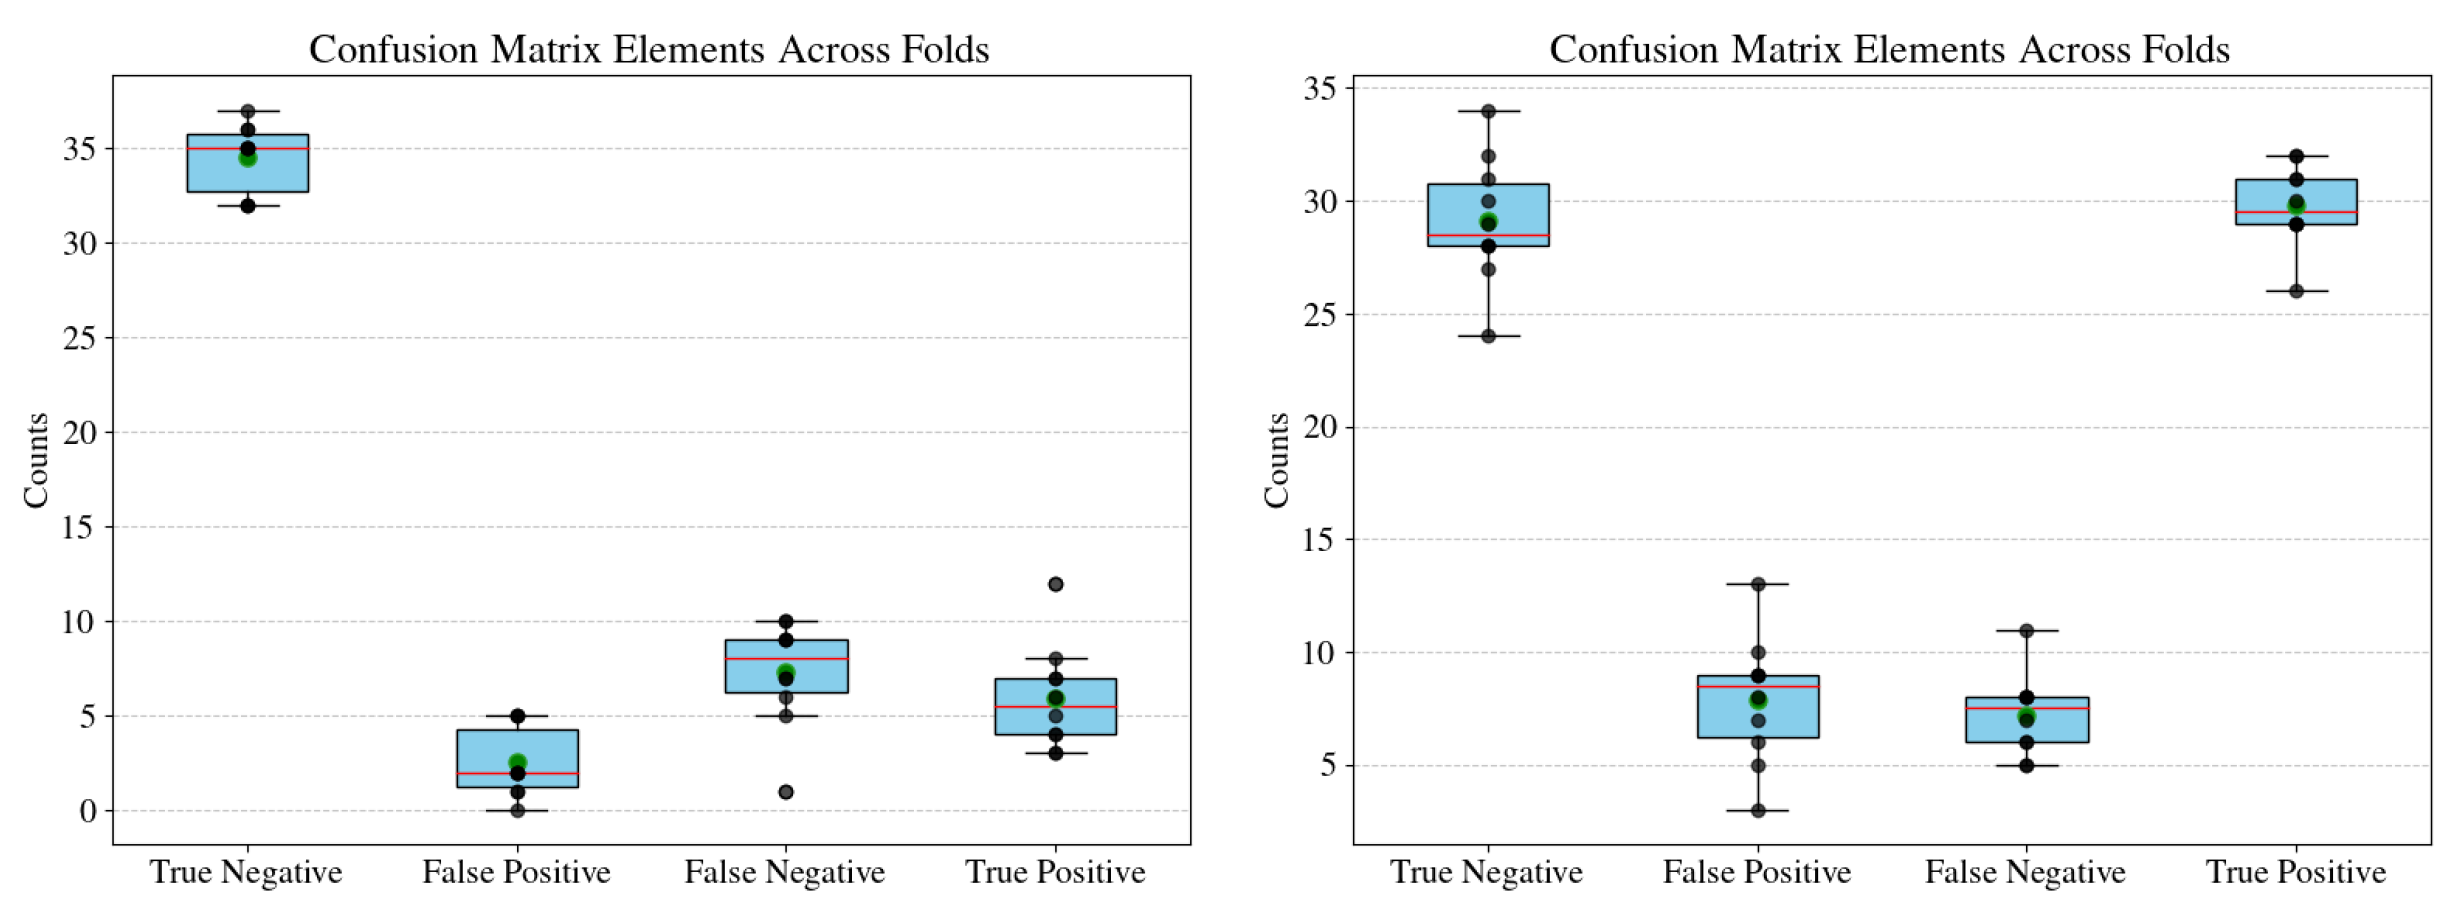
Given the complexity of our analysis, which involves eight different models trained and evaluated over 10 folds each, presenting individual confusion matrices for every fold would be impractical and cluttered. To address this, we summarize the confusion matrix results using box plots. These plots visualize the distributions of true negatives, false positives, false negatives, and true positives across the 10 folds for each model, capturing both central tendencies and variability. By doing so, we highlight the robustness and consistency of the models while also making it easier to compare performance across models and datasets (e.g., augmented versus non-augmented). The models are trained to predict CS in women; hence, here, negative means vaginal birth and positive means cesarean section.
The box plots in
Figure 2,
Figure 3,
Figure 4 and
Figure 5 summarize the confusion matrix elements (true negatives, false positives, false negatives, and true positives) across 10 folds for four models (Logistic Regression, AdaBoost, CatBoost, and XGBoost). Each model is evaluated on both non-augmented (left) and augmented (right) data. These visualizations allow us to assess not only the central tendencies of the confusion matrix elements but also the variability across folds, which reflects the robustness and consistency of each model’s predictions.
The box plots in
Figure 2, representing Logistic Regression, highlights some of the challenges of simpler linear models. On non-augmented data (left), the model achieves high true negatives. It struggles with higher variability and median values in false negatives. This indicates a systematic bias toward predicting the majority class, which is established in the previous sections. With augmentation (right), there is a clear improvement in false negative counts, with a reduction in variability, though at the cost of slightly higher false positives. These results suggest that while Logistic Regression is limited in its capacity to model complex relationships, augmentation helps address class imbalance and improve overall performance.
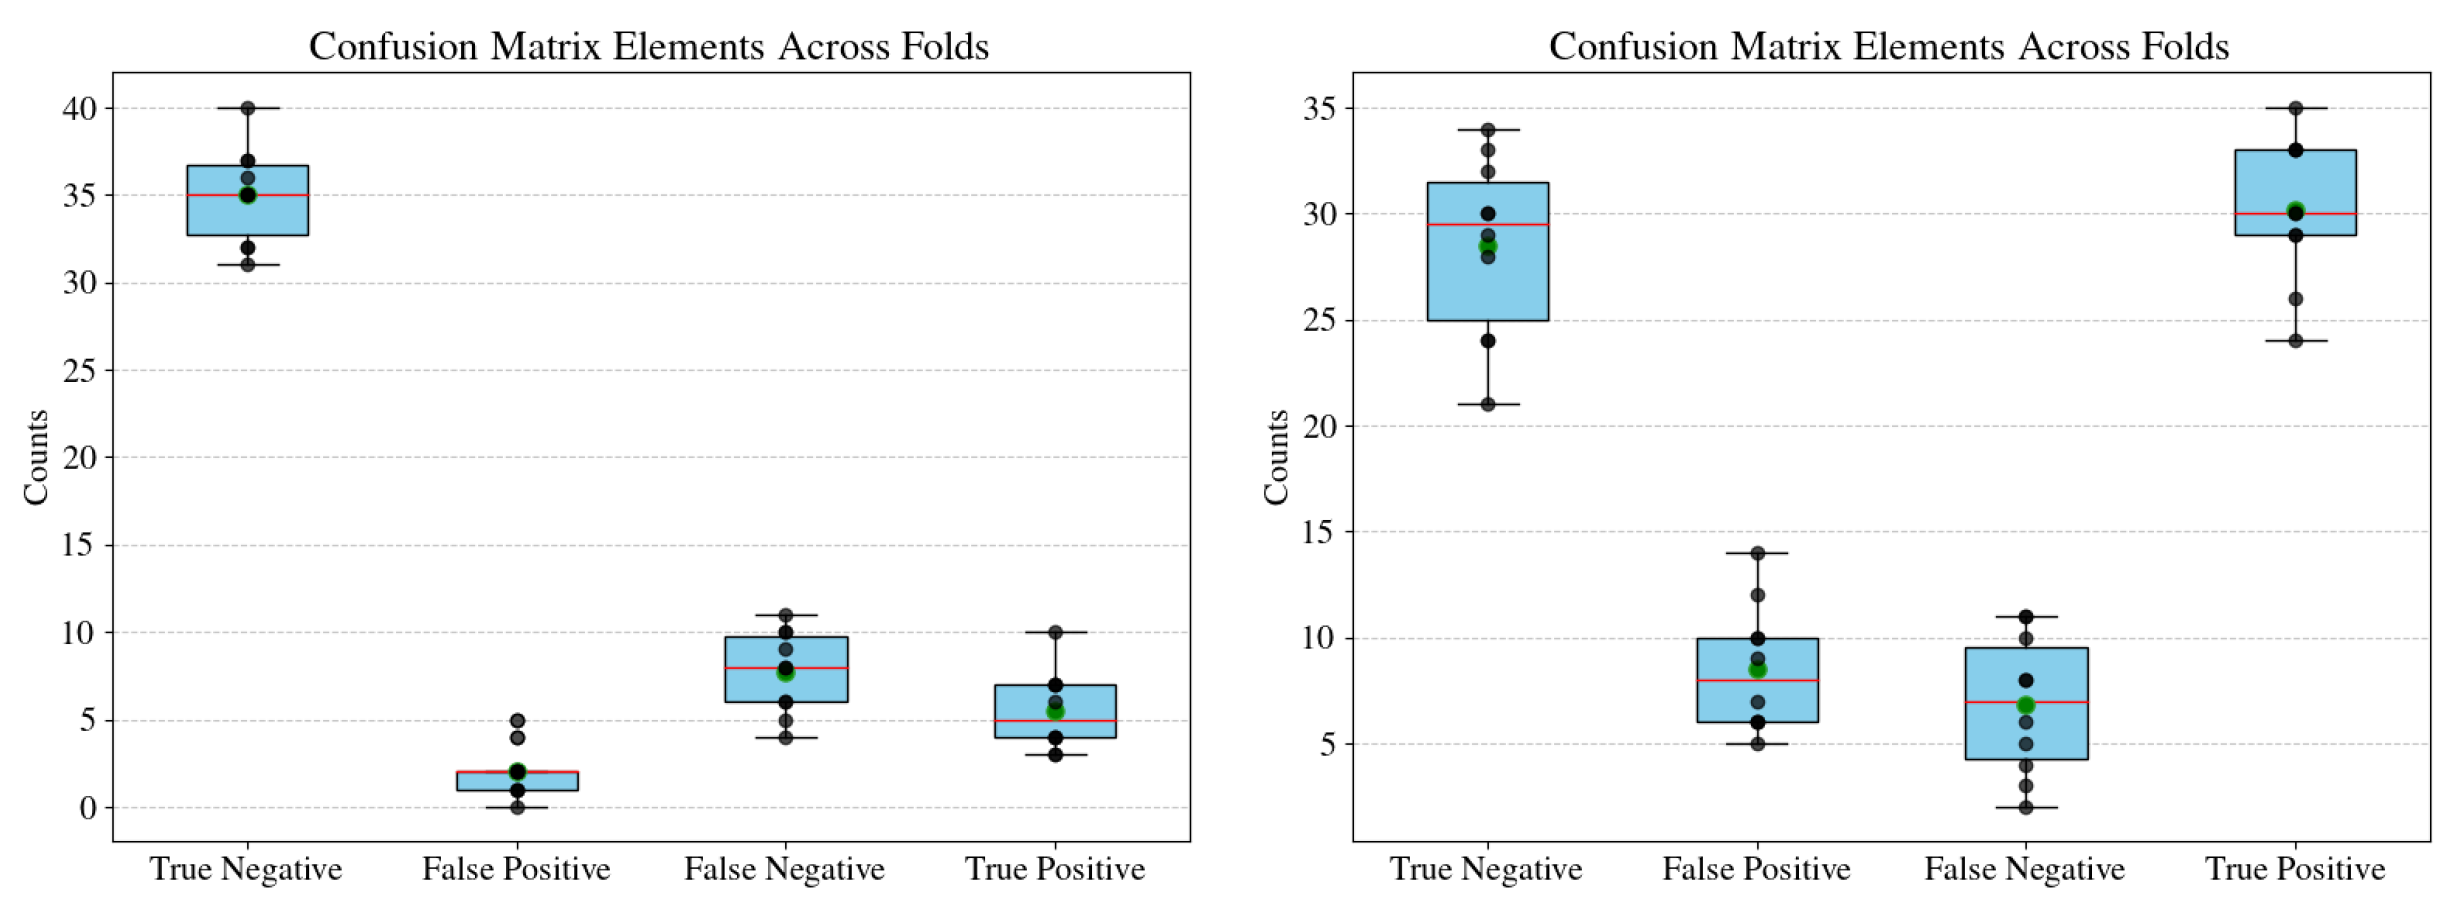
The AdaBoost models presented in
Figure 3 similarly showcase a class imbalance with high number of true negatives. The comparatively advanced AdaBoost model trained on non-augmented data shows very low variability in false negatives and true positives as compared to the Logistic Regression model. The augmented results (right plot) show a high count of true negatives and true positives, with relatively lower variability, indicating consistent performance across the folds. However, the false positives and false negatives, though infrequent, exhibit higher variability as compared to the model trained on non-augmented data.
The CatBoost models, presented in
Figure 4, reveal a slight trade-off between true positives and true negatives. For the non-augmented data (left), true negatives are consistently high, but false negatives show a higher median than in AdaBoost, indicating potential difficulty in identifying positive cases. This can be attributed to the class imbalance in the non-augmented data. Augmentation (right plot) leads to a noticeable reduction in median false negatives and an increase in true positives, reflecting improved sensitivity to the minority class. This suggests that CatBoost benefits significantly from data augmentation.
Finally, the XGBoost models, presented in
Figure 5, displays a strong and consistent performance across both non-augmented and augmented datasets. For the non-augmented data (left), true positives and true negatives dominate with low variability, but there is still a slight imbalance in false negatives. The augmented data (right) shows a marginal reduction in false negatives and higher true positives, indicating the class balance due to data augmentation.
These findings have real-world implications, particularly in domains such as healthcare or social science research, where false negatives (e.g., missing critical diagnoses) or false positives (e.g., unnecessary interventions) carry significant consequences. For instance, the improvements observed with augmentation in AdaBoost and Logistic Regression models demonstrate their potential applicability in scenarios where data collection is expensive or limited. On the other hand, the robustness of XGBoost across different conditions reinforces its suitability for high-stake applications where reliability is paramount.
These box plots also underscore the importance of evaluating models across multiple folds to capture variability as single-metric evaluations often obscure critical nuances. By providing a comprehensive view of model performance, this analysis facilitates informed decision-making and helps prioritize models based on specific application needs.
4.4. Comparison of Classification Models
The comparison of machine learning models in predicting CS outcomes reveals nuanced strengths and weaknesses across approaches, particularly in handling class imbalance and the complexity of social and procedural factors. Logistic Regression, a simpler model, benefits from its interpretability and foundational utility. However, its limited ability to capture complex interactions between variables results in lower recall (44.7%) and F1 scores (53.0%) on non-augmented data. This drawback highlights its inclination toward predicting the majority class, undermining its utility for identifying minority cases, such as CS. Augmentation significantly improved its recall to 80.6% and F1 score to 79.8%, suggesting that while Logistic Regression might not inherently excel in complex datasets, proper preprocessing can enhance its practical applicability.
CatBoost stands out for its precision, particularly on non-augmented data (77.8%), suggesting its suitability in applications where false positives must be minimized, such as pre-emptive planning in healthcare interventions. However, its initially low recall (35.6%) without augmentation limits its standalone utility in identifying minority cases. With augmentation, CatBoost achieves a strong balance (recall of 80.4% and F1 score of 79.3%), underscoring its adaptability in environments where accurate identification of minority cases is vital. These findings highlight CatBoost’s potential for tasks emphasizing both minority class detection and the avoidance of unnecessary interventions.
In real-world applications, the choice of model depends heavily on the specific context and requirements. For instance, in healthcare planning, where accurately predicting CS can directly affect resource allocation and patient outcomes, XGBoost’s balanced performance makes it a robust option. Conversely, in scenarios prioritizing the minimization of false positives, CatBoost’s high precision may be more advantageous. AdaBoost, with its consistent recall and precision improvements, presents a middle ground for contexts requiring a reasonable balance between these factors.
The caveats of these models revolve around their reliance on balanced and representative data. Without augmentation, even advanced models like CatBoost and XGBoost struggle with low recall, emphasizing the necessity of addressing class imbalance in datasets with skewed distributions. Furthermore, while ensemble methods excel in performance, their complexity and longer training times could be limitations in resource-constrained settings. Logistic Regression, though less performant, remains valuable for its simplicity and interpretability, especially in exploratory stages or when computational resources are limited.
Ultimately, the findings underscore that no single model is universally optimal; the selection hinges on the specific trade-offs between precision, recall, and interpretability. The improvement across all models post-augmentation highlights the critical importance of preprocessing techniques like SMOTE in achieving reliable and actionable results. These insights provide the scientific and medical community with a robust framework for model selection tailored to the nuanced requirements of healthcare decision-making.
5. Discussion
In the current work, the collected data are analyzed statistically and used to train different ML models to predict cesarean deliveries. Due to the unique circumstances in the Grand Duchy of Luxembourg, it is possible to explore the multifaceted data through different perspectives.
Firstly, statistical analysis was performed, where we employ Generalized Linear Models (GLMs), Analysis of Variance (ANOVA), and Multivariate Analysis of Variance (MANOVA). The parameters are broadly divided into medical and nonmedical categories for these analyses. The statistical analysis shows several parameters that influence the CS rates. However, the most important of them is the language. The study shows that Spanish-speaking women are highly likely to get CS as opposed to women speaking any other languages. Although this disparity in the medical treatment is observed, the current dataset is insufficient to answer the “why”. By adjusting for a comprehensive set of demographic and clinical confounders, our findings underscore the independent role of language, particularly Spanish as a significant predictor of C-section rates. This adjustment strengthens the validity of our results and highlights the need for targeted interventions addressing linguistic and cultural disparities in maternity care.
To understand the disparities in CS rates, a qualitative study could be done to understand sociocultural factors. The attitudes or beliefs about medical interventions, preferences, and perspectives on childbirth would need to be investigated. Additionally, it is also important to assess any biases in healthcare providers. The presence of implicit biases would need to be explored, as well as how language barriers might affect decision-making. Furthermore, the hospital policies and protocols can be reviewed to identify any shortcomings in such scenarios. From this exploratory study, it becomes clear that there are still areas to improve, hence, the need to perform this study on a larger scale and to collect additional factors like socioeconomic status, education level, immigration status, and access to information about childbirth.
Additionally, the statistical analysis of subjective feelings of happiness and respect was explored. This analysis showed that women are more likely to experience negative feelings when going through cesarean deliveries and are on the contrary more likely to experience positive feelings when giving birth vaginally. Additionally, certain interventions during the labor and birth were seen to have a negative impact on the emotional state. Although subjective, exploring the relationship between different factors involved in childbirth and feelings was important as those feelings will heavily influence whether the experience is perceived as positive or negative by the birthing person, and the subjective perception of the experience has been show to affect women’s mental health, among others (see Introduction). Additionally, the literature is lacking when considering the overall experience of women during childbirth. Thus, it can be interesting to study further what are the things resulting in negative experiences and try and mitigate them through hospital protocols.
The collected data were also used to train ML models to predict CS rates, based on various factors. Even with limited 504 data points, the models show an average accuracy of between to , with a test accuracy of around . In the current work, we thoroughly explore the different ML models and their strengths and weaknesses. We also explore in what context each model may be used. However, the aim of the current work is to show proof of concept that such data can be used to successfully train ML model, and not to provide a final model for use. In general, considering the medical resources of Luxembourg, it is recommended that the focus should be on minimizing false positives or, alternatively, choosing a model with lower false positives since false positives when predicting CS rates can lead to self-fulfilling prophecies: Based on the model recommendations, healthcare professionals might look for problematic signs, being unconsciously biased, and thus leading to a cesarean delivery in cases where it might not have been needed. As the factors used in the ML model include social factors, health conditions during pregnancy, and medical practices and interventions leading up to the childbirth, the model could be used in early stages to predict the type of delivery, and preparations could be made accordingly. The authors recommend the collection of more data to train a model that may be used for actual predictions and decision-making. The authors also recommend that developing countries or countries with limited resources should prioritize the model with minimum false negatives as resources are limited and crucial. Hence, deploying resources where thay are not needed might strain the hospital resources.
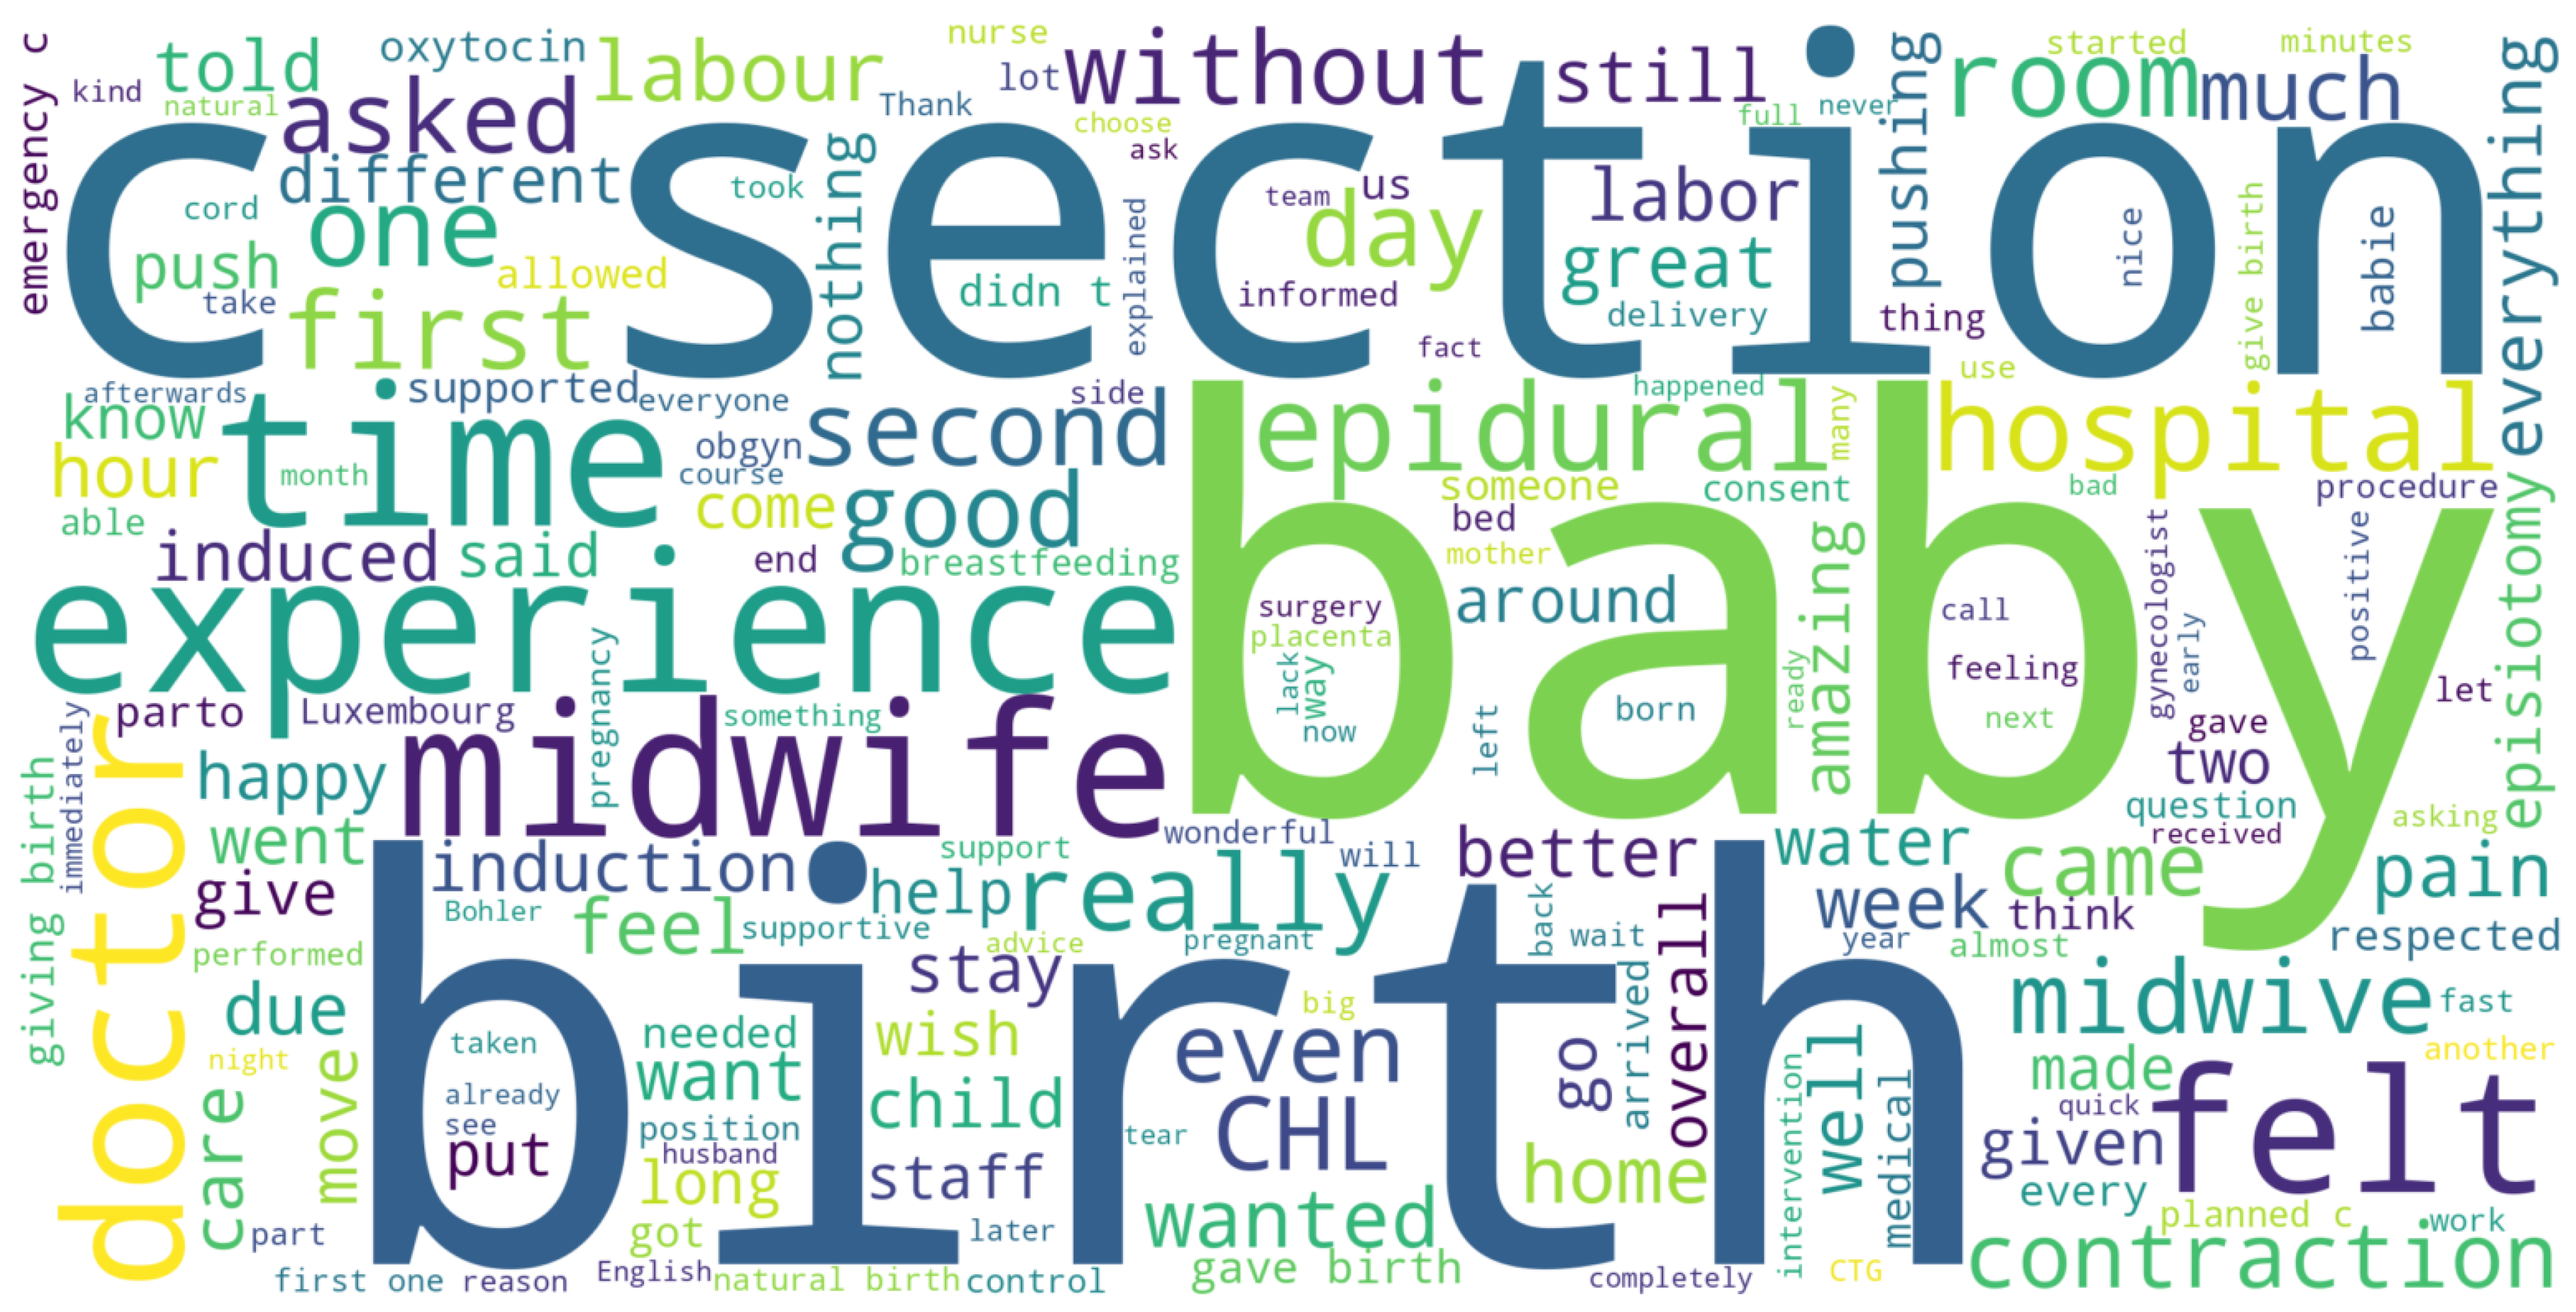
To complement the quantitative findings, we analyzed the open-ended comments provided by 206 participants out of 506 clean responses in the survey. These comments offer valuable insights into the subjective experiences of childbirth. A word cloud visualization, presented in
Figure 6, highlights key recurring themes and terms from the responses. The most prominent words include baby, birth, experience, midwife, doctor, hospital, epidural, and time, reflecting the central role of medical professionals, interventions, and the overall childbirth process.
The variability in the sentiment and focus of these comments underscores the diversity of experiences, ranging from highly positive to deeply challenging. This highlights an opportunity for future research to explore these narratives in greater depth, potentially through sentiment analysis or thematic categorization, to identify areas for improving maternal care. These findings call for a patient-centered approach in healthcare that prioritizes respect, clear communication, and emotional support during childbirth.
6. Conclusions
This study presents a novel exploration of the intersection of linguistic, social, and medical factors influencing childbirth outcomes in Luxembourg’s unique multicultural and multilingual context. By employing statistical and machine learning techniques, we identified disparities, particularly among Spanish-speaking women, who were found to have a significantly higher likelihood of undergoing a cesarean section. While machine learning models achieved high predictive accuracy, the results also revealed challenges in addressing class imbalance and identifying minority cases.
Our findings highlight the need for culturally sensitive healthcare practices that account for linguistic and social barriers. Future research should build upon this study to further investigate these dynamics and their implications for maternal health policies. Expanding this analysis beyond Luxembourg to other multicultural and multilingual societies will provide deeper insights into how linguistic and social factors influence childbirth outcomes on a global scale.
Author Contributions
Conceptualization, M.B.F.; methodology, P.A.; software, P.A.; validation, P.A., and M.B.F.; formal analysis, P.A., and M.B.F.; investigation, P.A., and M.B.F.; resources, M.B.F.; data curation, M.B.F.; writing—original draft preparation, P.A., and M.B.F.; writing—review and editing, P.A., and M.B.F.; visualization, P.A. All authors have read and agreed to the published version of the manuscript.
Funding
This research received no external funding.
Informed Consent Statement
Informed consent was obtained from all subjects involved in the study.
Data Availability Statement
Data will be made available upon request.
Acknowledgments
The authors would like to thank Alvaro Estupinan and Tomás Bortolín for their insights and useful discussions.
Conflicts of Interest
The authors declare no conflicts of interest.
Abbreviations
The following abbreviations are used in this manuscript:
| CS | Ceasarean Section(s) |
| GLM | Generalized Linear Modeling |
| ML | Machine Learning |
| ANOVA | Analysis of Variance |
| MANOVA | Multivariate Analysis of Variance |
| EDA | Exploratory Data Analysis |
| AdaBoost | Adaptive Boosting |
| CatBoost | Categorical Boosting |
| XGBoost | Gradient Boosting |
| SMOTE | Synthetic Minority Over-sampling Technique |
| AIC | Akaike Information Criterion |
Appendix A. Statistical Tests to Compare Birth Groups
Appendix A.1. Chi-Squared Test
Appendix A.1.1. Hospital
Pearson’s Chi-squared test.
Data: table(data_birth[[var]], data_birth$c_section) X-squared = 6.146, df = 3, p-value = 0.1047.
Appendix A.1.2. Language_French
Pearson’s Chi-squared test with Yates’ continuity correction.
Data: table(data_birth[[var]], data_birth$c_section) X-squared = 1.903, df = 1, p-value = 0.1677.
Appendix A.1.3. Language_German
Pearson’s Chi-squared test with Yates’ continuity correction.
Data: table(data_birth[[var]], data_birth$c_section) X-squared = 5.3245, df = 1, p-value = 0.02103.
Appendix A.1.4. Language_Luxembourguish
Pearson’s Chi-squared test with Yates’ continuity correction.
Data: table(data_birth[[var]], data_birth$c_section) X-squared = 2.6105, df = 1, p-value = 0.1062.
Appendix A.1.5. Language_English
Pearson’s Chi-squared test with Yates’ continuity correction.
Data: table(data_birth[[var]], data_birth$c_section) X-squared = 0.088768, df = 1, p-value = 0.7657.
Appendix A.1.6. Language_Portuguese
Pearson’s Chi-squared test with Yates’ continuity correction.
Data: table(data_birth[[var]], data_birth$c_section) X-squared = , df = 1, p-value = 1.
Appendix A.1.7. Language_Spanish
Pearson’s Chi-squared test with Yates’ continuity correction.
Data: table(data_birth[[var]], data_birth$c_section) X-squared = 6.2295, df = 1, p-value = 0.01256.
Appendix A.1.8. Language_Other
Pearson’s Chi-squared test with Yates’ continuity correction.
Data: table(data_birth[[var]], data_birth$c_section) X-squared = 1.1492, df = 1, p-value = 0.2837.
Appendix A.1.9. Epidural
Pearson’s Chi-squared test with Yates’ continuity correction.
Data: table(data_birth[[var]], data_birth$c_section) X-squared = 10.788, df = 1, p-value = 0.001021.
Appendix A.1.10. First_Birth
Pearson’s Chi-squared test with Yates’ continuity correction.
Data: table(data_birth[[var]], data_birth$c_section) X-squared = 8.0297, df = 1, p-value = 0.004602.
Appendix A.1.11. Previous_C_Section
Pearson’s Chi-squared test with Yates’ continuity correction.
Data: table(data_birth[[var]], data_birth$c_section) X-squared = 12.26, df = 1, p-value = 0.0004627.
Appendix A.1.12. Induction
Pearson’s Chi-squared test with Yates’ continuity correction.
Data: table(data_birth[[var]], data_birth$c_section) X-squared = 2.8517, df = 1, p-value = 0.09128.
Appendix A.1.13. Interventions_Rupture
Pearson’s Chi-squared test with Yates’ continuity correction.
Data: table(data_birth[[var]], data_birth$c_section) X-squared = 9.2151, df = 1, p-value = 0.0024.
Appendix A.1.14. Interventions_Oxytocin
Pearson’s Chi-squared test with Yates’ continuity correction.
Data: table(data_birth[[var]], data_birth$c_section) X-squared = 0.44758, df = 1, p-value = 0.5035.
Appendix A.1.15. Interventions_Episiotomy
Pearson’s Chi-squared test with Yates’ continuity correction.
Data: table(data_birth[[var]], data_birth$c_section) X-squared = 21.712, df = 1, p-value = .
Appendix A.1.16. Interventions_Instruments
Pearson’s Chi-squared test with Yates’ continuity correction.
Data: table(data_birth[[var]], data_birth$c_section) X-squared = 16.066, df = 1, p-value = .
Appendix A.1.17. Interventions_Kristeller
Pearson’s Chi-squared test with Yates’ continuity correction.
Data: table(data_birth[[var]], data_birth$c_section) X-squared = 8.7453, df = 1, p-value = 0.003104.
Appendix A.1.18. Interventions_None
Pearson’s Chi-squared test with Yates’ continuity correction.
Data: table(data_birth[[var]], data_birth$c_section) X-squared = 6.9871, df = 1, p-value = 0.00821.
Appendix A.1.19. Interventions_Other
Pearson’s Chi-squared test with Yates’ continuity correction.
Data: table(data_birth[[var]], data_birth$c_section) X-squared = 25.165, df = 1, p-value = .
Appendix A.1.20. Age
Wilcoxon rank sum test with continuity correction.
Data: age by c_section W = 21038, p-value = 0.01775 alternative hypothesis: true location shift is not equal to 0.
Appendix A.2. t-Test
Appendix A.2.1. Hospital
One-sample t-test.
Data: table(data_birth[[var]], data_birth$c_section) t = 2.3044, df = 7, p-value = 0.05464 alternative hypothesis: true mean is not equal to 0 95 percent confidence interval: −1.641058 127.141058 sample estimates: mean of x 62.75.
Appendix A.2.2. Language_French
One-sample t-test.
Data: table(data_birth[[var]], data_birth$c_section) t = 2.9024, df = 3, p-value = 0.06238 alternative hypothesis: true mean is not equal to 0 95 percent confidence interval: −12.11091 263.11091 sample estimates: mean of x 125.5.
Appendix A.2.3. Language_German
One-sample t-test.
Data: table(data_birth[[var]], data_birth$c_section) t = 2.4699, df = 3, p-value = 0.09007 alternative hypothesis: true mean is not equal to 0 95 percent confidence interval: −36.20304 287.20304 sample estimates: mean of x 125.5.
Appendix A.2.4. Language_Luxembourguish
One-sample t-test.
Data: table(data_birth[[var]], data_birth$c_section) t = 2.1081, df = 3, p-value = 0.1256 alternative hypothesis: true mean is not equal to 0 95 percent confidence interval: −63.9625 314.9625 sample estimates: mean of x 125.5.
Appendix A.2.5. Language_English
One-sample t-test.
Data: table(data_birth[[var]], data_birth$c_section) t = 1.8874, df = 3, p-value = 0.1556 alternative hypothesis: true mean is not equal to 0 95 percent confidence interval: −86.11673 337.11673 sample estimates: mean of x 125.5.
Appendix A.2.6. Language_Portuguese
One-sample t-test.
Data: table(data_birth[[var]], data_birth$c_section) t = 1.6218, df = 3, p-value = 0.2033 alternative hypothesis: true mean is not equal to 0 95 percent confidence interval: −120.7697 371.7697 sample estimates: mean of x 125.5.
Appendix A.2.7. Language_Spanish
One-sample t-test.
Data: table(data_birth[[var]], data_birth$c_section) t = 1.9415, df = 3, p-value = 0.1475 alternative hypothesis: true mean is not equal to 0 95 percent confidence interval: −80.21137 331.21137 sample estimates: mean of x 125.5.
Appendix A.2.8. Language_Other
One-sample t-test.
Data: table(data_birth[[var]], data_birth$c_section) t = 3.3978, df = 3, p-value = 0.04253 alternative hypothesis: true mean is not equal to 0 95 percent confidence interval: 7.953943 243.046057 sample estimates: mean of x 125.5.
Appendix A.2.9. Epidural
One-sample t-test.
Data: table(data_birth[[var]], data_birth$c_section) t = 2.8679, df = 3, p-value = 0.06416 alternative hypothesis: true mean is not equal to 0 95 percent confidence interval: −13.76309 264.76309 sample estimates: mean of x 125.5.
Appendix A.2.10. First_Birth
One-sample t-test.
Data: table(data_birth[[var]], data_birth$c_section) t = 2.9611, df = 3, p-value = 0.05949 alternative hypothesis: true mean is not equal to 0 95 percent confidence interval: −9.379043 260.379043 sample estimates: mean of x 125.5.
Appendix A.2.11. Previous_C_Section
One-sample t-test.
Data: table(data_birth[[var]], data_birth$c_section) t = 1.6035, df = 3, p-value = 0.2072 alternative hypothesis: true mean is not equal to 0 95 percent confidence interval: −123.5743 374.5743 sample estimates: mean of x 125.5.
Appendix A.2.12. Induction
One-sample t-test.
Data: table(data_birth[[var]], data_birth$c_section) t = 2.9086, df = 3, p-value = 0.06207 alternative hypothesis: true mean is not equal to 0 95 percent confidence interval: −11.8162 262.8162 sample estimates: mean of x 125.5.
Appendix A.2.13. Interventions_Rupture
One-sample t-test.
Data: table(data_birth[[var]], data_birth$c_section) t = 2.7515, df = 3, p-value = 0.07065 alternative hypothesis: true mean is not equal to 0 95 percent confidence interval: −19.65642 270.65642 sample estimates: mean of x 125.5
Appendix A.2.14. Interventions_Oxytocin
One-sample t-test.
Data: table(data_birth[[var]], data_birth$c_section) t = 3.1973, df = 3, p-value = 0.04944 alternative hypothesis: true mean is not equal to 0 95 percent confidence interval: 0.5813814 250.4186186 sample estimates: mean of x 125.5.
Appendix A.2.15. Interventions_Episiotomy
One-sample t-test.
Data: table(data_birth[[var]], data_birth$c_section) t = 1.8996, df = 3, p-value = 0.1537 alternative hypothesis: true mean is not equal to 0 95 percent confidence interval: −84.75632 335.75632 sample estimates: mean of x 125.5.
Appendix A.2.16. Interventions_Instruments
One-sample t-test.
Data: table(data_birth[[var]], data_birth$c_section) t = 2.1186, df = 3, p-value = 0.1243 alternative hypothesis: true mean is not equal to 0 95 percent confidence interval: −63.01574 314.01574 sample estimates: mean of x 125.5.
Appendix A.2.17. Interventions_Kristeller
One-sample t-test.
Data: table(data_birth[[var]], data_birth$c_section) t = 1.7321, df = 3, p-value = 0.1817 alternative hypothesis: true mean is not equal to 0 95 percent confidence interval: −105.0847 356.0847 sample estimates: mean of x 125.5.
Appendix A.2.18. Interventions_None
One-sample t-test.
Data: table(data_birth[[var]], data_birth$c_section) t = 2.9557, df = 3, p-value = 0.05975 alternative hypothesis: true mean is not equal to 0 95 percent confidence interval: −9.629109 260.629109 sample estimates: mean of x 125.5.
Appendix A.2.19. Interventions_Other
One-sample t-test.
Data: table(data_birth[[var]], data_birth$c_section) t = 1.5823, df = 3, p-value = 0.2117 alternative hypothesis: true mean is not equal to 0 95 percent confidence interval: −126.9133 377.9133 sample estimates: mean of x 125.5.
Appendix B. Statistical Analysis Results
Appendix B.1. GLM Results
In this section, the results for the Generalized Linear Modeling are presented for further reference.
Table A1.
Generalized Linear Model (GLM) results for predicting happiness during childbirth based on socio-demographic factors.
Table A1.
Generalized Linear Model (GLM) results for predicting happiness during childbirth based on socio-demographic factors.
| Variable | Estimate () | Std. Error | z Value | p-Value |
|---|
| Intercept | 15.6744 | 646.6176 | 0.024 | 0.9807 |
| French Language | −0.7622 | 0.3249 | −2.346 | 0.0190 * |
| German Language | −0.0975 | 0.4754 | −0.205 | 0.8375 |
| Luxembourgish Language | 0.2274 | 0.5265 | 0.432 | 0.6657 |
| English Language | −0.4948 | 0.4697 | −1.053 | 0.2921 |
| Portuguese Language | 0.5387 | 0.6004 | 0.897 | 0.3695 |
| Spanish Language | −0.1102 | 0.3649 | −0.302 | 0.7627 |
| Other Language | 0.1941 | 0.3085 | 0.629 | 0.5292 |
| Hospital:A | −14.9427 | 646.6178 | −0.023 | 0.9816 |
| Hospital:B | −14.0180 | 646.6173 | −0.022 | 0.9827 |
| Hospital:C | −13.5856 | 646.6173 | −0.021 | 0.9832 |
| Induction | −0.6319 | 0.2942 | −2.148 | 0.0317 * |
| Health Conditions | −0.4018 | 0.3358 | −1.196 | 0.2316 |
| First Birth | −0.1558 | 0.3522 | −0.442 | 0.6582 |
| Vaginal Birth | 1.3403 | 0.2949 | 4.545 | *** |
Table A2.
Generalized Linear Model (GLM) results for predicting happiness during childbirth based on medical factors.
Table A2.
Generalized Linear Model (GLM) results for predicting happiness during childbirth based on medical factors.
| Variable | Estimate () | Std. Error | z Value | p-Value |
|---|
| Intercept | 2.982381 | 0.823321 | 3.622 | 0.000292 *** |
| Hospital:A | 0.015405 | 0.995280 | 0.015 | 0.987651 |
| Hospital:B | 0.536672 | 0.754019 | 0.712 | 0.476621 |
| Hospital:C | 0.641373 | 0.768241 | 0.835 | 0.403797 |
| Induction | −0.246522 | 0.307101 | −0.803 | 0.422126 |
| Health Conditions | −0.522239 | 0.303347 | −1.722 | 0.085144 . |
| First Birth | −0.120879 | 0.353763 | −0.342 | 0.732580 |
| Previous CS | −0.006011 | 0.573796 | −0.010 | 0.991641 |
| Intervention Rupture | 0.249053 | 0.319325 | 0.780 | 0.435430 |
| Intervention Oxytocin | −0.948630 | 0.366793 | −2.586 | 0.009702 ** |
| Intervention Episiotomy | −0.299293 | 0.379828 | −0.788 | 0.430715 |
| Intervention Instruments | −0.846831 | 0.339283 | −2.496 | 0.012562 * |
| Intervention Kristeller | −0.707243 | 0.389488 | −1.816 | 0.069397 . |
| No Intervention | −0.530143 | 0.463651 | −1.143 | 0.252869 |
| Other Intervention | −2.442600 | 0.449521 | −5.434 | *** |
| Epidural | −0.724259 | 0.364169 | −1.989 | 0.046724 * |
Table A3.
Generalized Linear Model (GLM) results for predicting feelings of respect during childbirth based on socio-demographic factors.
Table A3.
Generalized Linear Model (GLM) results for predicting feelings of respect during childbirth based on socio-demographic factors.
| Variable | Estimate () | Std. Error | z Value | p-Value |
|---|
| Intercept | 2.00577 | 0.84679 | 2.369 | 0.0179 * |
| French Language | −0.32518 | 0.27913 | −1.165 | 0.2440 |
| German Language | −0.51867 | 0.36105 | −1.437 | 0.1508 |
| Luxembourgish Language | 0.01419 | 0.39582 | 0.036 | 0.9714 |
| English Language | −0.07646 | 0.38157 | −0.200 | 0.8412 |
| Portuguese Language | 0.27575 | 0.49050 | 0.562 | 0.5740 |
| Spanish Language | −0.56531 | 0.30265 | −1.868 | 0.0618 . |
| Other Languages | 0.03390 | 0.26492 | 0.128 | 0.8982 |
| Hospital:A | −0.51976 | 0.91661 | −0.567 | 0.5707 |
| Hospital:B | 0.25821 | 0.70181 | 0.368 | 0.7129 |
| Hospital:C | 0.56705 | 0.71462 | 0.794 | 0.4275 |
| Induction | −0.34561 | 0.25800 | −1.340 | 0.1804 |
| Health Conditions | −0.33844 | 0.29103 | −1.163 | 0.2449 |
| First Birth | −0.41515 | 0.28681 | −1.447 | 0.1478 |
| Vaginal Birth | 0.63235 | 0.26784 | 2.361 | 0.0182 * |
| Epidural | −0.30580 | 0.29591 | −1.033 | 0.3014 |
Table A4.
Generalized Linear Model (GLM) results for predicting feelings of respect during childbirth based on medical factors.
Table A4.
Generalized Linear Model (GLM) results for predicting feelings of respect during childbirth based on medical factors.
| Variable | Estimate () | Std. Error | z Value | p-Value |
|---|
| Intercept | 2.7043 | 0.7937 | 3.407 | 0.000656 *** |
| Hospital:A | −0.0818 | 0.9533 | −0.086 | 0.932 |
| Hospital:B | 0.4717 | 0.7287 | 0.647 | 0.517 |
| Hospital:C | 0.5999 | 0.7449 | 0.805 | 0.421 |
| Induction | 0.2091 | 0.3112 | 0.672 | 0.502 |
| Health Conditions | −0.2718 | 0.3049 | −0.892 | 0.373 |
| First Birth | −0.3560 | 0.3461 | −1.029 | 0.304 |
| Previous CS | −0.5655 | 0.5431 | −1.041 | 0.298 |
| Intervention Rupture | −0.1818 | 0.3118 | −0.583 | 0.560 |
| Intervention Oxytocin | −1.1210 | 0.3690 | −3.038 | 0.002 ** |
| Intervention Episiotomy | −0.7170 | 0.3593 | −1.996 | 0.046 * |
| Intervention Instrumental | −0.2561 | 0.3454 | −0.741 | 0.458 |
| Intervention Kristeller | −0.9817 | 0.3837 | −2.559 | 0.011 * |
| No Intervention | −0.6916 | 0.4385 | −1.577 | 0.115 |
| Other Interventions | −1.8580 | 0.4268 | −4.353 | *** |
| Epidural | −0.1438 | 0.3229 | −0.445 | 0.656 |
Appendix B.2. ANOVA Results
Table A5.
ANOVA results for socio-demographic factors influencing CS.
Table A5.
ANOVA results for socio-demographic factors influencing CS.
| Variable | Df | Sum Sq | Mean Sq | F-Value | p-Value |
|---|
| French Language | 1 | 0.43 | 0.428 | 2.495 | 0.1149 |
| German Language | 1 | 0.90 | 0.901 | 5.252 | 0.0223 * |
| Luxembourgish Language | 1 | 0.01 | 0.005 | 0.032 | 0.8588 |
| English Language | 1 | 0.00 | 0.004 | 0.021 | 0.8859 |
| Portuguese Language | 1 | 0.00 | 0.002 | 0.012 | 0.9118 |
| Spanish Language | 1 | 1.31 | 1.311 | 7.644 | 0.0059 ** |
| Other Languages | 1 | 0.51 | 0.510 | 2.975 | 0.0852 |
| Hospital | 3 | 1.13 | 0.376 | 2.192 | 0.0882 |
| Induction | 1 | 0.48 | 0.480 | 2.800 | 0.0949 |
| Health Conditions | 1 | 2.21 | 2.211 | 12.890 | 0.0004 *** |
| First Birth | 1 | 1.66 | 1.662 | 9.693 | 0.0020 ** |
| Previous CS | 1 | 4.87 | 4.874 | 28.418 | 1.5 *** |
| Age | 1 | 0.51 | 0.514 | 2.999 | 0.0839 |
| Epidural | 1 | 0.08 | 0.079 | 0.459 | 0.4985 |
| Residuals | 485 | 83.18 | 0.172 | | |
Table A6.
ANOVA results for medical factors influencing CS.
Table A6.
ANOVA results for medical factors influencing CS.
| Variable | Df | Sum Sq | Mean Sq | F-Value | p-Value |
|---|
| Hospital | 3 | 1.19 | 0.397 | 2.805 | 0.0393 * |
| Induction | 1 | 0.60 | 0.602 | 4.255 | 0.0397 * |
| Health Conditions | 1 | 2.55 | 2.546 | 17.988 | 2.66 *** |
| First Birth | 1 | 1.50 | 1.503 | 10.622 | 0.0012 ** |
| Previous CS | 1 | 5.19 | 5.187 | 36.649 | *** |
| Interventions Rupture | 1 | 2.65 | 2.647 | 18.700 | 1.86 *** |
| Interventions Oxytocin | 1 | 0.58 | 0.578 | 4.081 | 0.0439 * |
| Interventions Episiotomy | 1 | 4.05 | 4.052 | 28.626 | 1.35 *** |
| Interventions Instruments | 1 | 3.94 | 3.938 | 27.821 | 2.01 *** |
| Interventions Kristeller | 1 | 0.99 | 0.986 | 6.968 | 0.0086 ** |
| Interventions None | 1 | 0.05 | 0.053 | 0.372 | 0.5423 |
| Interventions Other | 1 | 3.51 | 3.510 | 24.803 | 8.84 *** |
| Epidural | 1 | 1.71 | 1.714 | 12.109 | 0.0005 *** |
| Residuals | 486 | 68.78 | 0.142 | | |
Appendix C. ML Model Metrics for Non-Augmented Data
Table A7.
Logistic Regression model metrics for non-augmented data for 10 folds, the bold numbers show the mean values over the 10 folds.
Table A7.
Logistic Regression model metrics for non-augmented data for 10 folds, the bold numbers show the mean values over the 10 folds.
| Fold | Train Accuracy | Train Precision | Train Recall | Train F1 Score | Test Accuracy | Test Precision | Test Recall | Test F1 Score |
|---|
| 1 | 84.0 | 79.5 | 52.5 | 63.3 | 76.5 | 58.3 | 50.0 | 53.8 |
| 2 | 83.1 | 76.9 | 50.8 | 61.2 | 78.4 | 71.4 | 35.7 | 47.6 |
| 3 | 82.7 | 75.3 | 51.3 | 61.0 | 78.0 | 66.7 | 30.8 | 42.1 |
| 4 | 84.1 | 78.3 | 54.6 | 64.4 | 70.0 | 37.5 | 23.1 | 28.6 |
| 5 | 82.5 | 76.3 | 48.7 | 59.5 | 84.0 | 77.8 | 53.8 | 63.6 |
| 6 | 81.9 | 75.3 | 46.2 | 57.3 | 90.0 | 100.0 | 61.5 | 76.2 |
| 7 | 82.7 | 74.7 | 52.1 | 61.4 | 80.0 | 80.0 | 30.8 | 44.4 |
| 8 | 83.6 | 77.8 | 52.9 | 63.0 | 78.0 | 75.0 | 23.1 | 35.3 |
| 9 | 81.4 | 73.3 | 46.2 | 56.7 | 94.0 | 85.7 | 92.3 | 88.9 |
| 10 | 83.2 | 74.7 | 54.6 | 63.1 | 76.0 | 54.5 | 46.2 | 50.0 |
| Mean | 82.9 | 76.2 | 51.0 | 61.1 | 80.5 | 70.7 | 44.7 | 53.0 |
Table A8.
AdaBoost model metrics for non-augmented data for 10 folds, the bold numbers show the mean values over the 10 folds.
Table A8.
AdaBoost model metrics for non-augmented data for 10 folds, the bold numbers show the mean values over the 10 folds.
| Fold | Train Accuracy | Train Precision | Train Recall | Train F1 Score | Test Accuracy | Test Precision | Test Recall | Test F1 Score |
|---|
| 1 | 84.5 | 75.0 | 61.0 | 67.3 | 70.6 | 46.7 | 50.0 | 48.3 |
| 2 | 83.4 | 74.2 | 55.9 | 63.8 | 82.4 | 72.7 | 57.1 | 64.0 |
| 3 | 82.7 | 72.0 | 56.3 | 63.2 | 82.0 | 75.0 | 46.2 | 57.1 |
| 4 | 82.7 | 73.0 | 54.6 | 62.5 | 72.0 | 45.5 | 38.5 | 41.7 |
| 5 | 81.9 | 71.3 | 52.1 | 60.2 | 88.0 | 81.8 | 69.2 | 75.0 |
| 6 | 81.6 | 69.6 | 53.8 | 60.7 | 86.0 | 87.5 | 53.8 | 66.7 |
| 7 | 83.6 | 75.9 | 55.5 | 64.1 | 82.0 | 75.0 | 46.2 | 57.1 |
| 8 | 82.7 | 72.0 | 56.3 | 63.2 | 72.0 | 42.9 | 23.1 | 30.0 |
| 9 | 81.4 | 70.6 | 50.4 | 58.8 | 90.0 | 83.3 | 76.9 | 80.0 |
| 10 | 84.1 | 75.3 | 58.8 | 66.0 | 74.0 | 50.0 | 53.8 | 51.9 |
| Mean | 82.9 | 72.9 | 55.5 | 63.0 | 79.9 | 66.0 | 51.5 | 57.2 |
Table A9.
CatBoost model metrics for non-augmented data for 10 folds, the bold numbers show the mean values over the 10 folds.
Table A9.
CatBoost model metrics for non-augmented data for 10 folds, the bold numbers show the mean values over the 10 folds.
| Fold | Train Accuracy | Train Precision | Train Recall | Train F1 Score | Test Accuracy | Test Precision | Test Recall | Test F1 Score |
|---|
| 1 | 85.8 | 93.5 | 49.2 | 64.4 | 80.4 | 75.0 | 42.9 | 54.5 |
| 2 | 83.8 | 88.1 | 44.1 | 58.8 | 82.4 | 100.0 | 35.7 | 52.6 |
| 3 | 85.4 | 93.4 | 47.9 | 63.3 | 76.0 | 57.1 | 30.8 | 40.0 |
| 4 | 84.7 | 90.3 | 47.1 | 61.9 | 76.0 | 66.7 | 15.4 | 25.0 |
| 5 | 85.0 | 93.2 | 46.2 | 61.8 | 78.0 | 66.7 | 30.8 | 42.1 |
| 6 | 83.8 | 91.1 | 42.9 | 58.3 | 86.0 | 100.0 | 46.2 | 63.2 |
| 7 | 84.1 | 88.5 | 45.4 | 60.0 | 80.0 | 80.0 | 30.8 | 44.4 |
| 8 | 85.0 | 91.8 | 47.1 | 62.2 | 78.0 | 75.0 | 23.1 | 35.3 |
| 9 | 82.7 | 90.2 | 38.7 | 54.1 | 92.0 | 100.0 | 69.2 | 81.8 |
| 10 | 84.7 | 89.1 | 47.9 | 62.3 | 76.0 | 57.1 | 30.8 | 40.0 |
| Mean | 84.5 | 90.9 | 45.6 | 60.7 | 80.5 | 77.8 | 35.6 | 47.9 |
Table A10.
XGBoost model metrics for non-augmented data for 10 folds, the bold numbers show the mean values over the 10 folds.
Table A10.
XGBoost model metrics for non-augmented data for 10 folds, the bold numbers show the mean values over the 10 folds.
| Fold | Train Accuracy | Train Precision | Train Recall | Train F1 Score | Test Accuracy | Test Precision | Test Recall | Test F1 Score |
|---|
| 1 | 85.4 | 88.2 | 50.8 | 64.5 | 76.5 | 62.5 | 35.7 | 45.5 |
| 2 | 85.1 | 87.0 | 50.8 | 64.2 | 78.4 | 71.4 | 35.7 | 47.6 |
| 3 | 85.4 | 89.6 | 50.4 | 64.5 | 82.0 | 75.0 | 46.2 | 57.1 |
| 4 | 85.4 | 86.3 | 52.9 | 65.6 | 74.0 | 50.0 | 15.4 | 23.5 |
| 5 | 85.2 | 88.2 | 50.4 | 64.2 | 78.0 | 66.7 | 30.8 | 42.1 |
| 6 | 83.8 | 82.9 | 48.7 | 61.4 | 86.0 | 100.0 | 46.2 | 63.2 |
| 7 | 85.6 | 89.7 | 51.3 | 65.2 | 80.0 | 80.0 | 30.8 | 44.4 |
| 8 | 85.6 | 88.6 | 52.1 | 65.6 | 76.0 | 60.0 | 23.1 | 33.3 |
| 9 | 83.6 | 88.1 | 43.7 | 58.4 | 88.0 | 81.8 | 69.2 | 75.0 |
| 10 | 84.5 | 86.6 | 48.7 | 62.4 | 78.0 | 58.3 | 53.8 | 56.0 |
| Mean | 85.0 | 87.5 | 50.0 | 63.6 | 79.7 | 70.6 | 38.7 | 48.8 |
Appendix D. STROBE Checklist
Here, we present the STROBE guidelines checklist. The page number for the section corresponding to each item in the checklist is denoted. It is quite impractical to pinpoint each and every instance of information as this table would be too long and in the end unhelpful for the reader trying to verify if the given STROBE guideline information is available or not.
Table A11.
The STROBE checklist: ✓ means the component is present/applicable, NA is Not Applicable.
Table A11.
The STROBE checklist: ✓ means the component is present/applicable, NA is Not Applicable.
| Item No. | Contents | Recommendations | Checklist | Page No. |
|---|
| 1 | Title & abstract | (a) Indicate the study’s design with a commonly used term in the title or the abstract | ✓ | 1 |
| | | (b) Provide in the abstract an informative and balanced summary of what was done and what was found | ✓ | |
| 2 | Introduction | | | |
| | Background or rationale | Explain the scientific background and rationale for the investigation being reported | ✓ | 1, 2 |
| | Objectives | State specific objectives, including any prespecified hypotheses | ✓ | |
| 3 | Methods | | | |
| | Study design | Present key elements of study design early in the paper | ✓ | 4 |
| | Setting | Describe the setting, locations, and relevant dates, including periods of recruitment, exposure, follow-up, and data collection | ✓ | 4, 5 |
| | Participants | Cohort study—Give the eligibility criteria, and the sources and methods of selection of participants. Describe methods of follow-up | ✓ | 5, 5 |
| | Variables | Clearly define all outcomes, exposures, predictors, potential confounders, and effect modifiers. Give diagnostic criteria, if applicable | ✓ | 6 |
| | Data sources/measurements | For each variable of interest, give sources of data and details of methods of assessment (measurement). Describe comparability of assessment methods if there is more than one group | ✓ | 6 |
| | Bias | Describe any efforts to address potential sources of bias | ✓ | 19 |
| | Study size | Explain how the study size was arrived at | ✓ | 5 |
| | Quantitative variables | Explain how quantitative variables were handled in the analyses. If applicable, describe which groupings were chosen and why | ✓ | 6 |
| | Statistical methods | (a) Describe all statistical methods, including those used to control for confounding | ✓ | 6, 8 |
| | | (b) Describe any methods used to examine subgroups and interactions | ✓ | 6 |
| | | (c) Explain how missing data were addressed | ✓ | 6 |
| | | (d) Cohort study—If applicable, explain how loss to follow-up was addressed | NA | - |
| | | (e) Describe any sensitivity analyses | NA | - |
| 4 | Results | | | |
| | Participants | (a) Report numbers of individuals at each stage of study—eg numbers potentially eligible, examined for eligibility, confirmed eligible, included in the study, completing follow-up, and analysed | ✓ | 5, 5 |
| | | (b) Give reasons for non-participation at each stage | NA | - |
| | | (c) Consider use of a flow diagram | NA | - |
| | Descriptive data | (a) Give characteristics of study participants (eg demographic, clinical, social) and information on exposures and potential confounders | ✓ | 4, 5, 5, 5, 6 |
| | | (b) Indicate number of participants with missing data for each variable of interest | NA | - |
| | | (c) Cohort study—Summarise follow-up time (eg, average and total amount) | NA | - |
| | Outcome data | Cohort study—Report numbers of outcome events or summary measures over time | NA | - |
| Table | continued | on the | next | page |
Table A12.
The STROBE checklist continued: ✓ means the component is present/applicable, NA is Not Applicable.
Table A12.
The STROBE checklist continued: ✓ means the component is present/applicable, NA is Not Applicable.
| Item No. | Contents | Recommendations | Checklist | Page No. |
|---|
| | Main results | (a) Give unadjusted estimates and, if applicable, confounder-adjusted estimates and their precision (eg, 95% confidence interval). Make clear which confounders were adjusted for and why they were included | ✓ | 10, 18 |
| | | (b) Report category boundaries when continuous variables were categorized | NA | - |
| | | (c) If relevant, consider translating estimates of relative risk into absolute risk for a meaningful time period | NA | - |
| | Other analyses | Report other analyses done—eg analyses of subgroups and interactions, and sensitivity analyses | | 18 |
| 5 | Discussion | | | |
| | Key results | Summarise key results with reference to study objectives | ✓ | 24 |
| | Limitations | Discuss limitations of the study, taking into account sources of potential bias or imprecision. Discuss both direction and magnitude of any potential bias | ✓ | 24 |
| | Interpretation | Give a cautious overall interpretation of results considering objectives, limitations, multiplicity of analyses, results from similar studies, and other relevant evidence | ✓ | 24 |
| | Generalisability | Discuss the generalisability (external validity) of the study results | ✓ | 24 |
| 6 | Other Information | | | |
| | Funding | Give the source of funding and the role of the funders for the present study and, if applicable, for the original study on which the present article is based | NA | - |
References
- Dahlen, H.; Kennedy, H.; Anderson, C.; Bell, A.; Clark, A.; Foureur, M.; Ohm, J.; Shearman, A.; Taylor, J.; Wright, M.; et al. The EPIIC hypothesis: Intrapartum effects on the neonatal epigenome and consequent health outcomes. Med. Hypotheses 2013, 80, 656–662. [Google Scholar] [CrossRef]
- Olza-Fernández, I.; Marín Gabriel, M.A.; Gil-Sanchez, A.; Garcia-Segura, L.M.; Arevalo, M.A. Neuroendocrinology of childbirth and mother–child attachment: The basis of an etiopathogenic model of perinatal neurobiological disorders. Front. Neuroendocrinol. 2014, 35, 459–472. [Google Scholar] [CrossRef]
- Wampach, L.; Heintz-Buschart, A.; Fritz, J.V.; Ramiro-Garcia, J.; Habier, J.; Herold, M.; Narayanasamy, S.; Kaysen, A.; Hogan, A.H.; Bindl, L.; et al. Birth mode is associated with earliest strain-conferred gut microbiome functions and immunostimulatory potential. Nat. Commun. 2018, 9, 5091. [Google Scholar] [CrossRef] [PubMed]
- Baumgartner, T.; Heinrichs, M.; Vonlanthen, A.; Fischbacher, U.; Fehr, E. Oxytocin shapes the neural circuitry of trust and trust adaptation in humans. Neuron 2008, 58, 639–650. [Google Scholar] [CrossRef] [PubMed]
- Bailham, D.; Joseph, S. Post-traumatic stress following childbirth: A review of the emerging literature and directions for research and practice. Psychol. Health Med. 2003, 8, 159–168. [Google Scholar] [CrossRef]
- Green, J.M.; Coupland, V.A.; Kitzinger, J.V. Expectations, experiences, and psychological outcomes of childbirth: A prospective study of 825 women. Birth 1990, 17, 15–24. [Google Scholar] [CrossRef] [PubMed]
- Simkin, P. Just another day in a woman’s life? Women’s long-term perceptions of their first birth experience. Part I. Birth 1991, 18, 203–210. [Google Scholar] [CrossRef] [PubMed]
- Sandall, J.; Tribe, R.M.; Avery, L.; Mola, G.; Visser, G.H.; Homer, C.S.; Gibbons, D.; Kelly, N.M.; Kennedy, H.P.; Kidanto, H.; et al. Short-term and long-term effects of caesarean section on the health of women and children. Lancet 2018, 392, 1349–1357. [Google Scholar] [CrossRef] [PubMed]
- Keag, O.E.; Norman, J.E.; Stock, S.J. Long-term risks and benefits associated with cesarean delivery for mother, baby, and subsequent pregnancies: Systematic review and meta-analysis. PLoS Med. 2018, 15, e1002494. [Google Scholar] [CrossRef] [PubMed]
- de la Santé, L.I.o.H.L. Surveillance de la Santé Perinatal au Luxembourg 2017–2019. 2023. Available online: https://santesecu.public.lu/fr/publications/s/surveillance-sante-perinatale-2017-2019.html (accessed on 3 December 2024).
- (SRH), Sexual and Reproductive Health and Research, WHO Team WHO Statement on Cesarean Section Rates. 2015. Available online: https://www.who.int/publications/i/item/WHO-RHR-15.02 (accessed on 3 December 2024).
- Statec. Luxembourg in Figures 2024. 2024. Available online: https://statistiques.public.lu/en/actualites/2024/luxembourg-en-chiffres-2024.html (accessed on 3 December 2024).
- Statec Luxembourg Census Data for Linguistic Diversity. 2023. Available online: https://statistiques.public.lu/en/actualites/2024/stn16-population-2024.html (accessed on 3 December 2024).
- Lipschuetz, M.; Guedalia, J.; Rottenstreich, A.; Persky, M.N.; Cohen, S.M.; Kabiri, D.; Levin, G.; Yagel, S.; Unger, R.; Sompolinsky, Y. Prediction of vaginal birth after cesarean deliveries using machine learning. Am. J. Obstet. Gynecol. 2020, 222, 613.e1–613.e12. [Google Scholar] [CrossRef] [PubMed]
- Sana, A.; Razzaq, S.; Ferzund, J. Automated diagnosis and cause analysis of cesarean section using machine learning techniques. Int. J. Mach. Learn. Comput. 2012, 2, 677. [Google Scholar] [CrossRef]
- Daoud, N.; O’Campo, P.; Minh, A.; Urquia, M.L.; Dzakpasu, S.; Heaman, M.; Kaczorowski, J.; Levitt, C.; Smylie, J.; Chalmers, B. Patterns of social inequalities across pregnancy and birth outcomes: A comparison of individual and neighborhood socioeconomic measures. BMC Pregnancy Childbirth 2014, 14, 393. [Google Scholar] [CrossRef] [PubMed]
- Islam, M.N.; Mustafina, S.N.; Mahmud, T.; Khan, N.I. Machine learning to predict pregnancy outcomes: A systematic review, synthesizing framework and future research agenda. BMC Pregnancy Childbirth 2022, 22, 348. [Google Scholar] [CrossRef] [PubMed]
- Khan, N.I.; Mahmud, T.; Islam, M.N.; Mustafina, S.N. Prediction of cesarean childbirth using ensemble machine learning methods. In Proceedings of the 22nd International Conference on Information Integration and Web-Based Applications & Services, Chiang Mai, Thailand, 30 November–2 December 2020; pp. 331–339. [Google Scholar]
- Bertini, A.; Salas, R.; Chabert, S.; Sobrevia, L.; Pardo, F. Using machine learning to predict complications in pregnancy: A systematic review. Front. Bioeng. Biotechnol. 2022, 9, 780389. [Google Scholar] [CrossRef] [PubMed]
- Harrell, F.E., Jr.; Harrell, M.F.E., Jr. Package ‘hmisc’. CRAN 2019, 2019, 235–236. [Google Scholar]
- R Core Team. R: A Language and Environment for Statistical Computing; R Foundation for Statistical Computing: Vienna, Austria, 2021. [Google Scholar]
- Dobson, A.J.; Barnett, A.G. An Introduction to Generalized Linear Models; Chapman and Hall/CRC: Boca Raton, FL, USA, 2018. [Google Scholar]
- Cohen, J. Statistical Power Analysis for the Behavioral Sciences; Routledge: Abingdon, UK, 2013. [Google Scholar]
- Field, A.; Field, Z.; Miles, J. Discovering Statistics Using R; Sage Publications Ltd.: London, UK, 2012; ISBN 9781446289136. [Google Scholar]
- Tabachnick, B.; Fidell, L.; Ullman, J. Using Multivariate Statistics, 7th ed.; Pearson: Boston, MA, USA, 2018; ISBN 9780134790541. [Google Scholar]
- Hosmer, D.W., Jr.; Lemeshow, S.; Sturdivant, R.X. Applied Logistic Regression; John Wiley & Sons: Hoboken, NJ, USA, 2013. [Google Scholar]
- Freund, Y.; Schapire, R.E. A decision-theoretic generalization of on-line learning and an application to boosting. J. Comput. Syst. Sci. 1997, 55, 119–139. [Google Scholar] [CrossRef]
- Prokhorenkova, L.; Gusev, G.; Vorobev, A.; Dorogush, A.V.; Gulin, A. CatBoost: Unbiased boosting with categorical features. In Proceedings of the Advances in Neural Information Processing Systems, Montréal, QC, Canada, 3–8 December 2018; Volume 31. [Google Scholar]
- Chen, T.; Guestrin, C. Xgboost: A scalable tree boosting system. In Proceedings of the 22nd ACM Sigkdd International Conference on Knowledge Discovery and Data Mining, San Francisco, CA, USA, 13–17 August 2016; pp. 785–794. [Google Scholar]
- Hastie, T. The Elements of Statistical Learning: Data Mining, Inference, and Prediction; Springer: Berlin/Heidelberg, Germany, 2009. [Google Scholar]
- Chawla, N.V.; Bowyer, K.W.; Hall, L.O.; Kegelmeyer, W.P. SMOTE: Synthetic minority over-sampling technique. J. Artif. Intell. Res. 2002, 16, 321–357. [Google Scholar] [CrossRef]
Figure 1.
Correlation plot showing Pearson correlation coefficients with statistical significance. Signif. codes: *** , ** , * , . .
Figure 1.
Correlation plot showing Pearson correlation coefficients with statistical significance. Signif. codes: *** , ** , * , . .
Figure 2.
Box plot showing the confusion matrix results across 10 folds for Logistic Regression.
Figure 2.
Box plot showing the confusion matrix results across 10 folds for Logistic Regression.
Figure 3.
Box plot showing the confusion matrix results across 10 folds for AdaBoost.
Figure 3.
Box plot showing the confusion matrix results across 10 folds for AdaBoost.
Figure 4.
Box plot showing the confusion matrix results across 10 folds for CatBoost.
Figure 4.
Box plot showing the confusion matrix results across 10 folds for CatBoost.
Figure 5.
Box plot showing the confusion matrix results across 10 folds for XGBoost.
Figure 5.
Box plot showing the confusion matrix results across 10 folds for XGBoost.
Figure 6.
Word cloud showing the most recurring words used by women when commenting on their experiences during pregnancy and specifically childbirth.
Figure 6.
Word cloud showing the most recurring words used by women when commenting on their experiences during pregnancy and specifically childbirth.
Table 1.
Cohort description and data processing.
Table 1.
Cohort description and data processing.
| Category | Description |
|---|
| Total Participants | 504 |
| Survey Period | March–September 2022 |
| Hospitals Included | CHDN, CHEM, CHL, Clinique Bohler |
| Age (Mean ± SD) | 33.27 ± 4.1 years |
| Age Range | 20–49 |
| Languages Spoken | French, German, Luxembourgish, English, Portuguese, Spanish, Other |
| Number of Participants per Language | French: 327, German: 127, Luxembourgish: 94, English: 428, Portuguese: 34, Spanish: 88, Other: 214 |
| Number of First Births | 336 |
| Number of Vaginal Births | 370 |
| Number of Previous C-Sections | 39 |
| Number of Participants with Health Conditions | 98 |
| Number of Participants with Induction | 177 |
| Number of Participants with Epidural | 334 |
| Medical Interventions | Artificial Rupture of Water, Oxytocin, Episiotomy, Instruments, Kristeller, None, Other |
| Number of Participants per Intervention | Artificial Rupture: 149, Oxytocin: 189, Episiotomy: 64, Instruments: 90, Kristeller: 45, None: 186, Other: 39 |
| Number of Participants with Comments | 206 |
| Data Cleaning Process | Removal of invalid/wrong responses, removal of missing data (removed 2 entries) |
| Binary Encoding | Yes/No responses converted to 1 (Yes), 0 (No) |
Table 2.
Descriptive statistics for C-sections. The table presents the descriptive statistics for variables associated with C-section births. N denotes the number of observations, Mean represents the average value, St. Dev. indicates standard deviation, Min is the minimum value, and Max is the maximum value.
| Statistic | N | Mean | St. Dev. | Min | Max |
|---|
| X | 132 | 265.53 | 153.19 | 3 | 501 |
| id | 132 | 265.53 | 153.19 | 3 | 501 |
| First Birth | 132 | 0.773 | 0.421 | 0 | 1 |
| Vaginal Birth | 132 | 0.000 | 0.000 | 0 | 0 |
| Previous C-section | 132 | 0.152 | 0.360 | 0 | 1 |
| Age | 132 | 33.96 | 4.08 | 22 | 49 |
| Health Conditions | 132 | 0.311 | 0.465 | 0 | 1 |
| Induction | 132 | 0.417 | 0.495 | 0 | 1 |
| Epidural | 132 | 0.803 | 0.399 | 0 | 1 |
| Respected | 132 | 0.742 | 0.439 | 0 | 1 |
| Happiness | 132 | 0.644 | 0.481 | 0 | 1 |
| Sentiment | 59 | 2.458 | 1.356 | 1 | 5 |
| Modified | 132 | 10.02 | 63.98 | −1 | 453 |
| Language French | 132 | 0.598 | 0.492 | 0 | 1 |
| Language German | 132 | 0.174 | 0.381 | 0 | 1 |
| Language Luxembourgish | 132 | 0.136 | 0.344 | 0 | 1 |
| Language English | 132 | 0.841 | 0.367 | 0 | 1 |
| Language Portuguese | 132 | 0.068 | 0.253 | 0 | 1 |
| Language Spanish | 132 | 0.250 | 0.435 | 0 | 1 |
| Language Other | 132 | 0.470 | 0.501 | 0 | 1 |
| Interventions Rupture | 132 | 0.189 | 0.393 | 0 | 1 |
| Interventions Oxytocin | 132 | 0.348 | 0.478 | 0 | 1 |
| Interventions Episiotomy | 132 | 0.008 | 0.087 | 0 | 1 |
| Interventions Instruments | 132 | 0.061 | 0.240 | 0 | 1 |
| Interventions Kristeller | 132 | 0.023 | 0.150 | 0 | 1 |
| Interventions None | 132 | 0.470 | 0.501 | 0 | 1 |
| Interventions Other | 132 | 0.182 | 0.387 | 0 | 1 |
| C-Section | 132 | 1.000 | 0.000 | 1 | 1 |
Table 3.
Descriptive statistics for vaginal births. The table presents the descriptive statistics for variables associated with vaginal births. N denotes the number of observations, Mean represents the average value, St. Dev. indicates standard deviation, Min is the minimum value, and Max is the maximum value.
| Statistic | N | Mean | St. Dev. | Min | Max |
|---|
| X | 370 | 245.14 | 141.88 | 0 | 500 |
| id | 370 | 245.14 | 141.88 | 0 | 500 |
| First Birth | 370 | 0.632 | 0.483 | 0 | 1 |
| Vaginal Birth | 370 | 1.000 | 0.000 | 1 | 1 |
| Previous C-section | 370 | 0.051 | 0.221 | 0 | 1 |
| Age | 370 | 33.03 | 4.09 | 20 | 47 |
| Health Conditions | 370 | 0.154 | 0.361 | 0 | 1 |
| Induction | 370 | 0.330 | 0.471 | 0 | 1 |
| Epidural | 370 | 0.643 | 0.480 | 0 | 1 |
| Respected | 370 | 0.854 | 0.354 | 0 | 1 |
| Happiness | 370 | 0.889 | 0.314 | 0 | 1 |
| Sentiment | 147 | 2.918 | 1.392 | 1 | 5 |
| Modified | 370 | 1.61 | 22.42 | −1 | 408 |
| Language French | 370 | 0.670 | 0.471 | 0 | 1 |
| Language German | 370 | 0.281 | 0.450 | 0 | 1 |
| Language Luxembourgish | 370 | 0.205 | 0.405 | 0 | 1 |
| Language English | 370 | 0.857 | 0.351 | 0 | 1 |
| Language Portuguese | 370 | 0.068 | 0.251 | 0 | 1 |
| Language Spanish | 370 | 0.149 | 0.356 | 0 | 1 |
| Language Other | 370 | 0.411 | 0.493 | 0 | 1 |
| Interventions Rupture | 370 | 0.335 | 0.473 | 0 | 1 |
| Interventions Oxytocin | 370 | 0.386 | 0.488 | 0 | 1 |
| Interventions Episiotomy | 370 | 0.170 | 0.376 | 0 | 1 |
| Interventions Instruments | 370 | 0.222 | 0.416 | 0 | 1 |
| Interventions Kristeller | 370 | 0.114 | 0.318 | 0 | 1 |
| Interventions None | 370 | 0.335 | 0.473 | 0 | 1 |
| Interventions Other | 370 | 0.041 | 0.197 | 0 | 1 |
| C-Section | 370 | 0.000 | 0.000 | 0 | 0 |
Table 4.
Generalized Linear Model (GLM) results for socio-demographic factors influencing CS likelihood.
Table 4.
Generalized Linear Model (GLM) results for socio-demographic factors influencing CS likelihood.
| Variable | Estimate () | Std. Error | z Value | p-Value |
|---|
| Intercept | −4.84461 | 1.36127 | −3.559 | 0.000372 *** |
| French Language | −0.13074 | 0.23412 | −0.558 | 0.576554 |
| German Language | −0.51194 | 0.34197 | −1.497 | 0.134390 |
| Luxembourgish Language | −0.13904 | 0.37880 | −0.367 | 0.713581 |
| English Language | −0.26513 | 0.33405 | −0.794 | 0.427372 |
| Portuguese Language | −0.29681 | 0.43557 | −0.681 | 0.495611 |
| Spanish Language | 0.63515 | 0.28124 | 2.258 | 0.023922 * |
| Other Languages | 0.35197 | 0.24156 | 1.457 | 0.145098 |
| Hospital:A | 0.37351 | 1.15057 | 0.325 | 0.745463 |
| Hospital:B | 0.36358 | 0.83006 | 0.438 | 0.661375 |
| Hospital:C | 0.77114 | 0.83402 | 0.925 | 0.355168 |
| First Birth | 1.68557 | 0.36596 | 4.606 | 4.11 *** |
| Previous CS | 2.37856 | 0.48083 | 4.947 | 7.55 *** |
| Age | 0.05232 | 0.02803 | 1.867 | 0.061945 . |
| Epidural | 0.36932 | 0.26810 | 1.378 | 0.168346 |
Table 5.
Generalized Linear Model (GLM) results for medical factors influencing CS likelihood.
Table 5.
Generalized Linear Model (GLM) results for medical factors influencing CS likelihood.
| Variable | Estimate () | Std. Error | z Value | p-Value |
|---|
| Intercept | −4.77586 | 1.07034 | −4.462 | 8.12 *** |
| Hospital:A | −0.19072 | 1.35345 | −0.141 | 0.887939 |
| Hospital:B | 1.15544 | 0.96434 | 1.198 | 0.230853 |
| Hospital:C | 1.41723 | 0.97417 | 1.455 | 0.145722 |
| Induction | 1.00649 | 0.33367 | 3.016 | 0.002558 ** |
| Health Conditions | 1.08823 | 0.30988 | 3.512 | 0.000445 *** |
| First Birth | 1.90581 | 0.39363 | 4.842 | 1.29 *** |
| Previous CS | 2.63249 | 0.54143 | 4.862 | 1.16 *** |
| Intervention Rupture | −1.08032 | 0.37620 | −2.872 | 0.004083 ** |
| Intervention Oxytocin | −0.06261 | 0.41580 | −0.151 | 0.880317 |
| Intervention Episiotomy | −3.34846 | 1.07848 | −3.105 | 0.001904 ** |
| Intervention Instruments | −1.88462 | 0.48608 | −3.877 | 0.000106 *** |
| Intervention Kristeller | −1.48435 | 0.66986 | −2.216 | 0.026698 * |
| No Intervention | 0.38150 | 0.47685 | 0.800 | 0.423693 |
| Other Intervention | 2.14909 | 0.51041 | 4.210 | 2.55 *** |
| Epidural | 1.00208 | 0.30965 | 3.236 | 0.001212 ** |
Table 6.
MANOVA results for the influence of language on medical interventions.
Table 6.
MANOVA results for the influence of language on medical interventions.
| Variable | Df | Pillai’s Trace | Approx F | Num Df | p-Value |
|---|
| French Language | 1 | 0.0093 | 0.6527 | 7 | 0.7122 |
| German Language | 1 | 0.0210 | 1.4948 | 7 | 0.1667 |
| Luxembourgish Language | 1 | 0.0099 | 0.6947 | 7 | 0.6766 |
| English Language | 1 | 0.0174 | 1.2339 | 7 | 0.2823 |
| Portuguese Language | 1 | 0.0249 | 1.7784 | 7 | 0.0895 . |
| Spanish Language | 1 | 0.0371 | 2.6860 | 7 | 0.0097 ** |
| Other Language | 1 | 0.0153 | 1.0868 | 7 | 0.3704 |
| Residuals | 494 | | | | |
Table 7.
Logistic Regression model metrics for augmented data for 10 folds, the bold numbers show the mean values over the 10 folds.
Table 7.
Logistic Regression model metrics for augmented data for 10 folds, the bold numbers show the mean values over the 10 folds.
| Fold | Train Accuracy | Train Precision | Train Recall | Train F1 Score | Test Accuracy | Test Precision | Test Recall | Test F1 Score |
|---|
| 1 | 81.5 | 80.9 | 82.6 | 81.7 | 79.7 | 77.5 | 83.8 | 80.5 |
| 2 | 81.7 | 81.3 | 82.3 | 81.8 | 83.8 | 85.7 | 81.1 | 83.3 |
| 3 | 80.8 | 80.6 | 81.1 | 80.8 | 81.1 | 82.9 | 78.4 | 80.6 |
| 4 | 81.4 | 81.4 | 81.4 | 81.4 | 78.4 | 78.4 | 78.4 | 78.4 |
| 5 | 80.9 | 80.7 | 81.4 | 81.0 | 77.0 | 76.3 | 78.4 | 77.3 |
| 6 | 79.9 | 79.4 | 80.8 | 80.1 | 89.2 | 91.4 | 86.5 | 88.9 |
| 7 | 81.2 | 81.1 | 81.4 | 81.3 | 75.7 | 74.4 | 78.4 | 76.3 |
| 8 | 80.3 | 80.4 | 80.2 | 80.3 | 82.4 | 81.6 | 83.8 | 82.7 |
| 9 | 80.6 | 80.4 | 81.1 | 80.7 | 81.1 | 78.0 | 86.5 | 82.1 |
| 10 | 82.3 | 82.1 | 82.6 | 82.3 | 67.6 | 66.7 | 70.3 | 68.4 |
| Mean | 81.1 | 80.8 | 81.5 | 81.1 | 79.6 | 79.3 | 80.6 | 79.8 |
Table 8.
AdaBoost model metrics for augmented data for 10 folds, the bold numbers show the mean values over the 10 folds.
Table 8.
AdaBoost model metrics for augmented data for 10 folds, the bold numbers show the mean values over the 10 folds.
| Fold | Train Accuracy | Train Precision | Train Recall | Train F1 Score | Test Accuracy | Test Precision | Test Recall | Test F1 Score |
|---|
| 1 | 81.8 | 81.5 | 82.3 | 81.9 | 75.7 | 73.2 | 81.1 | 76.9 |
| 2 | 81.2 | 80.6 | 82.3 | 81.4 | 83.8 | 83.8 | 83.8 | 83.8 |
| 3 | 80.3 | 80.1 | 80.8 | 80.4 | 82.4 | 83.3 | 81.1 | 82.2 |
| 4 | 81.8 | 81.9 | 81.7 | 81.8 | 78.4 | 78.4 | 78.4 | 78.4 |
| 5 | 81.5 | 80.9 | 82.6 | 81.7 | 78.4 | 76.9 | 81.1 | 78.9 |
| 6 | 80.9 | 79.4 | 83.5 | 81.4 | 89.2 | 93.9 | 83.8 | 88.6 |
| 7 | 81.7 | 81.9 | 81.4 | 81.6 | 73.0 | 71.8 | 75.7 | 73.7 |
| 8 | 82.3 | 82.3 | 82.3 | 82.3 | 85.1 | 84.2 | 86.5 | 85.3 |
| 9 | 81.7 | 81.3 | 82.3 | 81.8 | 77.0 | 76.3 | 78.4 | 77.3 |
| 10 | 82.3 | 82.7 | 81.7 | 82.2 | 62.2 | 61.5 | 64.9 | 63.2 |
| Mean | 81.6 | 81.3 | 82.1 | 81.6 | 78.5 | 78.3 | 79.5 | 78.8 |
Table 9.
CatBoost model metrics for augmented data for 10 folds, the bold numbers show the mean values over the 10 folds.
Table 9.
CatBoost model metrics for augmented data for 10 folds, the bold numbers show the mean values over the 10 folds.
| Fold | Train Accuracy | Train Precision | Train Recall | Train F1 Score | Test Accuracy | Test Precision | Test Recall | Test F1 Score |
|---|
| 1 | 82.1 | 81.0 | 84.2 | 82.6 | 86.5 | 82.1 | 91.4 | 86.5 |
| 2 | 82.6 | 81.4 | 85.7 | 83.5 | 79.7 | 71.0 | 78.6 | 74.6 |
| 3 | 83.2 | 82.2 | 85.1 | 83.6 | 77.0 | 74.3 | 76.5 | 75.4 |
| 4 | 83.0 | 82.0 | 85.2 | 83.6 | 81.1 | 72.1 | 93.9 | 81.6 |
| 5 | 82.1 | 81.4 | 83.1 | 82.2 | 85.1 | 88.9 | 82.1 | 85.3 |
| 6 | 83.9 | 82.5 | 85.8 | 84.1 | 71.6 | 74.4 | 72.5 | 73.4 |
| 7 | 84.1 | 83.5 | 84.0 | 83.8 | 75.7 | 86.1 | 70.5 | 77.5 |
| 8 | 83.5 | 82.8 | 83.8 | 83.3 | 75.7 | 76.6 | 83.7 | 80.0 |
| 9 | 83.0 | 82.2 | 83.9 | 83.1 | 77.0 | 84.8 | 70.0 | 76.7 |
| 10 | 83.6 | 82.9 | 85.1 | 84.0 | 82.4 | 78.4 | 85.3 | 81.7 |
| Mean | 83.1 | 82.2 | 84.6 | 83.4 | 79.2 | 78.9 | 80.4 | 79.3 |
Table 10.
XGBoost model metrics for augmented data for 10 folds, the bold numbers show the mean values over the 10 folds.
Table 10.
XGBoost model metrics for augmented data for 10 folds, the bold numbers show the mean values over the 10 folds.
| Fold | Train Accuracy | Train Precision | Train Recall | Train F1 Score | Test Accuracy | Test Precision | Test Recall | Test F1 Score |
|---|
| 1 | 82.9 | 81.0 | 86.3 | 83.5 | 85.1 | 78.6 | 94.3 | 85.7 |
| 2 | 84.8 | 83.9 | 87.1 | 85.5 | 75.7 | 63.2 | 85.7 | 72.7 |
| 3 | 83.5 | 83.8 | 83.3 | 83.6 | 79.7 | 78.8 | 76.5 | 77.6 |
| 4 | 83.2 | 82.2 | 85.2 | 83.7 | 79.7 | 71.4 | 90.9 | 80.0 |
| 5 | 82.7 | 81.8 | 84.0 | 82.9 | 85.1 | 86.8 | 84.6 | 85.7 |
| 6 | 84.5 | 83.3 | 86.1 | 84.6 | 73.0 | 75.0 | 75.0 | 75.0 |
| 7 | 84.5 | 83.5 | 85.3 | 84.4 | 77.0 | 84.6 | 75.0 | 79.5 |
| 8 | 85.4 | 84.6 | 85.9 | 85.3 | 75.7 | 77.8 | 81.4 | 79.5 |
| 9 | 83.9 | 82.7 | 85.5 | 84.1 | 77.0 | 82.9 | 72.5 | 77.3 |
| 10 | 84.2 | 84.5 | 84.2 | 84.4 | 85.1 | 82.9 | 85.3 | 84.1 |
| Mean | 84.0 | 83.1 | 85.3 | 84.2 | 79.3 | 78.2 | 82.1 | 79.7 |
| Disclaimer/Publisher’s Note: The statements, opinions and data contained in all publications are solely those of the individual author(s) and contributor(s) and not of MDPI and/or the editor(s). MDPI and/or the editor(s) disclaim responsibility for any injury to people or property resulting from any ideas, methods, instructions or products referred to in the content. |
© 2025 by the authors. Licensee MDPI, Basel, Switzerland. This article is an open access article distributed under the terms and conditions of the Creative Commons Attribution (CC BY) license (https://creativecommons.org/licenses/by/4.0/).


