4.1. VANET Simulation
To model and evaluate the performance of Vehicular Ad Hoc Networks (VANETs) in a realistic urban environment, a specific road segment was selected. This segment, connecting the Pontificia Universidad Católica del Ecuador–Esmeraldas to the Multiplaza Shopping Center and spanning approximately 1.4 km, was chosen for its ability to represent a dense and complex traffic scenario. The area bounded by the Eugenio Espejo, Pichincha, Muriel, and Pedro Vicente Maldonado streets, characterized by intersections, traffic lights, and varying traffic flow, was defined as the study area.
The different color codes of live traffic in the selected analysis area represent traffic speed on the road. According to Google, the official colors are as follows (see
Table 2):
Geographic coordinates were obtained for the initial point, situated at the Pontifical Catholic University of Ecuador, Esmeraldas Campus (PUCESE), and the terminal point, located at the Multiplaza shopping mall, a key landmark in the city. These points were strategically chosen to represent routes of significant importance regarding vehicular traffic and urban mobility (see
Table 3).
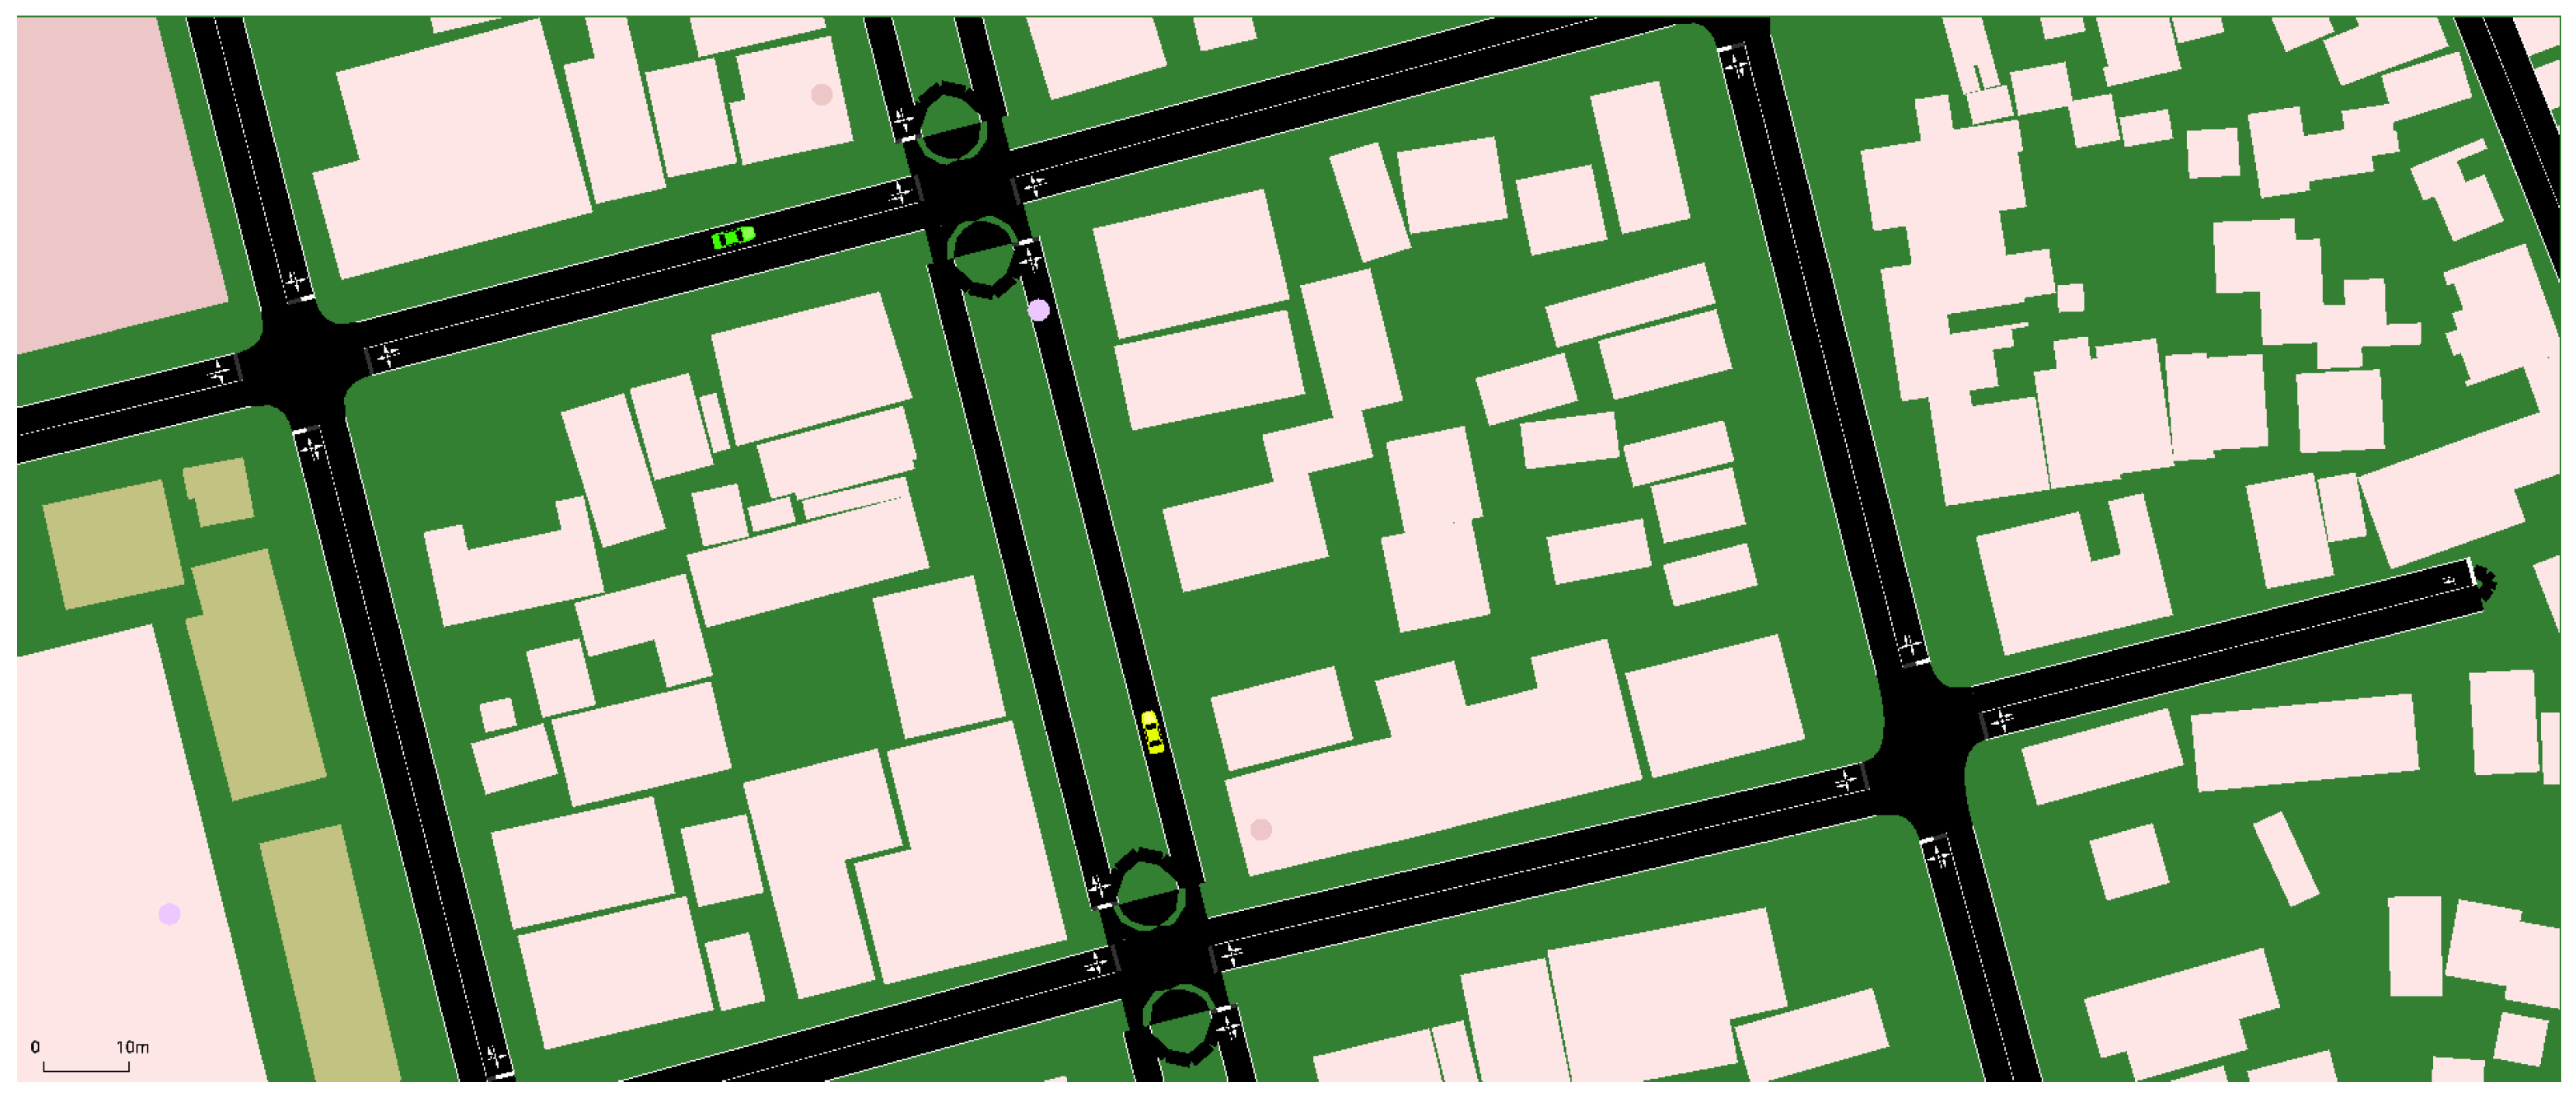
The map is composed of a structure of segments and nodes, which represent roads and their intersections, respectively. To customize the study area and make specific adjustments, it is necessary to use an additional tool called NETEDIT, which is integrated into the SUMO software. This tool allows for the graphical modification, editing, and optimization of the traffic network, facilitating the adaptation of the model to the specific needs of the analysis (see
Figure 6).
Examination of the nodal distribution across the various avenues indicates that certain nodes are common to multiple road segments, thus revealing the presence of key intersections or connectivity within the road network topology. For example, node 1143931858 is shared between the Espejo and Olmedo Avenue segments. Similarly, node 1143925281 connects the Olmedo and Pichincha Avenue segments, while node 1143927931 is located at the intersection of the Pichincha and Maldonado Avenue segments, further substantiating the identification of critical intersection points.
Conversely, avenues exhibiting a higher nodal count, such as Maldonado, which comprises three nodes, may correspond to longer road segments or areas with a higher concentration of points of interest within the network topology. Furthermore, the shared presence of certain nodes across different avenues may serve as an indicator of their significance in traffic flow analysis, as these areas may coincide with regions of increased congestion or strategic points within the road network (see
Table 4).
To define the routes, modifications were made to the osm.passenger.trips.xml file. This file contains the specifications necessary to simulate vehicle trajectories in the virtual environment. However, to ensure that the simulation accurately reflects real-world traffic conditions, it is essential to analyze the characteristics of the main streets beforehand, especially those with higher traffic intensity.
In the input section, the files that will be used in the simulation are defined. The net-file (osm.net.xml) represents the road network, that is, the map of roads on which the vehicles will travel. The route-files (osm.passenger.trips.xml) file contains the vehicle demand, specifying the routes to follow during the simulation. Finally, the additional-files (osm.poly.xml) file provides additional information, such as polygons to represent buildings, areas, or visual elements in the simulated environment.
As regards processing, the ignore-route-errors parameter is set to true, which allows the simulation to continue running even if there are errors in the routes. This is useful to avoid interruptions caused by minor problems in the definition of paths.
In routing, two key parameters are configured. The first, device.rerouting.adaptation-steps, with a value of 18, defines the number of adaptation steps allowed for the rerouting of vehicles, which facilitates the simulation of dynamic changes in routes due to congestion or other factors. The second, device.rerouting.adaptation-interval, with a value of 10, establishes the time interval (in simulation seconds) in which it will be verified if a vehicle needs to modify its route.
Regarding the graphical interface, the gui-settings-file (osm.view.xml) file contains specific configurations for visualization in SUMO, including road colors, vehicle representation, labels, and other graphical elements (see
Table 5).
This simulation scenario faithfully reproduces real-world urban conditions, allowing for the comprehensive evaluation of routing algorithms and vehicular communication protocols designed specifically to optimize traffic flow and minimize congestion in complex urban environments. Through detailed and highly accurate simulations, this study seeks to analyze the effectiveness of Vehicular Ad Hoc Networks (VANETs) in generating alternative routes in real time, significantly reducing travel times, and improving road safety.
VANETs, by facilitating communication between vehicles and road infrastructure, enable collaborative decision making based on up-to-date data, such as traffic status, weather conditions, and unforeseen events on the road. This approach not only contributes to traffic optimization but also promotes smarter and more sustainable mobility. Furthermore, this study evaluates the ability of these systems to dynamically adapt to changes in network conditions, such as vehicle density or the appearance of bottlenecks, thus ensuring an efficient and robust response to critical situations.
The selection of this specific road segment provides a solid foundation for future research in vehicular networks and intelligent urban traffic management. By simulating vehicle behavior in this controlled environment, empirical data can be obtained to validate theoretical models and compare the performances of different mobility strategies (see
Table 6).
The simulation conducted in the context of Vehicular Ad Hoc Networks (VANETs) provided realistic results by considering a variety of traffic scenarios. Evaluated factors included vehicle density, vehicle movement patterns, and specific traffic conditions, allowing for modeling representative scenarios of real-world vehicular network behavior. These scenarios enabled the assessment of network performance under diverse circumstances, providing valuable insights into its performance in terms of metrics such as latency, packet loss, and throughput (see
Table 7).
The analysis of the overall average speed indicates that vehicles travel at an average speed of 21 km/h. Furthermore, the distance between the Pontifical Catholic University of Ecuador, Esmeraldas Campus (PUCESE), and the Multiplaza Shopping Center has been determined to be approximately 1.5 km.
To calculate the time required to cover this distance at the average speed, the following formula is used:
In this case, substituting the values yields the following:
This value is then converted from hours to minutes using the following operation:
Therefore, the estimated travel time between PUCESE and the Multiplaza Shopping Center, considering an average speed of 21.9 km/h, is approximately 4.08 min.
A key aspect of this analysis is that the accuracy and applicability of the obtained results are directly influenced by the mathematical models and algorithms employed in the simulation. The defined assumptions and specific configurations used in setting up the simulator play a decisive role in the outcomes. For example, parameters such as the mobility model, the communication protocol used, or the representation of environmental interferences can have a significant impact on the obtained performance metrics.
4.3. Congestion Prediction
Figure 8 shows the class distribution before and after applying SMOTE (Synthetic Minority Over-sampling Technique). In the first distribution, before applying SMOTE, a strong imbalance between classes is observed. The “No Congestion” class (in blue) has a significantly larger number of samples compared with the “Congestion” class (in red), which has very few observations.
After applying SMOTE, both classes have virtually the same number of samples. The minority class (“Congestion”) has been oversampled to match the quantity of the majority class (“No Congestion”). This balance reduces the bias towards the majority class and improves the generalization ability of machine learning models.
The use of SMOTE has allowed for balancing the class distribution in the dataset, which is fundamental to optimizing the performance of predictive models in imbalanced classification problems. Now, the models will be able to identify both classes more equitably.
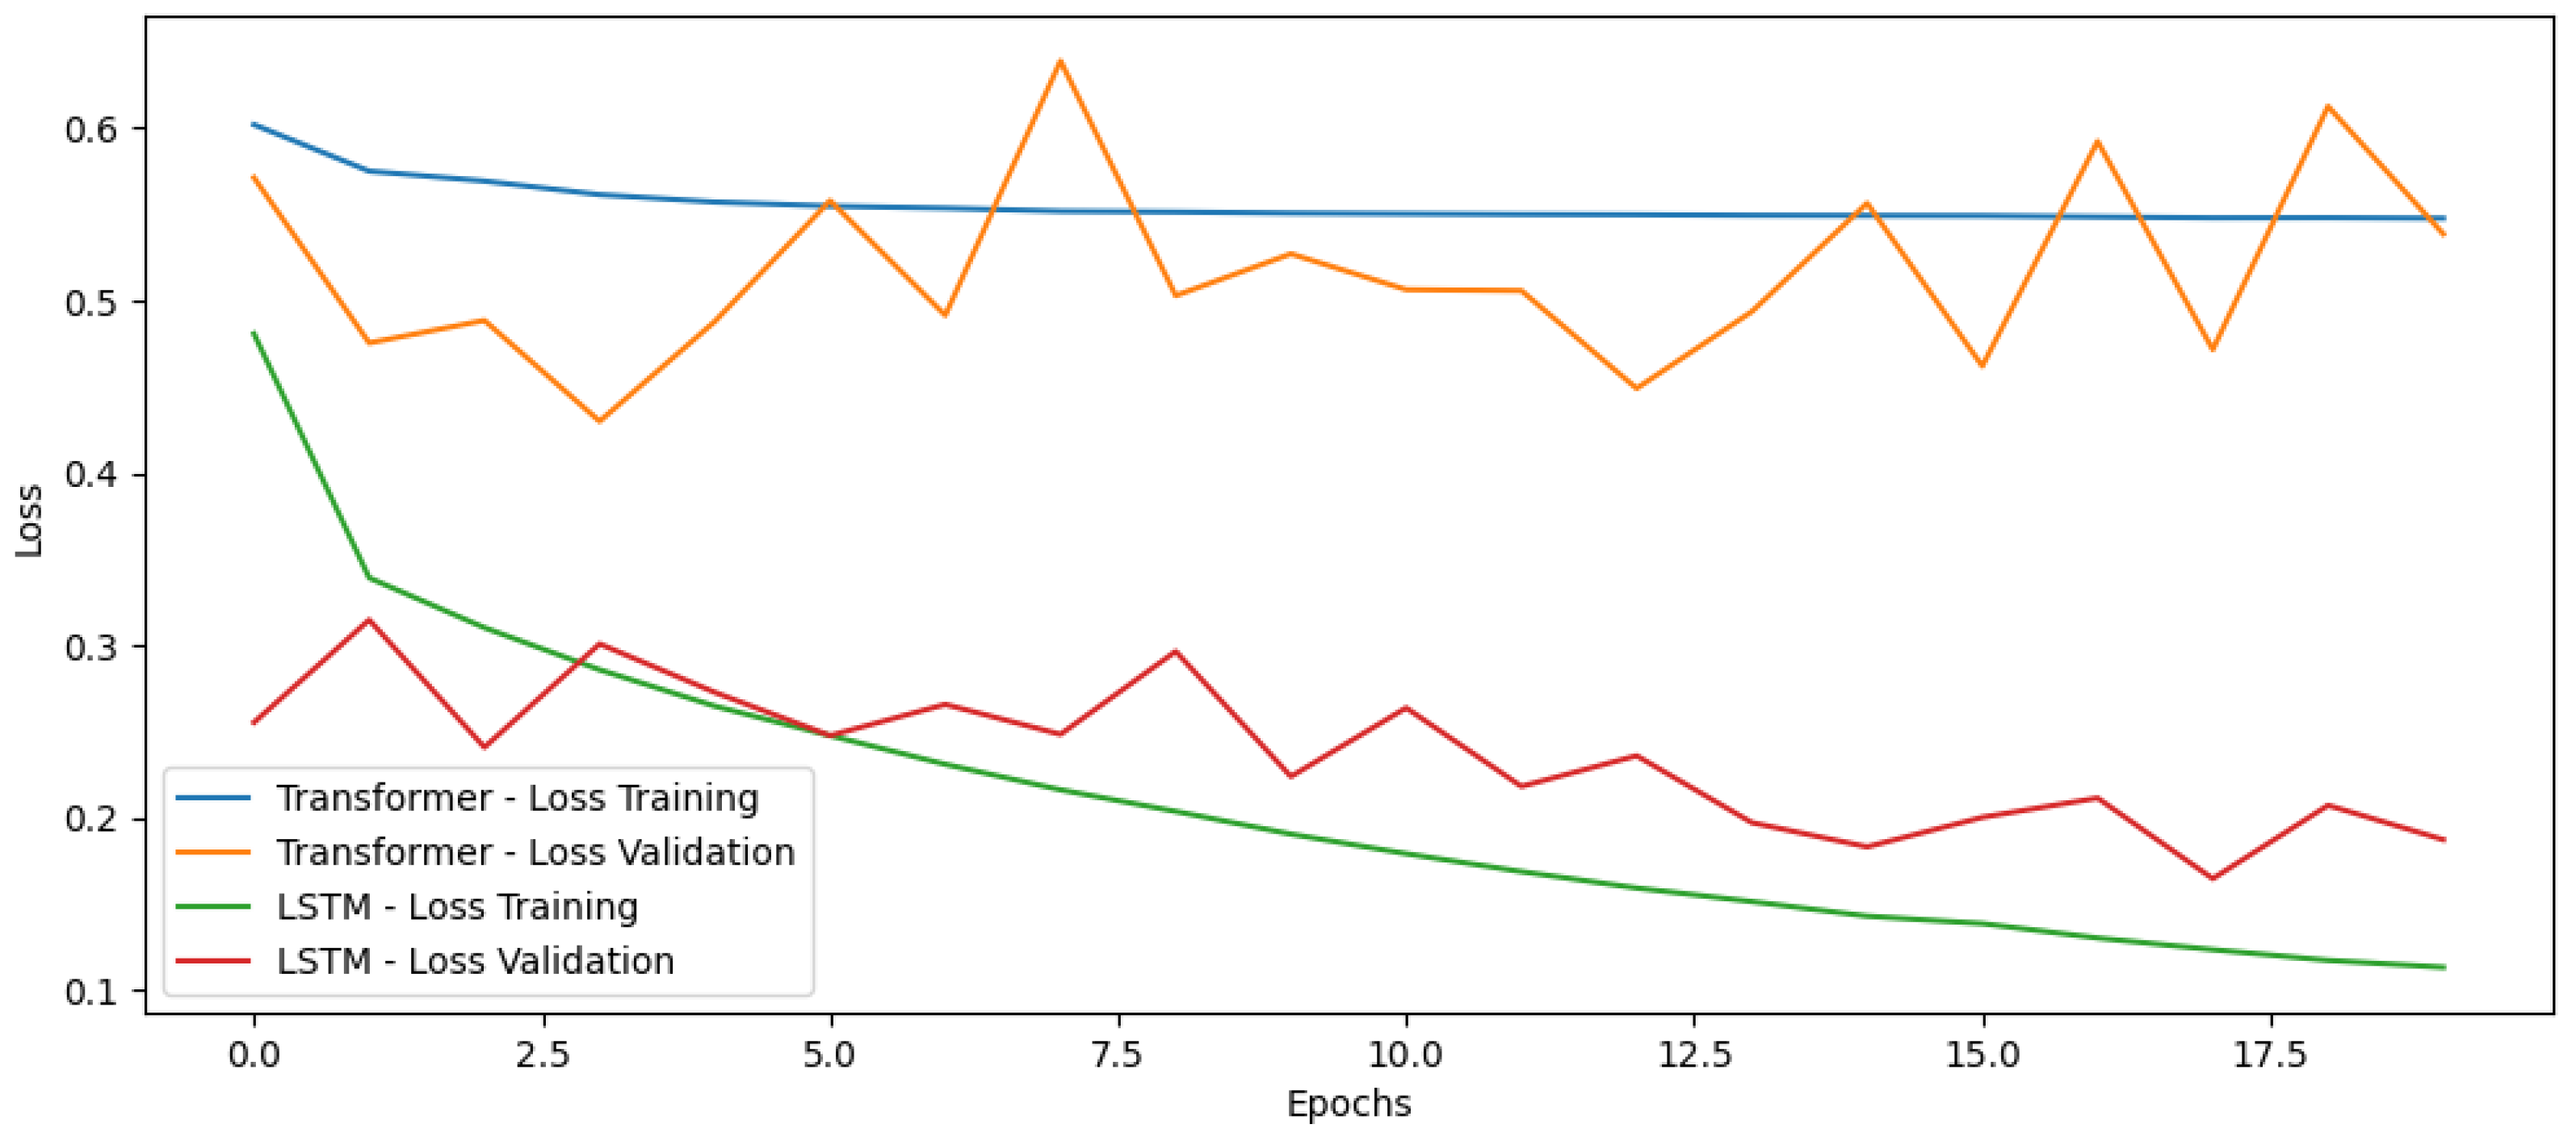
In the Transformer model, the training loss progressively decreases, but its descent slows down after a few epochs. The validation loss shows a more unstable trend, with fluctuations and an increase in the last epochs, which could indicate overfitting problems. In the LSTM model, the training loss decreases steadily throughout the epochs, indicating good convergence. The validation loss shows variations, but, in general, maintains a decreasing trend, although with some instability. The LSTM model shows greater stability in the reduction of loss in both training and validation, which suggests a better fit to the problem. In contrast, the Transformer model shows signs of overfitting, since the validation loss does not follow the same decreasing trend as the training loss (see
Figure 9).
Table 9 shows the evolution of training and validation losses for Transformer and LSTM models across 20 epochs. In the case of the Transformer model, the training loss remained relatively stable, decreasing slightly from 0.60 in epoch 1 to 0.54 in epoch 20. On the other hand, the validation loss fluctuated between 0.39 and 0.60, showing no clear trend of improvement, which suggests possible overfitting or instability in generalization. In contrast, the LSTM model presented a consistent decrease in training loss, from 0.47 in epoch 1 to 0.12 in epoch 20, indicating effective learning. Furthermore, the validation loss also showed a decreasing trend, albeit with some fluctuations, varying between 0.13 and 0.32, which suggests a better generalization capacity compared with the Transformer.
In general terms, the LSTM model demonstrated better performance in reducing losses in both training and validation, with a more pronounced and stable decrease. Meanwhile, the Transformer model, although showing a slight improvement in training loss, presented greater fluctuations in validation loss, which could indicate difficulties in generalizing. In conclusion, the LSTM exhibited a more stable and consistent behavior across epochs, while the Transformer showed some instability in validation, suggesting that LSTM might be more suitable for this specific task.
In the case of the Transformer model, the training accuracy remained relatively stable, with an initial value of 0.69 in epoch 1 and reaching 0.74 from epoch 4 onwards, where it stabilized. However, the validation accuracy fluctuated between 0.67 and 0.85, showing no clear trend of improvement, which suggests some instability in generalization. On the other hand, the LSTM model showed a consistent increase in training accuracy, starting at 0.76 in epoch 1 and reaching 0.95 in epoch 20, indicating effective learning. Furthermore, the validation accuracy also showed a high and stable performance, varying between 0.90 and 0.97, with a general trend towards improvement.
In general terms, the LSTM model demonstrated superior performance in terms of accuracy, in both training and validation, with a consistent improvement and higher values compared with the Transformer. Meanwhile, the Transformer model, although maintaining stable training accuracy, presented significant fluctuations in validation accuracy, which could indicate difficulties in generalizing. In conclusion, the LSTM showed more consistent and effective behavior in terms of accuracy, in both training and validation, while the Transformer showed some instability in validation, suggesting that the LSTM might be more suitable for this specific task (see
Table 10).
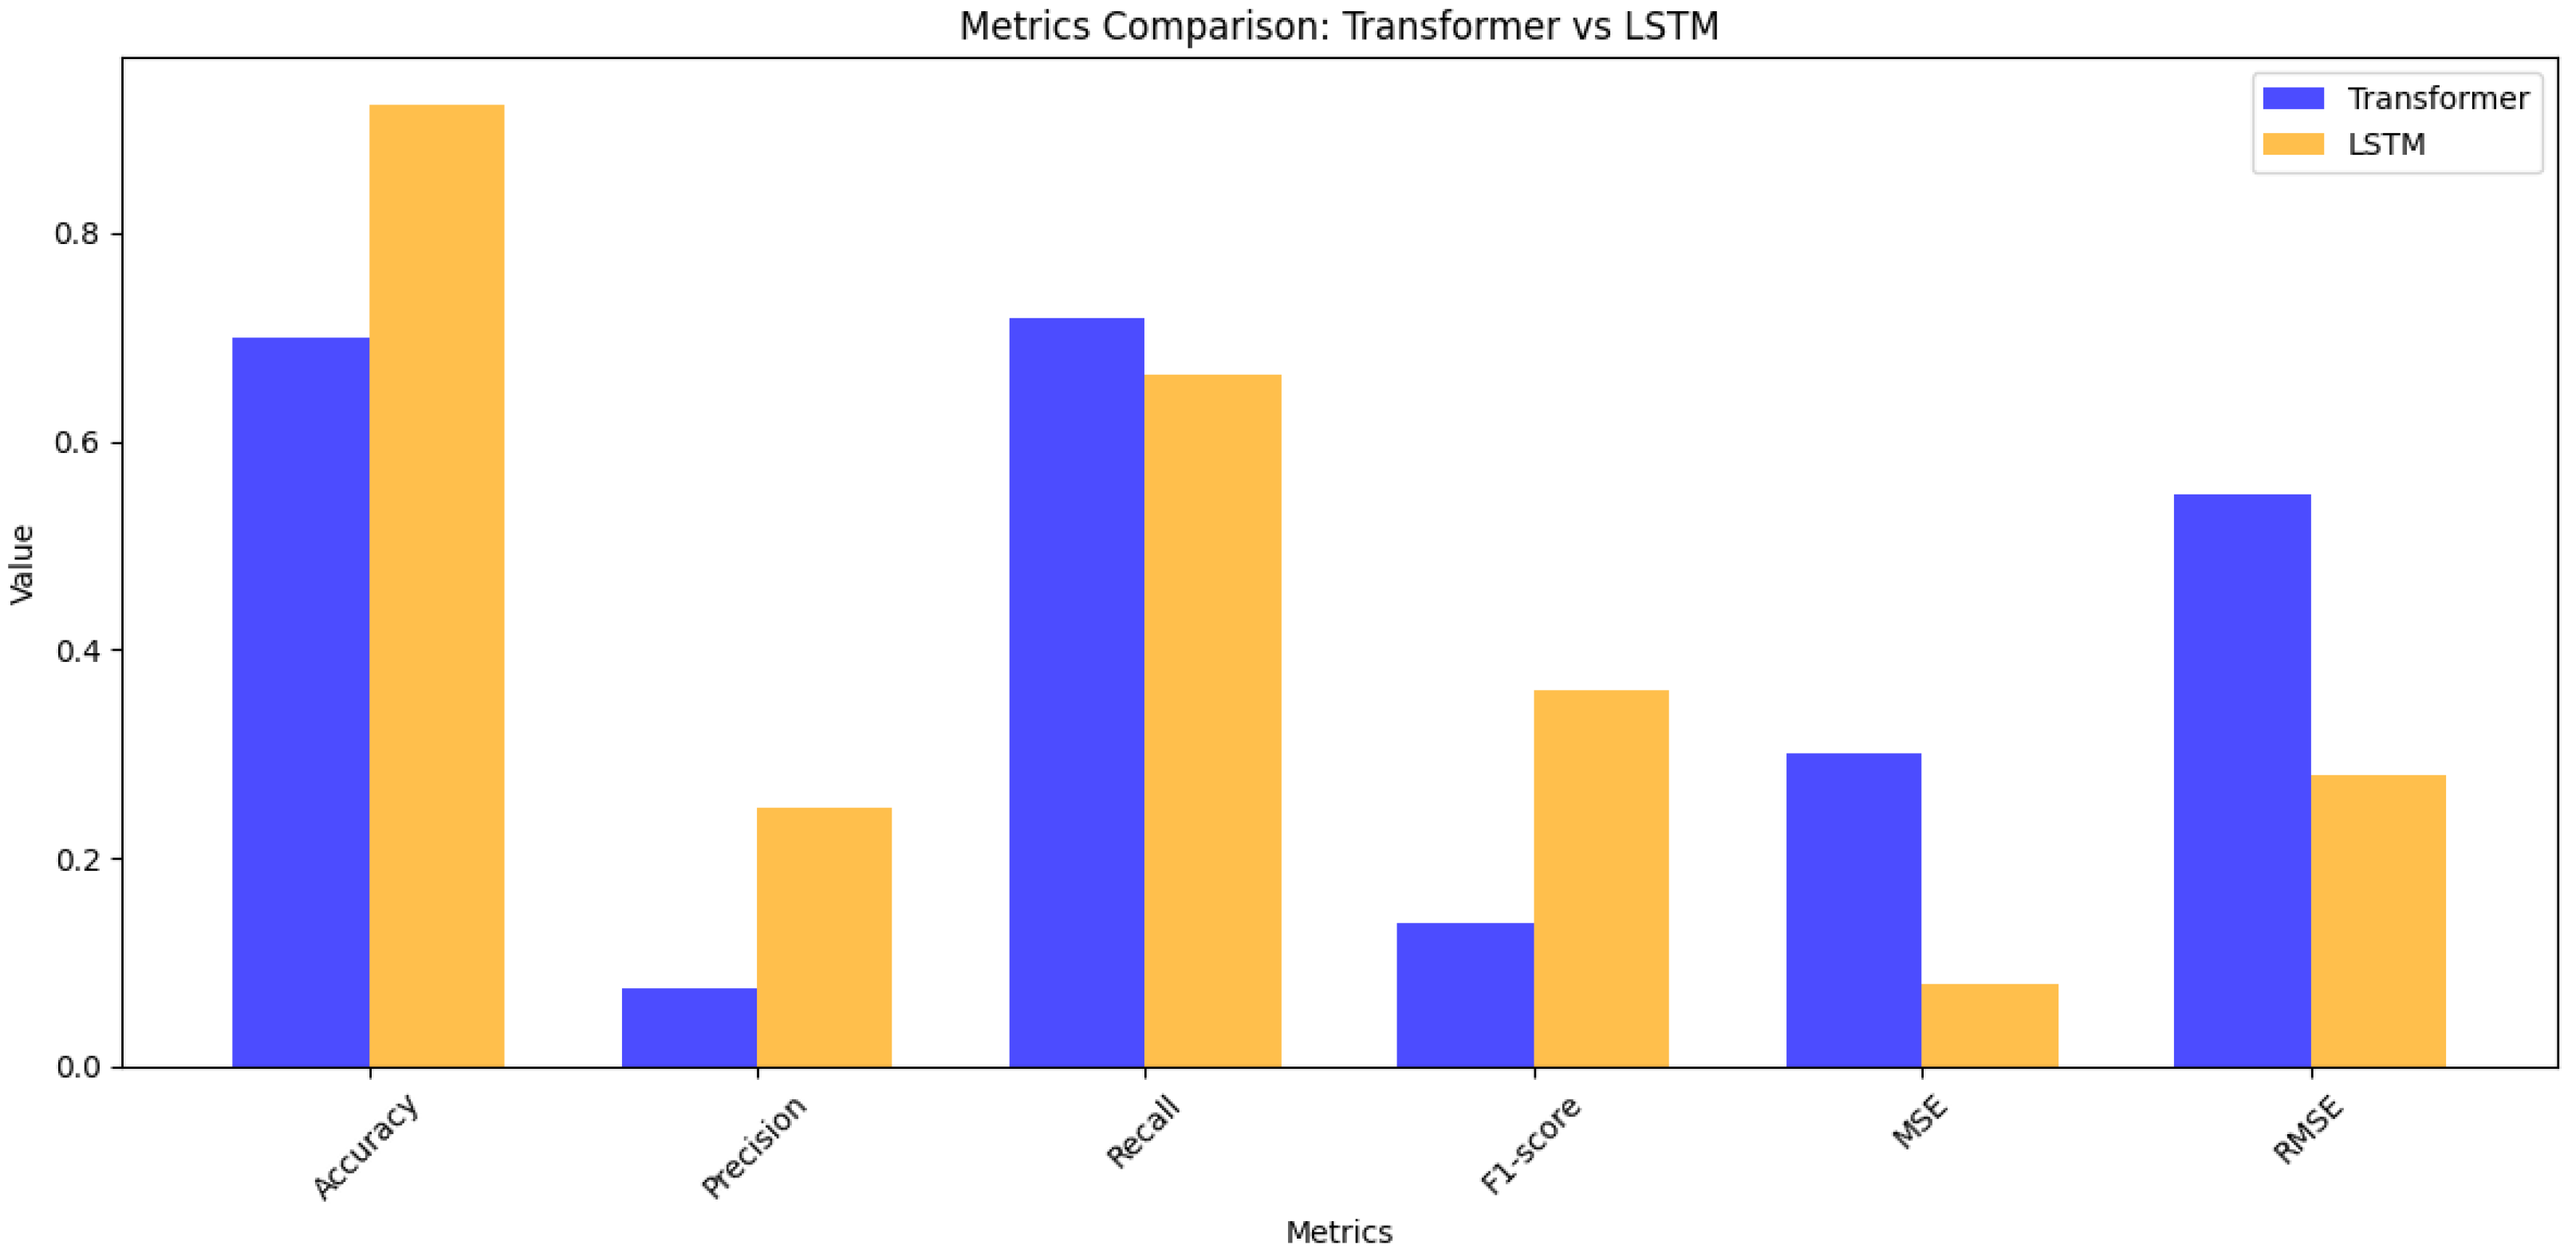
In the case of the Transformer model, the loss was 0.48, which indicates a moderate error in the predictions. Additionally, the accuracy reached a value of 0.79, showing acceptable performance in classification. However, the precision was 0.10, which suggests a low ability to correctly identify positive cases. On the other hand, the recall was 0.65, indicating a moderate ability to detect positive cases, while the F1-score was 0.17, reflecting a poor balance between precision and recall. Finally, the MSE and RMSE were 0.21 and 0.46, respectively, showing a relatively high mean squared error.
In contrast, the LSTM model presented a loss of 0.21, which indicates a significantly lower error compared with the Transformer. The accuracy was 0.93, demonstrating excellent performance in classification. Likewise, the precision improved to 0.29, which reflects a greater ability to correctly identify positive cases. The recall was 0.71, showing a greater ability to detect positive cases, and the F1-score was 0.42, reflecting a better balance between precision and recall. Furthermore, the MSE and RMSE were 0.07 and 0.26, respectively, indicating a much lower mean squared error (see
Table 11).
In the comparison of accuracy, the LSTM model shows significantly higher accuracy compared with the Transformer. While the accuracy of the LSTM approaches 0.8, that of the Transformer is notably lower, indicating inferior performance in this metric. Furthermore, in the comparison of the pseudo metric, the LSTM also outperforms the Transformer, presenting higher and more consistent values, which reinforces its effectiveness in the evaluated task.
Regarding the mean squared error (MSE), the LSTM has a lower MSE than the Transformer, indicating a smaller error in predictions. Conversely, the Transformer shows a higher MSE, suggesting inferior performance in terms of predictive accuracy. Finally, in all compared metrics (accuracy, pseudo, and MSE), the LSTM model outperforms the Transformer, demonstrating superior performance in the prediction task. This general trend confirms that LSTM is a more suitable and effective option for this type of application (see
Figure 10).
