Abstract
The purpose of this study lies in developing a comparison of neural network-based models for vehicular congestion prediction, with the aim of improving urban mobility and mitigating the negative effects associated with traffic, such as accidents and congestion. This research focuses on evaluating the effectiveness of different neural network architectures, specifically Transformer and LSTM, in order to achieve accurate and reliable predictions of vehicular congestion. To carry out this research, a rigorous methodology was employed that included a systematic literature review based on the PRISMA methodology, which allowed for the identification and synthesis of the most relevant advances in the field. Likewise, the Design Science Research (DSR) methodology was applied to guide the development and validation of the models, and the CRISP-DM (Cross-Industry Standard Process for Data Mining) methodology was used to structure the process, from understanding the problem to implementing the solutions. The dataset used in this study included key variables related to traffic, such as vehicle speed, vehicular flow, and weather conditions. These variables were processed and normalized to train and evaluate various neural network architectures, highlighting LSTM and Transformer networks. The results obtained demonstrated that the LSTM-based model outperformed the Transformer model in the task of congestion prediction. Specifically, the LSTM model achieved an accuracy of 0.9463, with additional metrics such as a loss of 0.21, an accuracy of 0.93, a precision of 0.29, a recall of 0.71, an F1-score of 0.42, an MSE of 0.07, and an RMSE of 0.26. In conclusion, this study demonstrates that the LSTM-based model is highly effective for predicting vehicular congestion, surpassing other architectures such as Transformer. The integration of this model into a simulation environment showed that real-time traffic information can significantly improve urban mobility management. These findings support the utility of neural network architectures in sustainable urban planning and intelligent traffic management, opening new perspectives for future research in this field.
1. Introduction
Vehicular congestion represents a growing challenge for cities worldwide, driven by accelerated urbanization and motorization. This phenomenon negatively affects urban mobility, generating significant impacts on the quality of life of citizens, the local economy, and the environment. Prolonged delays in travel times, stress, exposure to high levels of air pollution, and increased costs associated with excessive fuel consumption are some of the most evident consequences. Furthermore, traffic emissions contribute to climate change, exacerbating global environmental problems [1]. In Ecuador, cities like Esmeraldas face this problem acutely due to the sustained increase in vehicle fleet, limited road infrastructure, and, in some cases, complex topography [2]. However, despite the evident consequences of vehicular congestion, traditional approaches to addressing this issue have been largely reactive and insufficient. Many cities, especially in developing regions like Ecuador, lack the infrastructure and technological tools to effectively manage traffic, leading to worsening conditions over time. To address these challenges, it is essential to adopt proactive and technology-driven solutions. Implementing Intelligent Transportation Systems (ITSs) and leveraging data-driven approaches can help anticipate and mitigate congestion, improving urban mobility and reducing environmental impacts.
This study is framed within the development of Intelligent Transportation Systems (ITSs) and Vehicular Ad Hoc Networks (VANETs), which enable communication between vehicles and roadside stations to generate real-time data-driven solutions. These technologies facilitate the monitoring and optimization of vehicular mobility, providing strategic information for decision making. Additionally, recognized neural networks are used to predict time series or sequential data [3]. Nevertheless, while ITS and VANETs offer promising solutions, their implementation is often hindered by technical and logistical challenges. For instance, the integration of these systems into existing infrastructure can be complex, and the accuracy of predictive models depends heavily on the quality and quantity of data available. To overcome these challenges, it is crucial to develop robust neural network architectures, such as LSTM and Transformers, that can effectively process and analyze large datasets. Additionally, collaboration between governments, researchers, and private sectors can facilitate the deployment of these technologies in urban environments.
The relevance of this research lies in the urgent need for technological tools that allow authorities to anticipate and manage vehicular congestion in cities with specific challenges, such as Esmeraldas. The lack of predictive tools hinders traffic planning and optimization, which affects both the quality of life of citizens and environmental sustainability. This study seeks to contribute to the development of innovative solutions that integrate neural network architectures such as Long Short-Term Memory (LSTM) and Transformers in vehicular networks, offering a foundation for more efficient and sustainable traffic management [4]. However, although neural networks like LSTM and Transformers have shown promise in traffic prediction, their application in real-world scenarios is still limited by challenges such as data scarcity, computational complexity, and the need for continuous model training. To address these limitations, this research proposes the use of advanced data preprocessing techniques, such as SMOTE for class balancing, and walk-forward validation to ensure the models’ adaptability to real-time data. These approaches can enhance the accuracy and reliability of congestion prediction models.
The objectives of this research include analyzing the current state of vehicular mobility in critical urban areas like Esmeraldas, then developing a predictive model of vehicular congestion based on historical data and neural networks, and finally evaluating the accuracy and performance of the model using metrics such as loss, accuracy, precision, recall, F1-score, MSE, and RMSE. However, while these objectives are comprehensive, achieving them requires access to high-quality data and computational resources, which may not always be available in resource-constrained settings like Esmeraldas. To ensure the feasibility of the research, partnerships with local authorities and organizations can be established to access relevant traffic data. Additionally, cloud-based computing resources can be utilized to handle the computational demands of training neural networks.
Previous studies in Latin America have demonstrated the potential of vehicular networks and predictive algorithms in traffic management. For example, in Quito, Ecuador, a Vehicular Ad Hoc Network was simulated in the historic center, achieving significant improvements in vehicular mobility [5]. Similarly, in Ambato, traffic data have highlighted the urgent need for predictive tools to optimize road connectivity, especially in areas with high vehicular density [6]. Finally, in Esmeraldas, a vehicular congestion study has already been conducted using simulators like SUMO, which is of vital importance as it serves as a basis for applying neural networks in vehicular prediction. Despite these advancements, the scalability and generalizability of these studies remain limited. Many solutions are tailored to specific contexts and may not be directly applicable to other cities with different traffic patterns and infrastructure. To address this, future research should focus on developing adaptable models that can be customized to different urban environments. Sharing best practices and datasets across regions can also facilitate the broader adoption of these technologies.
The theoretical framework of this research is based on the use of Vehicular Ad Hoc Networks (VANETs) and neural network architectures such as recurrent neural networks and Transformers to identify complex patterns in large datasets [7]. Additionally, probability and statistics theory are fundamental for the development of predictive models [8]. The comparison of these architectures will provide us with the best model for congestion prediction. However, while these theoretical foundations are robust, the practical implementation of these models requires careful consideration of factors such as data quality, computational efficiency, and real-time performance. To ensure practical applicability, this research will employ rigorous testing and validation processes, including simulations using tools like SUMO and real-world data from Esmeraldas. This approach will help identify the most effective model for real-time congestion prediction.
This research is carried out in the context of medium-sized cities in Ecuador, such as Esmeraldas, where vehicular congestion represents a critical challenge for urban mobility. These cities present particular characteristics, such as a challenging topography and limited road infrastructure, which exacerbate traffic problems and highlight the need to adopt technological solutions to improve their management [9]. However, the unique challenges of medium-sized cities, such as limited resources and infrastructure, make it difficult to implement advanced technological solutions. Additionally, there may be resistance to adopting new technologies due to a lack of awareness or technical expertise. To overcome these barriers, it is essential to engage local stakeholders and provide training programs to build technical capacity. Furthermore, pilot projects can demonstrate the benefits of these technologies, encouraging broader adoption.
The research question to be tested will be, which machine learning model is most effective, between Transformer and LSTM, for predicting real-time vehicular congestion, considering evaluation metrics such as precision, recall, F1-score, and mean squared error (MSE)? This research question focuses on comparing the performances of two neural network architectures (Transformer and LSTM) in the task of vehicular congestion prediction, using a dataset that includes variables such as vehicle speed, time of day, day of the week, and weather conditions. Additionally, it seeks to evaluate how class balancing using SMOTE and walk-forward validation influence the predictive capacity of the models. However, while this research question is well defined, its success depends on the availability of comprehensive and high-quality datasets, as well as the ability to accurately simulate real-world traffic conditions. To address these challenges, this research will leverage existing datasets from Esmeraldas and employ advanced simulation tools like SUMO to create realistic traffic scenarios. Additionally, the use of SMOTE and walk-forward validation will ensure that the models are robust and adaptable to changing conditions.
2. Background
Accelerated urbanization and the growth of motorization worldwide have significantly intensified vehicular congestion in urban areas [10]. This phenomenon not only affects the quality of life of citizens by prolonging travel times and generating higher levels of stress, but also has economic and environmental repercussions, such as increased fuel consumption, air pollution, and loss of productivity [11]. However, although the negative impact of vehicular congestion is widely recognized, traditional solutions have been insufficient to address this problem comprehensively. Current strategies tend to be reactive rather than proactive, which limits their effectiveness in mitigating long-term effects. Therefore, it is necessary to implement innovative approaches that combine advanced technologies, such as predictive analytics and artificial intelligence, to anticipate and manage congestion more efficiently. This would not only reduce travel times but also minimize associated environmental and economic impacts.
Traditional traffic management strategies, based on fixed infrastructures such as traffic lights and centralized control systems, have significant limitations in their ability to adapt to the changing dynamics of traffic [12]. These systems are often rigid and cannot respond in real time to traffic fluctuations, resulting in inefficient management and increased congestion during peak hours. Furthermore, their dependence on physical infrastructures makes them costly and difficult to scale. In this context, the implementation of technologies such as Vehicular Ad Hoc Networks (VANETs) offers a more flexible and dynamic alternative. These networks enable wireless communication between vehicles, facilitating the real-time exchange of data related to location, speed, and traffic conditions [13].
Analyzing VANET data to predict vehicular congestion represents a significant advancement. This approach allows for the identification of real-time traffic patterns and the anticipation of traffic jams, facilitating the application of proactive measures such as traffic light optimization, demand management, and traffic redirection [14]. However, VANETs face several challenges, such as the need for more robust and accurate prediction algorithms, efficient management of large data volumes, and the protection of privacy and security of transmitted information [15]. To overcome these challenges, it is essential to develop advanced predictive models, such as neural networks, that can process large amounts of data and generate accurate predictions. Additionally, robust security protocols must be implemented to ensure data protection.
This research addresses these challenges by developing a predictive model based on neural network architectures, which uses VANET data and meteorological data to anticipate vehicular congestion at urban intersections. This study focuses on a critical intersection in the city of Esmeraldas, Ecuador, where traffic data were collected during peak hours through ESVIAL EP and ECU 911. Although the use of neural networks represents a significant advancement, its implementation in real-world environments still faces challenges, such as the need for high-quality data and integration with existing systems. To ensure the success of the model, it is essential to conduct exhaustive simulations using tools like SUMO [16] and validate the results in real scenarios. Additionally, neural network architectures such as LSTM and Transformer [17], which have proven effective in time series prediction, should be considered.
The developed model seeks to contribute to a more efficient and sustainable traffic management, responding to the urgent need for advanced technological solutions that mitigate the negative effects of vehicular congestion in Ecuadorian cities and in similar contexts in other regions. However, despite their potential, the adoption of these technologies may be limited by factors such as lack of technological infrastructure, resistance to change, and associated costs. To overcome these barriers, it is crucial to foster collaboration between governments, academic institutions, and the private sector. Additionally, training programs should be implemented to ensure that local professionals can operate and maintain these technologies effectively. In this way, the impact of the proposed solutions can be maximized, and progress towards smarter and more sustainable urban mobility can be made.
3. Materials and Methods
This project was structured under a predictive research approach, with the main objective of identifying the most effective machine learning algorithms for predicting vehicular congestion in complex urban environments [18]. In this context, LSTM and Transformer neural networks were highlighted, which play a fundamental role in the analysis of time series or sequential data. These approaches allow for leveraging the individual strengths of each model; mitigating their weaknesses; and, consequently, optimizing the overall performance of the prediction system.
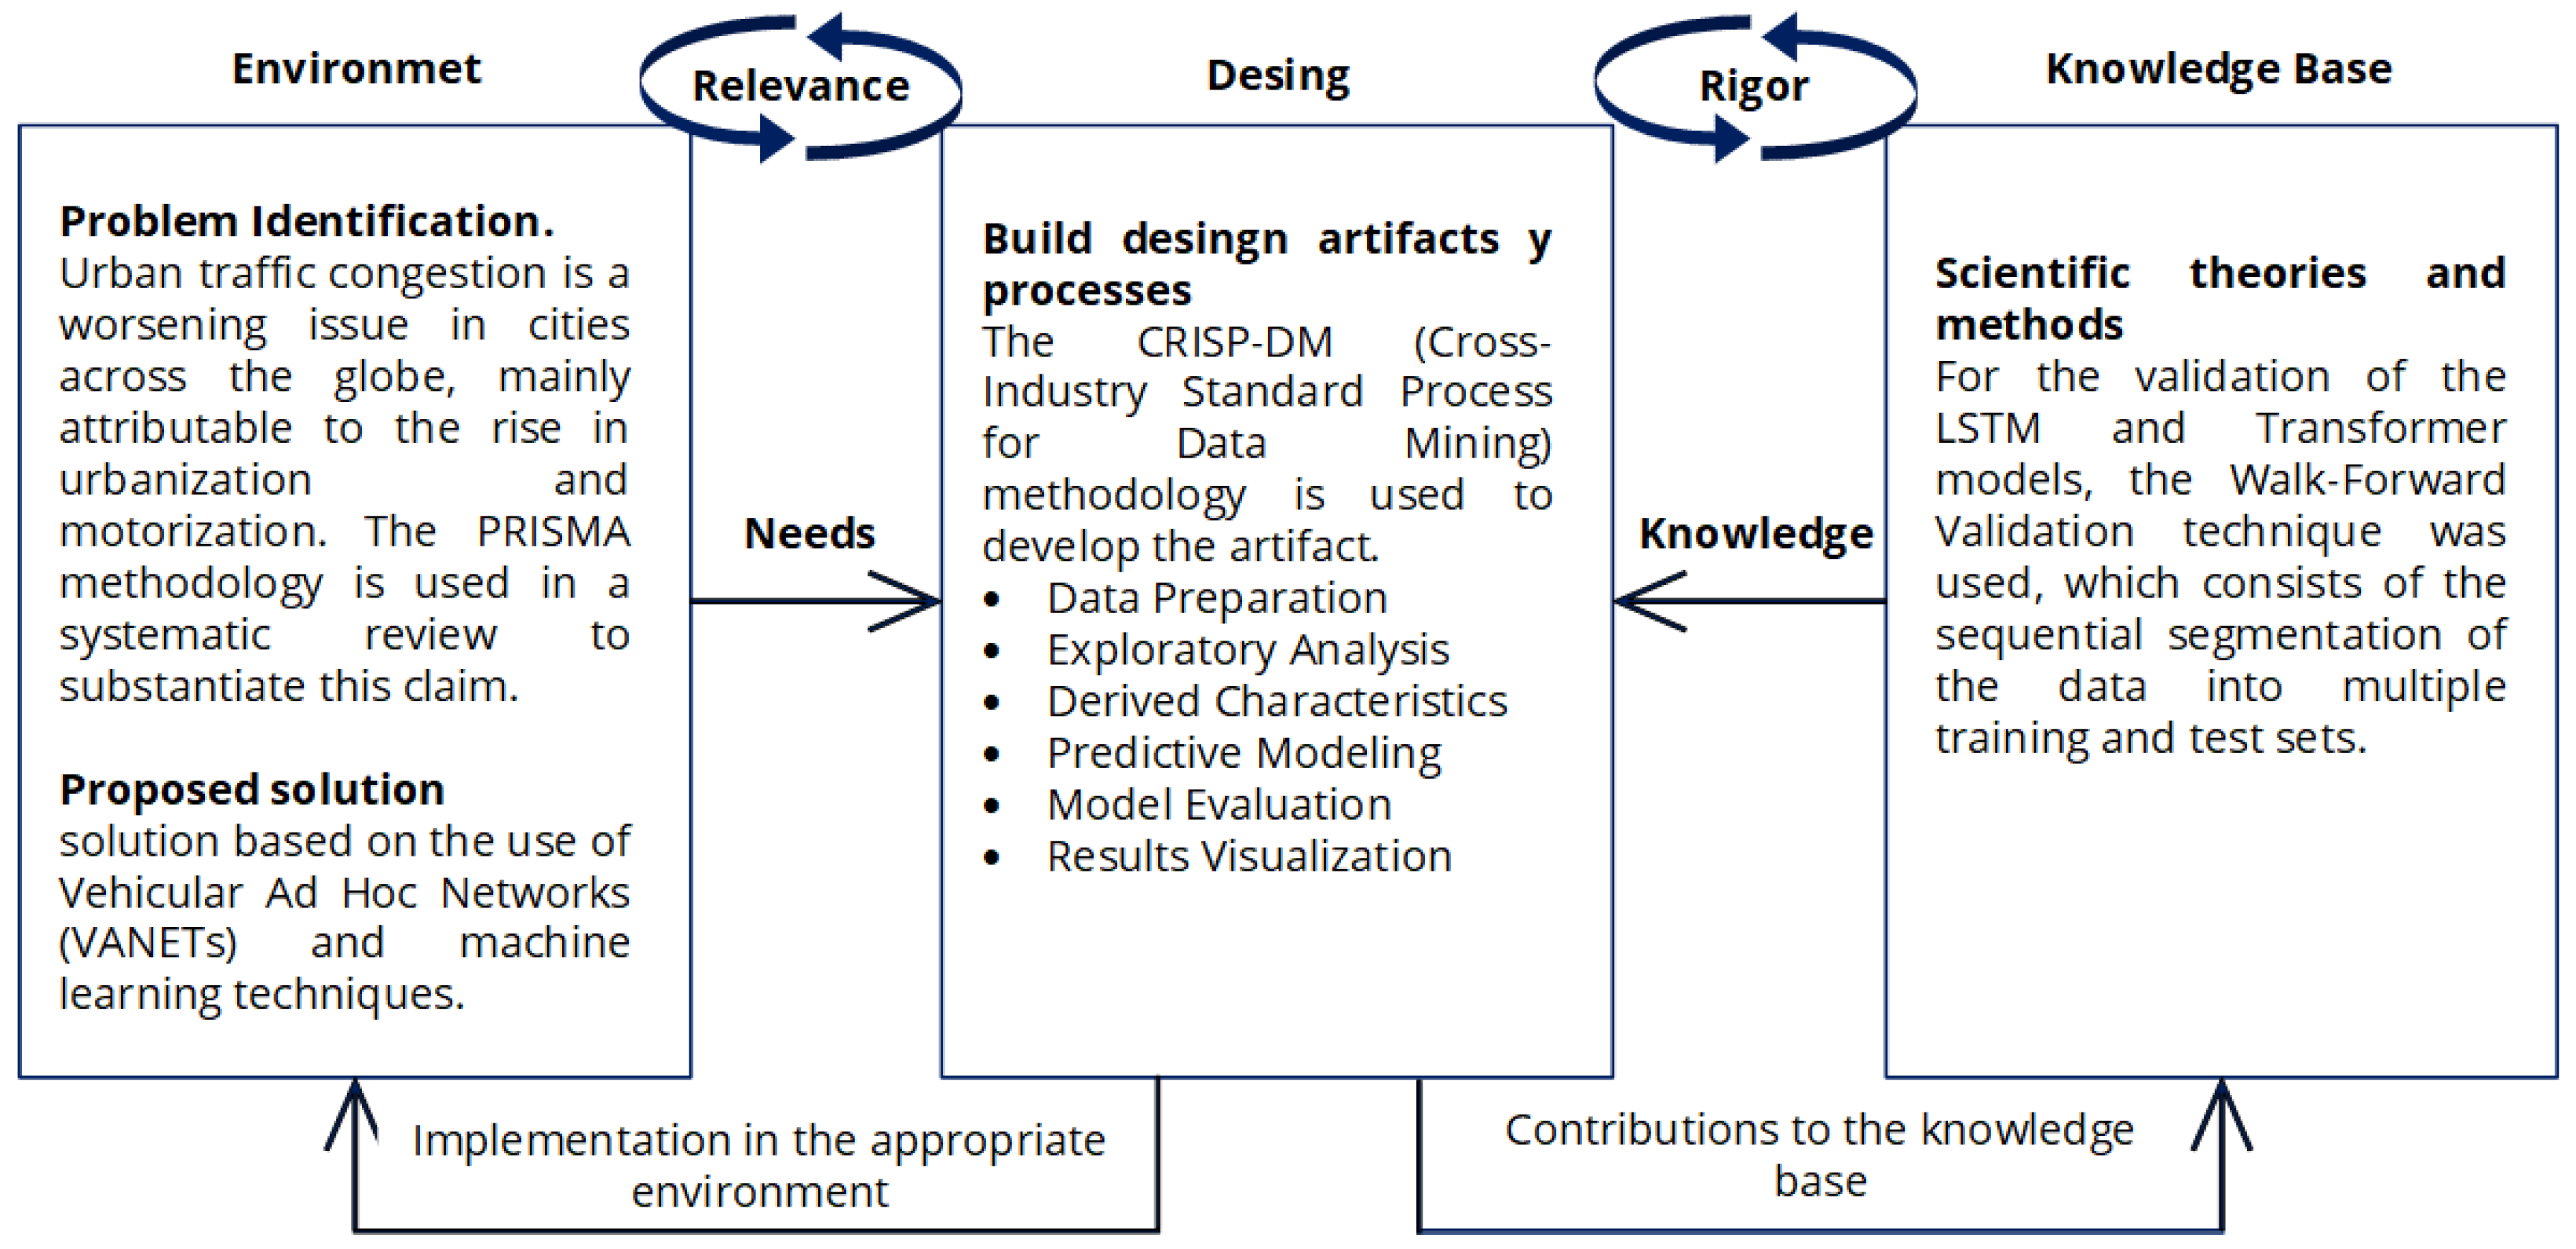
Furthermore, this study is based on the Design Science Research (DSR) methodology, a framework composed of three main phases: relevance, design, and rigor. First, the relevance phase involves identifying the problem to be addressed and defining the application context of the solution, focusing on ensuring a significant impact [19]. Subsequently, the design phase focuses on creating innovative solutions by developing prototypes or models that directly meet the identified needs. Finally, the rigor phase focuses on validating the proposed solutions, ensuring their theoretical and practical robustness through scientific methods and exhaustive evaluations. This methodology facilitates a systematic process for developing useful and applicable artifacts in real-world environments, as illustrated in Figure 1.
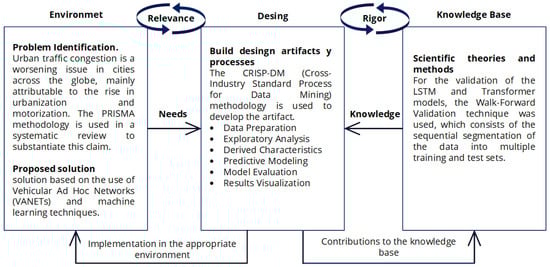
Figure 1.
Design Science Research (DSR) methodology applied to the development of a VANET-based vehicular congestion prediction system.
3.1. Relevance Cycle
In a first phase, a predictive model was developed based on neural network methodologies, which are widely recognized for their ability to improve predictive performance in time series. This approach was complemented with advanced statistical techniques, such as SMOTE (Synthetic Minority Over-sampling Technique), to address imbalances in the datasets and optimize model accuracy [20].
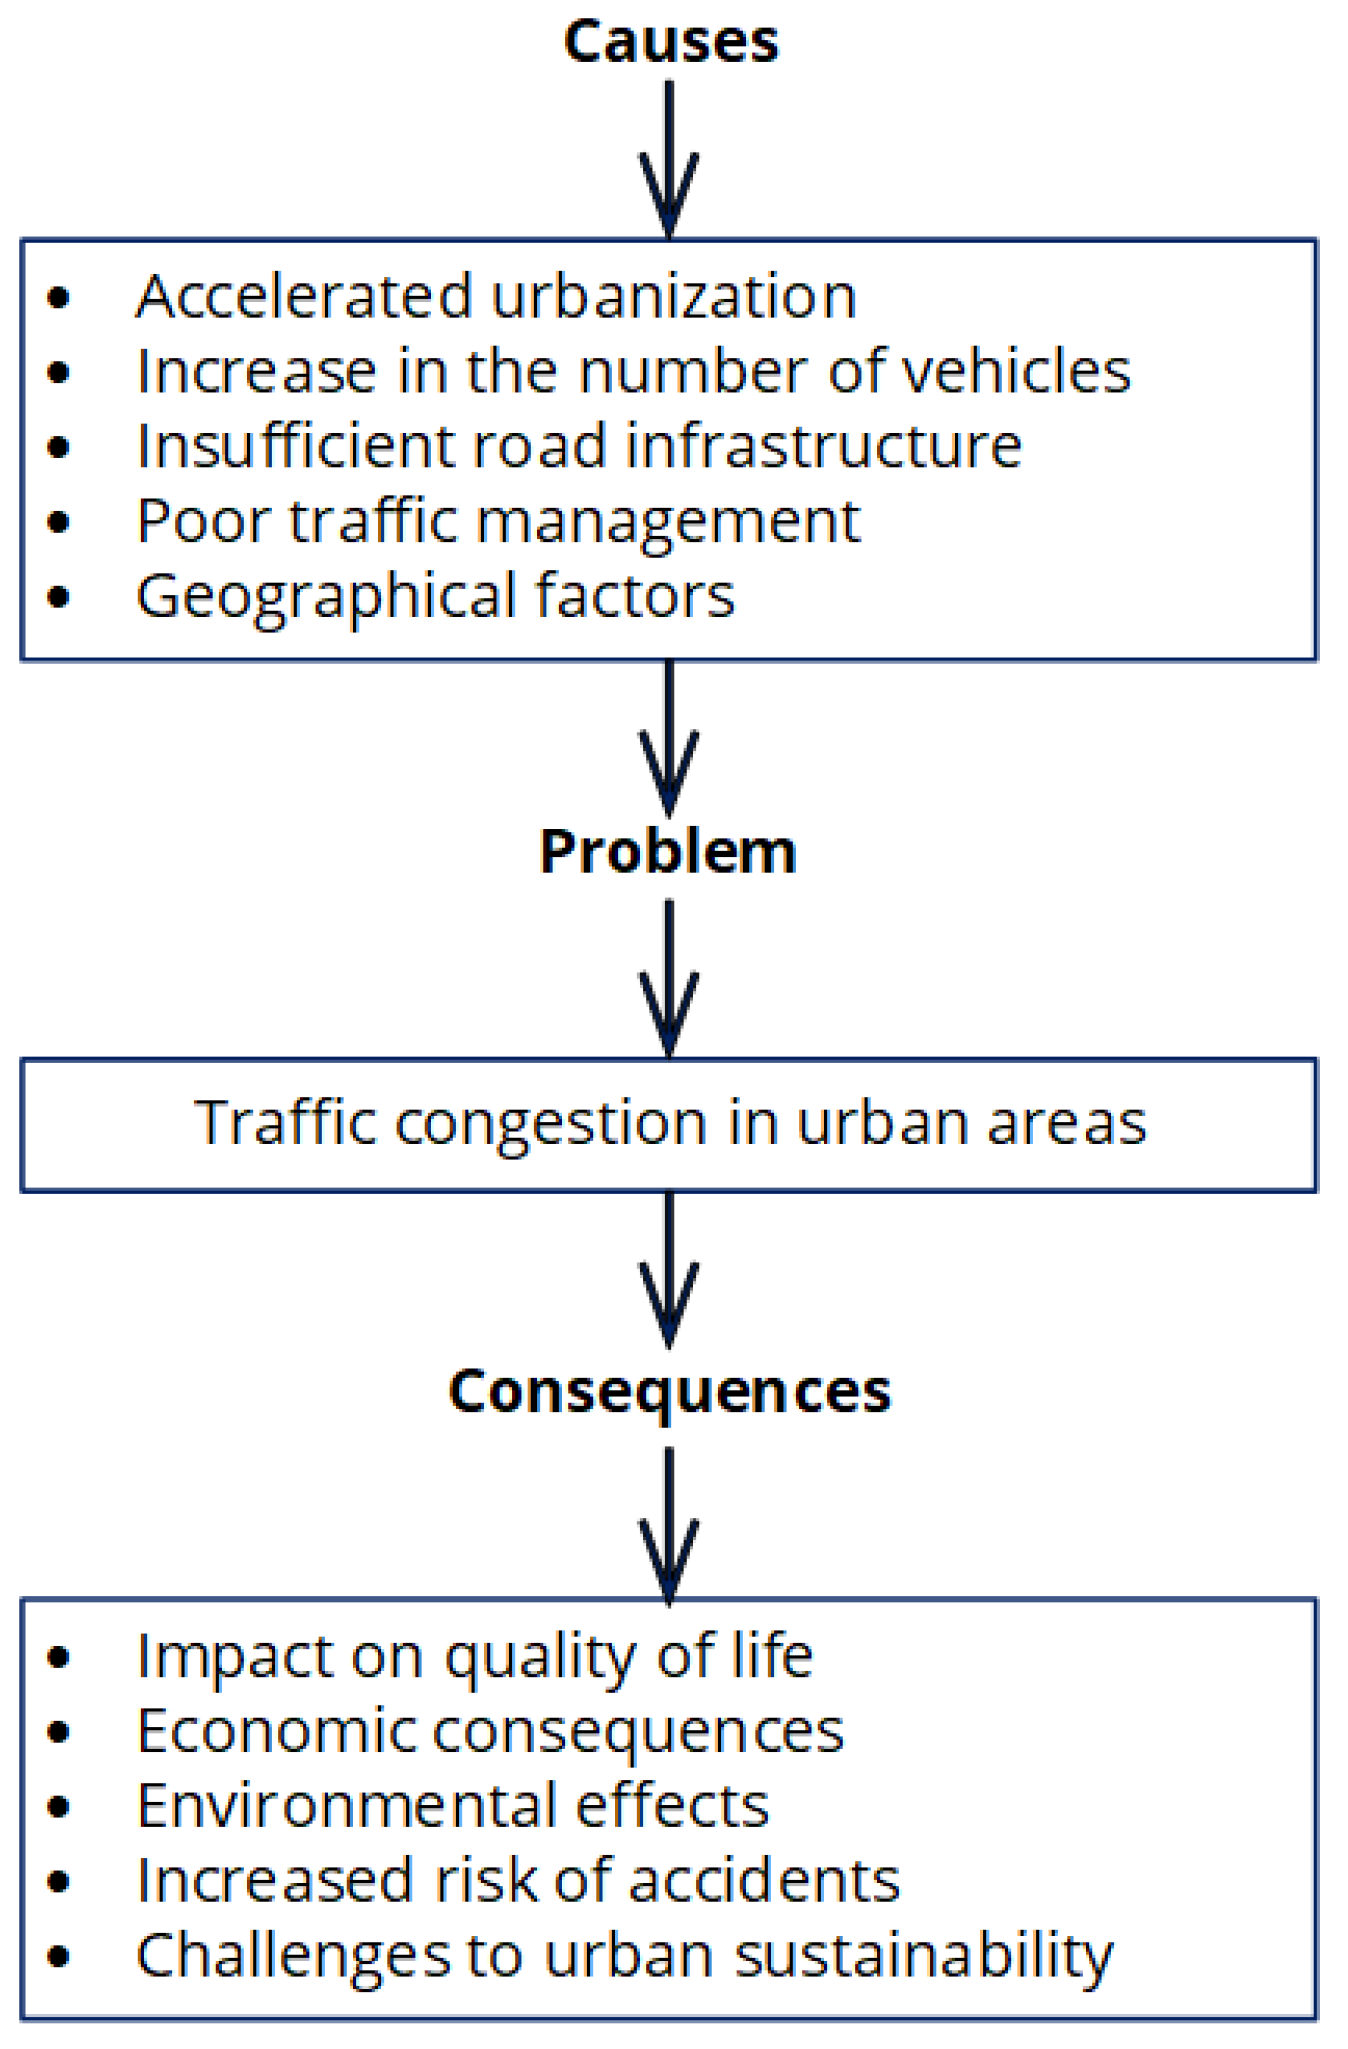
The process began with an exhaustive review of specialized scientific literature in the field of machine learning applied to Vehicular Ad Hoc Networks (VANETs). To ensure the quality and relevance of the consulted sources, high-impact indexed databases such as IEEE Xplore, Springer, and Elsevier, among others, were accessed. This review allowed for an in-depth analysis of the underlying causes of the vehicular congestion problem, as well as its consequences in terms of urban mobility, environmental impact, and economic efficiency. In this way, a solid foundation was established for the development of the predictive model, integrating cutting-edge theoretical and practical knowledge in the field of artificial intelligence and traffic management (see Figure 2).
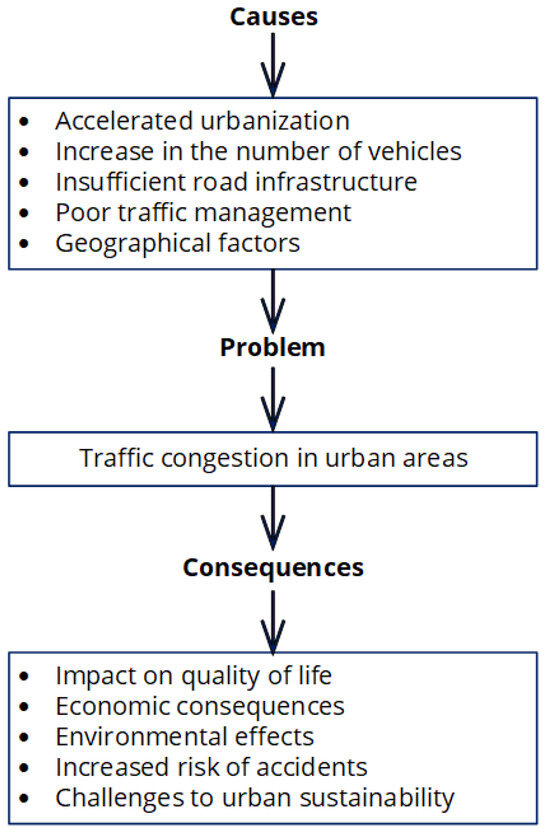
Figure 2.
Causes, problem, and consequences of vehicular congestion in urban areas.
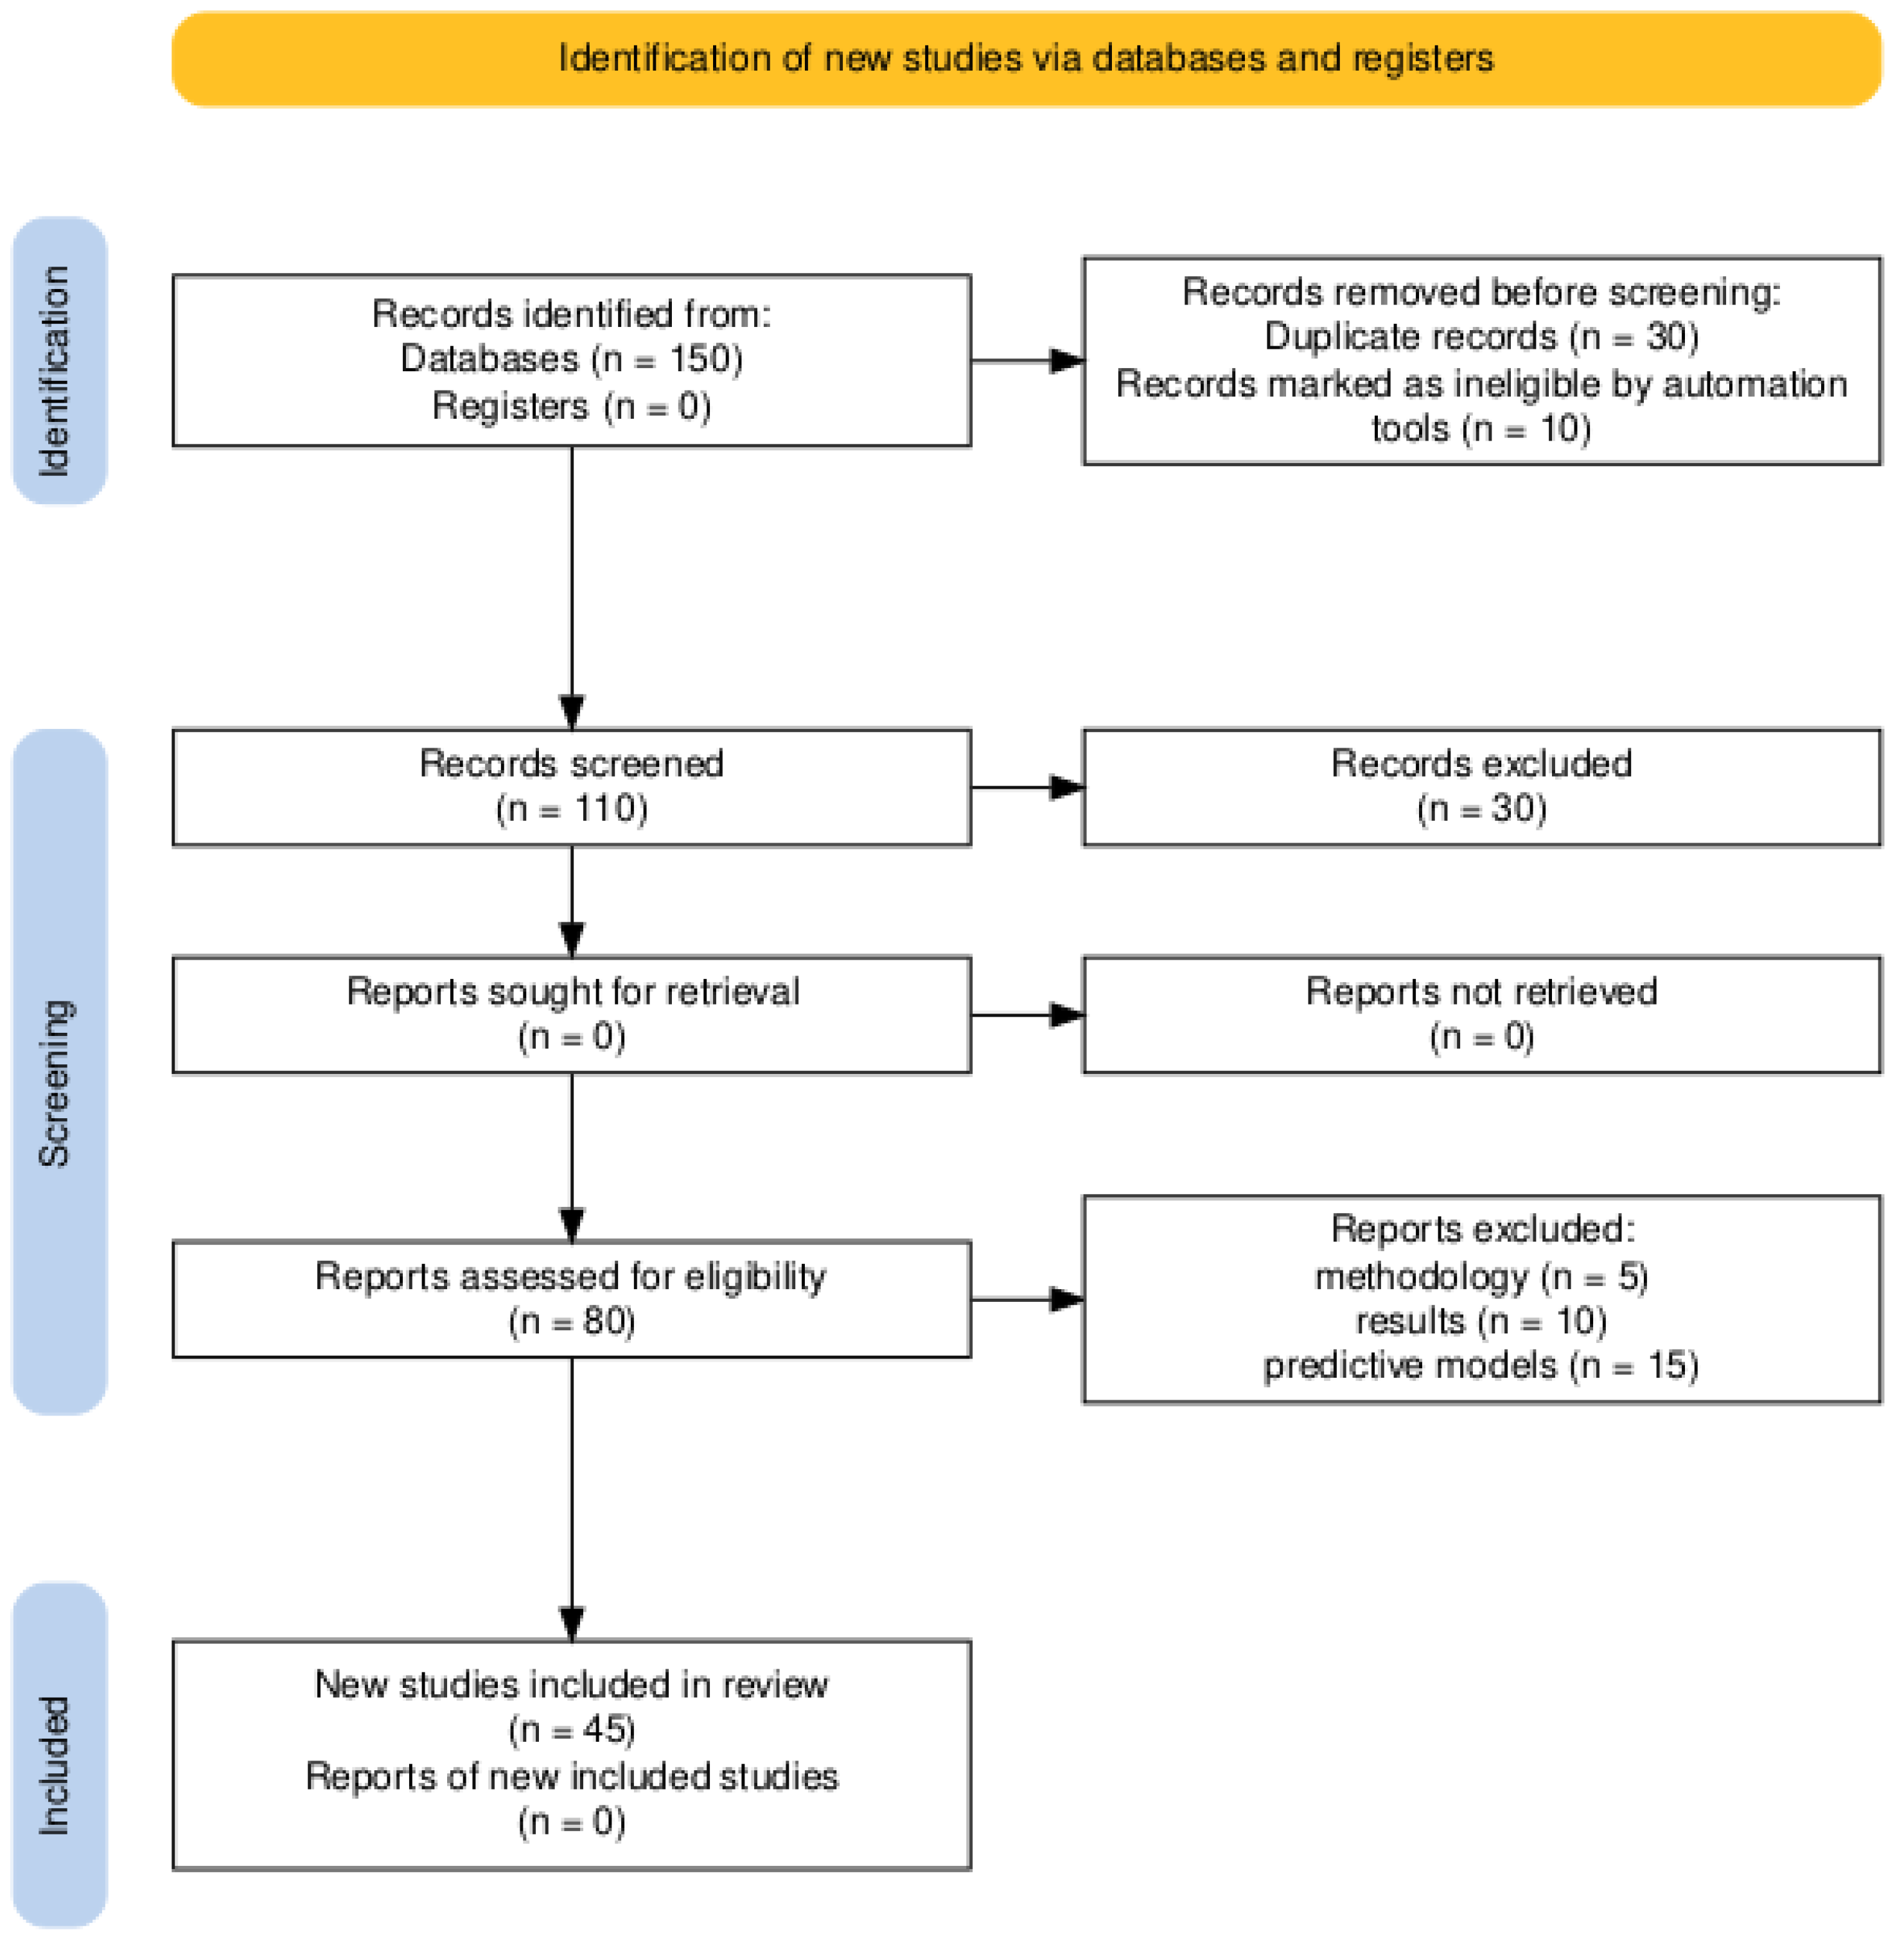
The PRISMA (Preferred Reporting Items for Systematic Reviews and Meta-Analyses) methodology was implemented to ensure a systematic, rigorous, and transparent approach in the selection of relevant literature for the development of the predictive model [21]. This methodological approach allowed for the identification, evaluation, and selection of studies based on predefined criteria, ensuring that the selected studies met high standards of quality, relevance, and scientific rigor. The PRISMA methodology was structured in four main stages, which are described below.
3.2. Identification
In this initial stage, an exhaustive literature search was conducted in recognized academic databases, such as IEEE Xplore [22], Springer, and Elsevier. This process generated a total of 150 preliminary records. Subsequently, 30 duplicate records and 10 additional records that did not meet the relevance criteria were eliminated using automated filtering tools, such as keyword and metadata analysis. As a result, 110 unique records considered relevant for the initial analysis were obtained.
3.3. Selection
Once the 110 unique records were obtained, a screening process was carried out that included the review of titles and abstracts. This preliminary analysis allowed for the evaluation of whether the records met the predefined inclusion criteria, such as the focus on machine learning applied to vehicular congestion prediction [23]. After this process, 30 records were excluded due to a lack of alignment with the research objectives, leaving 80 records for further analysis.
3.4. Eligibility Assessment
In this phase, the remaining 80 records underwent a detailed full-text review. This analysis evaluated the methodological quality, the robustness of the results, and the applicability of the studies to the research topic. Rigorous criteria were applied, such as the use of predictive approaches based on neural networks (LSTM and Transformer) and the relevance of the analyzed variables [24]. After this process, 45 studies were selected that met all the established criteria, standing out for their theoretical and empirical relevance in the context of machine learning applied to vehicular environments.
3.5. Inclusion
In the final phase, the 45 selected studies were integrated into the systematic analysis. These studies formed the theoretical and methodological basis for the development of the proposed predictive model, providing key information on variables, approaches, and results applicable to the phenomenon of vehicular congestion in VANETs (Vehicular Ad Hoc Networks) (see Figure 3).

Figure 3.
PRISMA methodology flow diagram for literature review.
The use of the PRISMA methodology allowed for the structured and transparent documentation of each step of the literature selection process, facilitating the replicability of the research. Furthermore, this methodology ensured that the selected studies were of high quality and aligned with the research objectives, thus contributing to the robustness of the developed predictive model [25].
A critical aspect of this stage was the identification of the variables that would compose the model. These variables were selected based on their theoretical and empirical relevance, ensuring that they adequately captured the dynamics of the vehicular congestion phenomenon [26]. This initial analysis allowed for the structuring of a representative dataset that integrated temporal, spatial, speed, and weather condition characteristics, fundamental elements for the modeling of complex phenomena in urban environments.
In the analysis of urban congestion based on the vehicular traffic threshold, the speed analysis methodology was used to establish mobility parameters. As a result, a congestion threshold above 10 km/h was defined, which constitutes a fundamental criterion for the delimitation of congestion scenarios and justifies the adoption of this limit in related research (see Table 1).

Table 1.
Summary of studies on vehicle congestion detection, methodologies employed, and key findings.
On the other hand, in studies on congestion detection from speed thresholds, vehicular dynamics were evaluated based on a predefined threshold. The results showed that congestion manifests when the circulation speed is below 30 km/h, which, in turn, supports the establishment of the 10 km/h threshold as a reference in subsequent studies.
Likewise, in the context of congestion detection in smart urban environments, a detailed analysis of traffic flows was carried out. From this procedure, it was possible to identify congestion patterns, which allows for the substantiation of the selection of key variables in research aimed at traffic optimization.
Regarding the prediction of congestion under the influence of weather conditions, climatic and traffic data were integrated to analyze the interaction between these factors. The results indicated a significant correlation between the occurrence of precipitation and the intensification of vehicular congestion, which justifies the inclusion of climatic variables in traffic prediction models.
In summary, each study provides relevant scientific evidence on different aspects of congestion detection, such as the determination of speed thresholds, the analysis of traffic patterns, and the influence of climatic factors. These elements are essential for the formulation of precise methodologies and the development of solid analytical approaches in the study of urban mobility.
3.6. Design Cycle
During this stage, technological artifacts were conceptualized and developed, which consisted of predictive models based on neural networks, specifically LSTM and Transformer [31]. This process allowed for the integration of advanced machine learning techniques to address the vehicular congestion problem, ensuring that the models were capable of capturing complex patterns in the data and generating accurate predictions.
- Data preparation: In the first phase, a CSV file containing detailed information about vehicular traffic was used. This file included relevant variables such as vehicle speed, time intervals, and lane. To ensure the quality and usefulness of the dataset, various preprocessing tasks were performed, including the following:Date conversion: Dates were converted to datetime format to enable temporal operations and analysis, such as grouping by time intervals. Time interval creation: Data were grouped into 10 min intervals, facilitating temporal analysis and aggregation of values related to traffic dynamics. Average speed calculation: The average speed of vehicles was determined for each time interval and lane, providing a key measure for identifying patterns and trends.The NSRDB (National Solar Radiation Database) constitutes a comprehensive compilation of meteorological data series that employs multichannel measurements from geostationary satellites [32]. This repository covers information from 1998 to 2023 in Ecuador, with a spatial resolution within a 4 km by 4 km grid. Furthermore, these data are available to the general public free of charge.Access to the NSRDB dataset can be obtained in various ways: directly from the NSRDB Viewer, through the website https://nsrdb.nrel.gov/ (accessed on 6 March 2025), or programmatically using an API, among other options. Once the data package is selected, it is possible to display the available attributes, among which the parameters of interest should be chosen, such as temperature, precipitable_water, wind_speed, pressure, wind_direction, and relative_humidity. Subsequently, the desired time interval is selected, in this case, 60 min, and the UTC time is converted to local time (see Figure 4).
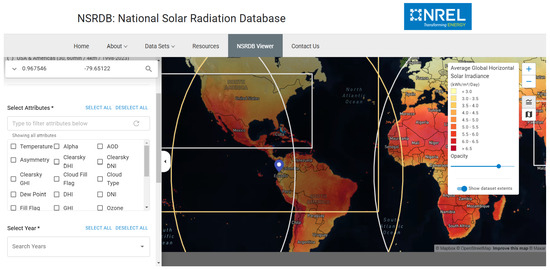 Figure 4. Attribute and Parameter Selection Interface in the NSRDB Viewer.Figure 4. Attribute and Parameter Selection Interface in the NSRDB Viewer.
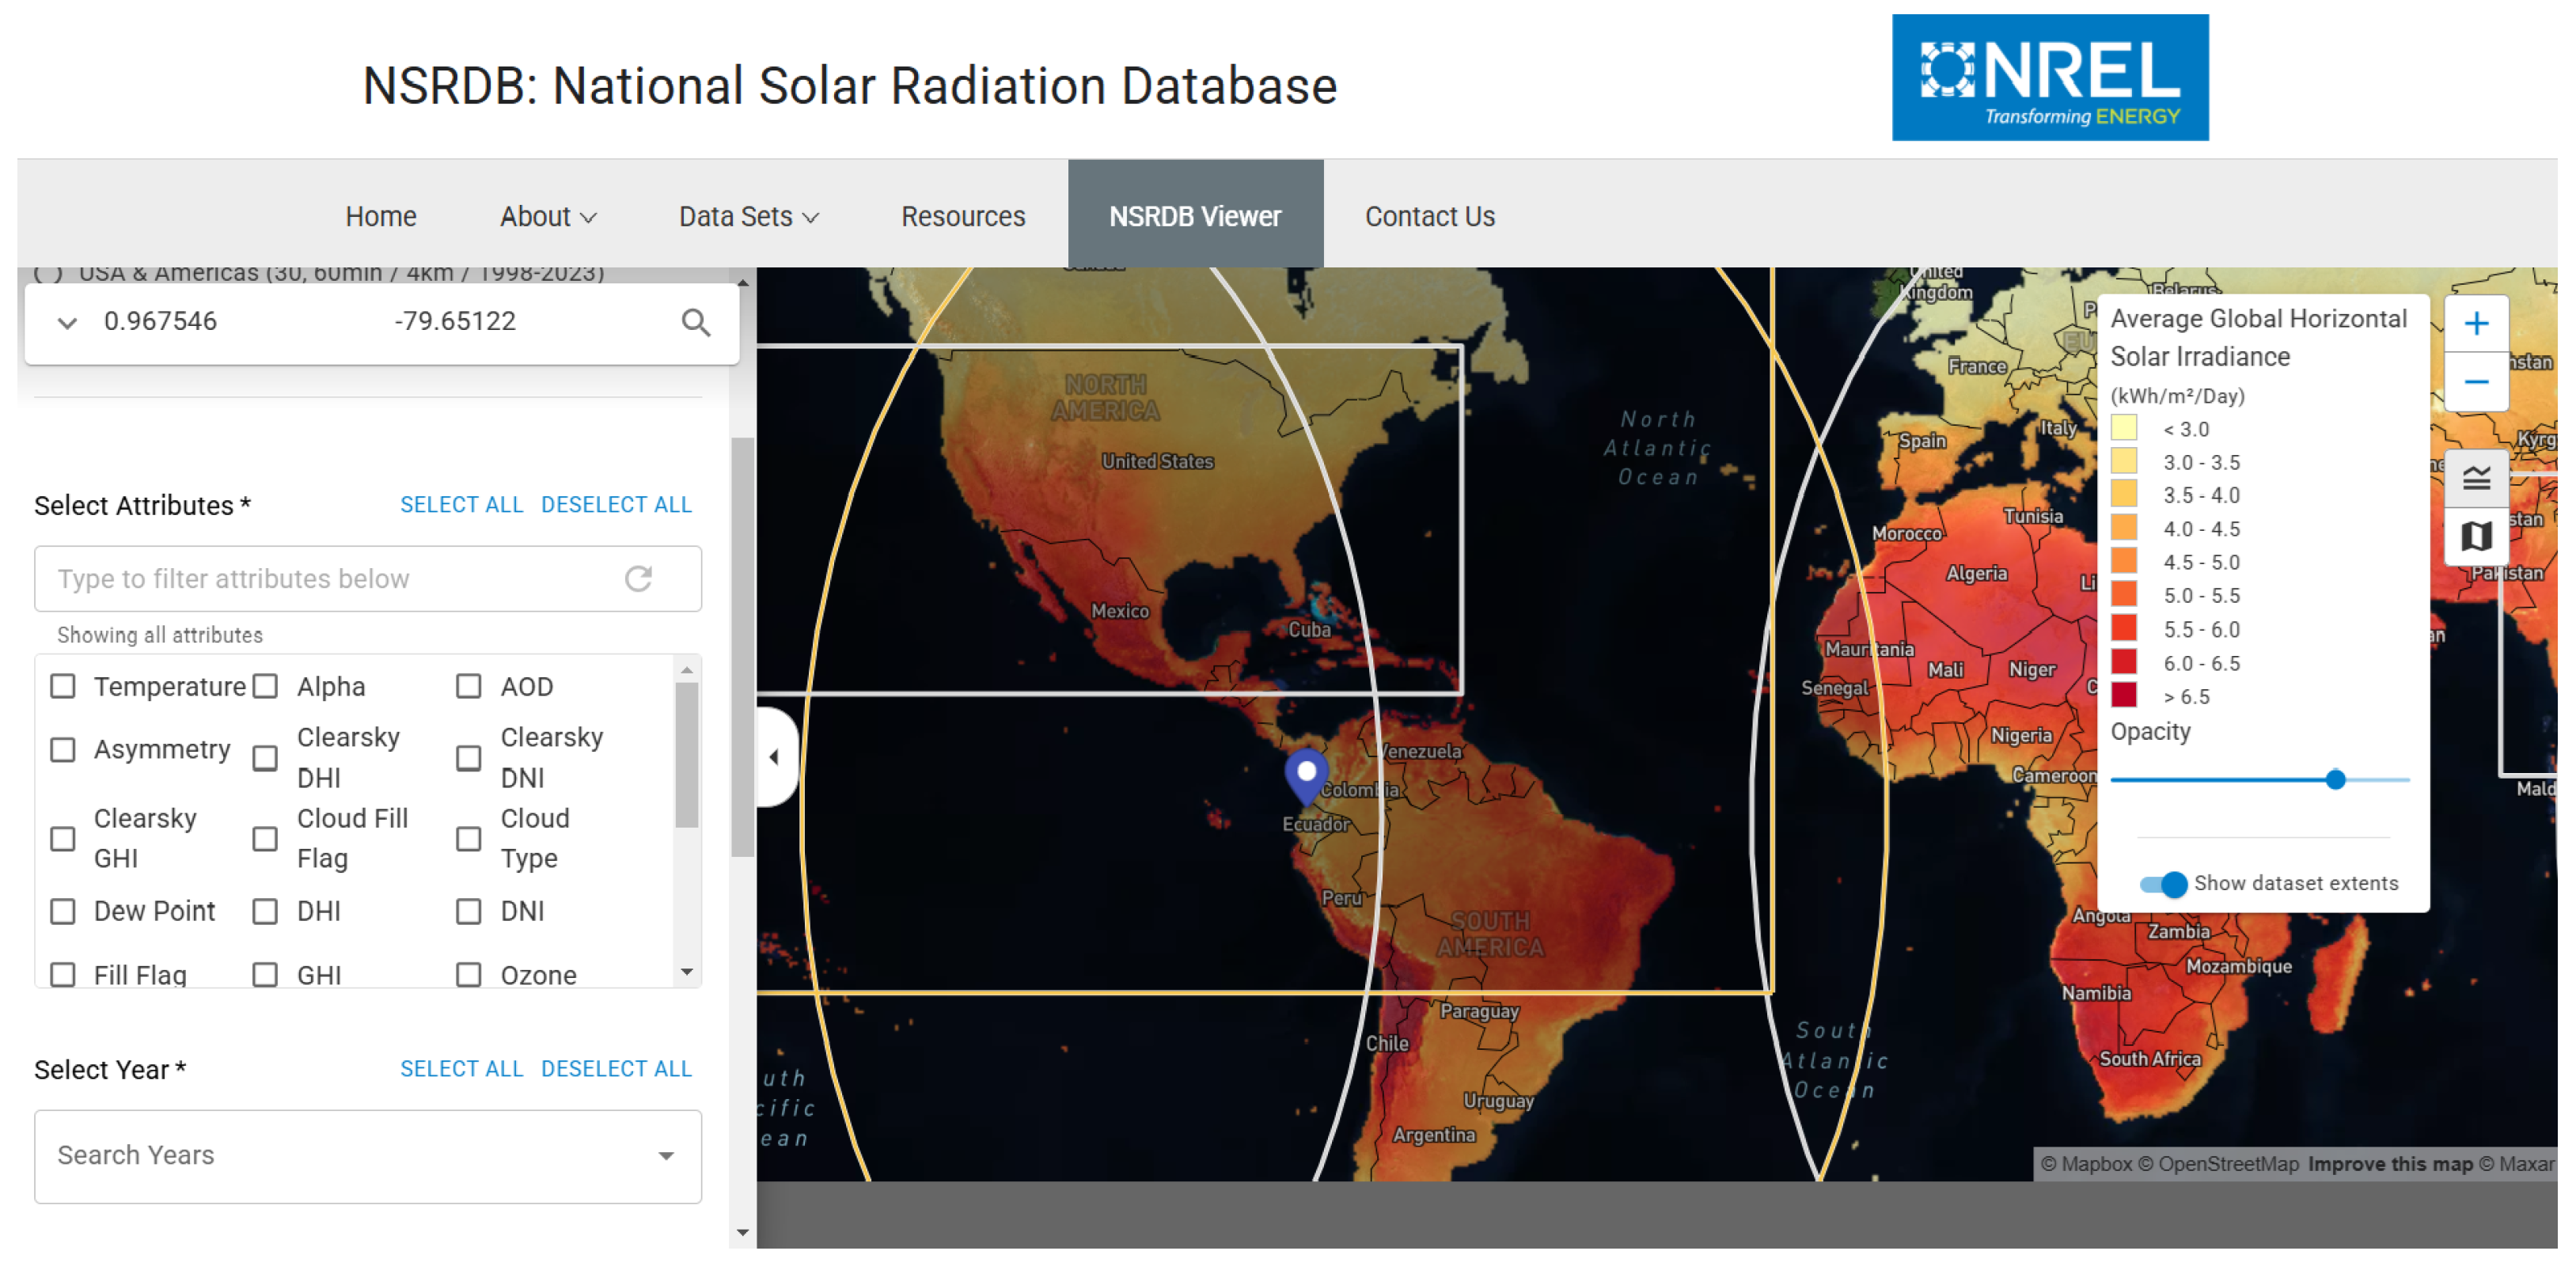
- Data exploration: The initial analysis focused on detecting and visualizing relevant patterns in traffic behavior. Among the activities carried out, congestion detection stood out, in which a speed threshold of 10 km/h was defined as a criterion to identify intervals with vehicular congestion. This definition allowed for the labeling of data and the establishment of clear differences between normal and congested conditions [33]. Subsequently, graphs were generated representing the average speeds over time for each lane, using a reference line to highlight the moments when the speed fell below the established threshold [34]. This approach facilitated the visual identification of congestion patterns and provided a solid foundation for the development of more advanced predictive models.
- Derived features: To enrich the dataset and improve the predictive capacity of the model, new features were derived, allowing for a more complete representation of the analyzed phenomena. First, a binary column was added to classify each interval as congested (1) or non-congested (0), based on the previously defined speed threshold. Additionally, further features were incorporated, such as meteorological data, as well as temporal variables, like the time of day and the day of the week. These latter provide a temporal context that allows for capturing seasonal patterns and daily variations in traffic behavior [35]. In this way, the available information was expanded, which contributed to greater accuracy in the identification and prediction of vehicular congestion events (see Figure 5).
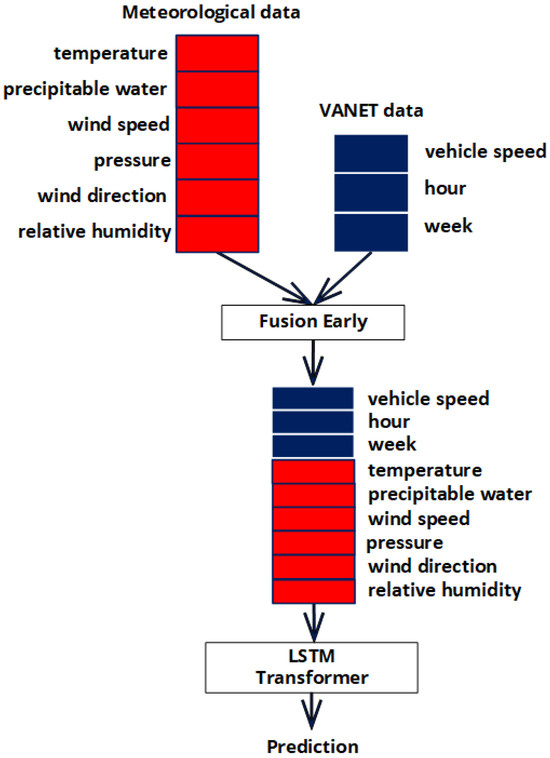 Figure 5. Integration of environmental data and LSTM–Transformer networks for vehicular congestion prediction.Figure 5. Integration of environmental data and LSTM–Transformer networks for vehicular congestion prediction.
- Predictive modeling: To balance the dataset and improve the representativeness of the classes, SMOTE (Synthetic Minority Over-sampling Technique) is used. This method generates new synthetic instances of the minority class instead of simply replicating existing ones, allowing for a more equitable distribution within the dataset. By applying SMOTE, the bias towards the majority class is reduced, which contributes to better performance of machine learning models, especially in scenarios where class imbalance could affect the predictive capacity and generalization of the model [36].Advanced models, such as LSTM (Long Short-Term Memory), are employed, which have proven to be highly effective in processing sequential data due to their ability to capture long-term dependencies in time series [37].The Transformer model is employed, an advanced architecture based on attention mechanisms that has significantly transformed the processing of sequential data [38].Data splitting: The dataset was split into an 80% training set and a 20% test set, ensuring a fair and representative evaluation of the model. Training and prediction: The model was trained using historical data and evaluated through predictions on the test set.
- Model evaluation: The performance of the predictive model was evaluated using standard machine learning metrics, such as loss, accuracy, precision, recall, F1-score, MSE, and RMSE. These metrics demonstrated the high capacity of the model to correctly identify intervals with and without congestion, reflecting its effectiveness in the prediction task [39]. Furthermore, the results obtained showed an adequate balance between the precision and generalization capacity of the model, consolidating its applicability in complex urban environments [40]
- Results visualization: To facilitate the interpretation of the conclusions and clearly communicate the results obtained, key visualizations were developed that allow for the analysis of the impact of the techniques used in data processing. First, a comparative graph was generated showing the class distribution before and after applying SMOTE, which allows for the demonstration of how the dataset is balanced. Subsequently, loss graphs were included for both the LSTM and Transformer models, with the aim of visualizing the training behavior and evaluating the convergence of each model. These graphical representations are fundamental to understanding the performance of the algorithms and supporting the analysis of the results obtained [41].
3.7. Rigor Cycle
This component ensured the robustness and scientific validity of the developed models. To this end, standard metrics such as precision, sensitivity, and specificity were used, which allowed for a comprehensive evaluation of the models’ performance. Additionally, the results obtained were compared with previous studies in the field of vehicular congestion prediction, ensuring that the proposed solutions align with the existing literature [42].
To validate the predictive models, the walk-forward validation technique was employed, which was applied to both LSTM neural networks and Transformer models. This approach allows for the sequential evaluation of model performance, segmenting the data into multiple training and test sets, which ensures a more robust and adaptable validation to the changing conditions of the data. In this way, it is ensured that the models are capable of generalizing adequately and maintaining their accuracy in dynamic and realistic scenarios, reinforcing their applicability in complex urban environments.
where is the prediction for the point . f is the model trained with the data up to .
The prediction error at each step i is calculated as follows:
and the evaluation metrics are calculated over all errors .
4. Results
4.1. VANET Simulation
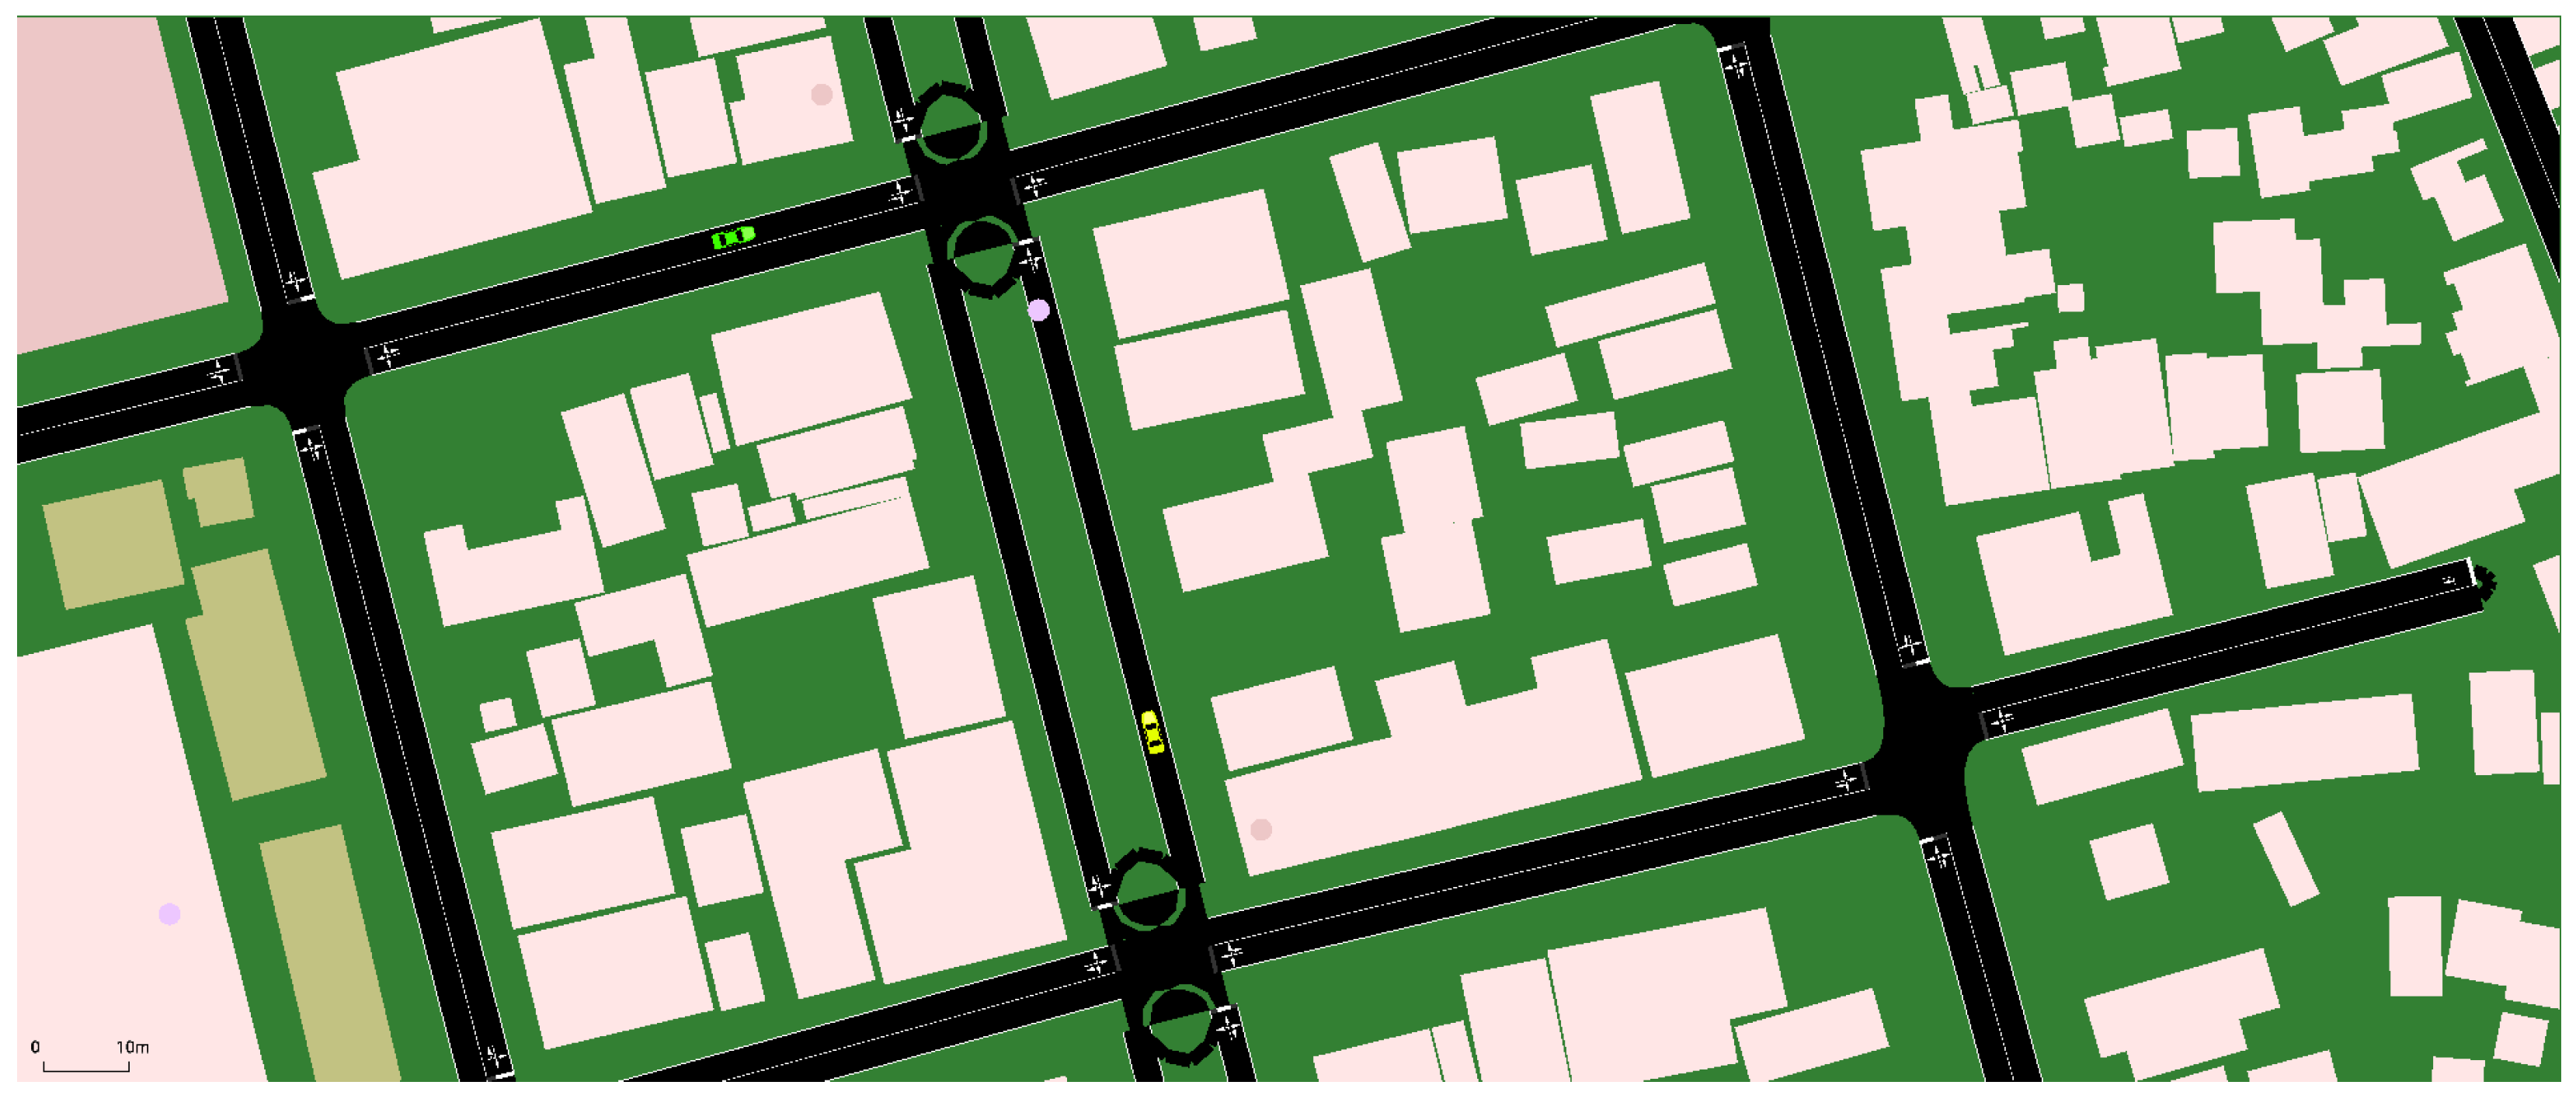
To model and evaluate the performance of Vehicular Ad Hoc Networks (VANETs) in a realistic urban environment, a specific road segment was selected. This segment, connecting the Pontificia Universidad Católica del Ecuador–Esmeraldas to the Multiplaza Shopping Center and spanning approximately 1.4 km, was chosen for its ability to represent a dense and complex traffic scenario. The area bounded by the Eugenio Espejo, Pichincha, Muriel, and Pedro Vicente Maldonado streets, characterized by intersections, traffic lights, and varying traffic flow, was defined as the study area.
The different color codes of live traffic in the selected analysis area represent traffic speed on the road. According to Google, the official colors are as follows (see Table 2):
Table 2.
Google maps traffic color legend.
Geographic coordinates were obtained for the initial point, situated at the Pontifical Catholic University of Ecuador, Esmeraldas Campus (PUCESE), and the terminal point, located at the Multiplaza shopping mall, a key landmark in the city. These points were strategically chosen to represent routes of significant importance regarding vehicular traffic and urban mobility (see Table 3).
Table 3.
Geographic coordinates of key locations in Esmeraldas, Ecuador.
The map is composed of a structure of segments and nodes, which represent roads and their intersections, respectively. To customize the study area and make specific adjustments, it is necessary to use an additional tool called NETEDIT, which is integrated into the SUMO software. This tool allows for the graphical modification, editing, and optimization of the traffic network, facilitating the adaptation of the model to the specific needs of the analysis (see Figure 6).
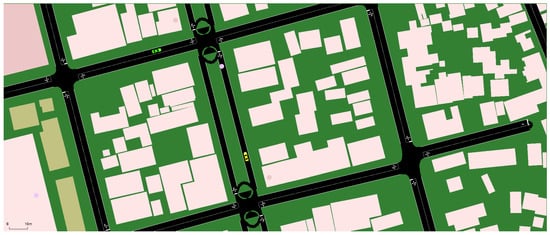
Figure 6.
Node routes from PUCESE to Multiplaza.
Examination of the nodal distribution across the various avenues indicates that certain nodes are common to multiple road segments, thus revealing the presence of key intersections or connectivity within the road network topology. For example, node 1143931858 is shared between the Espejo and Olmedo Avenue segments. Similarly, node 1143925281 connects the Olmedo and Pichincha Avenue segments, while node 1143927931 is located at the intersection of the Pichincha and Maldonado Avenue segments, further substantiating the identification of critical intersection points.
Conversely, avenues exhibiting a higher nodal count, such as Maldonado, which comprises three nodes, may correspond to longer road segments or areas with a higher concentration of points of interest within the network topology. Furthermore, the shared presence of certain nodes across different avenues may serve as an indicator of their significance in traffic flow analysis, as these areas may coincide with regions of increased congestion or strategic points within the road network (see Table 4).
Table 4.
Relationship between avenues and traffic nodes.
To define the routes, modifications were made to the osm.passenger.trips.xml file. This file contains the specifications necessary to simulate vehicle trajectories in the virtual environment. However, to ensure that the simulation accurately reflects real-world traffic conditions, it is essential to analyze the characteristics of the main streets beforehand, especially those with higher traffic intensity.
In the input section, the files that will be used in the simulation are defined. The net-file (osm.net.xml) represents the road network, that is, the map of roads on which the vehicles will travel. The route-files (osm.passenger.trips.xml) file contains the vehicle demand, specifying the routes to follow during the simulation. Finally, the additional-files (osm.poly.xml) file provides additional information, such as polygons to represent buildings, areas, or visual elements in the simulated environment.
As regards processing, the ignore-route-errors parameter is set to true, which allows the simulation to continue running even if there are errors in the routes. This is useful to avoid interruptions caused by minor problems in the definition of paths.
In routing, two key parameters are configured. The first, device.rerouting.adaptation-steps, with a value of 18, defines the number of adaptation steps allowed for the rerouting of vehicles, which facilitates the simulation of dynamic changes in routes due to congestion or other factors. The second, device.rerouting.adaptation-interval, with a value of 10, establishes the time interval (in simulation seconds) in which it will be verified if a vehicle needs to modify its route.
Regarding the graphical interface, the gui-settings-file (osm.view.xml) file contains specific configurations for visualization in SUMO, including road colors, vehicle representation, labels, and other graphical elements (see Table 5).
Table 5.
Parameter configuration for traffic simulation in SUMO.
This simulation scenario faithfully reproduces real-world urban conditions, allowing for the comprehensive evaluation of routing algorithms and vehicular communication protocols designed specifically to optimize traffic flow and minimize congestion in complex urban environments. Through detailed and highly accurate simulations, this study seeks to analyze the effectiveness of Vehicular Ad Hoc Networks (VANETs) in generating alternative routes in real time, significantly reducing travel times, and improving road safety.
VANETs, by facilitating communication between vehicles and road infrastructure, enable collaborative decision making based on up-to-date data, such as traffic status, weather conditions, and unforeseen events on the road. This approach not only contributes to traffic optimization but also promotes smarter and more sustainable mobility. Furthermore, this study evaluates the ability of these systems to dynamically adapt to changes in network conditions, such as vehicle density or the appearance of bottlenecks, thus ensuring an efficient and robust response to critical situations.
The selection of this specific road segment provides a solid foundation for future research in vehicular networks and intelligent urban traffic management. By simulating vehicle behavior in this controlled environment, empirical data can be obtained to validate theoretical models and compare the performances of different mobility strategies (see Table 6).
Table 6.
Vehicular movement record: speed, displacement, and turning angle.
The simulation conducted in the context of Vehicular Ad Hoc Networks (VANETs) provided realistic results by considering a variety of traffic scenarios. Evaluated factors included vehicle density, vehicle movement patterns, and specific traffic conditions, allowing for modeling representative scenarios of real-world vehicular network behavior. These scenarios enabled the assessment of network performance under diverse circumstances, providing valuable insights into its performance in terms of metrics such as latency, packet loss, and throughput (see Table 7).
Table 7.
Vehicle route tracking: traveled lane, distance, and speed.
The analysis of the overall average speed indicates that vehicles travel at an average speed of 21 km/h. Furthermore, the distance between the Pontifical Catholic University of Ecuador, Esmeraldas Campus (PUCESE), and the Multiplaza Shopping Center has been determined to be approximately 1.5 km.
To calculate the time required to cover this distance at the average speed, the following formula is used:
In this case, substituting the values yields the following:
This value is then converted from hours to minutes using the following operation:
Therefore, the estimated travel time between PUCESE and the Multiplaza Shopping Center, considering an average speed of 21.9 km/h, is approximately 4.08 min.
A key aspect of this analysis is that the accuracy and applicability of the obtained results are directly influenced by the mathematical models and algorithms employed in the simulation. The defined assumptions and specific configurations used in setting up the simulator play a decisive role in the outcomes. For example, parameters such as the mobility model, the communication protocol used, or the representation of environmental interferences can have a significant impact on the obtained performance metrics.
4.2. Average Speeds per 10 Min Interval and Lane
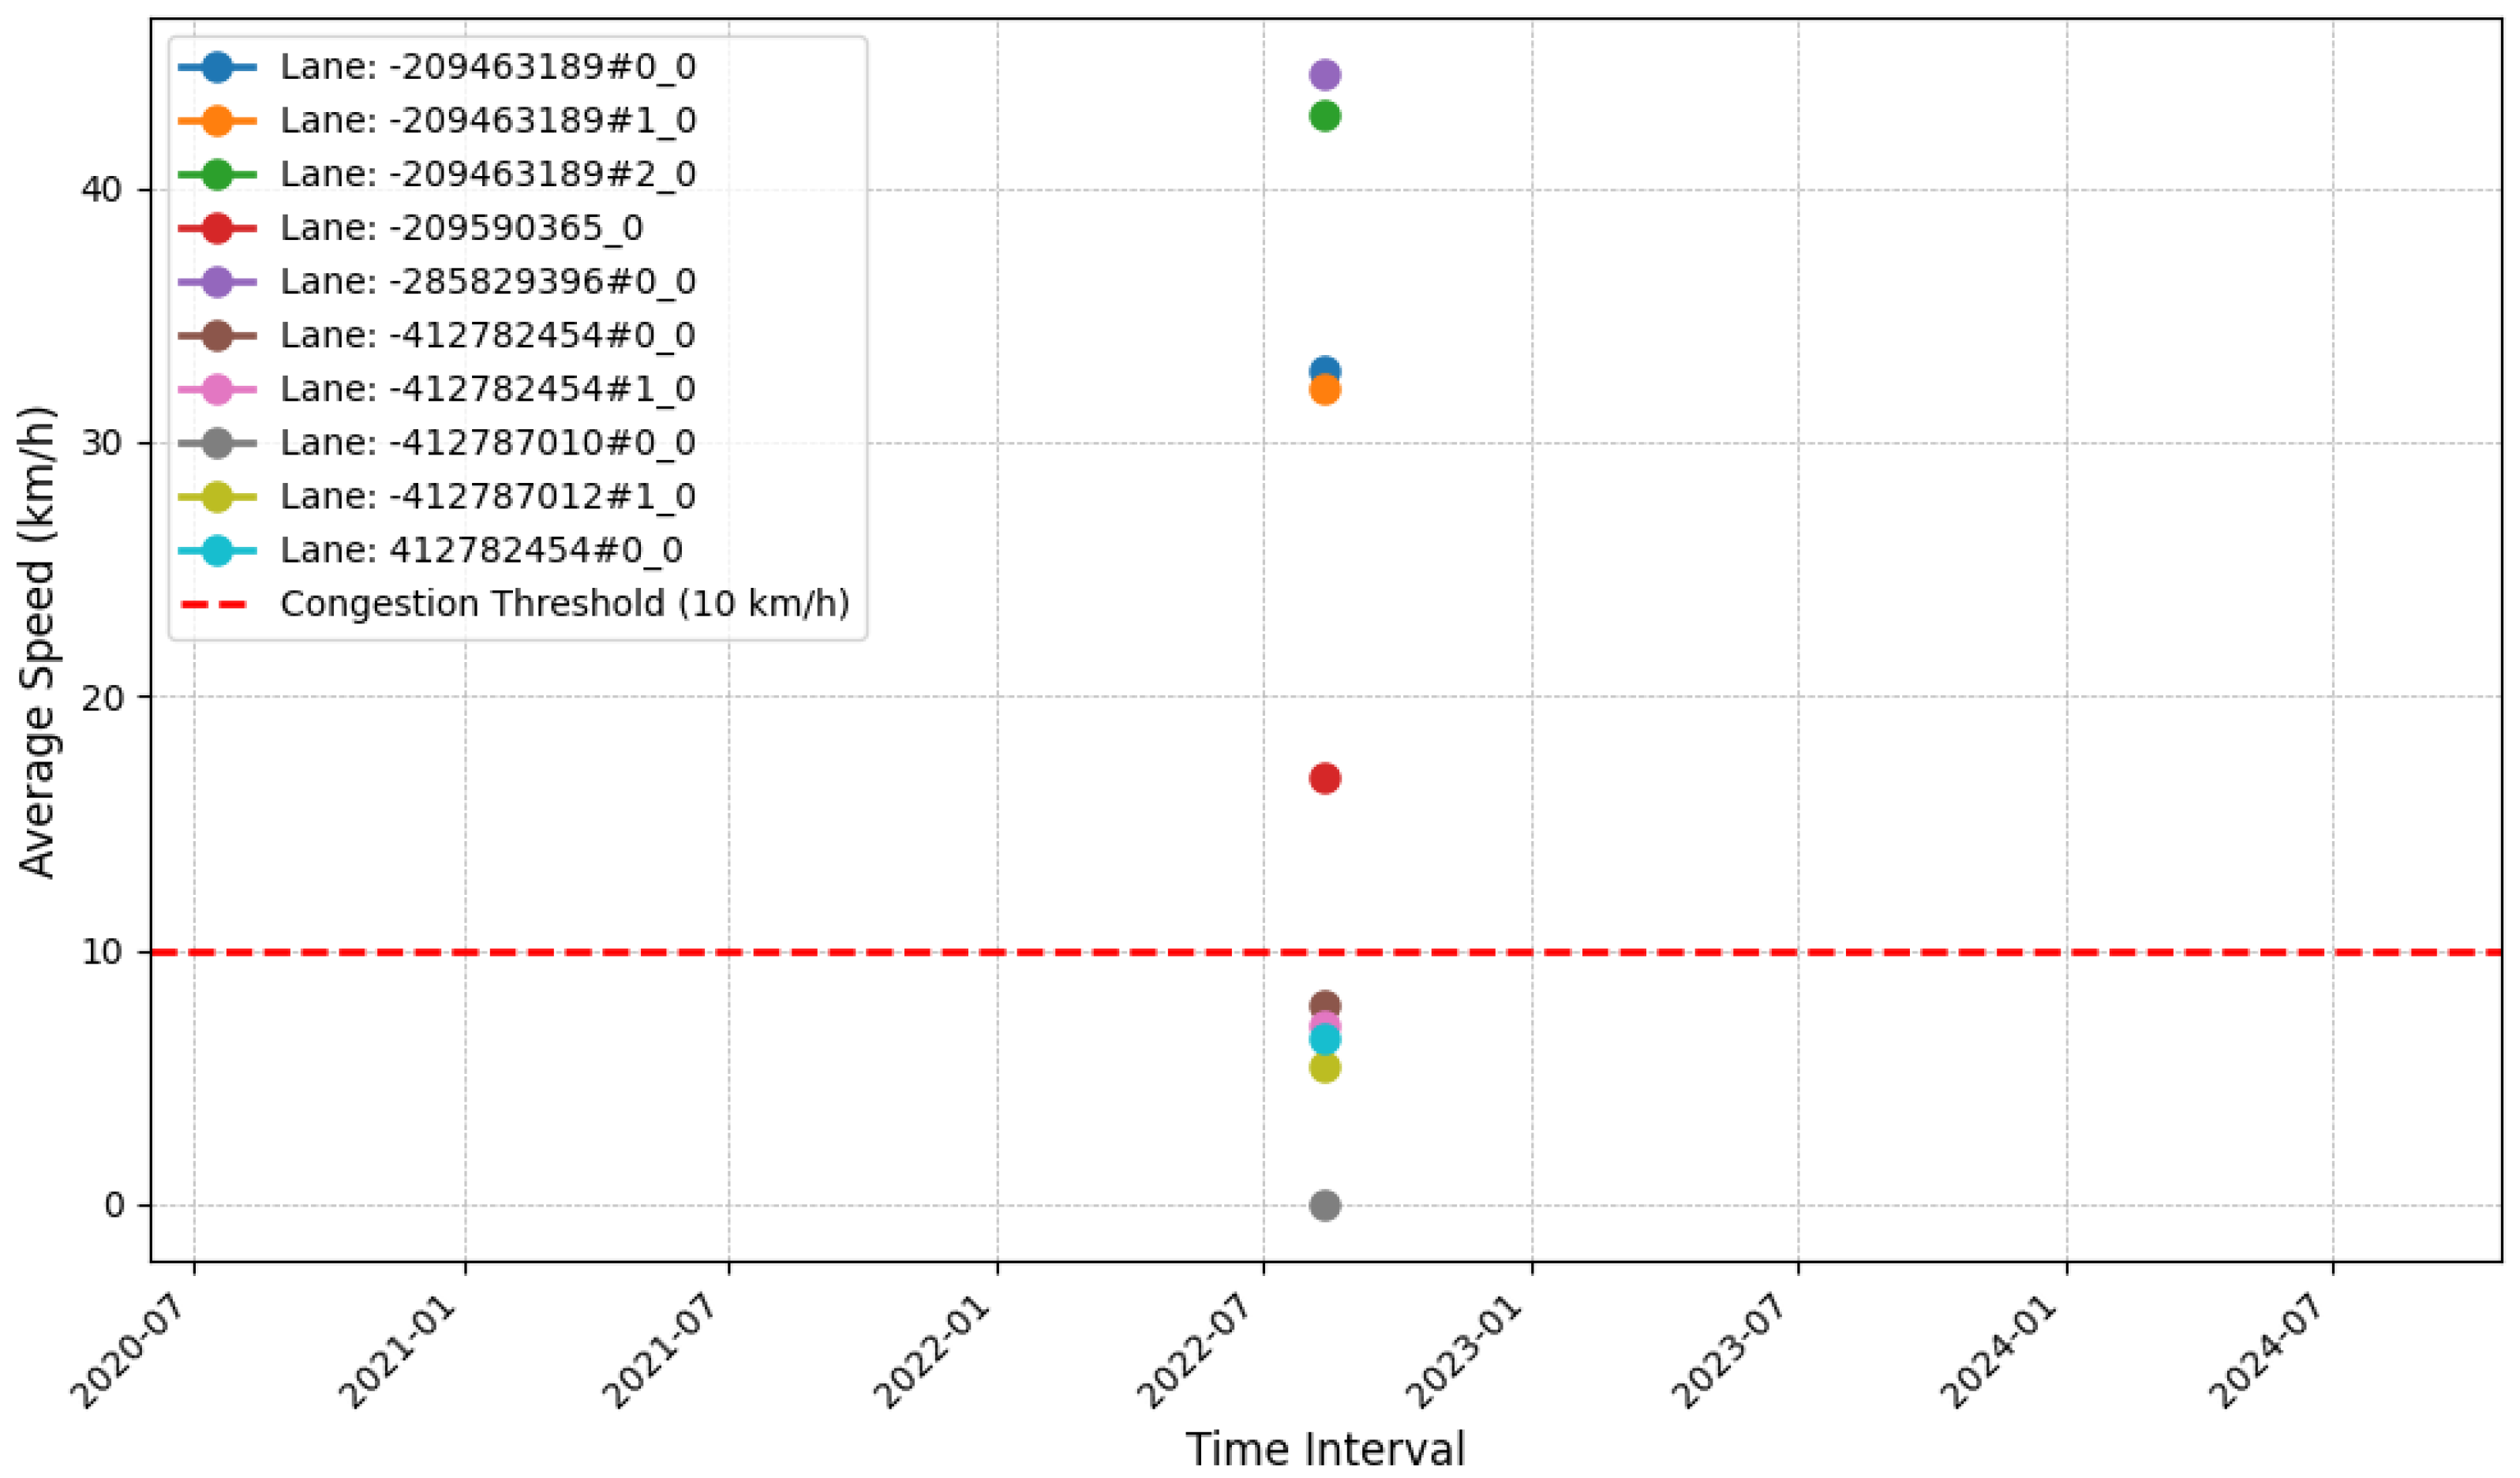
Congestion is identified by a true value in the congestion column, indicating that the average speed for that lane during a specific time interval is below the pre-established congestion threshold, which in this case is 10 km/h. This congestion value signals that traffic in that lane has slowed down, which may be due to a buildup of vehicles that reduces the speed of traffic flow (see Figure 7).
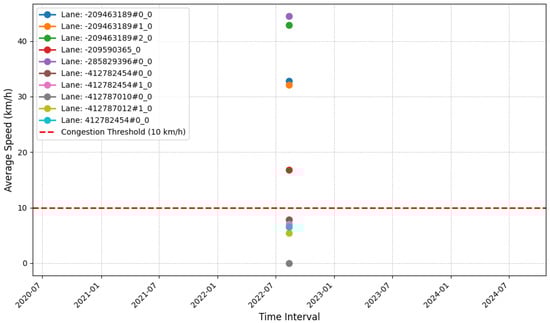
Figure 7.
Variation of average speed per lane and congestion threshold (10 km/h) in different time intervals.
For example, the lane with the identifier 412782454 has an average speed of 7.82 km/h, which is below the 10 km/h threshold. As a result, this lane is marked as congested (congestion = true), indicating that traffic speed in that lane has decreased significantly during that time interval.
Similarly, the lane identified as 1142348508 has an average speed of 9.53 km/h, also below 10 km/h, which is also classified as congestion (congestion = true). This suggests that, in this lane, the traffic flow experienced a decrease in speed during the same interval.
This type of analysis is crucial for monitoring traffic behavior and detecting potential congestion points over time in different lanes. By identifying these congested intervals, it is possible to implement measures to alleviate congestion or improve traffic management, optimizing vehicle circulation and reducing waiting times (see Table 8).
Table 8.
Congested intervals and lanes.
4.3. Congestion Prediction
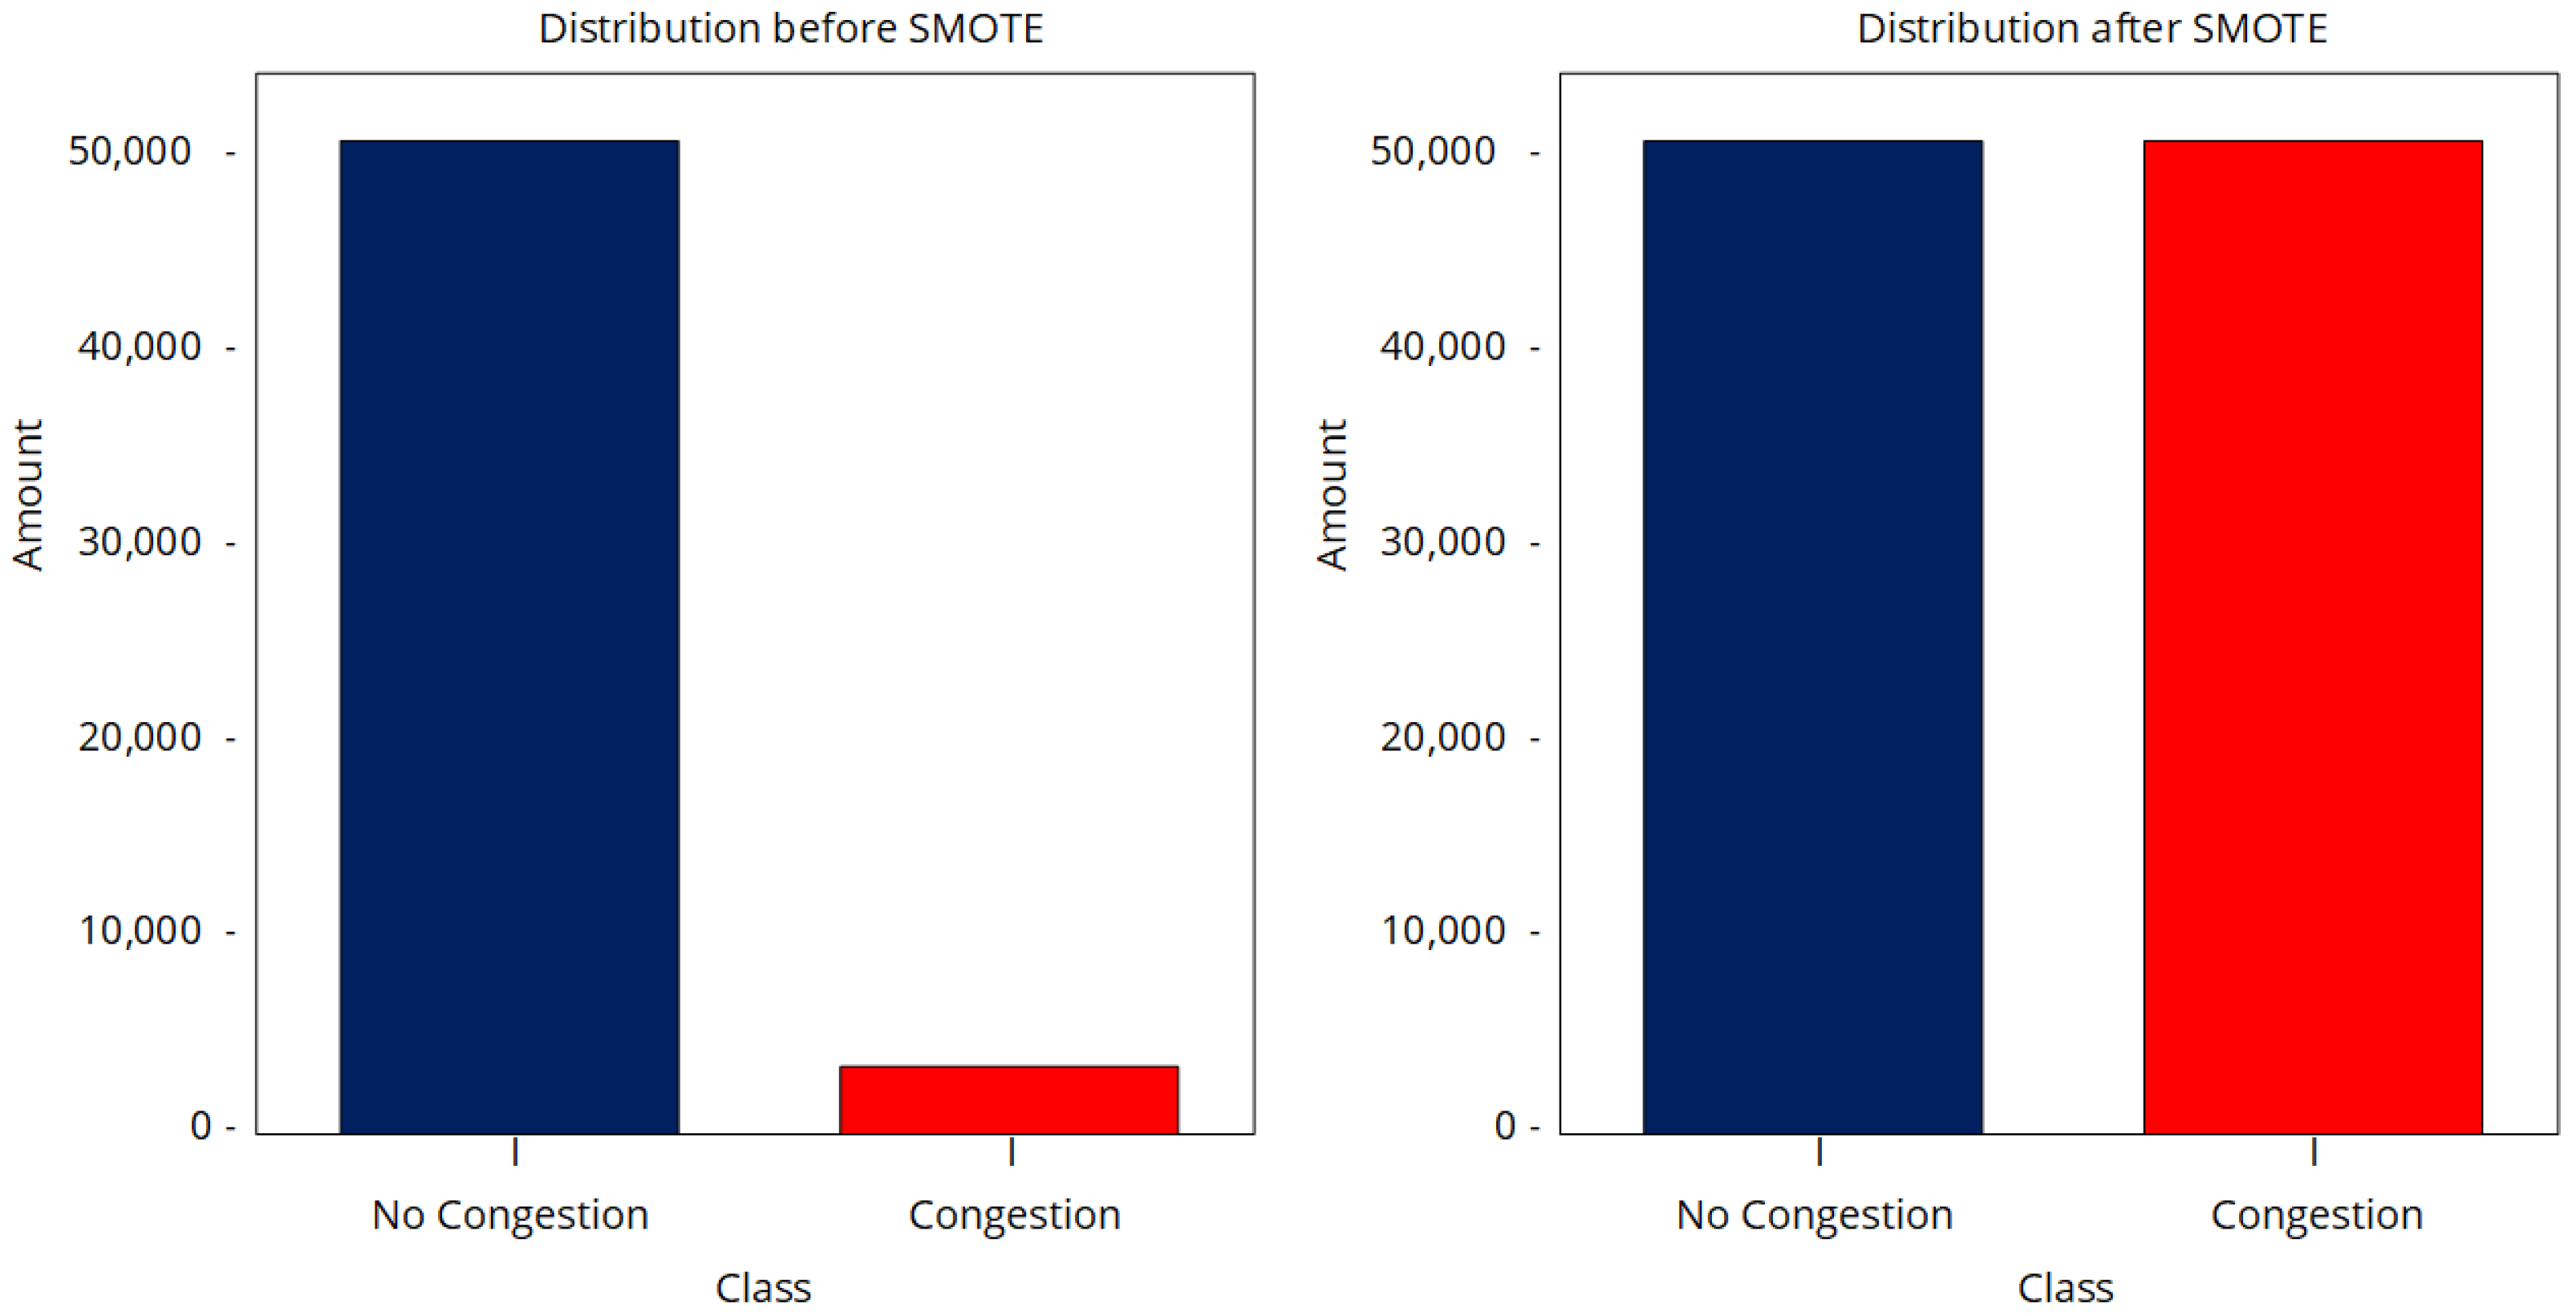
Figure 8 shows the class distribution before and after applying SMOTE (Synthetic Minority Over-sampling Technique). In the first distribution, before applying SMOTE, a strong imbalance between classes is observed. The “No Congestion” class (in blue) has a significantly larger number of samples compared with the “Congestion” class (in red), which has very few observations.

Figure 8.
Distribution of classes before and after applying SMOTE.
After applying SMOTE, both classes have virtually the same number of samples. The minority class (“Congestion”) has been oversampled to match the quantity of the majority class (“No Congestion”). This balance reduces the bias towards the majority class and improves the generalization ability of machine learning models.
The use of SMOTE has allowed for balancing the class distribution in the dataset, which is fundamental to optimizing the performance of predictive models in imbalanced classification problems. Now, the models will be able to identify both classes more equitably.
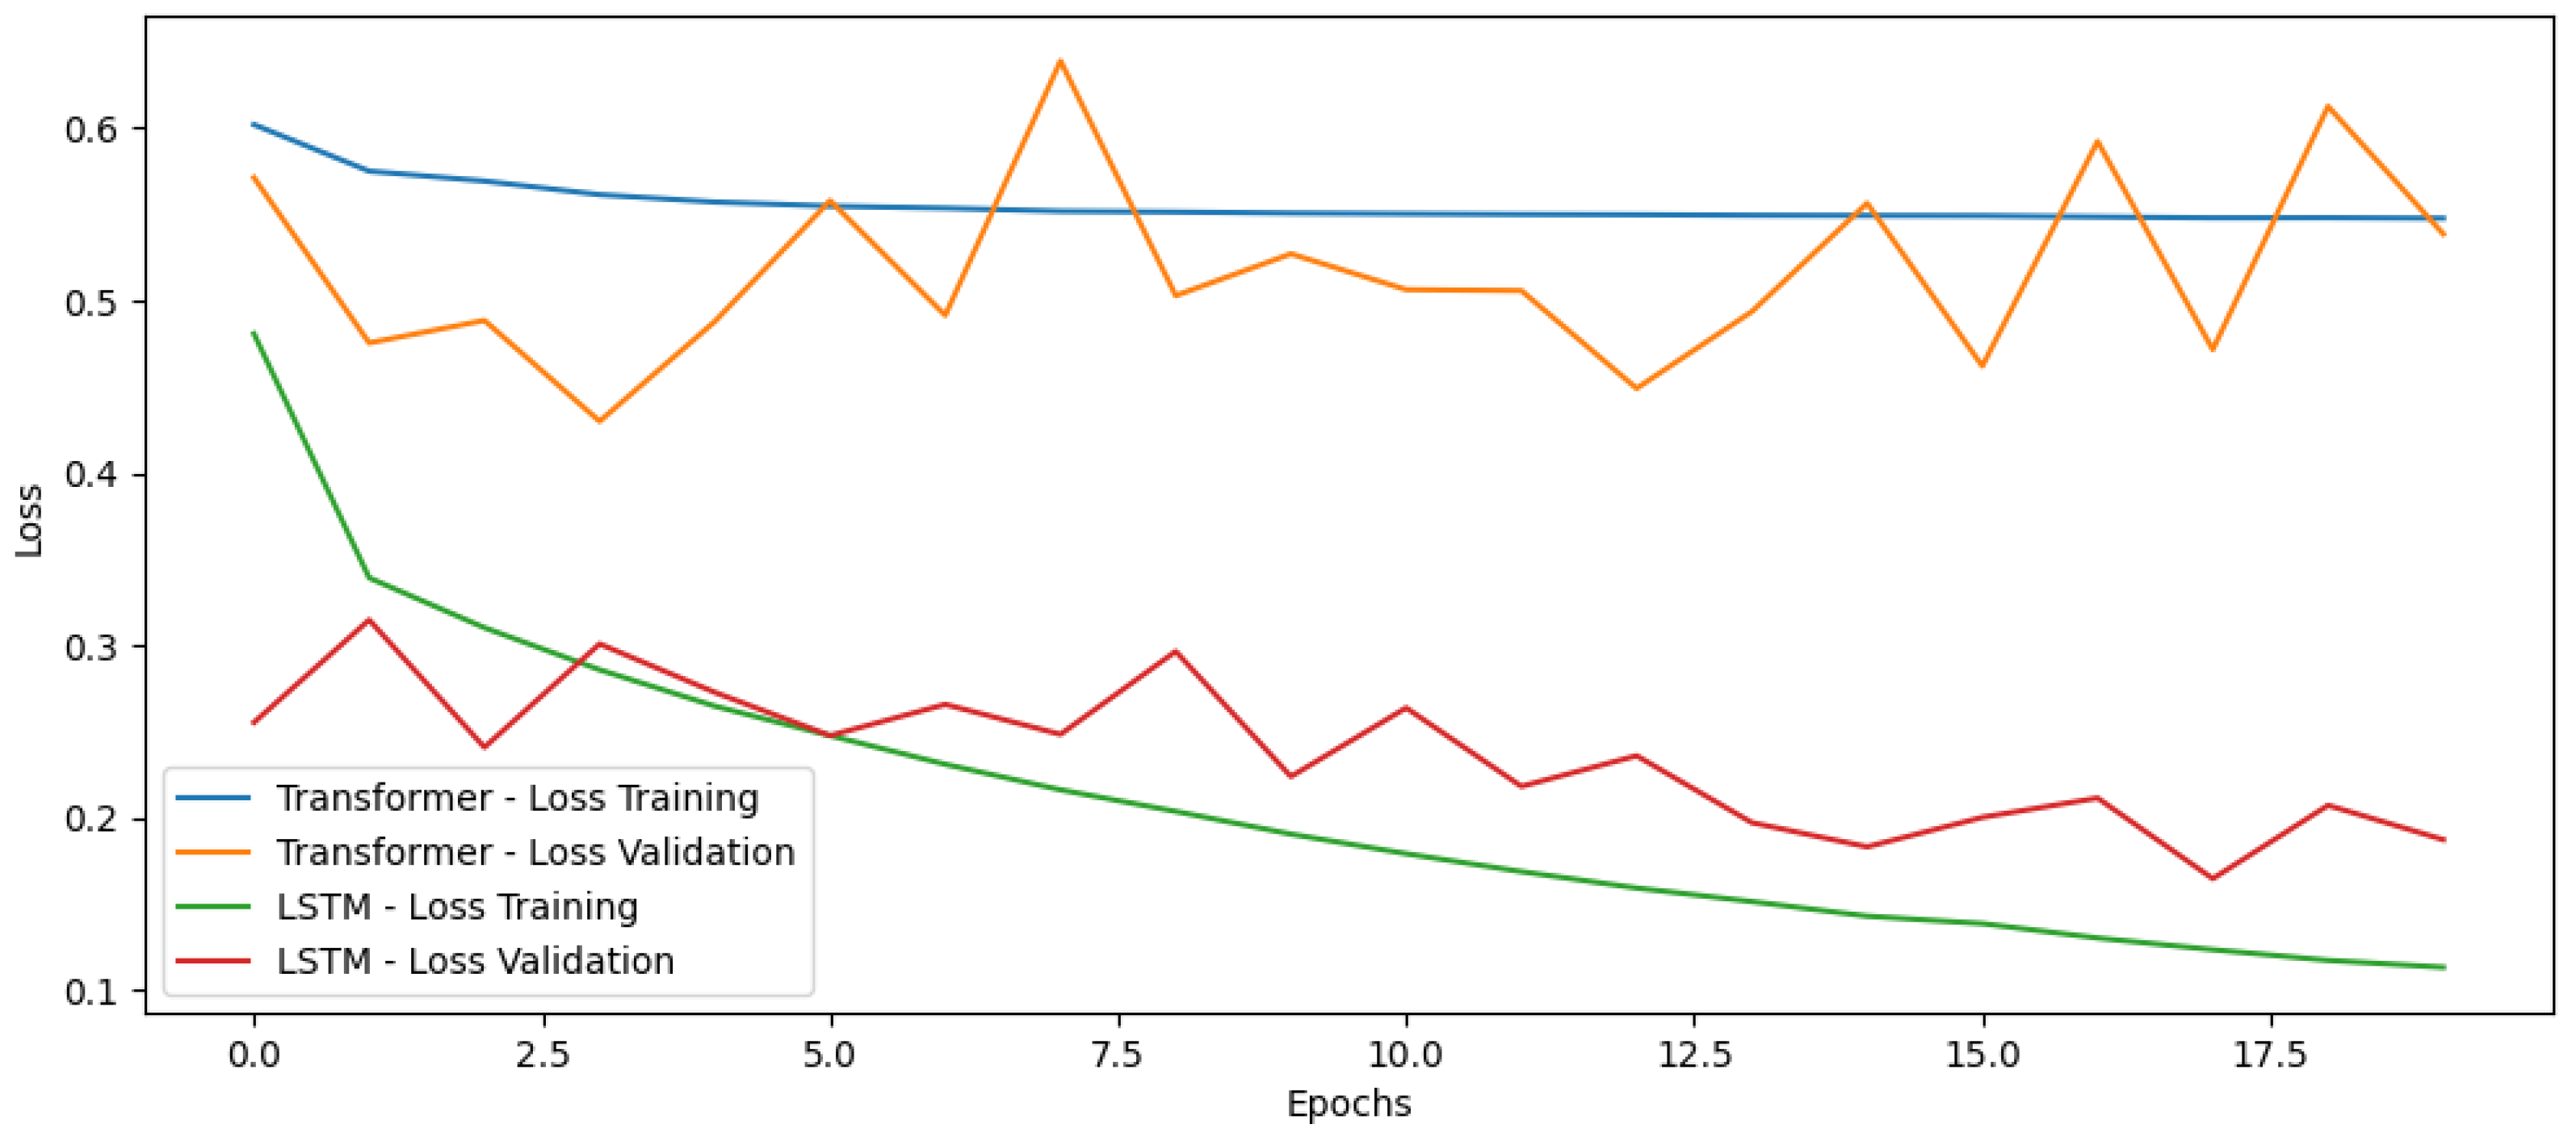
In the Transformer model, the training loss progressively decreases, but its descent slows down after a few epochs. The validation loss shows a more unstable trend, with fluctuations and an increase in the last epochs, which could indicate overfitting problems. In the LSTM model, the training loss decreases steadily throughout the epochs, indicating good convergence. The validation loss shows variations, but, in general, maintains a decreasing trend, although with some instability. The LSTM model shows greater stability in the reduction of loss in both training and validation, which suggests a better fit to the problem. In contrast, the Transformer model shows signs of overfitting, since the validation loss does not follow the same decreasing trend as the training loss (see Figure 9).
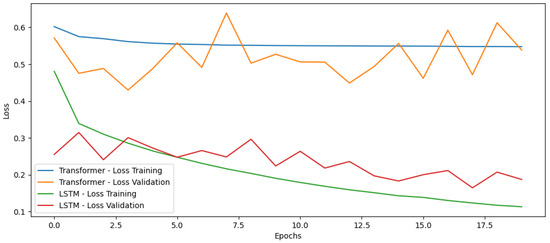
Figure 9.
Training loss of the Transformer and LSTM model.
Table 9 shows the evolution of training and validation losses for Transformer and LSTM models across 20 epochs. In the case of the Transformer model, the training loss remained relatively stable, decreasing slightly from 0.60 in epoch 1 to 0.54 in epoch 20. On the other hand, the validation loss fluctuated between 0.39 and 0.60, showing no clear trend of improvement, which suggests possible overfitting or instability in generalization. In contrast, the LSTM model presented a consistent decrease in training loss, from 0.47 in epoch 1 to 0.12 in epoch 20, indicating effective learning. Furthermore, the validation loss also showed a decreasing trend, albeit with some fluctuations, varying between 0.13 and 0.32, which suggests a better generalization capacity compared with the Transformer.
Table 9.
Training and validation losses for Transformer and LSTM models across epochs.
In general terms, the LSTM model demonstrated better performance in reducing losses in both training and validation, with a more pronounced and stable decrease. Meanwhile, the Transformer model, although showing a slight improvement in training loss, presented greater fluctuations in validation loss, which could indicate difficulties in generalizing. In conclusion, the LSTM exhibited a more stable and consistent behavior across epochs, while the Transformer showed some instability in validation, suggesting that LSTM might be more suitable for this specific task.
In the case of the Transformer model, the training accuracy remained relatively stable, with an initial value of 0.69 in epoch 1 and reaching 0.74 from epoch 4 onwards, where it stabilized. However, the validation accuracy fluctuated between 0.67 and 0.85, showing no clear trend of improvement, which suggests some instability in generalization. On the other hand, the LSTM model showed a consistent increase in training accuracy, starting at 0.76 in epoch 1 and reaching 0.95 in epoch 20, indicating effective learning. Furthermore, the validation accuracy also showed a high and stable performance, varying between 0.90 and 0.97, with a general trend towards improvement.
In general terms, the LSTM model demonstrated superior performance in terms of accuracy, in both training and validation, with a consistent improvement and higher values compared with the Transformer. Meanwhile, the Transformer model, although maintaining stable training accuracy, presented significant fluctuations in validation accuracy, which could indicate difficulties in generalizing. In conclusion, the LSTM showed more consistent and effective behavior in terms of accuracy, in both training and validation, while the Transformer showed some instability in validation, suggesting that the LSTM might be more suitable for this specific task (see Table 10).
Table 10.
Evolution of training and validation accuracy for Transformer and LSTM models across epochs.
In the case of the Transformer model, the loss was 0.48, which indicates a moderate error in the predictions. Additionally, the accuracy reached a value of 0.79, showing acceptable performance in classification. However, the precision was 0.10, which suggests a low ability to correctly identify positive cases. On the other hand, the recall was 0.65, indicating a moderate ability to detect positive cases, while the F1-score was 0.17, reflecting a poor balance between precision and recall. Finally, the MSE and RMSE were 0.21 and 0.46, respectively, showing a relatively high mean squared error.
In contrast, the LSTM model presented a loss of 0.21, which indicates a significantly lower error compared with the Transformer. The accuracy was 0.93, demonstrating excellent performance in classification. Likewise, the precision improved to 0.29, which reflects a greater ability to correctly identify positive cases. The recall was 0.71, showing a greater ability to detect positive cases, and the F1-score was 0.42, reflecting a better balance between precision and recall. Furthermore, the MSE and RMSE were 0.07 and 0.26, respectively, indicating a much lower mean squared error (see Table 11).
Table 11.
Comparison of performance metrics between Transformer and LSTM models.
In the comparison of accuracy, the LSTM model shows significantly higher accuracy compared with the Transformer. While the accuracy of the LSTM approaches 0.8, that of the Transformer is notably lower, indicating inferior performance in this metric. Furthermore, in the comparison of the pseudo metric, the LSTM also outperforms the Transformer, presenting higher and more consistent values, which reinforces its effectiveness in the evaluated task.
Regarding the mean squared error (MSE), the LSTM has a lower MSE than the Transformer, indicating a smaller error in predictions. Conversely, the Transformer shows a higher MSE, suggesting inferior performance in terms of predictive accuracy. Finally, in all compared metrics (accuracy, pseudo, and MSE), the LSTM model outperforms the Transformer, demonstrating superior performance in the prediction task. This general trend confirms that LSTM is a more suitable and effective option for this type of application (see Figure 10).
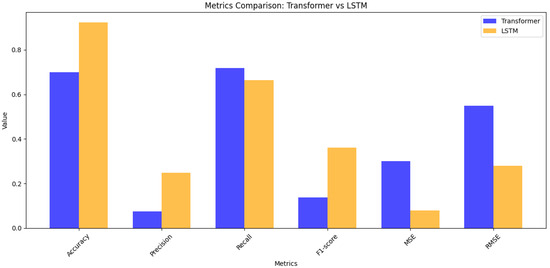
Figure 10.
Performance Comparison Between Transformer and LSTM Models in Terms of Evaluation Metrics.
5. Discussion
The initial research question focuses on determining which machine learning model, between Transformer and LSTM, is most effective in predicting real-time vehicular congestion, using metrics such as precision, recall, F1-score, and mean squared error (MSE). In a context of increasing urbanization and a growing number of vehicles, the need for advanced traffic management systems is highlighted, where machine learning (ML) emerges as a promising tool to address complex problems such as congestion prediction in urban intersections. However, although machine learning offers innovative solutions, its implementation in real urban environments can face challenges such as the availability of high-quality data and adaptability to dynamic conditions. To address these challenges, the use of advanced ML models, such as Transformer and LSTM, is proposed to improve accuracy in congestion prediction, integrating real-time data and robust metrics to evaluate their performance.
A simulation platform has proven to be fundamental in analyzing traffic patterns and evaluating management strategies. In this study, an urban segment with high vehicular density and complex intersections was selected, allowing the collection of key empirical data, such as average speeds and traffic conditions, essential for training machine learning models. Studies like [43] emphasize that the fidelity of data generated in simulations depend on their realism. However, the quality of simulated data may not fully reflect real-world traffic dynamics, which could limit the effectiveness of trained models.
The approach based on the analysis of average speeds per time interval and lane proved effective in identifying congestion situations. A speed threshold of 10 km/h was used to classify road segments as congested. These data, processed using clustering techniques and supervised labeling, were integrated into robust datasets for training predictive models. According to [44], the combination of these data with ML algorithms improves early detection of congestion. However, the use of a fixed speed threshold may not be sufficient to capture the complexity of congestion in different urban contexts.
In the results obtained, the LSTM model outperformed the Transformer in all evaluated metrics, showing superior performance in precision, recall, F1-score, and errors (MSE and RMSE). The Transformer, although it had acceptable performance in accuracy, showed limitations in identifying positive cases (precision) and in the balance between precision and recall (F1-score). Studies like [1] suggest that, in scenarios with imbalanced data, techniques such as oversampling or cost-sensitive learning are useful to mitigate biases. Therefore, it is proposed to use data balancing techniques, such as SMOTE, and adjust the models to improve their generalization ability in imbalanced scenarios.
The models can include additional factors, such as weather conditions, peak hours, and historical traffic patterns, improving the accuracy of predictions [45]. Additionally, the algorithms can dynamically adjust to new traffic conditions, allowing real-time predictions and the identification of congestion patterns to propose solutions such as alternative routes or adaptive traffic signal control. However, the inclusion of multiple factors can increase model complexity and require greater computational resources. To address this problem, it is suggested to optimize the models using feature selection techniques and the use of specialized hardware to handle computational complexity.
The representativeness of the data used to train the models is key to the accuracy of predictions. Greater integration with IoT sensors could improve the quality and variety of data. The adaptation of the model to larger and more complex urban networks represents a significant challenge, where techniques such as federated learning could facilitate large-scale distributed analysis. Although simulations are useful, they should be complemented with tests in real scenarios to evaluate the practical applicability of the proposed solutions [46]. The dependence on simulations can limit the generalization of models to real environments, especially in cities with unique infrastructures and traffic dynamics. Therefore, it is recommended to combine simulations with real data and use federated learning techniques to scale the models to larger urban networks, ensuring their applicability in diverse contexts.
6. Conclusions
This research evaluated the application of machine learning to the analysis of Vehicular Ad Hoc Network (VANET) data to predict vehicular congestion in urban intersections with high accuracy. In this regard, the implemented simulation model, based on a representative urban segment, proved to be an effective tool for collecting the empirical data necessary for the analysis and validation of traffic management strategies. Specifically, the selection of the road segment between PUCESE and the Multiplaza Shopping Center provided a realistic and complex scenario, essential for evaluating the performance of vehicular communication algorithms and protocols.
Furthermore, the use of average speed thresholds (<10 km/h) to identify vehicular congestion resulted in an efficient methodology for generating useful datasets for predictive models. This approach, although simplified, proved to be robust by allowing the early detection of traffic hotspots, which supports its feasibility for continuous monitoring and the implementation of proactive solutions. The choice of this threshold was based on previous studies indicating that speeds below 10 km/h are indicative of congestion in urban environments. However, it is recognized that this threshold could be adjusted based on the specific characteristics of each city or region, allowing for greater adaptability of the model to different urban contexts.
Regarding the model’s performance, the LSTM model achieved outstanding metrics, with a loss of 0.21, an accuracy of 0.93, a precision of 0.29, a recall of 0.71, an F1-score of 0.42, a mean squared error (MSE) of 0.07, and a root mean squared error (RMSE) of 0.26. These results indicate that the LSTM outperformed the Transformer in all evaluated metrics, showing superior performance in terms of accuracy, recall, F1-score, and errors (MSE and RMSE). The LSTM model demonstrated an exceptional ability to capture temporal patterns in the data, making it particularly suitable for real-time congestion prediction tasks. On the other hand, the Transformer, although showing acceptable performance in accuracy, presented limitations in identifying positive cases (precision) and in the balance between precision and recall (F1-score), suggesting that it may not be the best option for scenarios with imbalanced data.
Finally, it is concluded that neural networks are a powerful tool for integrating multiple variables, such as weather conditions and historical patterns, thereby improving the accuracy of predictions. Furthermore, these networks allow for dynamic adaptation to changing traffic conditions, facilitating real-time predictions. Finally, the models can propose intervention strategies, such as alternative routes or adaptive traffic signal control, contributing to more efficient urban traffic management. The ability of the models to identify congestion patterns and propose real-time solutions represents a significant advance in traffic management, allowing authorities to make informed and timely decisions to mitigate the negative effects of vehicular congestion. Additionally, the integration of emerging technologies, such as IoT sensors and federated learning, could further improve the accuracy and scalability of these models, facilitating their application in larger and more complex urban networks.
Supplementary Materials
The following supporting information can be downloaded at: https://drive.google.com/drive/folders/1f8yyXb8outUSntkP3nu_pm39SwaOgH5q?usp=drive_link, accessed on 13 March 2025.
Author Contributions
Project administration, W.C.; Software, P.B.; Conceptualization, J.E.; Methodology, P.A.; Investigation, J.S.; Software, A.F.; Validation, G.S. All authors have read and agreed to the published version of the manuscript.
Funding
This research received no external funding.
Data Availability Statement
All data and files related to the predictive models are available and organized in Supplementary Materials, In this repository, you will be able to access all the necessary information, including datasets, scripts, documentation, and any other relevant resources for the development and analysis of the models.
Acknowledgments
We express our sincere gratitude to Wilson Chango from PUCE Esmeraldas for his invaluable technical assistance and guidance in configuring the sensor systems and data acquisition processes for this research. This study was supported by PUCE Esmeraldas. Additionally, we acknowledge the facilities and general support provided by the Department of Computer Sciences, which greatly contributed to the successful completion of this work).
Conflicts of Interest
The authors declare that they have no conflicts of interest related to this article.
References
- Kumar, P.G.; Lekhana, P.; Tejaswi, M.; Chandrakala, S. Effects of vehicular emissions on the urban environment—A state of the art. Mater. Today Proc. 2021, 45, 6314–6320. [Google Scholar] [CrossRef]
- Chango, W.; Logroño, S.; Játiva, M.; Aguilar, P. Vehicular Ad-Hoc Network (VANET). Lect. Notes Netw. Syst. 2024, 870 LNNS, 160–176. [Google Scholar] [CrossRef]
- ul Hassan, M.; Al-Awady, A.A.; Ali, A.; Sifatullah; Akram, M.; Iqbal, M.M.; Khan, J.; Abdelrahman Ali, Y.A. ANN-Based Intelligent Secure Routing Protocol in Vehicular Ad Hoc Networks (VANETs) Using Enhanced AODV. Sensors 2024, 24, 818. [Google Scholar] [CrossRef]
- He, Y.; Huang, P.; Hong, W.; Luo, Q.; Li, L.; Tsui, K.L. In-Depth Insights into the Application of Recurrent Neural Networks (RNNs) in Traffic Prediction: A Comprehensive Review. Algorithms 2024, 17, 398. [Google Scholar] [CrossRef]
- Cárdenas, L.L.; Mezher, A.M.; Barbecho Bautista, P.A.; Astudillo León, J.P.; Igartua, M.A. A Multimetric Predictive ANN-Based Routing Protocol for Vehicular Ad Hoc Networks. IEEE Access 2021, 9, 86037–86053. [Google Scholar] [CrossRef]
- Molina-Campoverde, J.J.; Rivera-Campoverde, N.; Molina Campoverde, P.A.; Bermeo Naula, A.K. Urban Mobility Pattern Detection: Development of a Classification Algorithm Based on Machine Learning and GPS. Sensors 2024, 24, 3884. [Google Scholar] [CrossRef]
- Shuvro, A.A.; Khan, M.S.; Rahman, M.; Hussain, F.; Moniruzzaman, M.; Hossen, M.S. Transformer Based Traffic Flow Forecasting in SDN-VANET. IEEE Access 2023, 11, 41816–41826. [Google Scholar] [CrossRef]
- Costa, V.G.; Pedreira, C.E. Recent advances in decision trees: An updated survey. Artif. Intell. Rev. 2022, 56, 4765–4800. [Google Scholar] [CrossRef]
- Paiva, S.; Ahad, M.A.; Tripathi, G.; Feroz, N.; Casalino, G. Enabling Technologies for Urban Smart Mobility: Recent Trends, Opportunities and Challenges. Sensors 2021, 21, 2143. [Google Scholar] [CrossRef]
- Faheem, H.B.; Shorbagy, A.M.E.; Gabr, M.E. Impact Of Traffic Congestion on Transportation System: Challenges and Remediations—A review. Mansoura Eng. J. 2024, 49, 18. [Google Scholar] [CrossRef]
- Ali, Y.; Rafay, M.; Khan, R.D.A.; Sorn, M.K.; Jiang, H.; Ali, Y.; Rafay, M.; Khan, R.D.A.; Sorn, M.K.; Jiang, H. Traffic Problems in Dhaka City: Causes, Effects, and Solutions (Case Study to Develop a Business Model). Open Access Libr. J. 2023, 10, e9994. [Google Scholar] [CrossRef]
- Musa, A.A.; Malami, S.I.; Alanazi, F.; Ounaies, W.; Alshammari, M.; Haruna, S.I. Sustainable Traffic Management for Smart Cities Using Internet-of-Things-Oriented Intelligent Transportation Systems (ITS): Challenges and Recommendations. Sustainability 2023, 15, 9859. [Google Scholar] [CrossRef]
- Hosseinian, S.M.; Mirzahossein, H. Efficiency and Safety of Traffic Networks Under the Effect of Autonomous Vehicles. Iran. J. Sci. Technol.-Trans. Civ. Eng. 2024, 48, 1861–1885. [Google Scholar] [CrossRef]
- Laanaoui, M.D.; Lachgar, M.; Mohamed, H.; Hamid, H.; Villar, S.G.; Ashraf, I. Enhancing Urban Traffic Management Through Real-Time Anomaly Detection and Load Balancing. IEEE Access 2024, 12, 63683–63700. [Google Scholar] [CrossRef]
- Aouedi, O.; Vu, T.H.; Sacco, A.; Nguyen, D.C.; Piamrat, K.; Marchetto, G.; Pham, Q.V. A Survey on Intelligent Internet of Things: Applications, Security, Privacy, and Future Directions. IEEE Commun. Surv. Tutor. 2024, early access. [Google Scholar] [CrossRef]
- Tshibangu-Muabila, J.; Mouelhi, S.; Leserf, P.; Ramdane-Cherif, A. Refining SUMO Simulation Strategies for Realistic Traffic Patterns: Insights from Field Experience. In Proceedings of the 2023 7th International Conference on System Reliability and Safety, ICSRS 2023, Bologna, Italy, 22–24 November 2023; pp. 237–246. [Google Scholar] [CrossRef]
- Sun, S.; Yan, H.; Lang, Z. A study on traffic congestion prediction based on random forest model. Highlights Sci. Eng. Technol. 2024, 101, 738–749. [Google Scholar] [CrossRef]
- Majumdar, S.; Subhani, M.M.; Roullier, B.; Anjum, A.; Zhu, R. Congestion prediction for smart sustainable cities using IoT and machine learning approaches. Sustain. Cities Soc. 2021, 64, 102500. [Google Scholar] [CrossRef]
- Blanka, C.; Krumay, B.; Rueckel, D. The interplay of digital transformation and employee competency: A design science approach. Technol. Forecast. Soc. Chang. 2022, 178, 121575. [Google Scholar] [CrossRef]
- Zounemat-Kermani, M.; Batelaan, O.; Fadaee, M.; Hinkelmann, R. Ensemble machine learning paradigms in hydrology: A review. J. Hydrol. 2021, 598, 126266. [Google Scholar] [CrossRef]
- Schjerven Id, F.E.; Lindseth, F.; Steinsland, I. Prognostic risk models for incident hypertension: A PRISMA systematic review and meta-analysis. PLoS ONE 2024, 19, e0294148. [Google Scholar] [CrossRef]
- Naqvi, S.B.; Ayton, L.J. A Periodic Extension to the Fokas Method for Acoustic Scattering by an Infinite Grating. Acoustics 2025, 7, 5. [Google Scholar] [CrossRef]
- Angarita-Zapata, J.S.; Maestre-Gongora, G.; Calderín, J.F. A Bibliometric Analysis and Benchmark of Machine Learning and AutoML in Crash Severity Prediction: The Case Study of Three Colombian Cities. Sensors 2021, 21, 8401. [Google Scholar] [CrossRef]
- Abbasi, E.; Alavi Moghaddam, M.R.; Kowsari, E. A systematic and critical review on development of machine learning based-ensemble models for prediction of adsorption process efficiency. J. Clean. Prod. 2022, 379, 134588. [Google Scholar] [CrossRef]
- Page, M.J.; Moher, D.; Bossuyt, P.M.; Boutron, I.; Hoffmann, T.C.; Mulrow, C.D.; Shamseer, L.; Tetzlaff, J.M.; Akl, E.A.; Brennan, S.E.; et al. PRISMA 2020 explanation and elaboration: Updated guidance and exemplars for reporting systematic reviews. BMJ 2021, 372, n160. [Google Scholar] [CrossRef]
- Ulvi, H.; Yerlikaya, M.A.; Yildiz, K. Urban Traffic Mobility Optimization Model: A Novel Mathematical Approach for Predictive Urban Traffic Analysis. Appl. Sci. 2024, 14, 5873. [Google Scholar] [CrossRef]
- Stan, I.; Ghere, D.A.; Dan, P.I.; Potolea, R. Urban Congestion Avoidance Methodology Based on Vehicular Traffic Thresholding. Appl. Sci. 2023, 13, 2143. [Google Scholar] [CrossRef]
- Ahmed, M.A.; Shariff, A.R.M.; Abubakar, S. Long Term Traffic Congestion Detection Method Based on Speed-Threshold. In Lecture Notes in Computer Science (Including Subseries Lecture Notes in Artificial Intelligence and Lecture Notes in Bioinformatics); Springer: Cham, Switzerland, 2025; Volume 15427 LNCS, pp. 25–39. [Google Scholar] [CrossRef]
- Mohanty, A.; Mohanty, S.K.; Jena, B.; Mohapatra, A.G.; Rashid, A.N.; Khanna, A.; Gupta, D. Identification and evaluation of the effective criteria for detection of congestion in a smart city. IET Commun. 2022, 16, 560–570. [Google Scholar] [CrossRef]
- Hussain, S.; Munir, U.; Chaudhry, M.S. Visualizing Impact of Weather on Traffic Congestion Prediction: A Quantitative Study. Int. J. Innov. Sci. Technol. 2022, 3, 210–222. [Google Scholar] [CrossRef]
- Cao, K.; Zhang, T.; Huang, J. Advanced hybrid LSTM-transformer architecture for real-time multi-task prediction in engineering systems. Sci. Rep. 2024, 14, 4890. [Google Scholar] [CrossRef]
- Bayasgalan, O.; Adiyabat, A.; Otani, K.; Hashimoto, J.; Akisawa, A. A High-Resolution Satellite-Based Solar Resource Assessment Method Enhanced with Site Adaptation in Arid and Cold Climate Conditions. Energies 2024, 17, 6433. [Google Scholar] [CrossRef]
- Chiabaut, N.; Faitout, R. Traffic congestion and travel time prediction based on historical congestion maps and identification of consensual days. Transp. Res. Part C Emerg. Technol. 2021, 124, 102920. [Google Scholar] [CrossRef]
- Lee, E.H.; Lee, E. Congestion boundary approach for phase transitions in traffic flow. Transp. B Transp. Dyn. 2024, 12, 2379377. [Google Scholar] [CrossRef]
- Ul Abideen, Z.; Sun, X.; Sun, C. Traffic flow prediction: A 3D adaptive multi-module joint modeling approach integrating spatial-temporal patterns to capture global features. J. Forecast. 2024, 43, 2766–2791. [Google Scholar] [CrossRef]
- Elreedy, D.; Atiya, A.F.; Kamalov, F. A theoretical distribution analysis of synthetic minority oversampling technique (SMOTE) for imbalanced learning. Mach. Learn. 2024, 113, 4903–4923. [Google Scholar] [CrossRef]
- Alizadegan, H.; Rashidi Malki, B.; Radmehr, A.; Karimi, H.; Ilani, M.A. Comparative study of long short-term memory (LSTM), bidirectional LSTM, and traditional machine learning approaches for energy consumption prediction. Energy Explor. Exploit. 2025, 43, 281–301. [Google Scholar] [CrossRef]
- Choi, S.R.; Lee, M. Transformer Architecture and Attention Mechanisms in Genome Data Analysis: A Comprehensive Review. Biology 2023, 12, 1033. [Google Scholar] [CrossRef]
- Cano-Ortiz, S.; Pascual-Muñoz, P.; Castro-Fresno, D. Machine learning algorithms for monitoring pavement performance. Autom. Constr. 2022, 139, 104309. [Google Scholar] [CrossRef]
- Fadhel, M.A.; Duhaim, A.M.; Saihood, A.; Sewify, A.; Al-Hamadani, M.N.; Albahri, A.S.; Alzubaidi, L.; Gupta, A.; Mirjalili, S.; Gu, Y. Comprehensive systematic review of information fusion methods in smart cities and urban environments. Inf. Fusion 2024, 107, 102317. [Google Scholar] [CrossRef]
- Shen, Y.; Jiang, S.; Chen, Y.; Yang, E.; Jin, X.; Fan, Y.; Campbell, K.D. To Explain or Not to Explain: A Study on the Necessity of Explanations for Autonomous Vehicles. arXiv 2020, arXiv:2006.11684. [Google Scholar]
- Feroz Khan, A.B.; Ivan, P. Integrating Machine Learning and Deep Learning in Smart Cities for Enhanced Traffic Congestion Management: An Empirical Review. J. Urban Dev. Manag. 2023, 2, 211–221. [Google Scholar] [CrossRef]
- Somanath, S.; Naserentin, V.; Eleftheriou, O.; Sjölie, D.; Wästberg, B.S.; Logg, A. Towards Urban Digital Twins: A Workflow for Procedural Visualization Using Geospatial Data. Remote Sens. 2024, 16, 1939. [Google Scholar] [CrossRef]
- Berhanu, Y.; Alemayehu, E.; Schröder, D. Examining Car Accident Prediction Techniques and Road Traffic Congestion: A Comparative Analysis of Road Safety and Prevention of World Challenges in Low-Income and High-Income Countries. J. Adv. Transp. 2023, 2023, 6643412. [Google Scholar] [CrossRef]
- Shaygan, M.; Meese, C.; Li, W.; Zhao, X.G.; Nejad, M. Traffic prediction using artificial intelligence: Review of recent advances and emerging opportunities. Transp. Res. Part C Emerg. Technol. 2022, 145, 103921. [Google Scholar] [CrossRef]
- Fremont, D.J.; Kim, E.; Pant, Y.V.; Seshia, S.A.; Acharya, A.; Bruso, X.; Wells, P.; Lemke, S.; Lu, Q.; Mehta, S. Formal Scenario-Based Testing of Autonomous Vehicles: From Simulation to the Real World. In Proceedings of the 2020 IEEE 23rd International Conference on Intelligent Transportation Systems, ITSC 2020, Rhodes, Greece, 20–23 September 2020. [Google Scholar] [CrossRef]

Disclaimer/Publisher’s Note: The statements, opinions and data contained in all publications are solely those of the individual author(s) and contributor(s) and not of MDPI and/or the editor(s). MDPI and/or the editor(s) disclaim responsibility for any injury to people or property resulting from any ideas, methods, instructions or products referred to in the content. |
© 2025 by the authors. Licensee MDPI, Basel, Switzerland. This article is an open access article distributed under the terms and conditions of the Creative Commons Attribution (CC BY) license (https://creativecommons.org/licenses/by/4.0/).