Article

The Optimization of PID Controller and Color Filter Parameters with a Genetic Algorithm for Pineapple Tracking Using an ROS2 and MicroROS-Based Robotic Head

by
Carolina Maldonado-Mendez
1,
Sergio Fabian Ruiz-Paz
1,
Isaac Machorro-Cano
2,
Antonio Marin-Hernandez
3 and
Sergio Hernandez-Mendez
3,*
1
Ingeniería en Computación, Instituto de Agroingeniería, Universidad del Papaloapan, Loma Bonita C.P. 68400, Oaxaca, Mexico
2
Tuxtepec Campus, Universidad del Papaloapan, Circuito Central #200, Colonia Parque Industrial, San Juan Bautista Tuxtepec C.P. 68301, Oaxaca, Mexico
3
Artificial Intelligence Research Institute, Universidad Veracruzana, Calle Paseo No. 112, Colonia Nueva Xalapa, Xalapa C.P. 91097, Veracruz, Mexico
*
Author to whom correspondence should be addressed.
Computation 2025, 13(3), 69; https://doi.org/10.3390/computation13030069
Submission received: 31 January 2025 / Revised: 25 February 2025 / Accepted: 4 March 2025 / Published: 7 March 2025

Abstract

:
This work proposes a vision system mounted on the head of an omnidirectional robot to track pineapples and maintain them at the center of its field of view. The robot head is equipped with a pan–tilt unit that facilitates dynamic adjustments. The system architecture, implemented in Robot Operating System 2 (ROS2), performs the following tasks: it captures images from a webcam embedded in the robot head, segments the object of interest based on color, and computes its centroid. If the centroid deviates from the center of the image plane, a proportional–integral–derivative (PID) controller adjusts the pan–tilt unit to reposition the object at the center, enabling continuous tracking. A multivariate Gaussian function is employed to segment objects with complex color patterns, such as the body of a pineapple. The parameters of both the PID controller and the multivariate Gaussian filter are optimized using a genetic algorithm. The PID controller receives as input the (x, y) positions of the pan–tilt unit, obtained via an embedded board and MicroROS, and generates control signals for the servomotors that drive the pan–tilt mechanism. The experimental results demonstrate that the robot successfully tracks a moving pineapple. Additionally, the color segmentation filter can be further optimized to detect other textured fruits, such as soursop and melon. This research contributes to the advancement of smart agriculture, particularly for fruit crops with rough textures and complex color patterns.

1. Introduction

In recent years, research on robotics has expanded significantly across various domains, including education [1], medicine [2], entertainment [3], human–computer interaction [4], among others [5,6]. Autonomous robots interact with their environment using vision systems to detect and track objects of interest. Some applications are autonomous driving [7], precision agriculture [8] or industry automation [9].
In precision agriculture, object detection and tracking are essential techniques for crop and livestock management, resource allocation optimization, and crop health assessment. These methods enable the accurate monitoring and inspection of identified items, contributing to improvements in logistics and supply chain management. Various fruits, including apples, oranges, lemons, avocados, peaches, citrus, apples, mangoes, and tomatoes, have been detected and monitored [10]. However, the fruits analyzed in the reviewed works predominantly exhibit a single hue or smooth textures.
The use of robots in agriculture has also increased in fruit harvesting tasks [11]. For example, robots are used to detect lettuce in order to regulate the application of chemicals. The lettuce leaves are green in color, and it is proposed to detect other vegetables such as broccoli or sugar beat [12]. To detect and track objects by color, adaptive filters are used. The centroid and area of the object are calculated, and the change in the centroid is used to adjust the speed of the robot to follow the object [13]. Among the sensors used for capturing visual information is the Kinect. With this sensor, the color and depth information of the object of interest is obtained to control the movement of the robot with two proportional–integer (PI) controllers, which are tuned for trial and error [14].
The YOLO framework [15] is used for detecting objects of interest. This model is pre-trained on the Microsoft COCO (Common Objects in Context) dataset. This dataset includes 80 object categories, including images of uniformly colored fruits like oranges, apples, and bananas. However, to enable YOLO to recognize fruits with rough textures and complex color patterns, such as pineapples, additional training is required. Effective training demands a dataset containing at least 500 annotated images, where each instance of the target object is labeled with bounding boxes to ensure accurate detection. In ref. [16] YOLO was trained to recognize strawberries, using a dataset of 2177 images for training and 545 images for testing. The annotation files were generated in TXT format.
In object tracking, the vision system is mounted on a pan–tilt unit to dynamically adjust the direction of the field of view, thereby extending the tracking range. A control technique is essential for smooth tracking, ensuring that the object of interest remains within the field of view without being lost during movement [17].
The proportional–integer–derivative (PID) controller has been widely used in applications for object tracking. In [18], the authors performed a predictive control model to move the angle and tilt of a pan–tilt unit in face tracking. The model parameters were optimized to improve its performance. The PID controller must be properly tuned to ensure smooth adjustments in the presence of disturbances and to minimize error.
Among the methods for tuning the PID controller is the Ziegler–Nichols method, which was used in [19] to track faces. The results demonstrated that the system can track and maintain a static face at the center of the image, whether the pan or tilt axis of the pan–tilt unit is controlled. In ref. [20], the PID controller parameters were tuned with a genetic algorithm to regulate the speed of an autonomous vehicle. The experiments revealed that optimizing the PID parameters through the genetic algorithm resulted in significant improvements in precision and adaptability, enhancing the vehicle’s ability to navigate real-world driving scenarios with greater stability. This highlights the potential application of such optimization techniques in the future of intelligent transportation.
A system for controlling the position of a drone using a PID controller is presented in [21]. This PID controller is tuned by particle swarm optimization based on genetic algorithms. The results demonstrate that the proposed control system can stably track both the position and angle of the drone, even in the presence of certain disturbances.
In industrial applications, PID controllers are often tuned using soft computing techniques, such as genetic algorithms or fuzzy logic [22,23]. Optimizing PID parameters using the Ziegler–Nichols method requires the mathematical model of the plant, and the method is based on trial and error. In contrast, fuzzy logic-based methods require defining a set of if–then rules. The response time depends on the number of rules, as each rule must be evaluated. Other optimization strategies include particle swarm optimization (PSO) and deep reinforcement learning (DRL). PSO [24] is inspired by the collective behavior of social animals. In this approach, a set of candidate solutions, referred to as a swarm of particles, flows through the search space, defining trajectories driven by their own performance as well as that of their neighbors. This technique requires defining the speed and inertia of particles, incorporating a cognitive component that allows particles to revert to previously discovered superior solutions, and including a social component that encourages collective movement toward optimal solutions. DRL [25] is based on reinforcement learning principles, utilizing agents and deep neural networks to learn optimal policies. The algorithm operates on a reward-based system, where agents transition between states while maximizing cumulative rewards through iterative learning processes. The genetic algorithm [26] is an adaptive search heuristic inspired by natural selection. It simulates evolutionary processes in which individuals compete for resources, with the fittest solutions prevailing over weaker ones. Similar to biological evolution, GA employs selection mechanisms for the mating, recombination, and mutation of genetic material to iteratively refine candidate solutions. This approach is particularly effective when the search space is large and conventional optimization techniques fail to yield competitive results. In this work, a GA was chosen as the optimization strategy due to its independence from prior knowledge of the plant’s mathematical model, its relatively simple implementation, and its proven effectiveness across various applications [27]. Furthermore, in a previous work [28], a PID controller was tuned to track people and detect falls using a vision system. The controller parameters were optimized both manually and through a genetic algorithm (GA). A comparative analysis of tracking performance for posture detection revealed that the controller exhibited fewer oscillations when using the parameters obtained through GA, demonstrating its effectiveness in improving system stability and accuracy. This prior success further supports its suitability for the present work.
In the robotics works reviewed, the Robot Operating System (ROS) is commonly utilized as a framework for robotic programming. ROS2 [29] is a middleware that offers essential packages for autonomous robots, including mapping, localization, and navigation, and tools for robotic development. ROS2 is designed to support real-time robotic systems, enhancing reliability and improving secure data communication [30]. In this paper, it is proposed a vision system mounted on the head of an omnidirectional robot Figure 1  to track objects of interest based on color feature.
The robot must locate the object, segment it, and calculate the (x, y) coordinates of the object’s centroid in the robot’s image plane. If the object is not centered, the pan–tilt unit (PTU) will be adjusted until the centroid is positioned at the center of the robot’s head image plane.
The pineapple has been selected as the object of interest due to its significant economic importance as a fruit crop in tropical regions. Major pineapple-producing countries include Thailand, the Philippines, Mexico, Costa Rica, Chile, Brazil, China, Indonesia, Hawaii, India, Bangladesh, Nigeria, Kenya, the Democratic Republic of the Congo, Ivory Coast, Guinea, the Dominican Republic, and South Africa. In 2012, global pineapple production reached 23.33 million metric tons, reflecting a steady increase from 2002 to 2012. Over the past two decades, the global pineapple market has expanded rapidly. Given this growth, assessing the status of pineapples through advanced image processing techniques is essential. These methods play a crucial role in agricultural management by enabling precise monitoring, measurement, and response to crop variability [31]. The application of advanced vision and artificial intelligence techniques in pineapple identification and harvesting can significantly enhance efficiency and facilitate harvesting tasks for farmers. Based on the reviewed literature, no works have been found that focus on the detection and monitoring of pineapples with textures that are rough and composed of different hues. To track an object of interest, it must first be segmented. While a color filter may be sufficient for segmenting the fruits reviewed in the state of the art (oranges, apples, bananas, among others), this approach was inadequate for pineapples due to the complex color composition and rough texture. Therefore, in this work, a multivariable Gaussian filter (MGF) was employed to segment the body of a pineapple, providing a more robust and accurate method for object identification. The filter parameters were optimized using 35 images. Additionally, a PID controller was implemented to adjust the motors of the pan–tilt unit (PTU), ensuring that the object of interest remained centered in the image plane during tracking.
The parameters of the MGF and the PID controller were optimized using a genetic algorithm (GA). In a real scenario, the pineapple remains in a fixed place, while the robot approaches it, maintaining the fruit within its field of view throughout the movement. The experimental results demonstrate that the robot successfully tracks a moving pineapple. Moreover, the findings of this study enable the robot to approach the pineapple without losing visual contact. This research contributes to precision agriculture by facilitating the automated monitoring of pineapple health with minimal human intervention.
This manuscript is organized as follows: Section 2 describes the proposed system for tracking color objects. Section 3 shows how the parameters of the MGF to segment the pineapple body and the PID controller are optimized with GA. After that, in Section 4, the experimental design and the results obtained are presented. In Section 5, a brief discussion is presented. Finally, Section 6 summarizes the findings of this research and sets up future work.

2. Proposed System

An architecture was implemented in ROS2 [32] to enable the omnidirectional robot’s head to track colored objects (Figure 2).
The architecture (Figure 3) consists of the following modules:
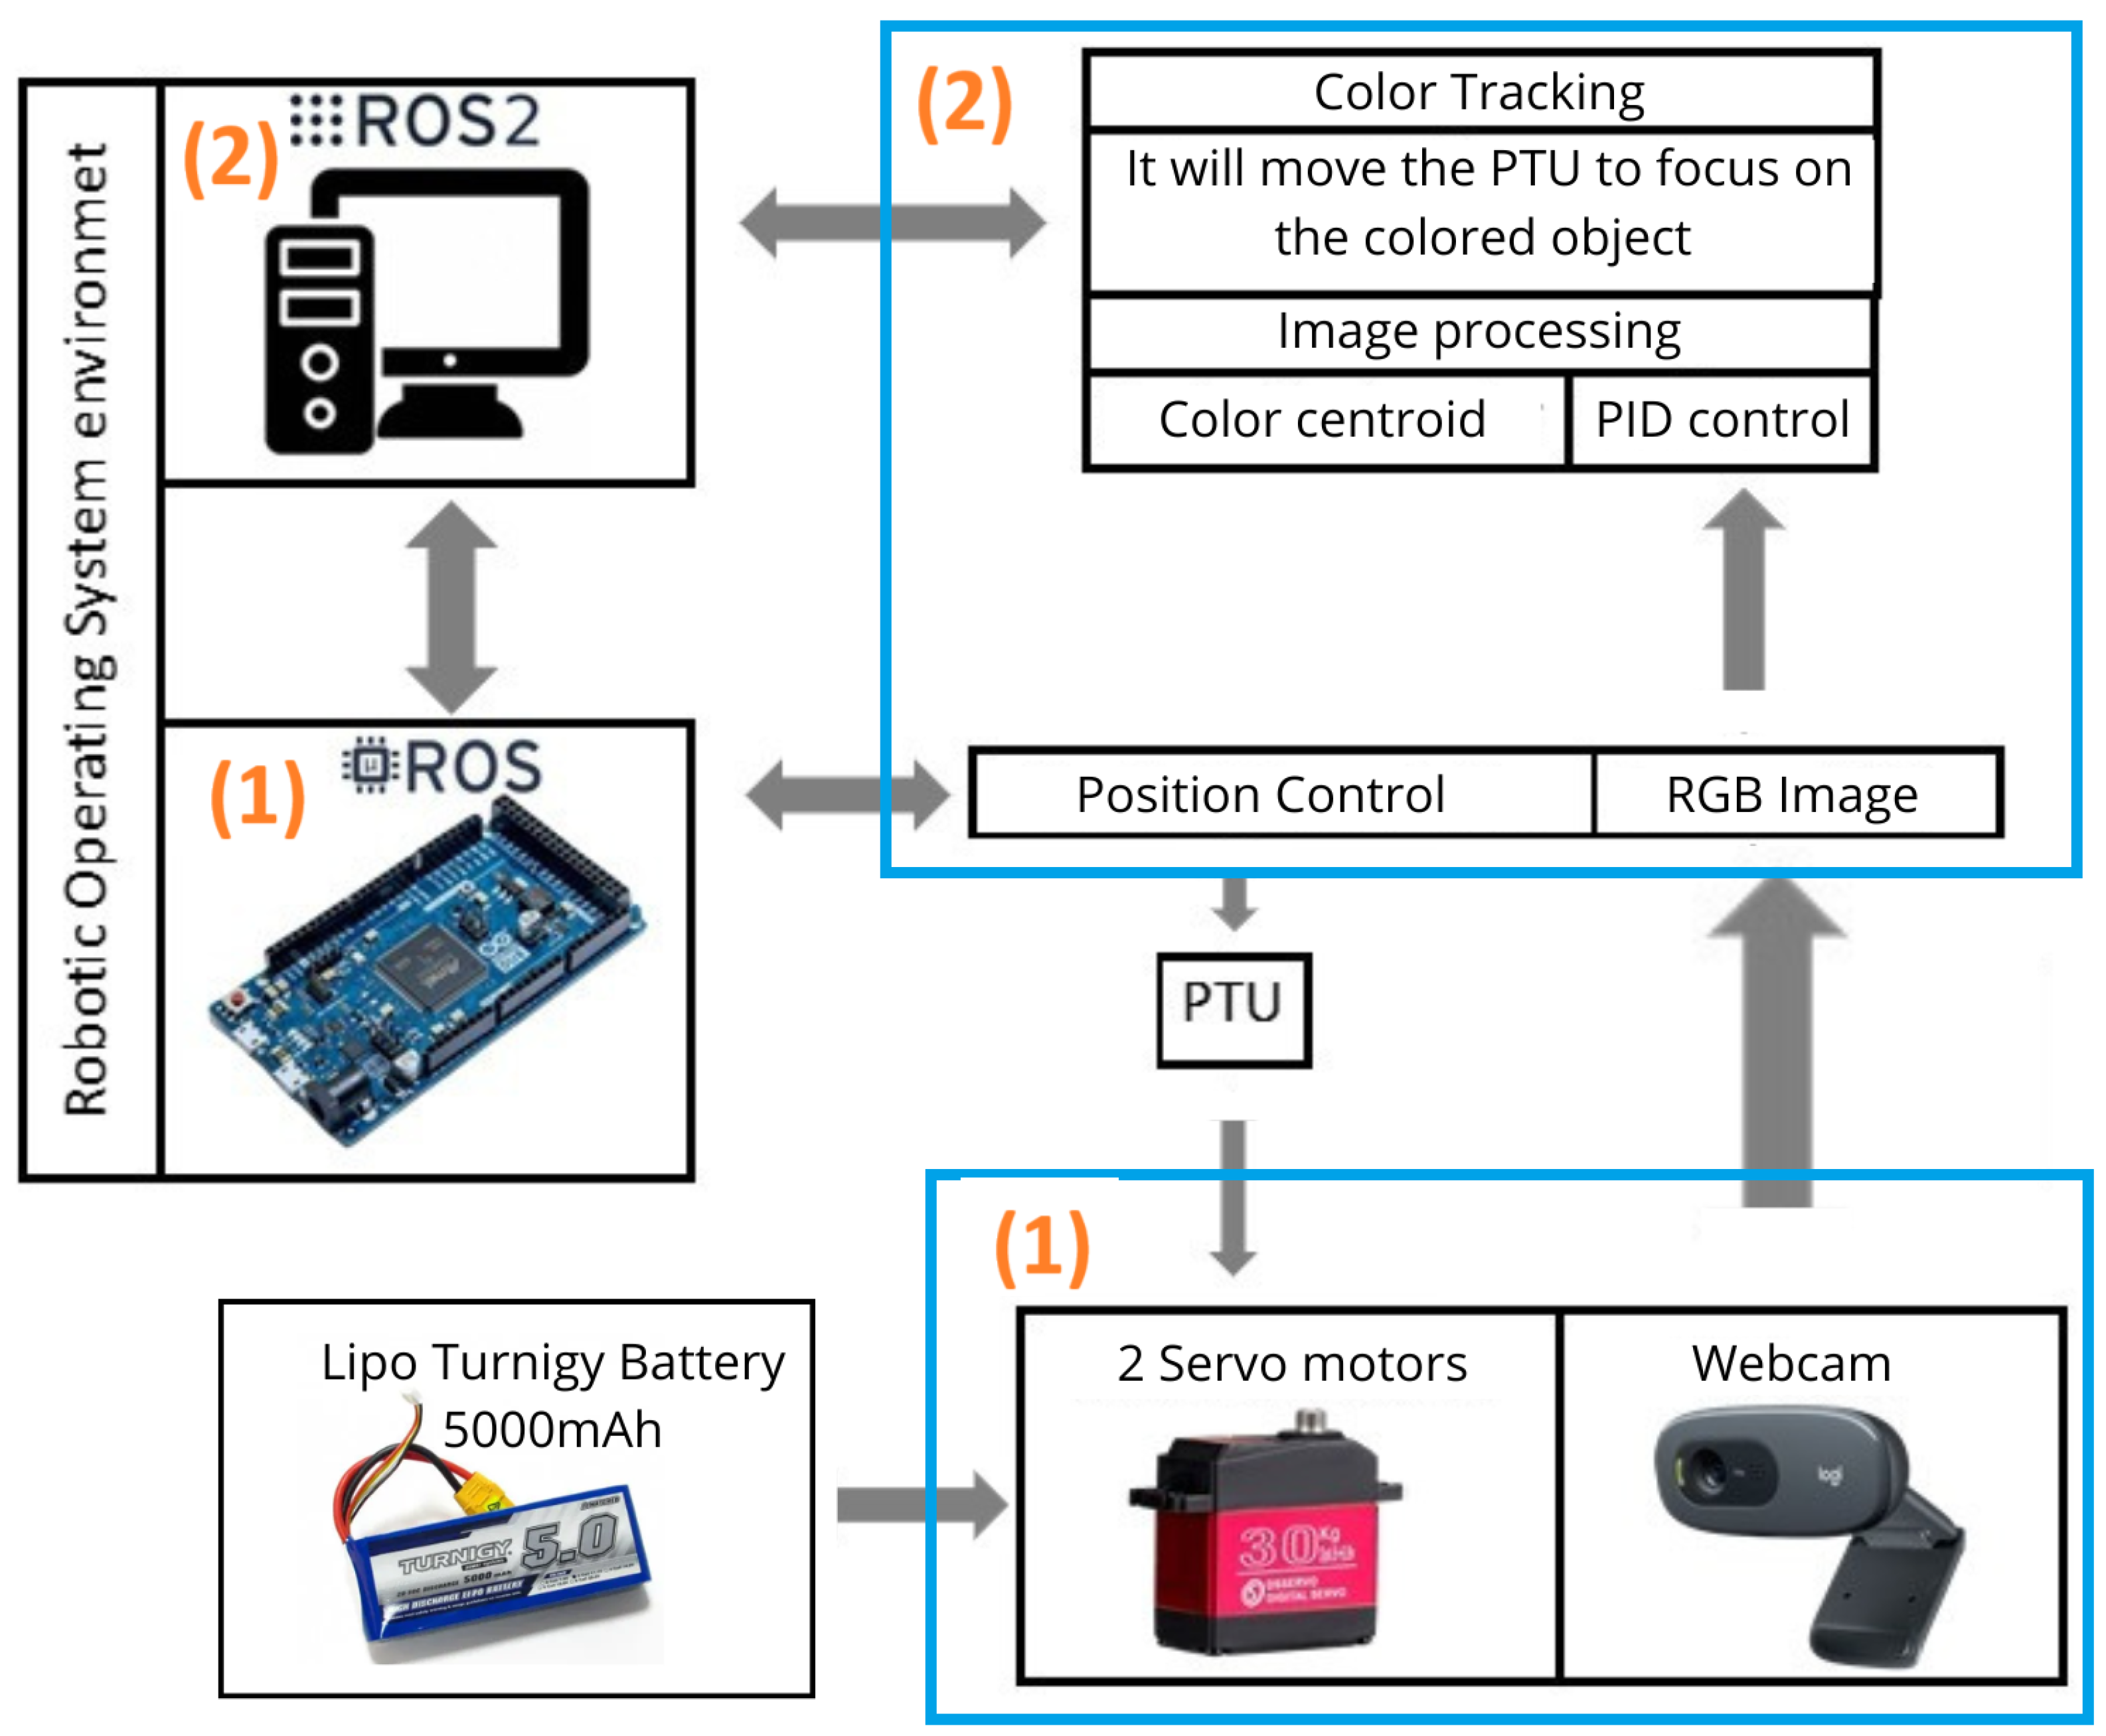
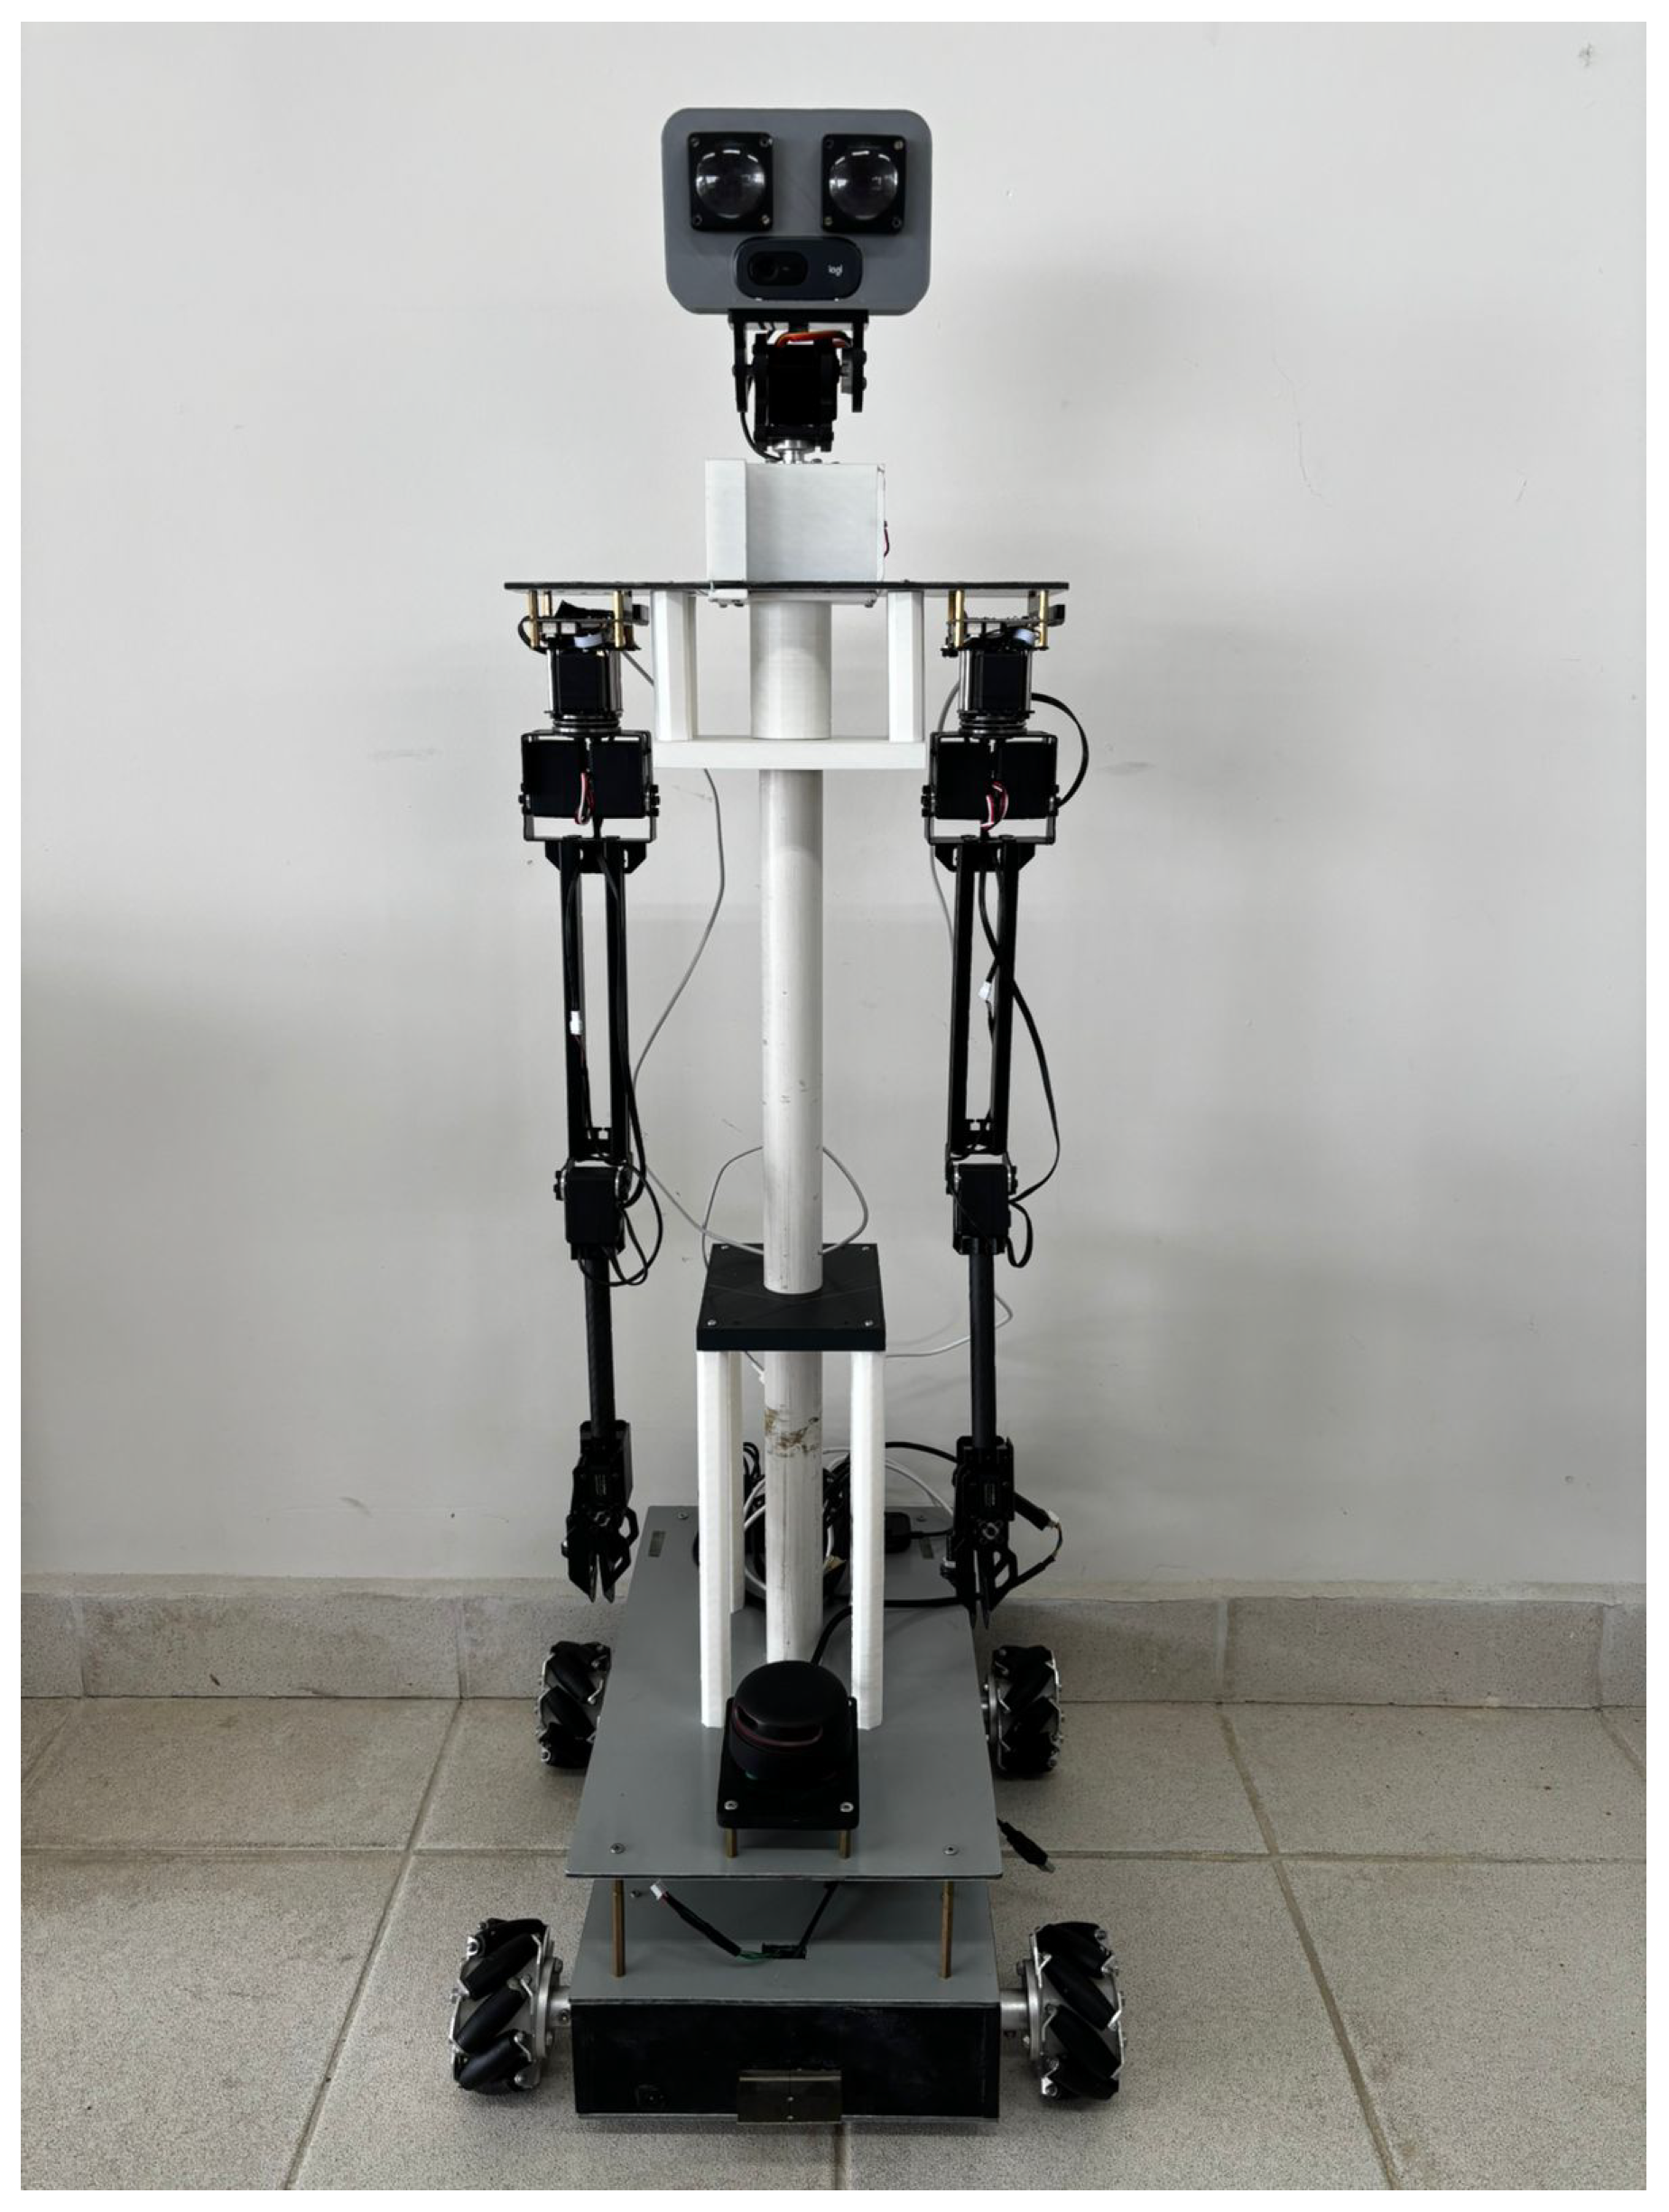
  • Hardware: This layer interfaces with the PTU and the webcam, both of which are part of the robot’s head, to capture the visual information and the angular position of the PTU in the x-y axes. The robot head (Figure 2) is a 3D-printed box with ABS material, containing the webcam, the PTU (Figure 2), and two servo motors. Additionally, it has two LED screens that display the animation of two human eyes. The Logitech C270 HD webcam, mounted on a pan–tilt unit, has a resolution of 1280 × 720 pixels and captures visual information at a maximum rate of 30 frames per second (FPS). The PTU was interfaced with a high-performance 32-bit ARM core Arduino Due microcontroller IT. The range of motion of the PTU is 180 degrees in the x-axis and 130 degrees in the y-axis. The servomotors used to drive the PTU are RDS5160 SSG, capable of a maximum torque of 7 Nm, with each motor powered by 8.4 V and 2.5 A.
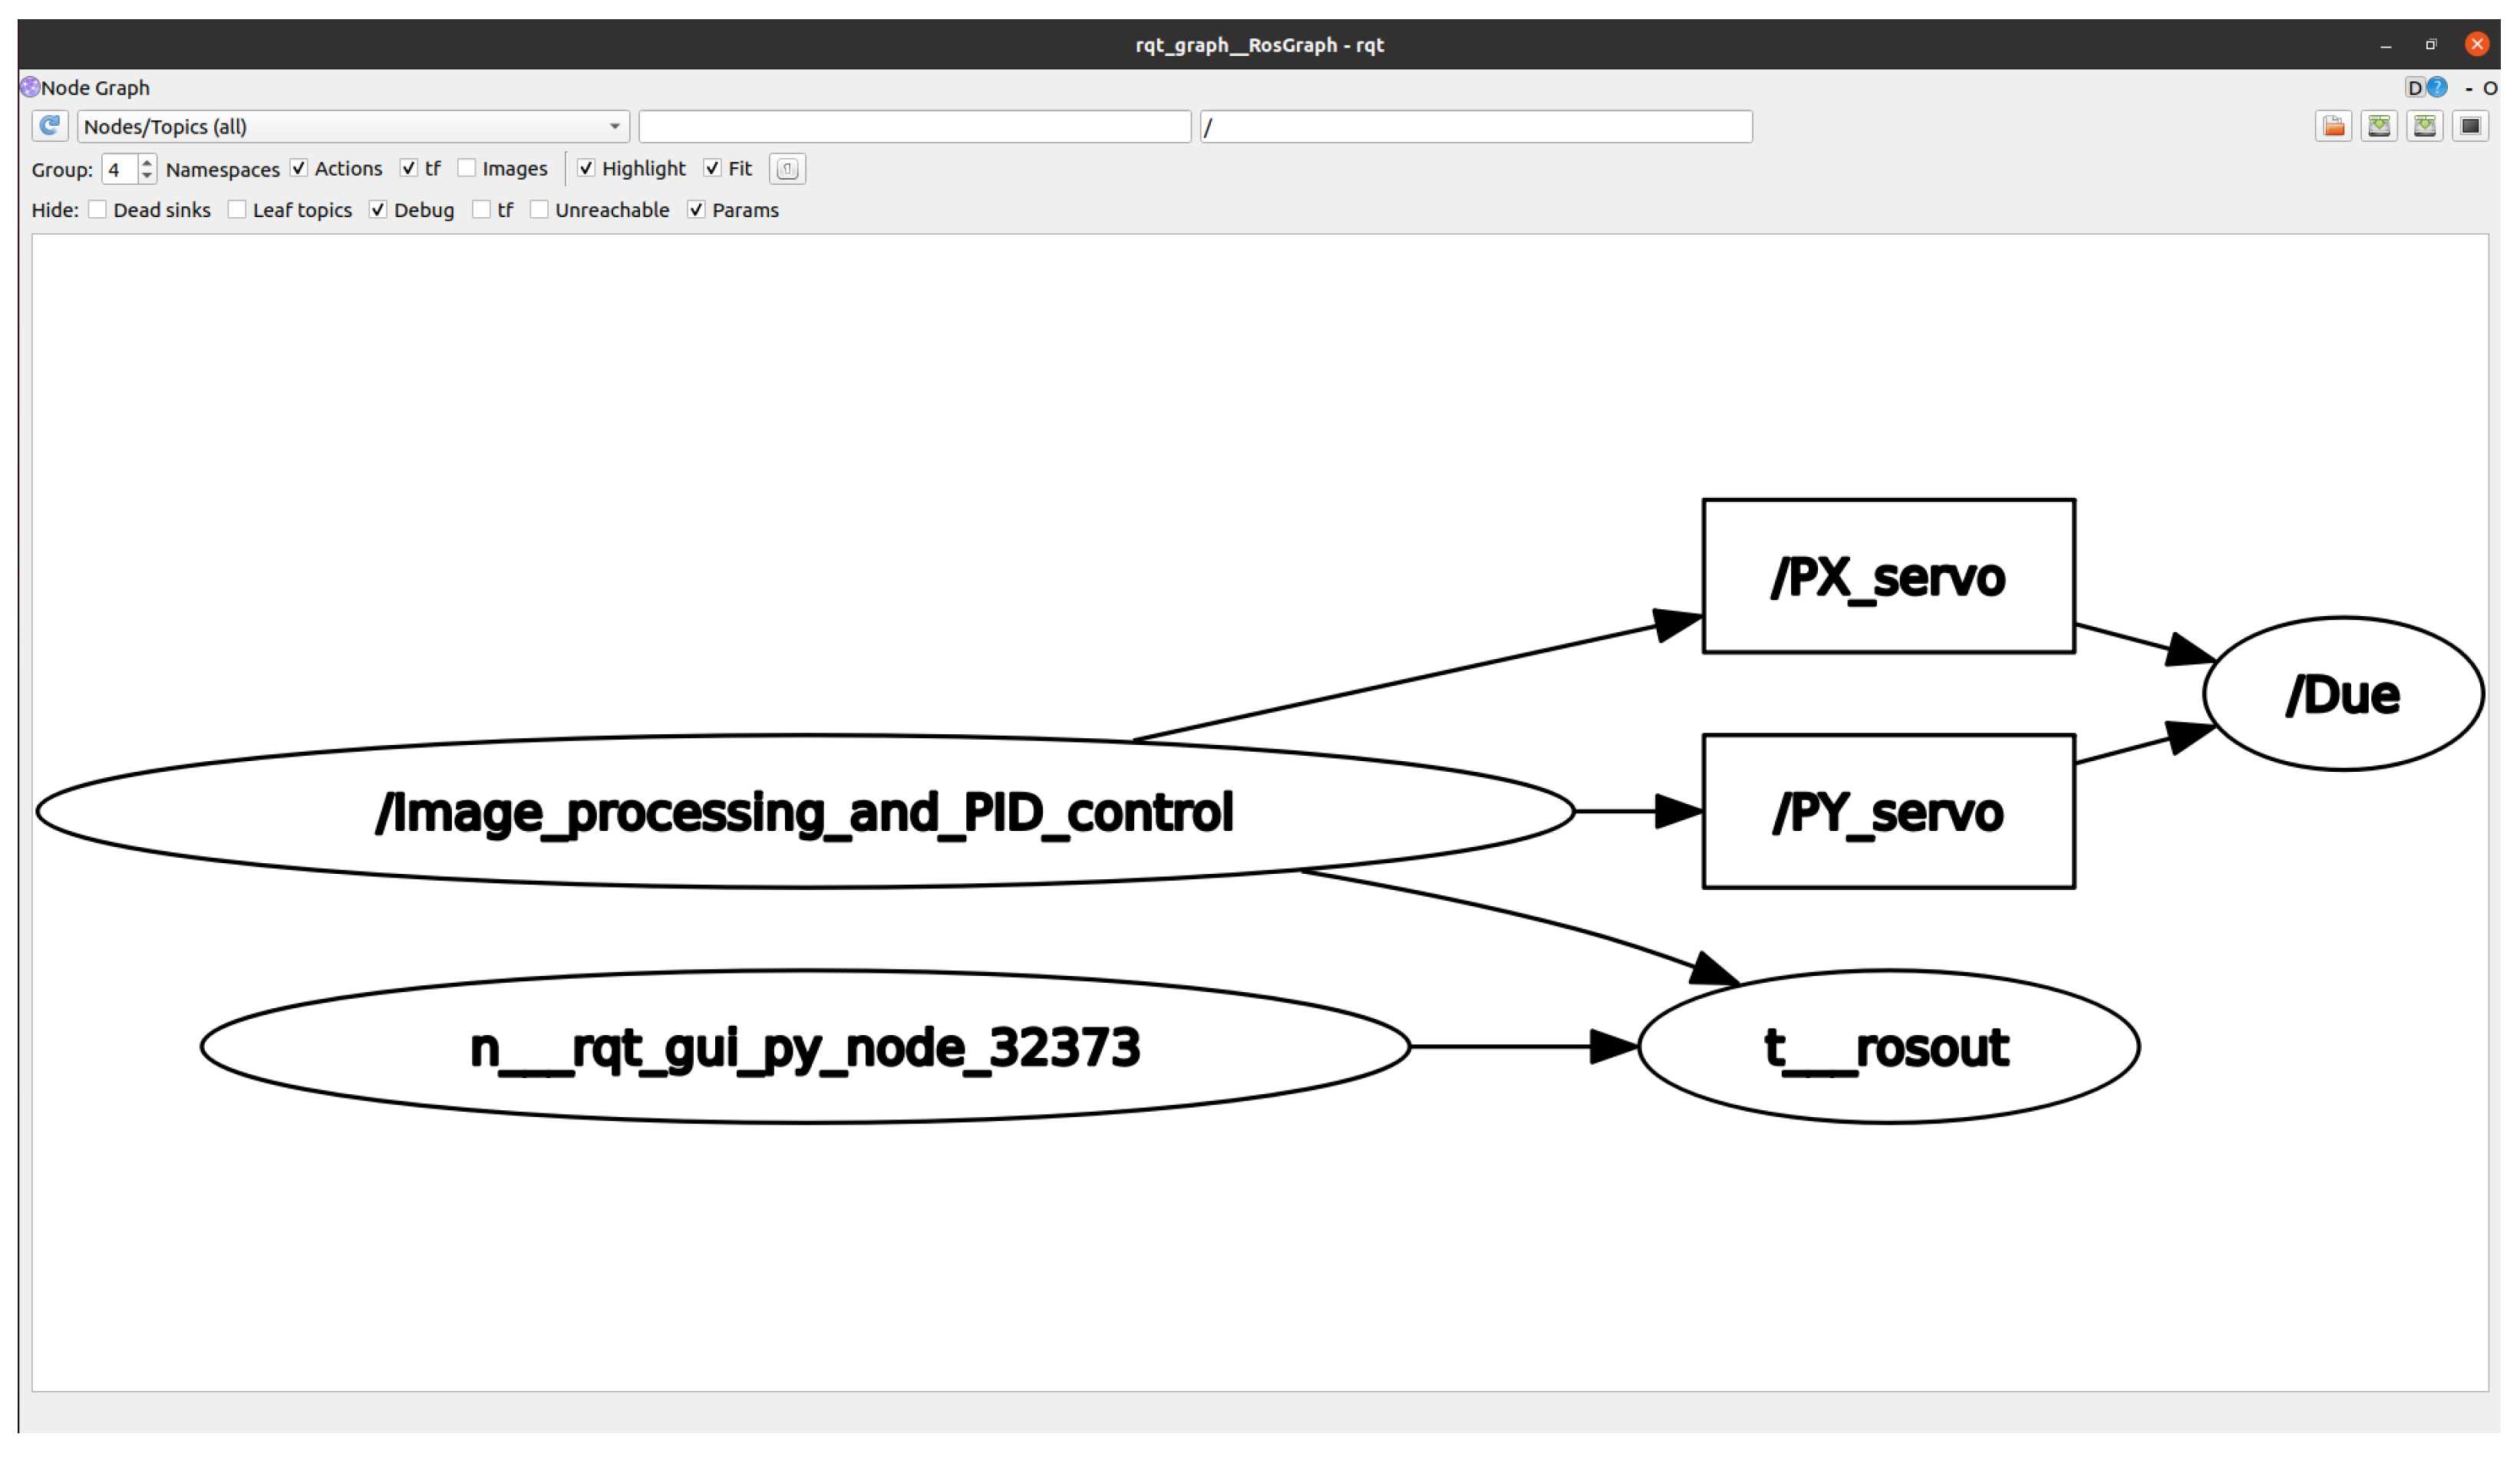
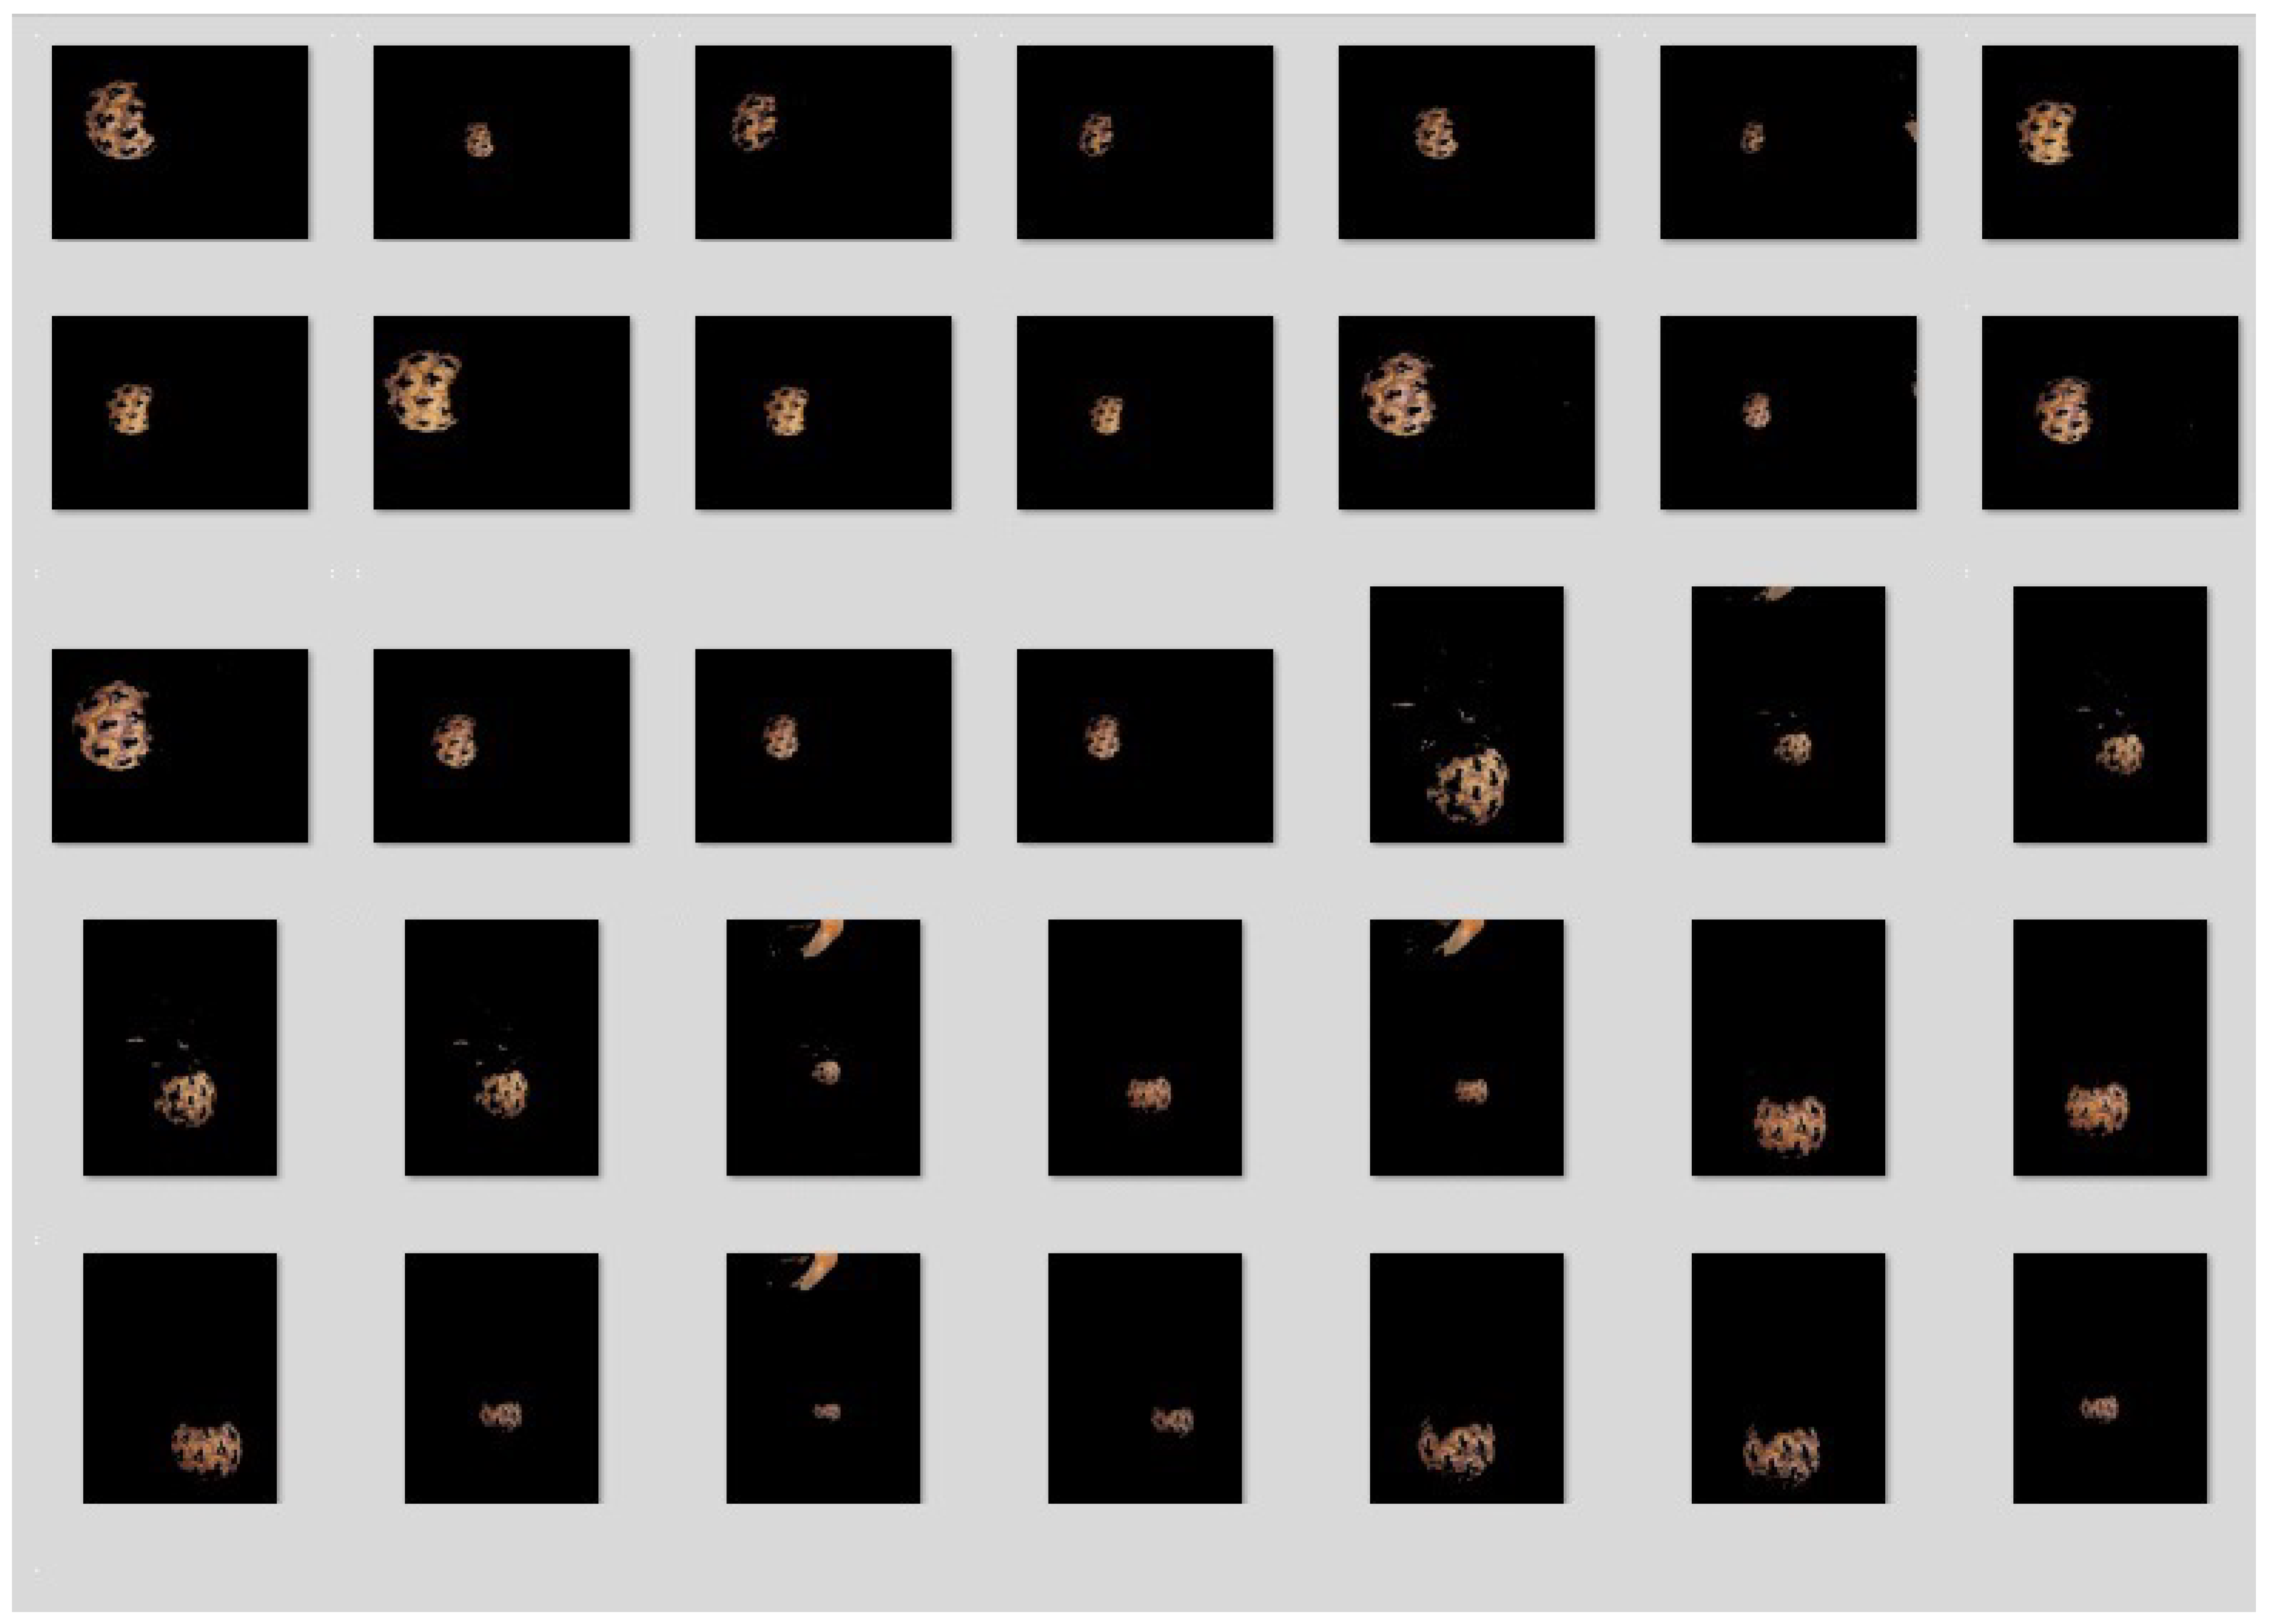
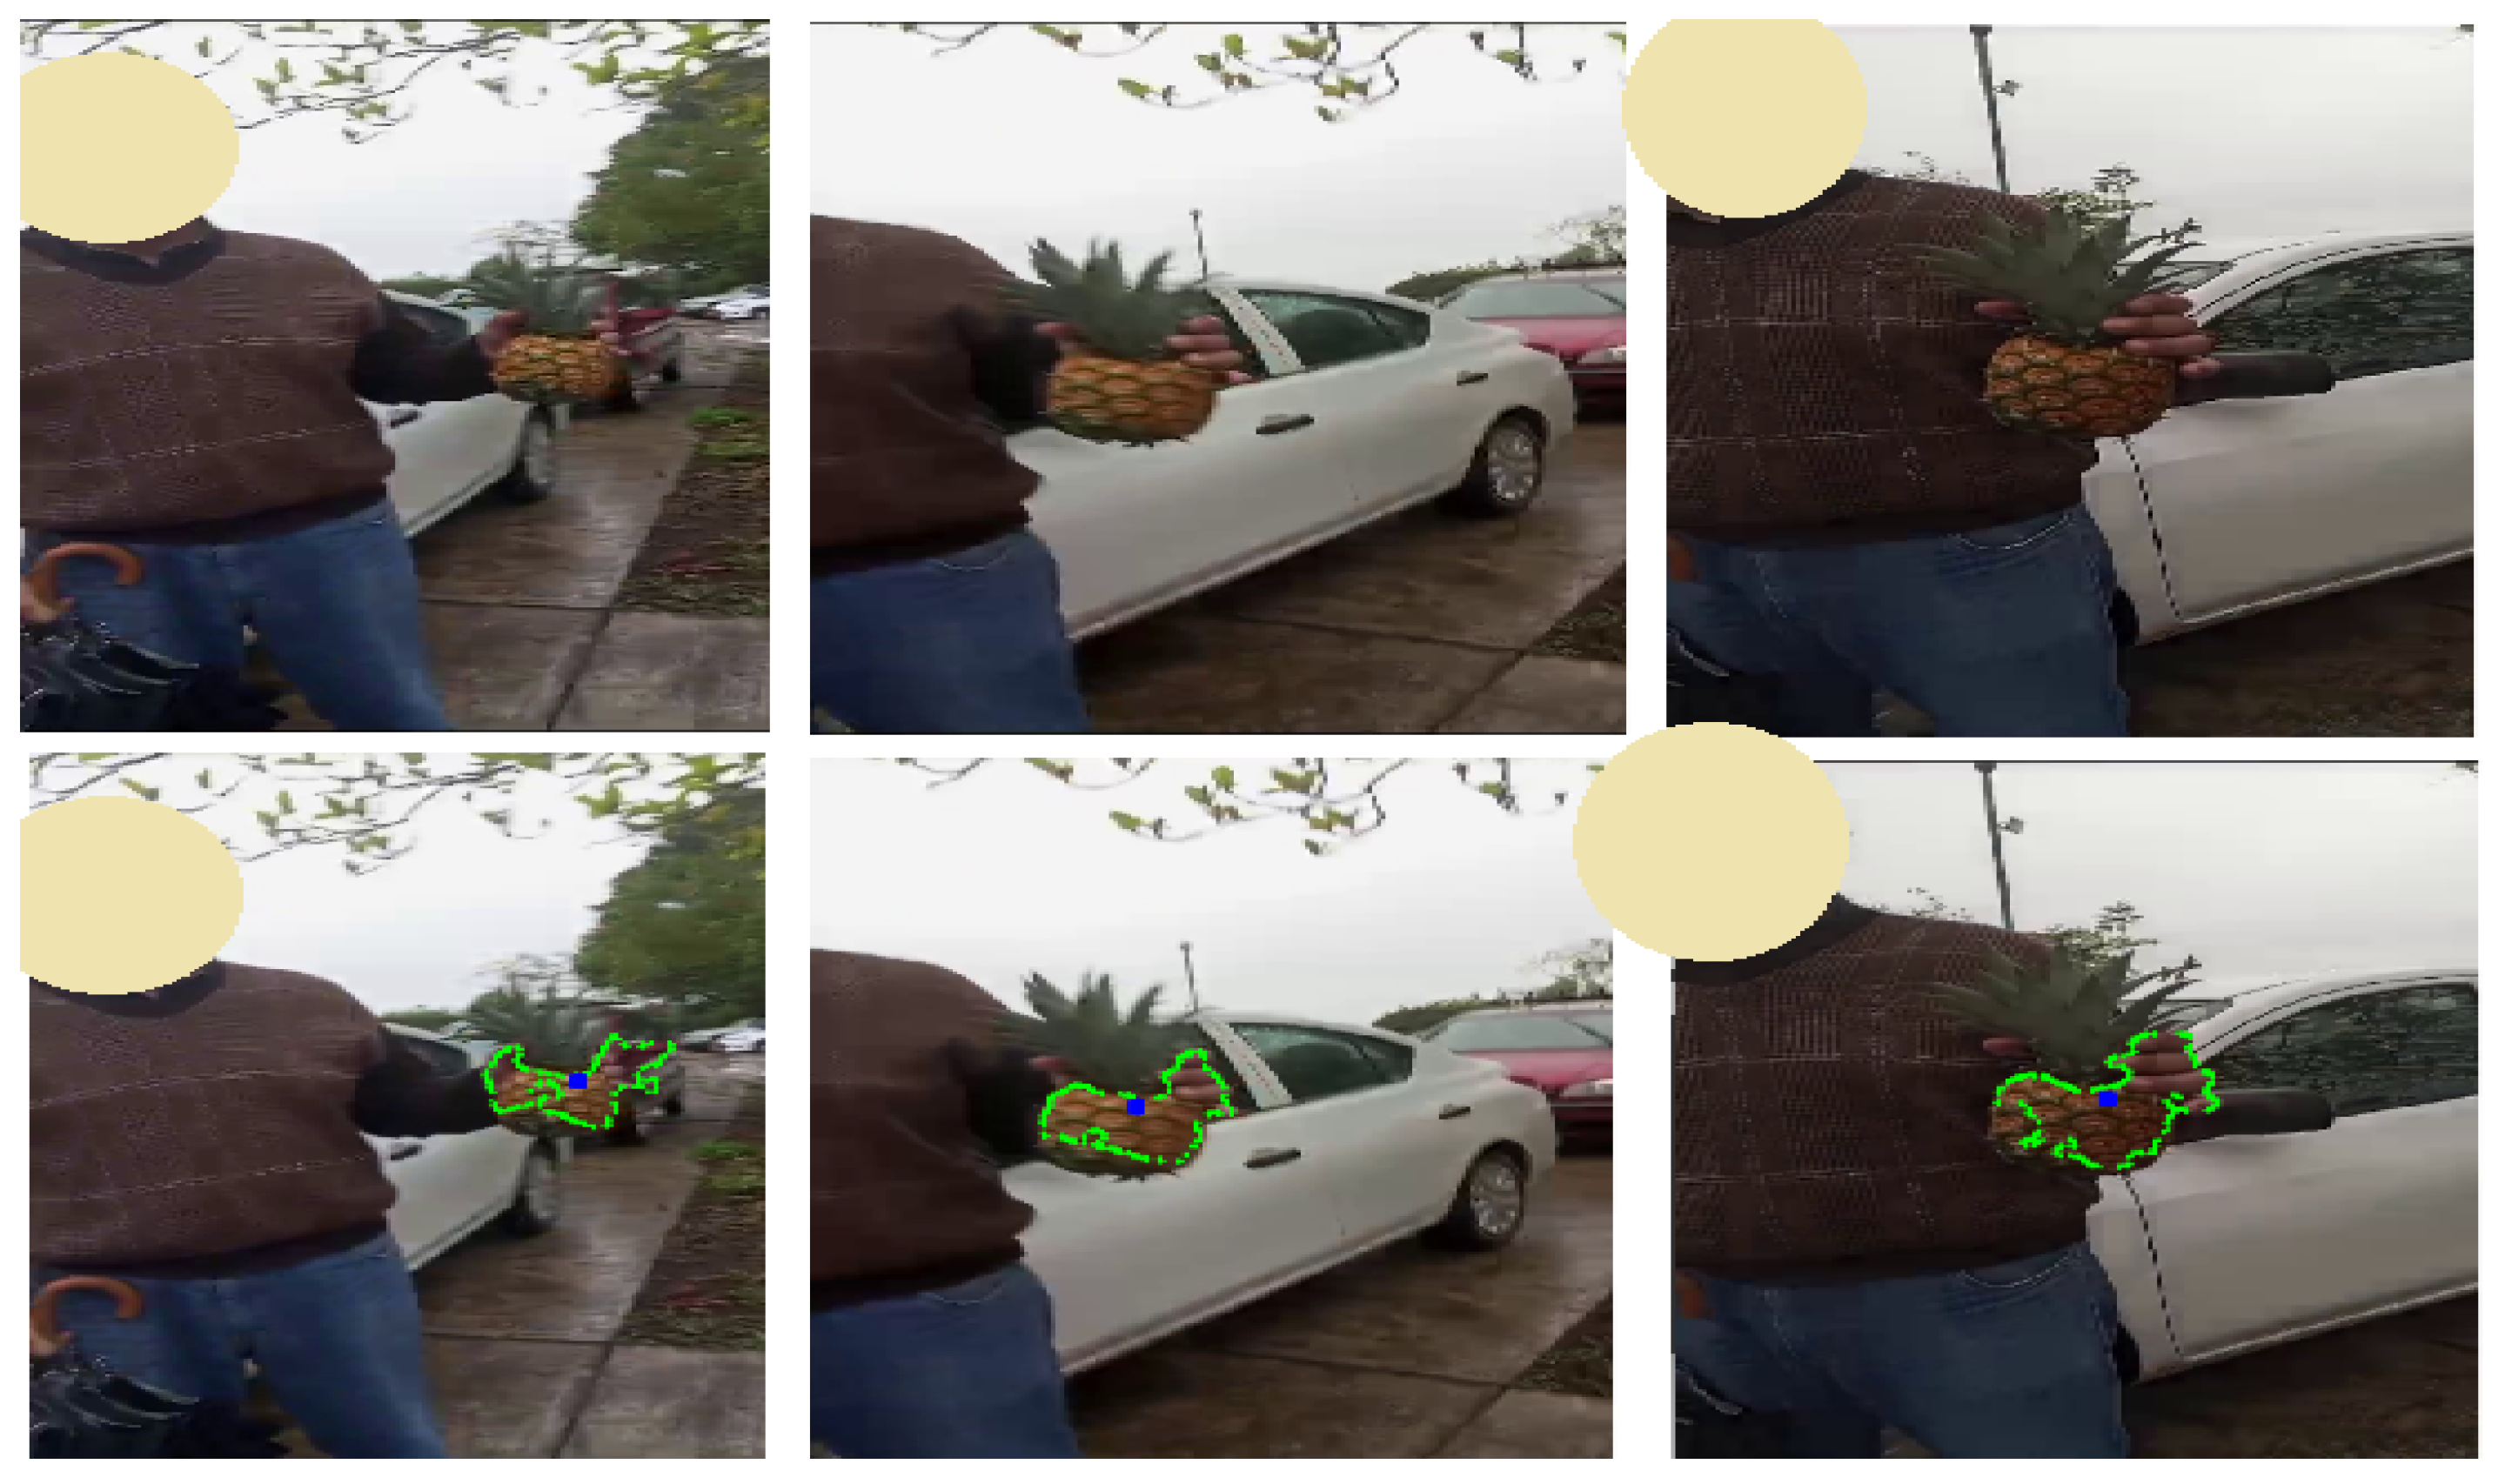
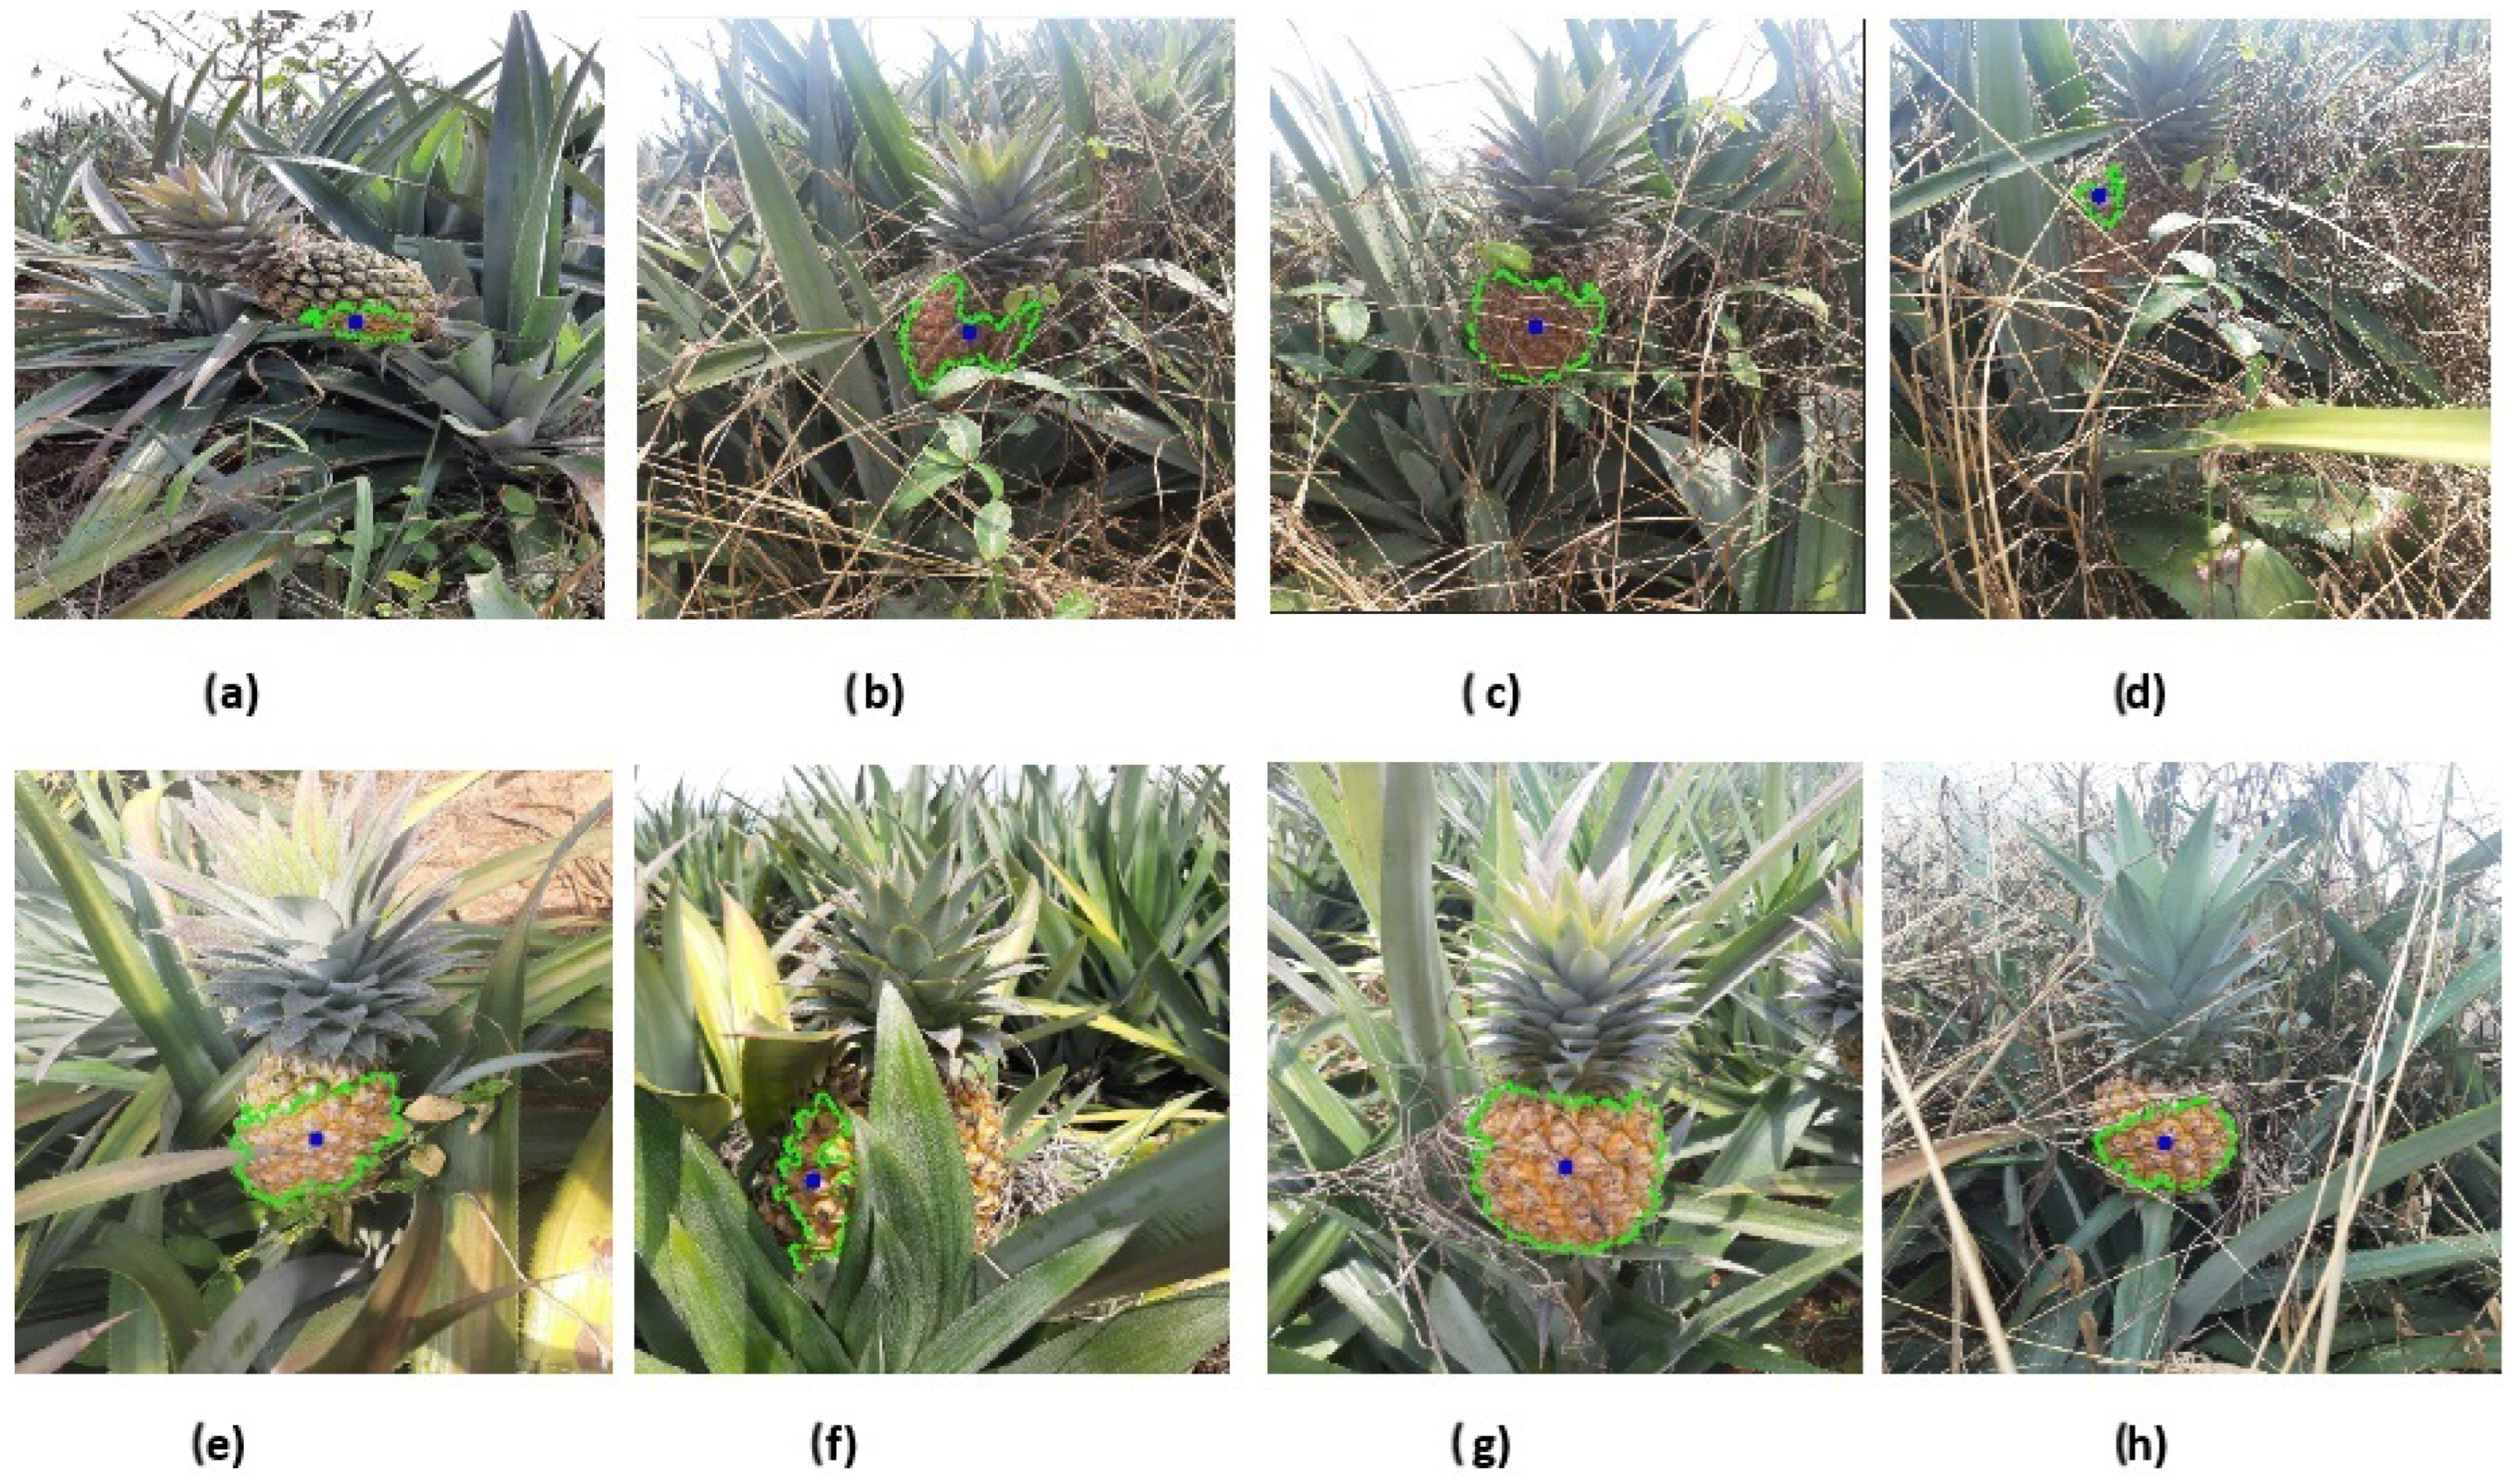
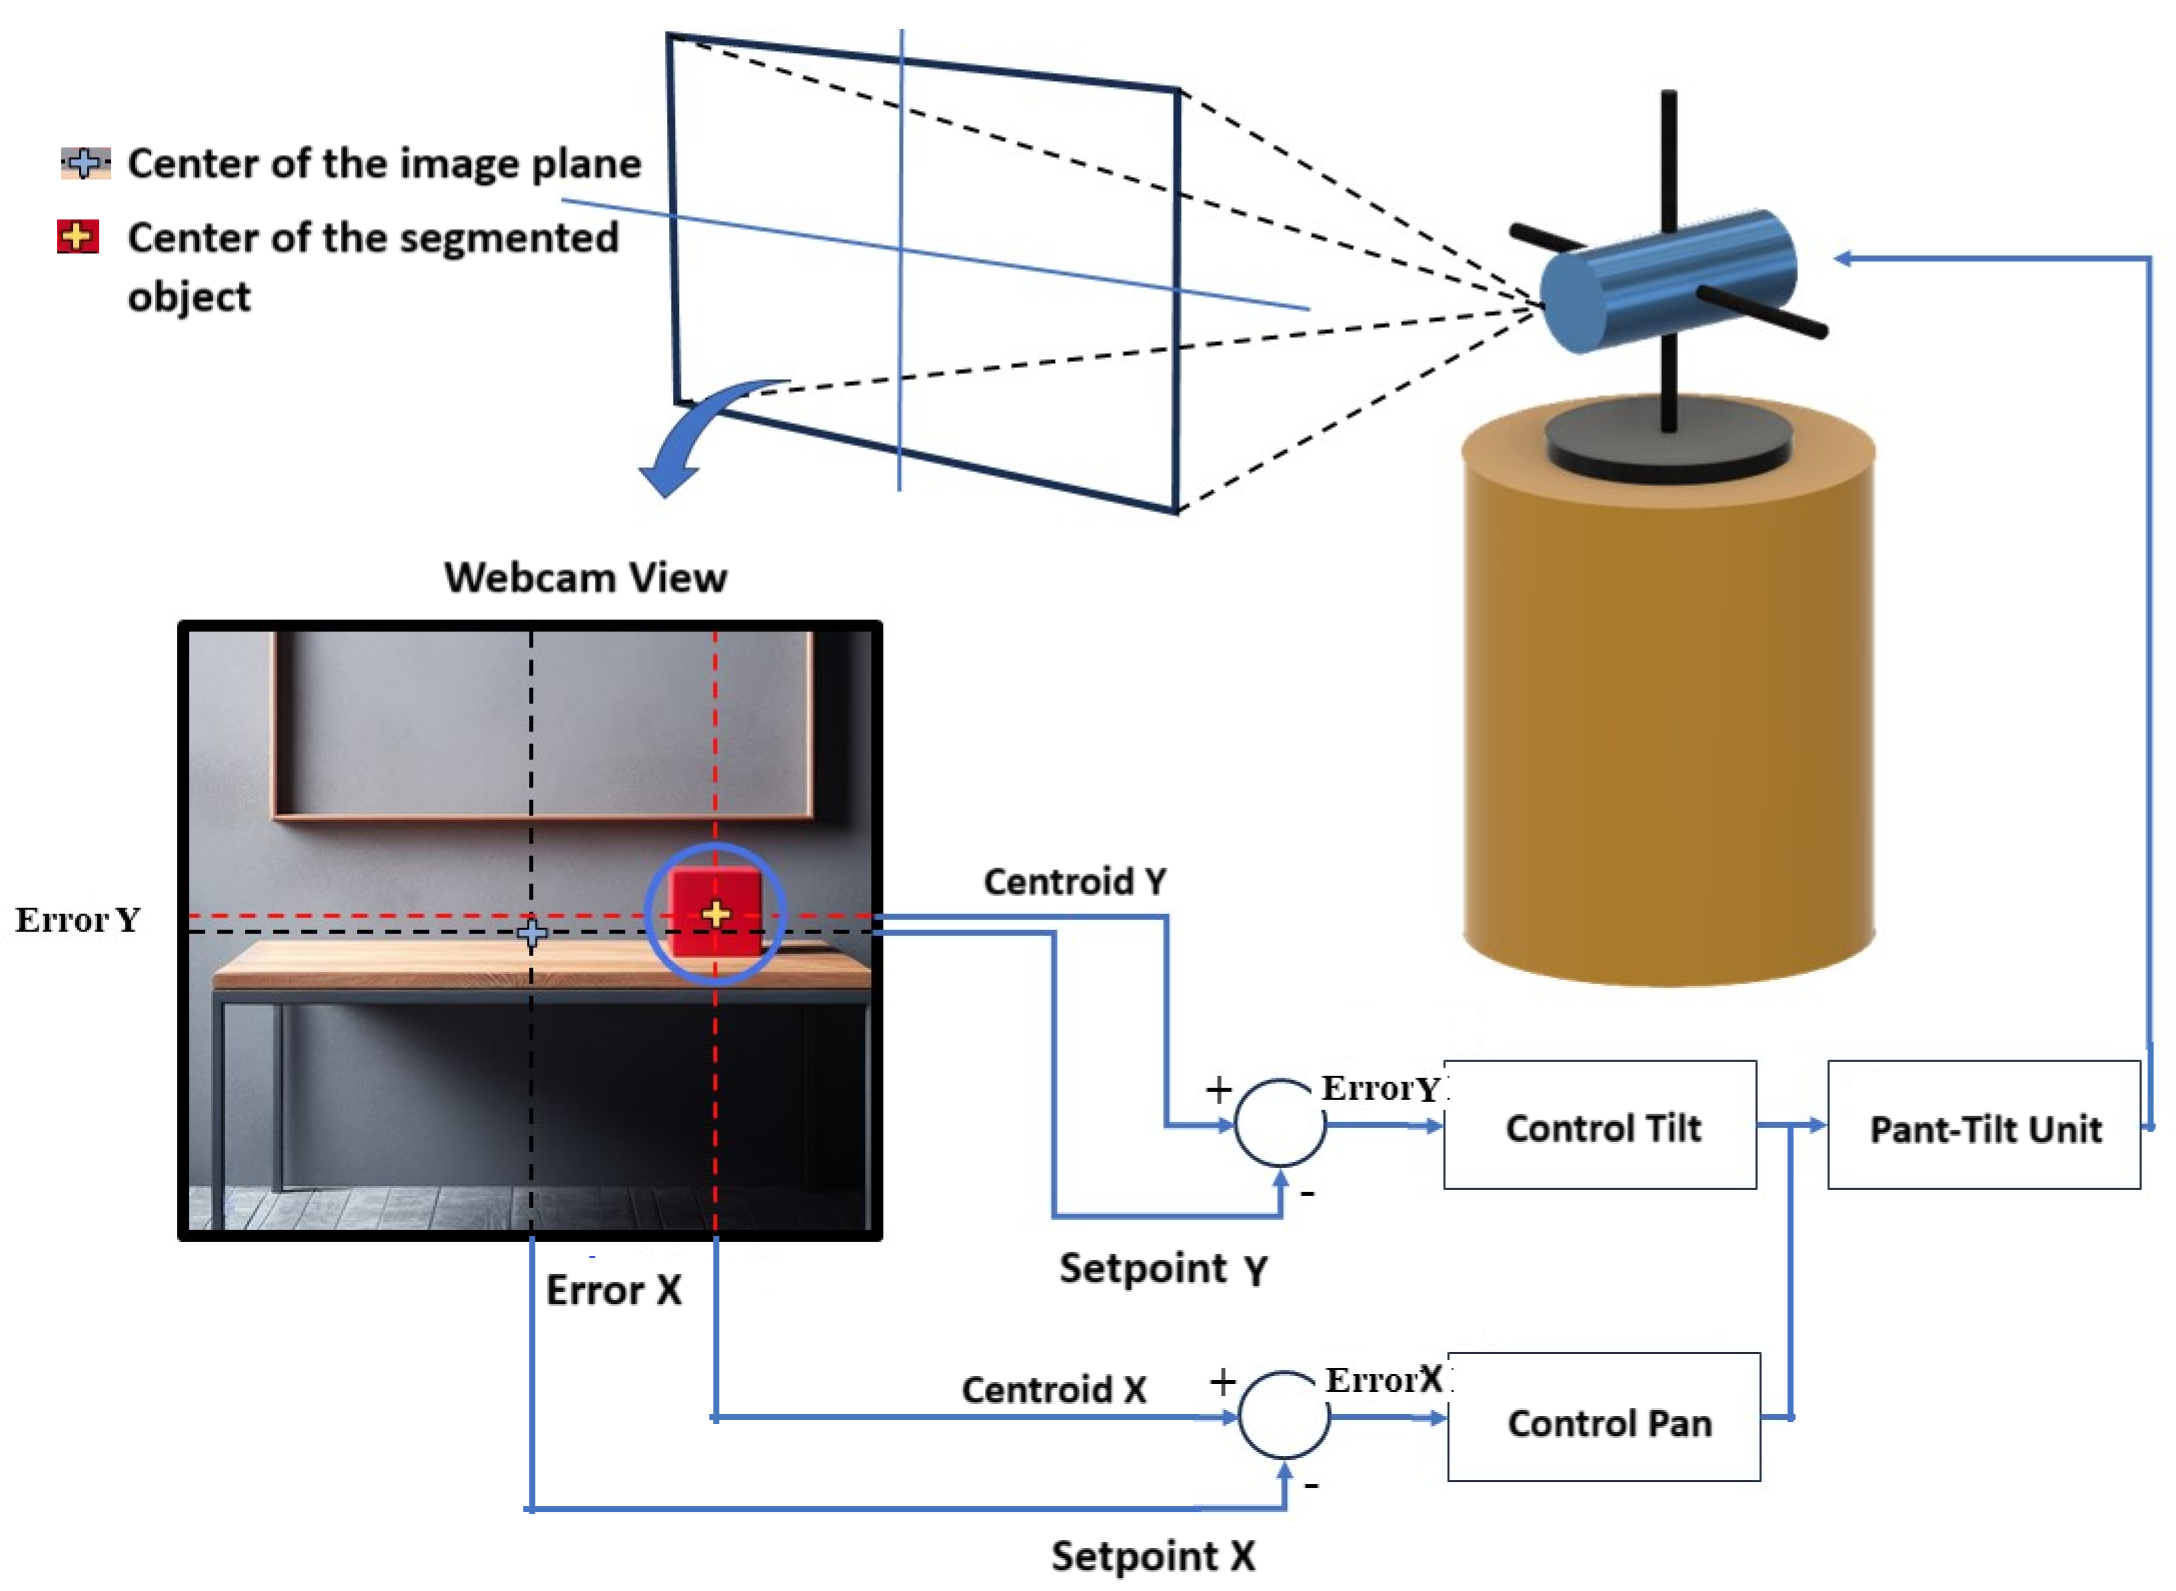
  • Software: An image processing module was implemented to receive an RGB image, segment the object of interest using a color filter, smooth the image with a 3 × 3 Gaussian filter, and calculate the centroid of the bounding box surrounding the segmented object. OpenCV libraries were employed for image processing task [33]. To effectively segment objects with composite colors, such as the body of a pineapple, a multivariate Gaussian filter (MGF) was developed and trained to detect the pineapple, excluding the crown. The MGF parameters were optimized with a genetic algorithm. The position (x, y) of the centroid of the segmented object in the image plane is published. Subsequently, the PID control evaluates whether the received coordinates match the center of the image plane. If they do not align, the control action is executed on the pan–tilt unit to adjust the position of the webcam and track the object. The graph generated in ROS2 is shown in Figure 4, which includes a node responsible for processing the images, sending the output of the PID controller in the form of coordinates (x, y), and another node that communicates with the Arduino Due board through microROS and receives the data and sends control signals to move the servomotors.
Figure 3. The architecture implemented in ROS2 consists of both hardware and software components. (1) Hardware: This includes input and output devices such as a servo motor, a webcam, and an Arduino Due board with microROS to control the servo motors responsible for moving the pan–tilt unit (PTU). (2) Software: The system is structured into modules with specific functionalities, including object segmentation, centroid calculation, and tracking using two PID controllers. The servomotors are powered by lithium batteries. ROS2 manages the communication between the software and hardware layers.
Computation 13 00069 g003

3. Optimization of MG Filter and PID Controller Parameters with a GA

In this work, a GA was used to optimize the parameters of a multivariate Gaussian filter to segment pineapples, which have composite colors, and to optimize the parameters of the PID controllers for tracking the segmented object and centering it in the image plane. This optimization aims to minimize the risk of the object of interest moving out of the camera’s field of view. The implementation of the genetic algorithm is outlined below.
Section 3.1 and Section 3.2 outline the process of creating the individuals and the objective function designed to optimize the parameters of the multivariate Gaussian filter (MGF) and the PID controller, respectively.

3.1. Multivariate Gaussian Filter (MGF)

To segment the pineapple across the three color channels, the parameters μ and Σ of a multivariate Gaussian function were optimized with a GA. The model based on multivariate Gaussian function [34] interprets the pixel belonging to the pineapple on prior experience. A probability model over the training set is constructed to classify new pixels. In the generative formulation, a probability distribution is chosen over the data x and makes its parameters contingent on the world state w.
P r ( x | w = k ) = N o r m x μ k , Σ k
The model based on pixel intensities in RGB channels has to infer a label w = 1 if the pixel belongs to the pineapple body and turns the pixel white and w = 0 otherwise, and the pixel turns black. The result is an image where the pixels corresponding to the pineapple are white and the remaining pixels are black. The pixel x in a new observation is classified as a pineapple if
P r ( w = 1 | x ) > ε
The μ values represent the means of multivariate normal distributions, and they form an array of three elements, with one element for each color channel:
μ = μ R μ G μ B
Σ represents the covariances of the multivariate normal distributions and is a positive, symmetric, and definite matrix. Since μ has three components, Σ is a 3 × 3 covariance matrix:
Σ = c 11 c 12 c 13 c 12 c 22 c 23 c 13 c 23 c 33
The elements of μ and Σ , as shown in (3) and (4), respectively, are optimized using a GA. The range of values of each element in μ is 0 , 255 , corresponding to the intensity value for a pixel in each color channel. Binary individuals are used to optimize μ and Σ parameters with the GA. Each element of μ is represented by 8 bits, while 13 bits are used to represent each component of Σ , corresponding to the range [0, 8191], which was found to be sufficient based on the conducted experiments. Consequently, each individual consists of 102 alleles, distributed as follows: 8 bits for each value of μ R , μ G , and μ B ; and 13 for each value of c 11 , c 12 , c 13 , c 22 , c 23 , c 33 . For this work, 35 photos of pineapples were captured (Figure 5), with the background containing various colors and shapes.
Following Algorithm 1, a random population of 100 individuals was created. To optimize the μ and Σ , the 35 pineapple images shown in Figure 5 were used. For each image, the pineapple was manually colored black, and Figure 6 shows 3 of the 35 images, where the body of the pineapple is manually colored black. Then, using MATLAB R2022a, a binary image is created, where the black pixels in the top row are changed to white, and the remaining pixels are assigned the intensity of the black color.
Algorithm 1 Genetic Algorithm
 1:
Initialize population P with random values
 2:
for G generations do
 3:
    Evaluate fitness of each individual in P
 4:
    Select parents from P in random order
 5:
    Apply crossover to produce offspring
 6:
    Apply mutation to offspring
 7:
    Form new population P from offspring
 8:
    Apply elitism
 9:
end for
10:
Return best solution found
The binary images serve as reference images. These images are used to assess the fitness of each individual in the GA for segmenting the body of the pineapple. With the GA, each pixel of the images Figure 5 is evaluated with Equation (2). The resulting segmented image is then compared with the corresponding reference image to calculate the confusion matrix and determine the proportion of pixels correctly classified as 255 (pineapple body) and 0 (rest of the image). The percentage of correctly classified pixels indicates the fitness of each individual.
The 2-point crossover operator is applied to 90% of the pairs to create the offspring population. The simple mutation operator is applied to 10% of the offspring population. Elitism is applied: The best individual from the parent population is directly placed in the first position of the offspring population. The GA was run for 50 generations.
Table 1 shows the statistical results. The performance of segmenting pineapples using 100 individuals, with a two-point crossover at 90% and a mutation rate of 10%. This configuration resulted in an average fitness of 73.12%, representing the overall performance. The mean fitness is slightly lower than the median, suggesting that some solutions performed exceptionally well, raising the average fitness. The standard deviation, which reflects the degree of dispersion in the fitness values relative to the mean, is 14.7. The worst-performing individual achieved a fitness of 53%, indicating some variability in the solutions generated during the optimization process. The difference between the best and worst individual is 45%, indicating a significant variation in performance. This variation could potentially be reduced by adjusting the parameters of the genetic operators (crossover and mutation) and the number of generations. However, the presence of poorer solutions does not necessarily imply that the genetic algorithm (GA) is an ineffective strategy. In fact, the GA remains a robust strategy, as it is capable of exploring a diverse solution space, with the best individuals being able to achieve good results despite the presence of suboptimal ones.
The best fit is 98% and corresponds to the following parameters:
μ = 128 24 6
Σ = 8023 7405 4006 7405 7128 4484 4006 4484 5772
In Figure 7, the segmented pineapples are shown using the best individual from the GA.
To calculate the centroid of the segmented pineapple, a smoothing filter is applied to remove noise for contour detection, and the centroid of the bounding box of the largest contour is obtained (Figure 8).
To evaluate the robustness of the MGF trained with images of pineapple captured indoors, images taken in an outdoor environment (Figure 9) were analyzed. In the lower images, the segmented pineapple is highlighted with a green outline. However, it can be observed that the hand of the person holding the pineapple was also identified within the pixel outline that corresponds to the body of the pineapple.
To evaluate the filter under real-world conditions, we used images from a dataset of pineapples [35]. In images such as those shown in Figure 10, the filter was unable to segment the pineapple due to its predominantly green hues, while the filter was trained on pineapples with more yellow tones (Figure 5).
Figure 11 shows images of pineapples with shades similar to those used during training. The segmented pineapple is outlined in green. In Figure 11b,c,e,g,h, the segmentation results are correct. In Figure 11a, only the body of the pineapple with yellow hues was segmented. In Figure 11d,f, a partial segmentation of the pineapple body is observed due to occlusions in these images.

3.2. PID Controller

The PID controller is well-known and used in the industry due to its simplicity, reliability, and effectiveness. In low-order linear systems, the PID controller has demonstrated proven performance, especially for tracking a set reference value [36]. Its ability to minimize the error between a desired setpoint and the actual output makes it valuable for tasks like object tracking, temperature regulation, and speed control in different engineering fields. The general equation of a PID controller is as follows:
u ( t ) = K p e ( t ) + K i 0 t e ( τ ) d τ + K d d e d t
The parameter K p decides the reaction based on the present error, K i determines the reaction based on the total of recent errors, and K d determines the reaction using the rate at which the error has been changing. Properly adjusting these three parameters will improve the dynamic response of the control system. In the system proposed (Figure 3), the Arduino Due board is used to control the servo motors that move the PTU (Figure 2). The PTU consists of two servo motors: one for moving the camera in the x-axis (pan movement) and the other for moving it in the y-axis (tilt movement). In order to center an object of interest in the camera image plane, a PID controller is needed for each motor (Figure 12).
The image captured by the camera has a resolution of 640 × 480 pixels, the center of the image is at the coordinates (320, 240). The object of interest is centered when its centroid has coordinates (320, 240). Consequently, the setpoint for x is 320 and for y is 240.
To enhance the performance of the PID controllers, the parameters K p , K i , and K d were optimized using a GA. It was decided to use this technique because the mathematical model of the plant is not available. The GA was executed, while the robot head was active and tracking an object. Each individual was run for 30 iterations, and its fitness was evaluated using the Integral Absolute Error (IAE) (8).
I A E = 0 T | e ( t ) x | d t + 0 T | e ( t ) y | d t ,
where
e ( t ) x = o b j e c t c e n t r o i d x s e t p o i n t x e ( t ) y = o b j e c t c e n t r o i d y s e t p o i n t y
In this work, the GA described in [28] was implemented. Each parameter K was defined within the range [0, 1] with a resolution of 0.001. Using Equation (10), it was calculated that 10 bits are required for each parameter K p , K i , and K d . A population of 10 binary individuals was created for the GA. Each individual has 60 alleles: 30 for the Pan–PID controller parameters and 30 for the Tilt–PID controller parameters, where each of K p , K i , and K d was represented by 10 alleles.
R = U V 2 l 1
where R is the resolution (0.001 in this work), and U and V define the range of values that can take each parameter K. The variable l denotes the number of bits required to represent each parameter K with a R resolution. This resulted in 10 bits for each constant K p , K i , and K d . For each binary individual, the value of each constant K was obtained by converting its binary representation to a decimal and then dividing by 1000 to ensure that K∈ [0, 1].
The best individual encodes the values of parameter K p , K i , and K d of each PID controller in order to reduce the overshoot and the steady state error and increasing the stability of the system. The GA was implemented with two-point crossover operator, simple mutation, and elitism. It was run for 100 generations. The genetic algorithm was run 200 times. Table 2 shows the statistical results.

4. Experiments and Results

To track colored objects using the omnidirectional robot head, the following experiments were conducted:
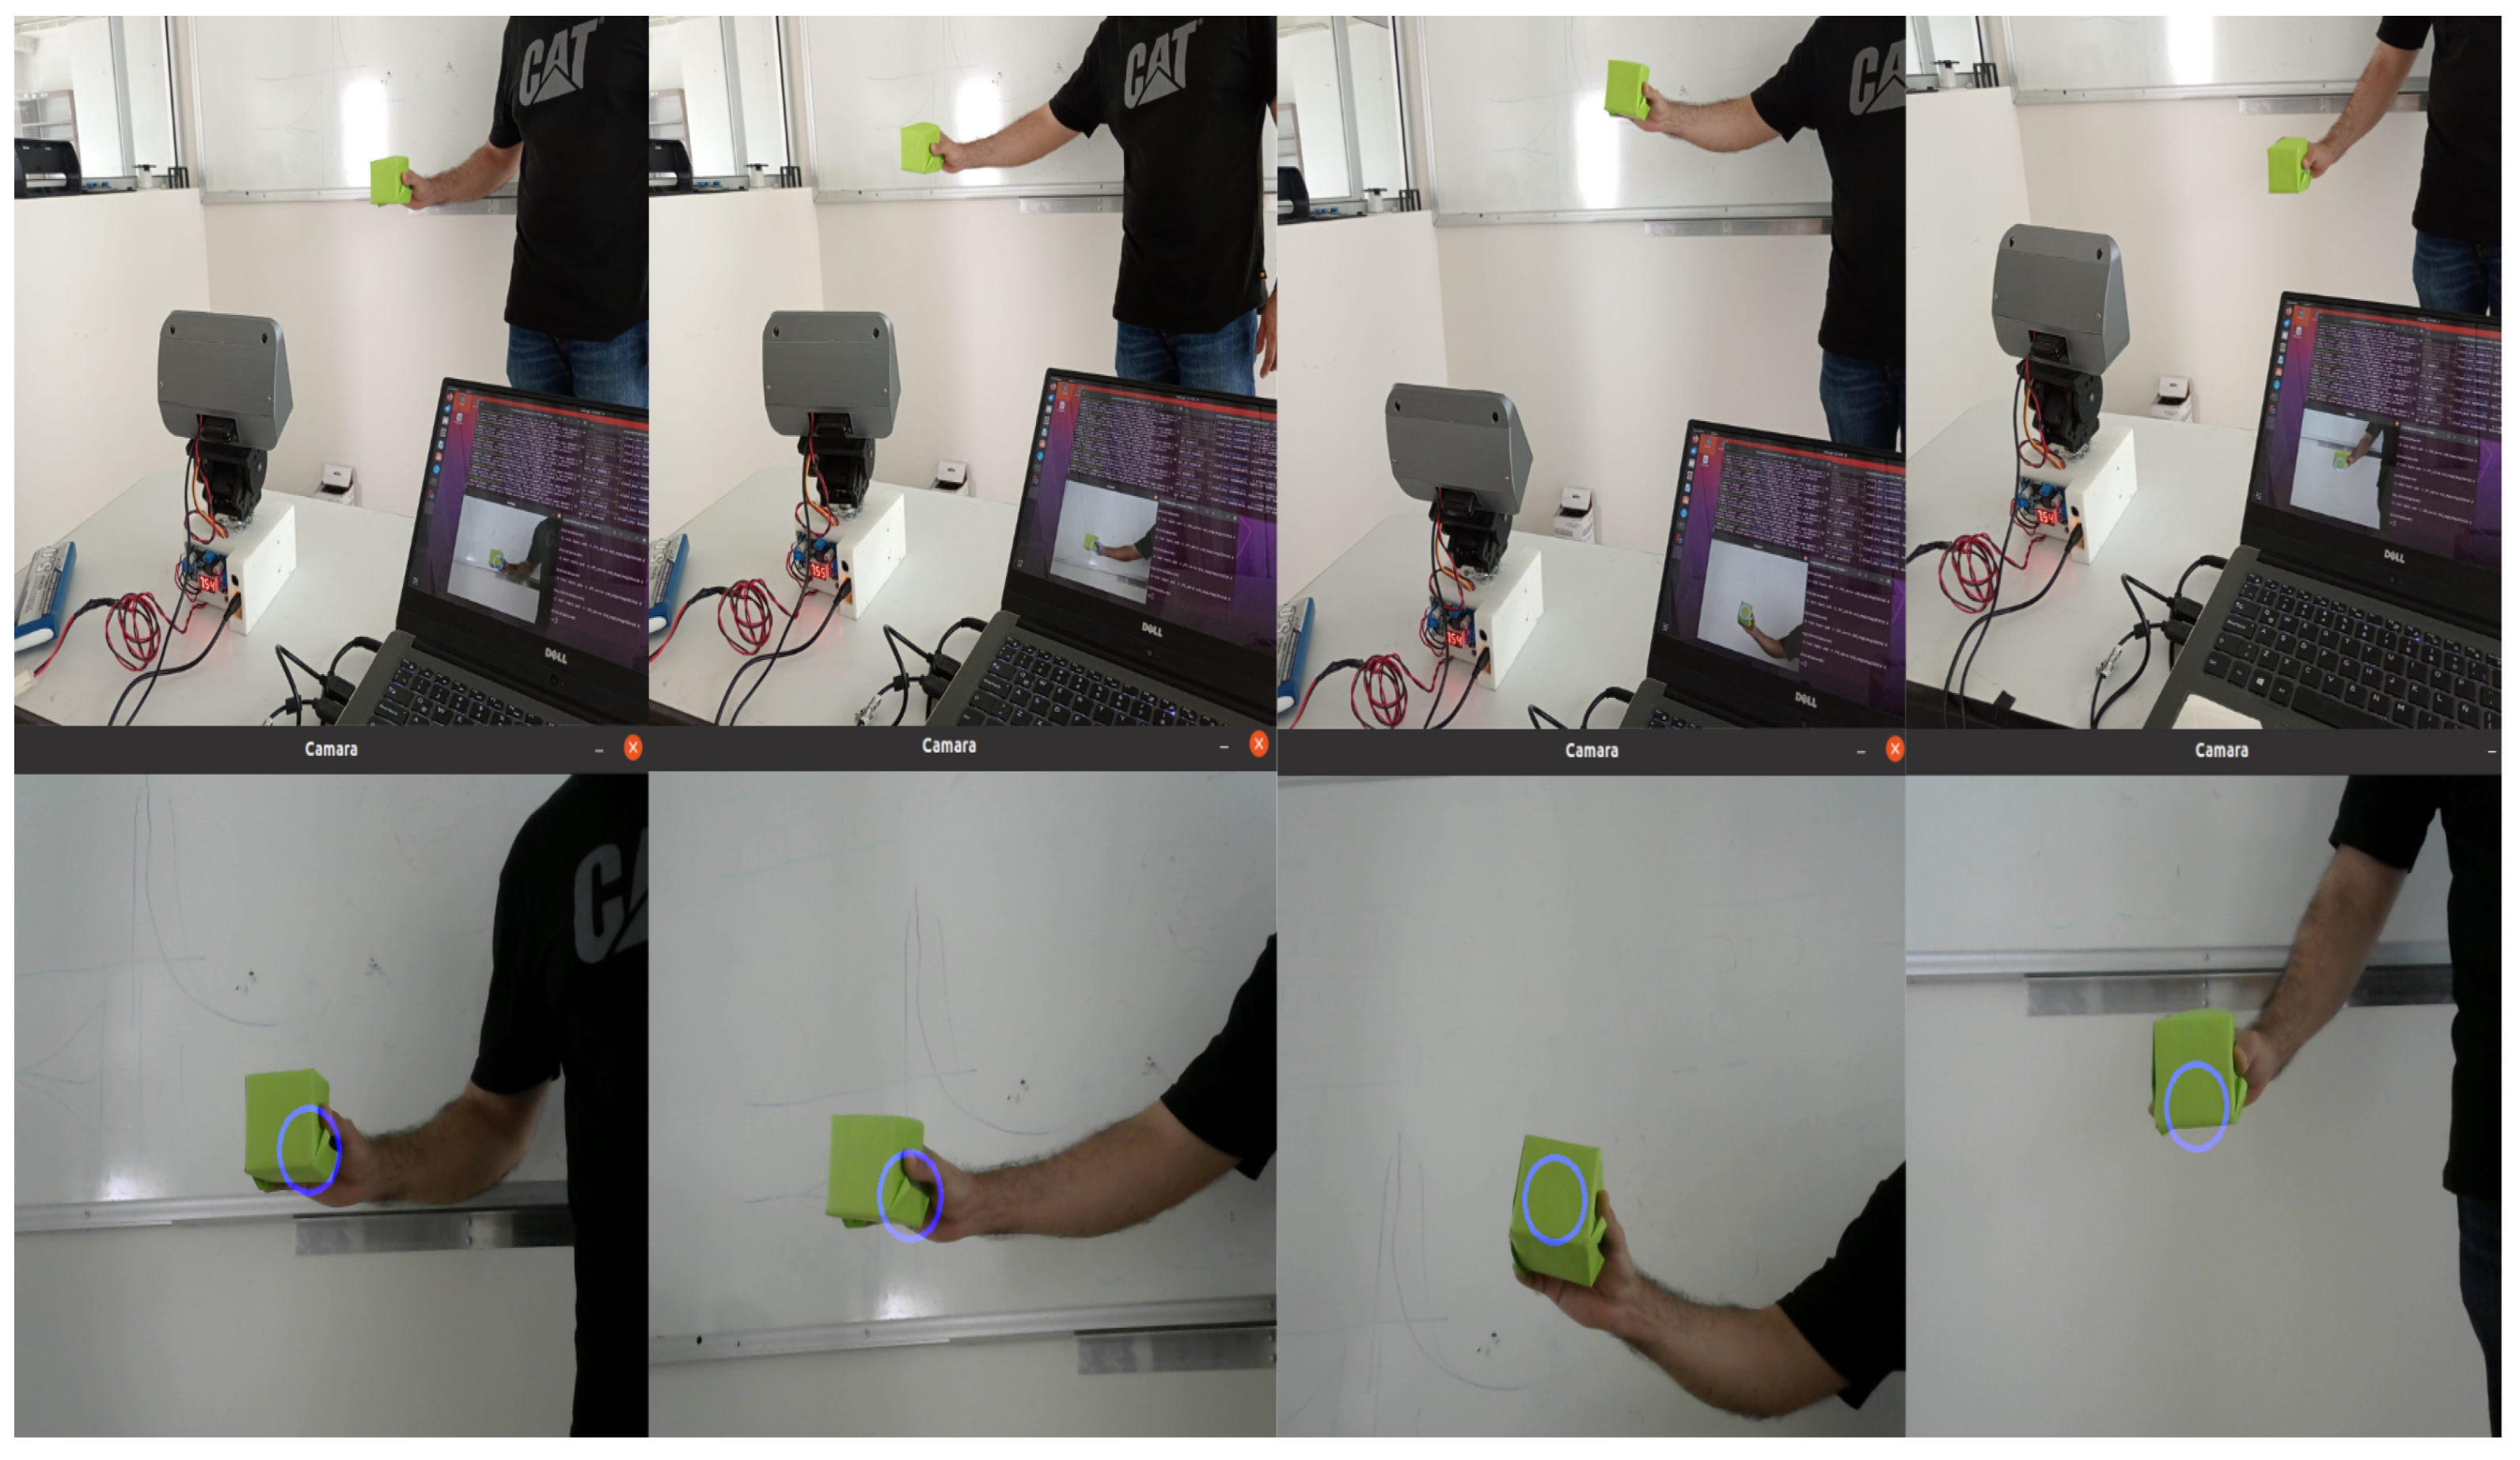
  • Experiment 1: Evaluate the response of the PID controller with the parameters optimized by the GA and tuned manually. The robot head tracked a green-colored object.
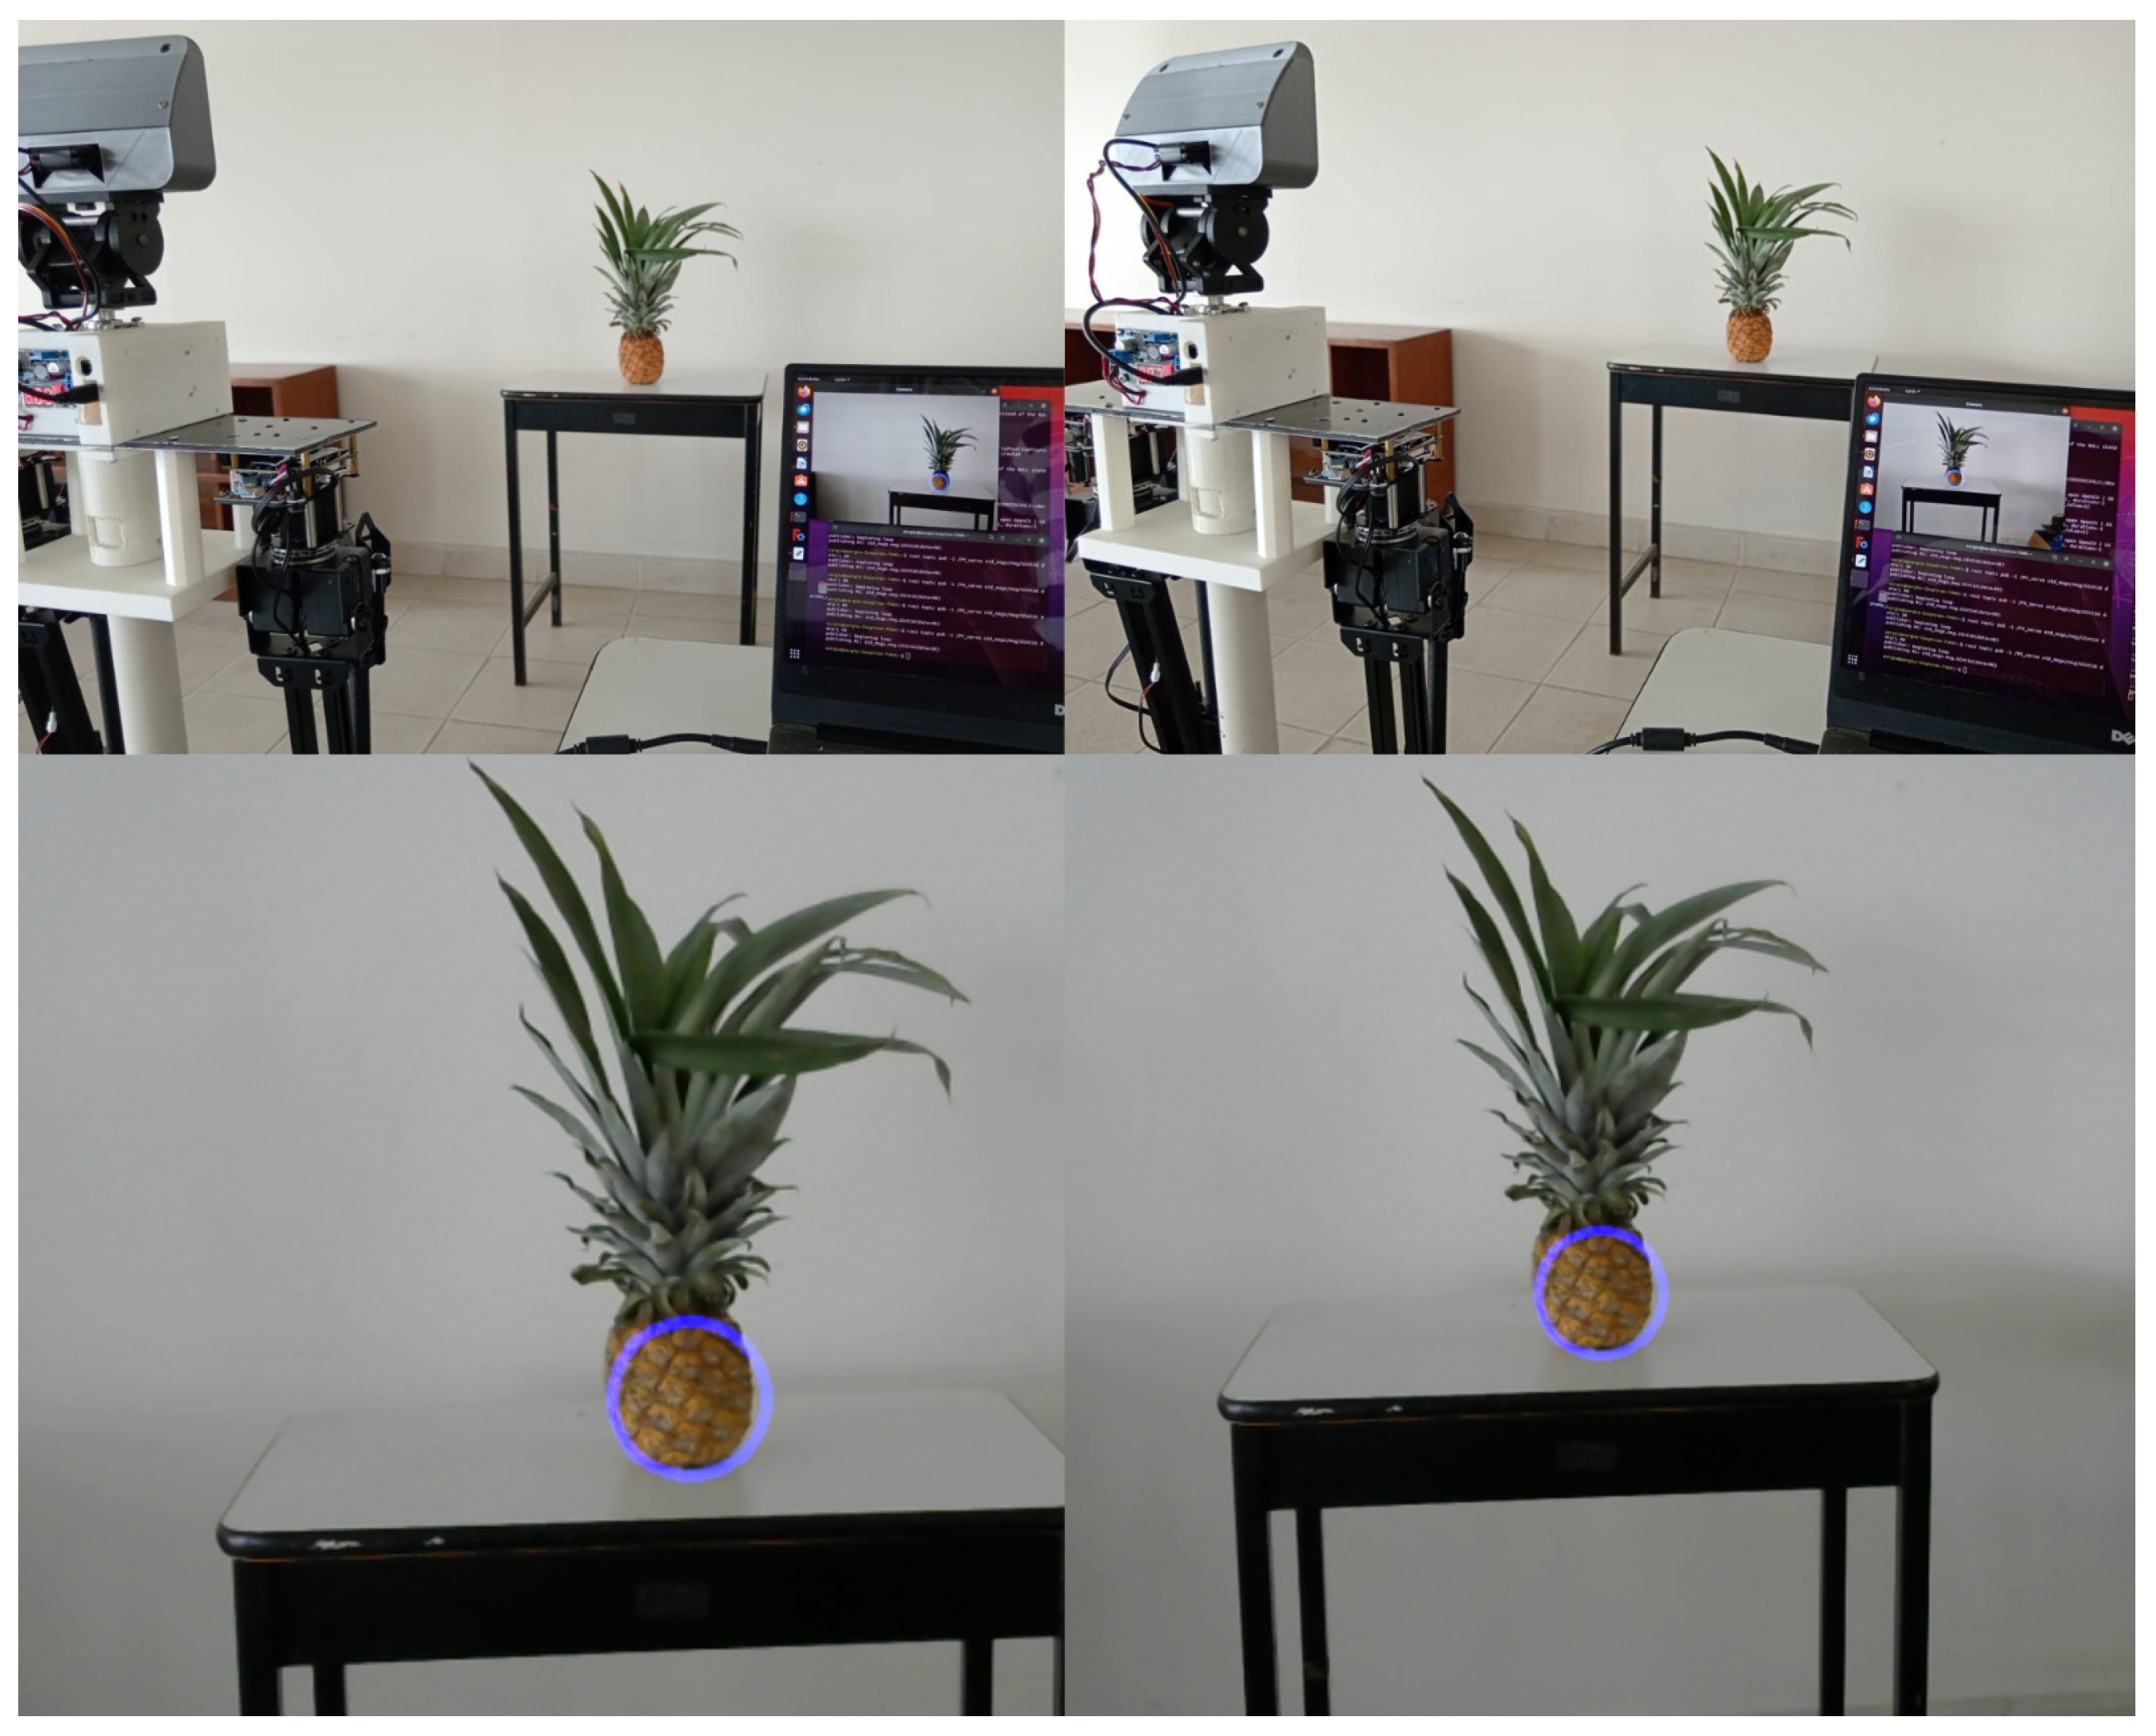
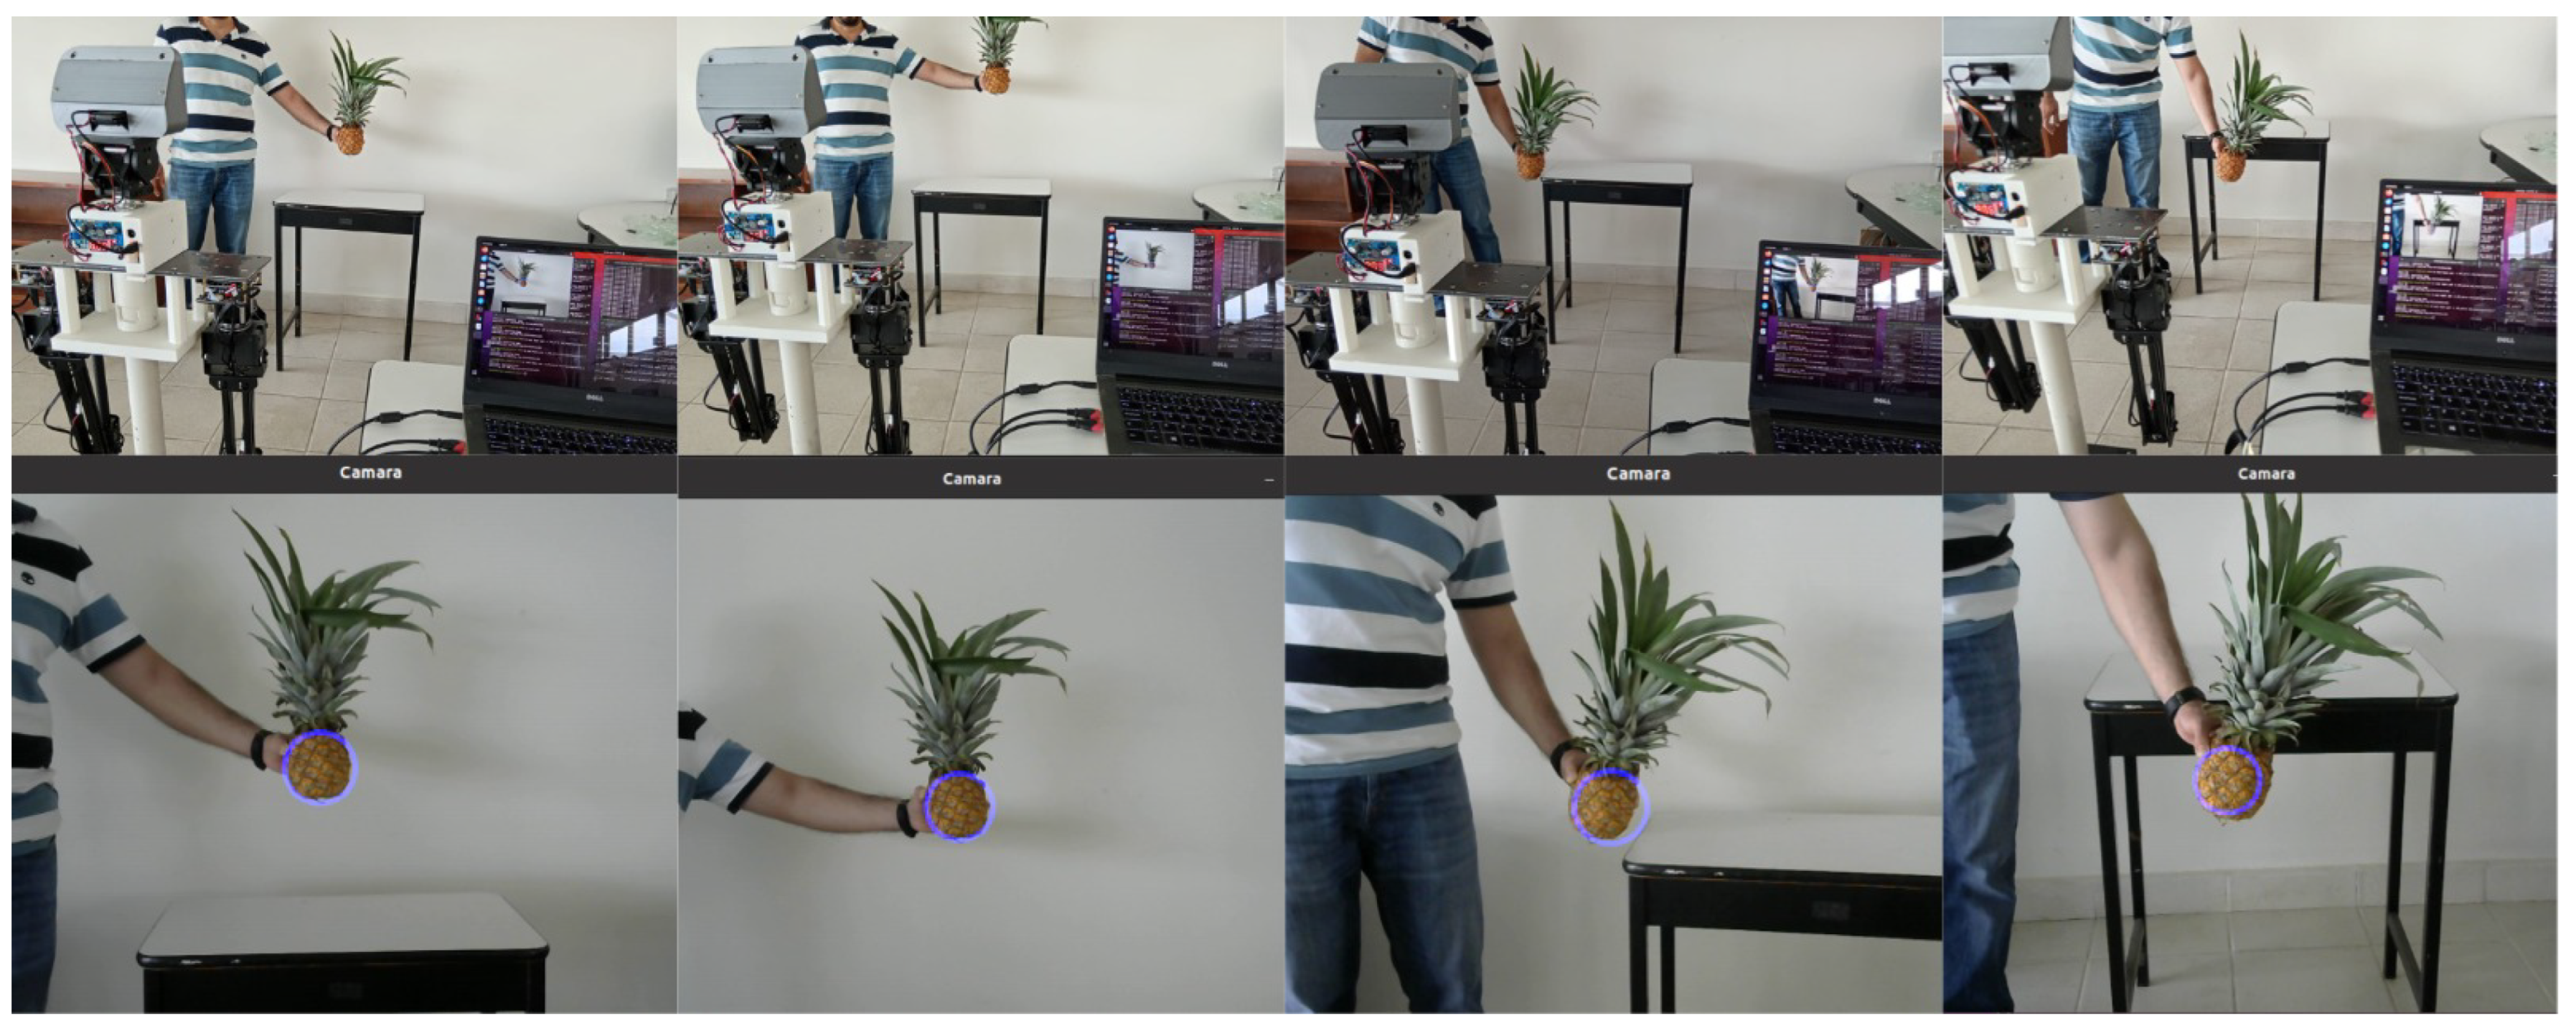
  • Experiment 2: Evaluate the tracking of a pineapple, using the multivariate Gaussian filter, with parameters optimized by the GA.
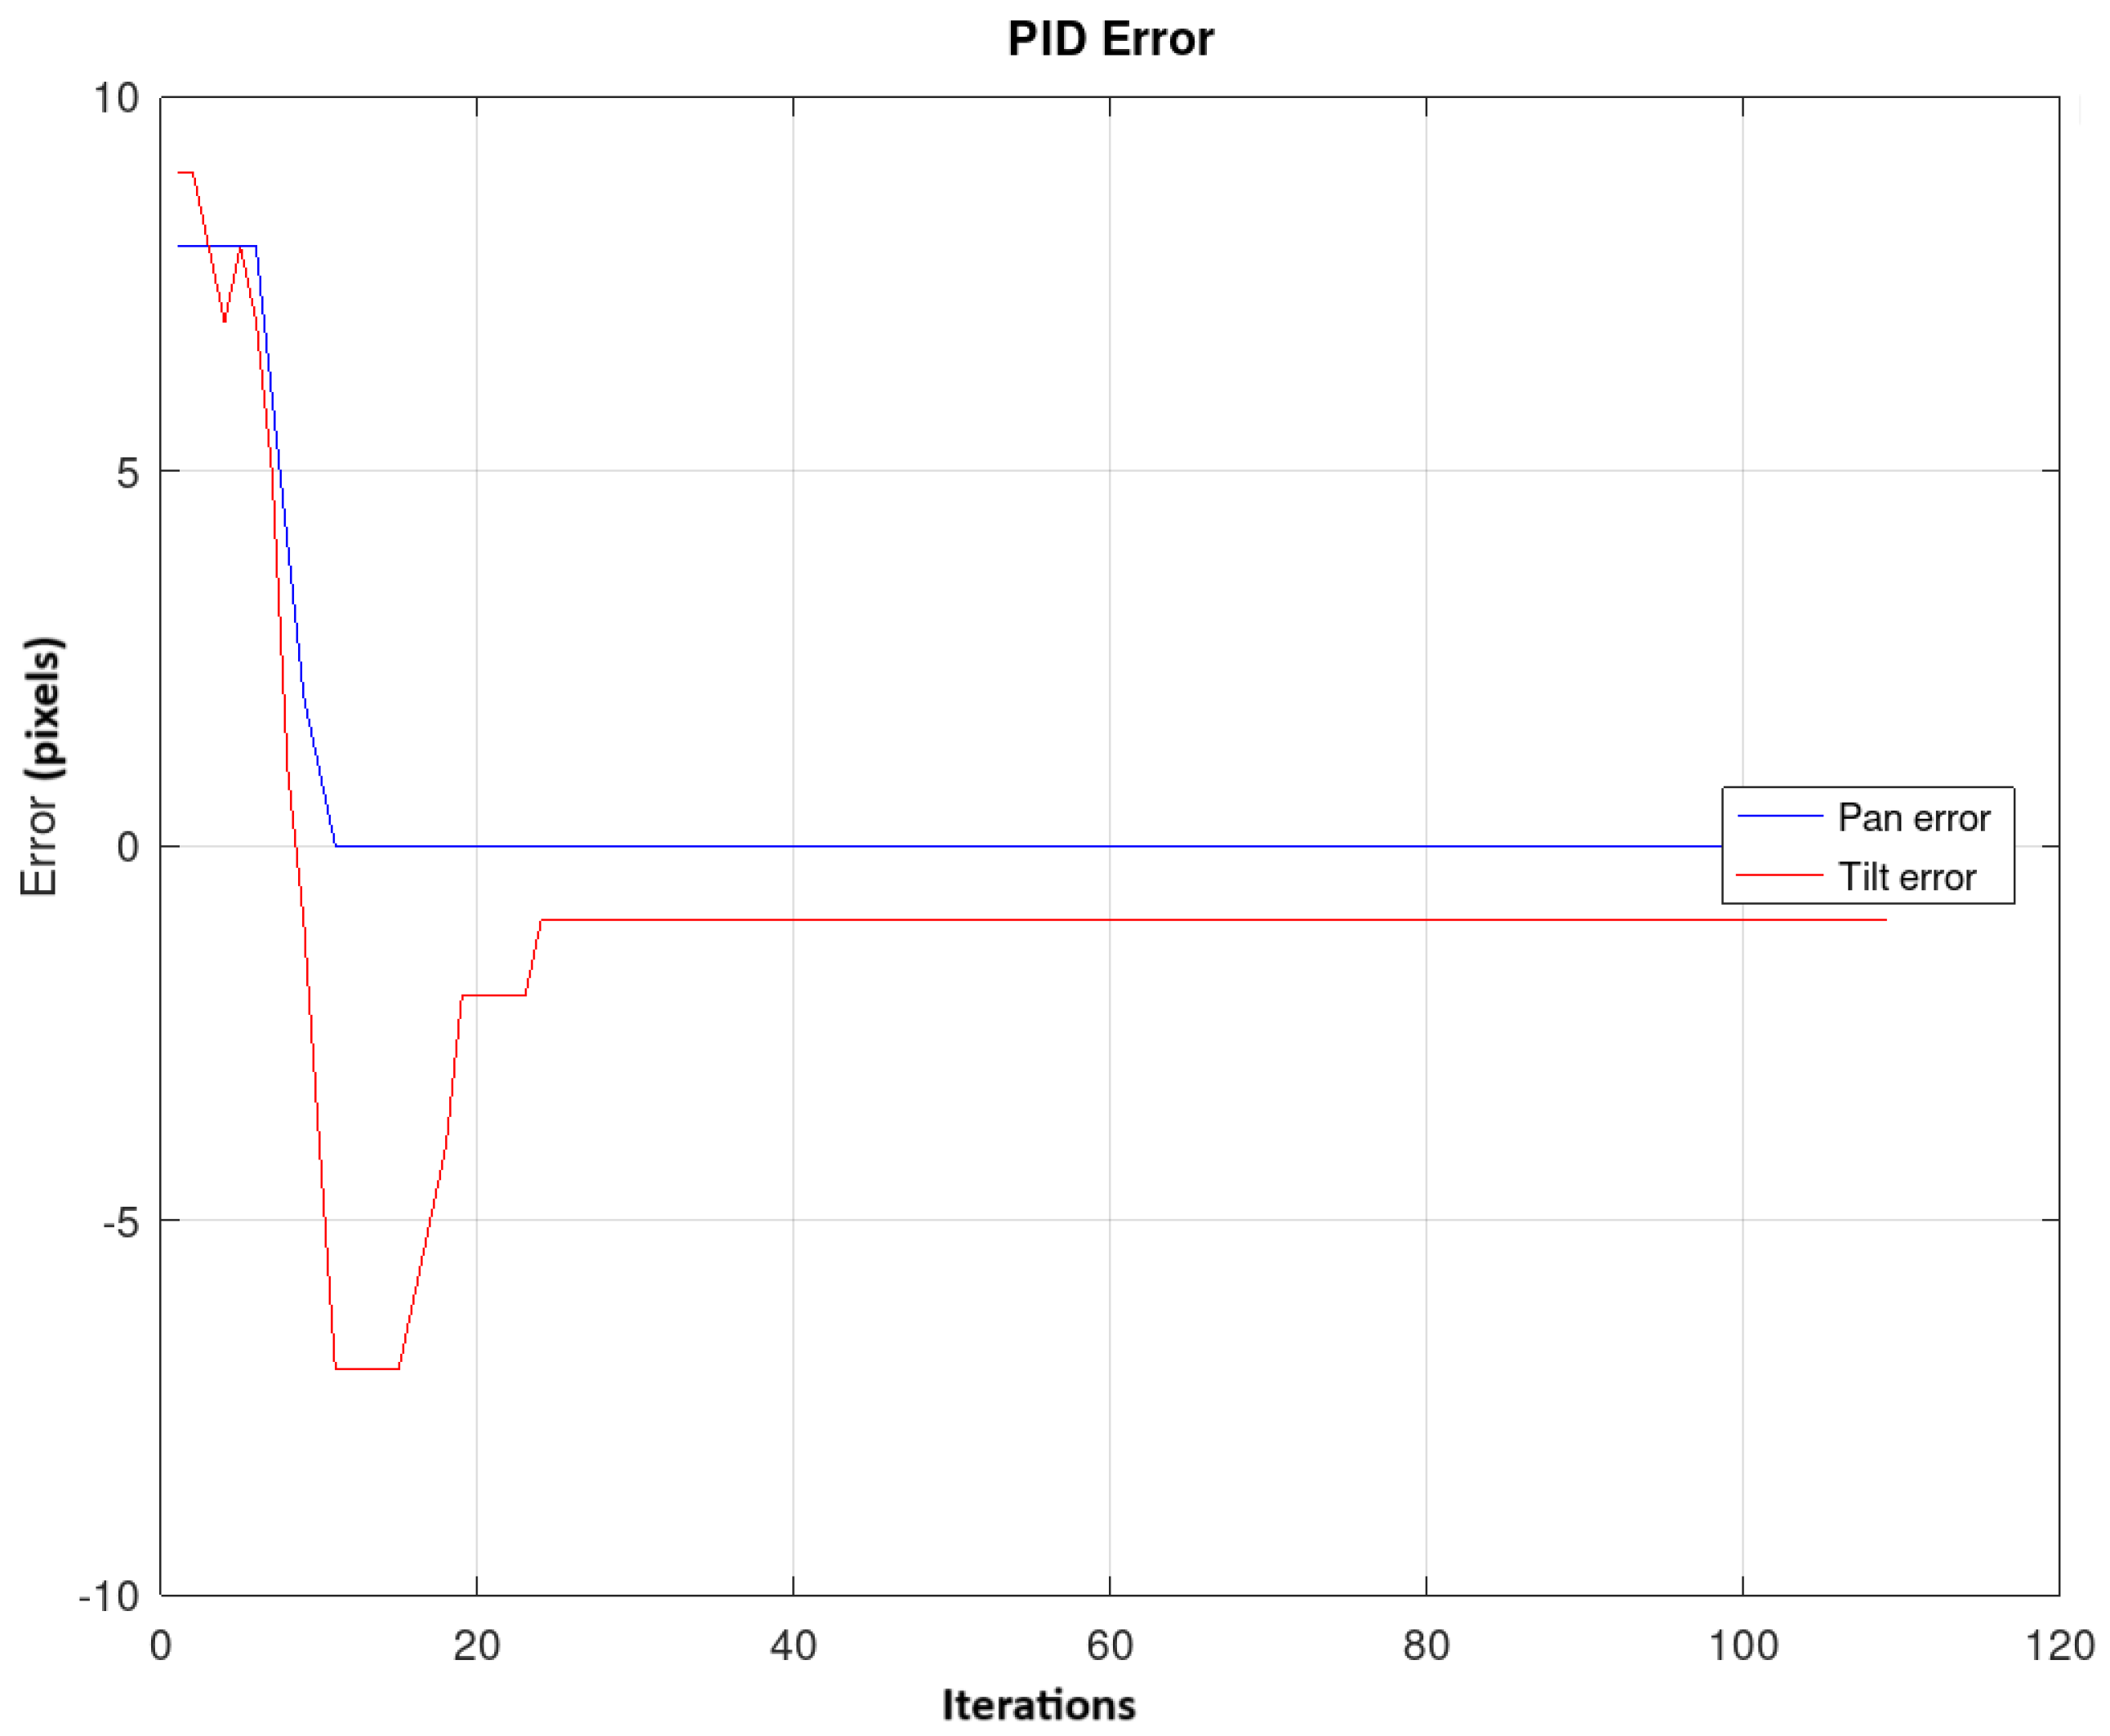
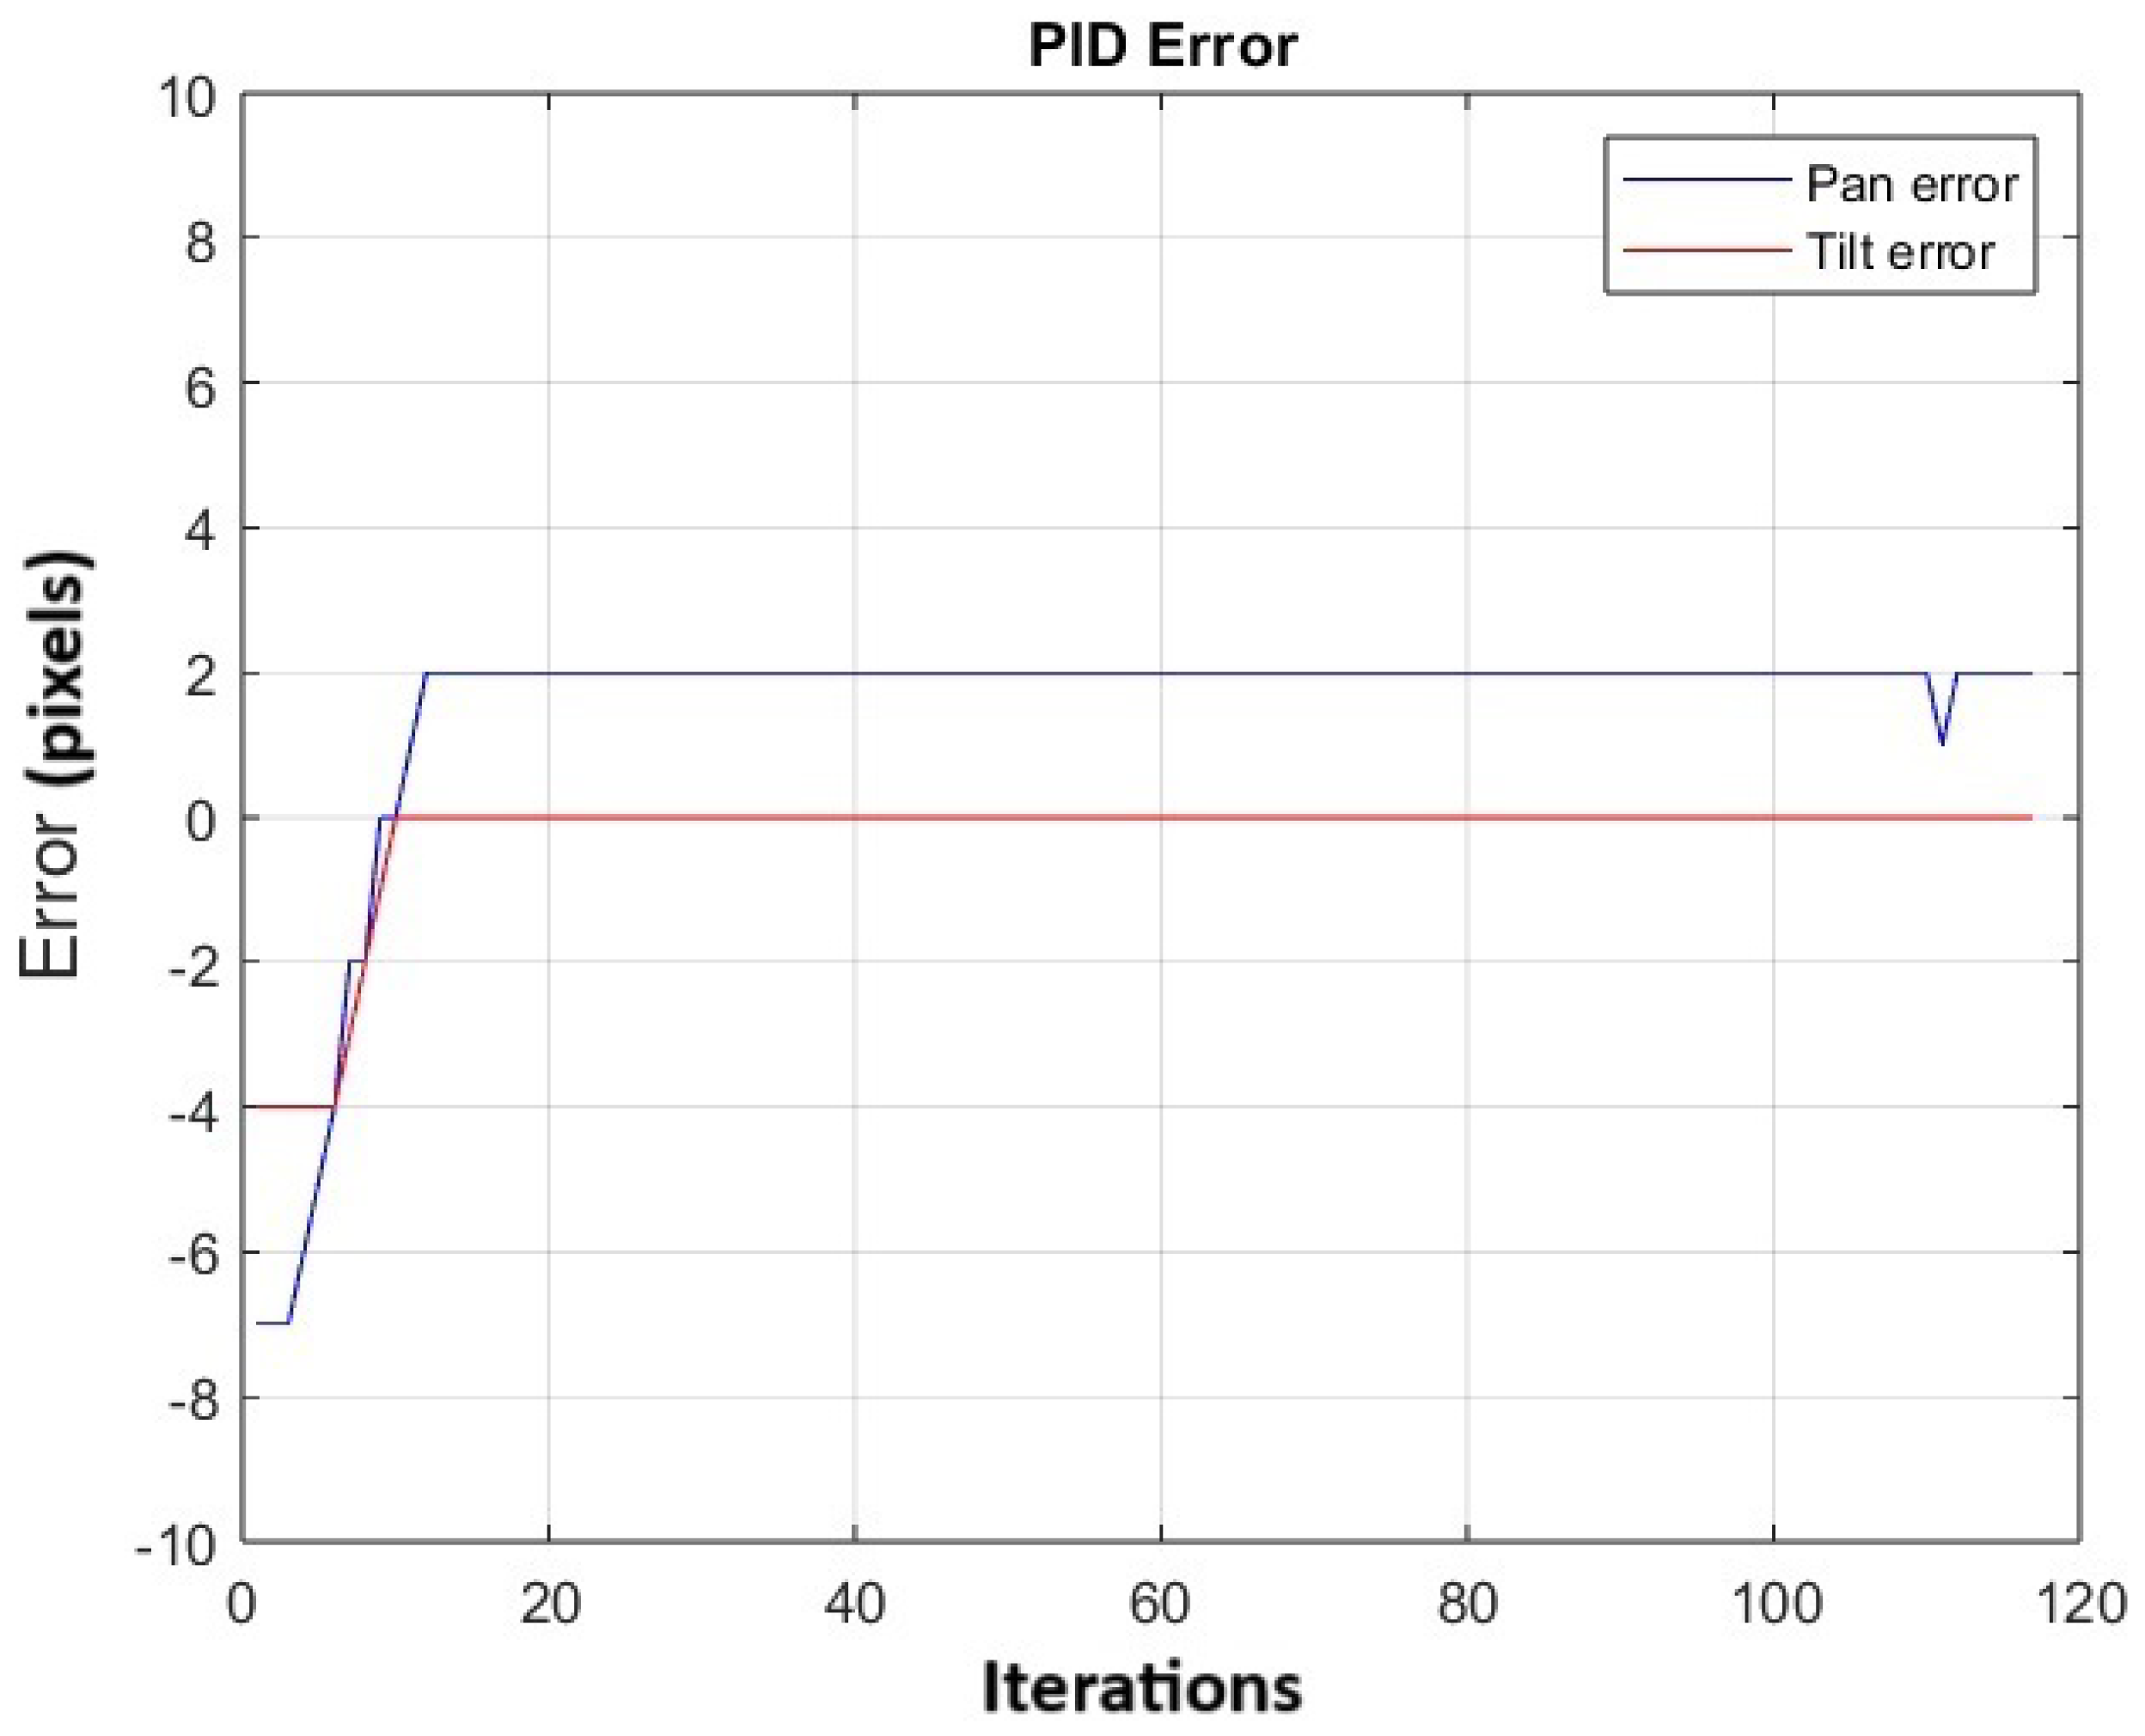
4.1. Experiment 1

This experiment evaluates the response of the PID to a stationary green object placed at the lower edge of a blackboard (Figure 13). At the beginning, the centroid of the segmented green object was located at the coordinates (180, 57) in the webcam image plane (Figure 13a,d). The tracking system is configured to follow the green color, and the pan–tilt system moves the camera until the object’s centroid is near the center of the image plane (Figure 13b,d).
The experiment was repeated 20 times. Figure 14 shows the change in the average error in both pan and tilt across the 20 repetitions, as the control action is applied to move the robot head and center the object in the image plane. The error on the x-axis reaches a value of 0, while the average error on the y-axis is −1.8.
Subsequently, the response of the PID controller to track a moving green object is evaluated. In this experiment, the centroid of the object in the image plane changes as the green object is moved in different directions. Figure 15 shows a sequence of various movements and demonstrates how the PTU follows the green object, attempting to keep it centered in the image plane. In the following link https://n9.cl/00qv56 (accessed on 30 September 2024), videos with the robot head tracking were uploaded.
The experiment was repeated 20 times. Figure 16 shows the variation in the average error for both the pan and tilt in the 20 repetitions. Peaks are observed along the trajectory, which correspond to instances when the object is moved to various positions. Additionally, the average absolute error in panning is 1.59 pixels and in tilting is 1.15 pixels, indicating that the object remains near the center of the image plane.
The performance of the controller was evaluated using the gains Kp = 0.7, Ki = 0.2, and Kd = 0.01, which were were obtained in [28] through the manual adjustment of the controller. The experiment was repeated 20 times. Figure 17 shows the variation in the average error for both the pan and tilt in the 20 repetitions. Peaks are observed along the trajectory, which correspond to instances when the object is moved to various positions. Additionally, the average absolute error in panning is 2.64 pixels and in tilting is 2.32 pixels.
Table 3 presents the average absolute error and standard deviation for the PID parameters optimized manually and using the GA. When the parameters optimized by the GA are applied, the standard deviation is lower, indicating that the PID response exhibits reduced oscillations. Additionally, the average values suggest that the object remains closer to the center of the image plane.

4.2. Experiment 2

First, this experiment evaluates the response of the PID controller to a fixed pineapple placed on a table. Figure 18 shows that, in the images of the left column, the centroid of the pineapple is not in the center of the image plane. The centroid is located at coordinates (454, 316). In the images of the right column, the control action is observed to have been performed, and the centroid of the pineapple is close to the center of the image plane.
The experiment was repeated 20 times. Figure 19 shows the change in the average error for both pan and tilt across the 20 repetitions, as the control action is applied. It is observed that the error on the y-axis reaches a value of 0, while the average error on the x-axis is 2.
Second, the response of the PID controller to track a moving pineapple is evaluated. In this experiment, the centroid of the object in the image plane changes as the pineapple is moved in different directions. Figure 20 shows a sequence of various movements and how the PTU follows the pineapple, trying to keep it in the center of the image plane. In the following link https://n9.cl/00qv56 (accessed on 30 September 2024), videos with the robot head tracking were uploaded.
The experiment was repeated 20 times. Figure 21 shows the change in the average error for both pan and tilt across the 20 repetitions. Peaks are observed along the trajectory, corresponding to instances when the object is moved to different positions. Additionally, it is observed that along the trajectory, the average error in panning is 1.25 pixels and in tilting is −0.90 pixels, indicating that the object remains near the center of the image plane.

5. Discussion

Object tracking is an important task in robotics, as it allows robots to perform activities such as monitoring human actions, agricultural products, livestock, and more. In this work, we propose a method to track a moving pineapple with a robot head, ensuring that the centroid of the pineapple remains at the center of the image captured by a webcam. To achieve this, a genetic algorithm was employed to optimize the parameters of a multivariate Gaussian filter, which was used to segment the body of the pineapple. The training to optimize the parameters is time-consuming, however, the real-time execution of the filter is fast since only (2) is evaluated. A small set of images was used to optimize the parameters. The images were captured in an indoor setting, with the distance between the pineapple and the camera varying approximately between 0.30 and 1.5 m. Each image ensures that the entire pineapple remains visible without occlusions, while the background consists of different colors and textures. In addition, the table used in the setup was chosen to have a color similar to that of the body of the pineapple to improve the robustness of the filtering process. Pineapple tracking experiments with the robot were conducted in a classroom environment with higher illumination levels. The results demonstrated that the system was capable of successfully tracking the pineapple. Regarding occlusions, even if the pineapple body is only partially detected, it is sufficient to place it in the center of the image plane, and the vision system will continue tracking the object. Figure 9, Figure 10 and Figure 11 show the results of segmenting the pineapple using the MGF. The images, captured outdoors, feature varying lighting conditions, and some include occlusions. The results indicate that the MGF struggles to segment pineapples with green hues, due to the fact that it was trained using images of pineapples with yellow hues. However, for pineapples with yellow hues, the MGF successfully segmented part of the object, even in the presence of occlusions. Therefore, it can be concluded that the MGF demonstrates robust performance in segmenting pineapples with yellow hues in real-world environments. We optimized the parameters of two PID controllers to control the two servo motors of a PTU, enabling the tracking of segmented objects. The mathematical model of the PTU is not available, and the optimization of the PID controller parameters was performed while the tracking system was running. The best individual was selected based on the lowest cumulative error (8). However, agricultural environments are often influenced by weather conditions and other external factors, necessitating a robust tracking vision system. Active Disturbance Rejection Control (ADRC) [37] has been successfully applied across various areas of agricultural production. Notably, ADRC has demonstrated significant effectiveness in motion control by addressing challenges posed by unstructured environmental factors such as terrain variability, soil conditions, and wind direction. For the outdoor navigation of the omnidirectional robot, the implementation of Active Disturbance Rejection Control (ADRC) will be evaluated. ADRC is particularly suitable as it does not require an explicit mathematical model and has been successfully applied in various areas of agricultural production. Its advantages, including simplicity of implementation, ease of tuning, high robustness, and strong disturbance rejection capabilities, make it a promising approach for enhancing the robot’s navigation performance in unstructured environments.

6. Conclusions

In this research, the parameters of a multivariate Gaussian filter were optimized to segment pineapples and the parameters of two PID controllers to track the centroid of the segmented object, in order to make it coincide with the center of the image plane captured with a webcam mounted on a robot head (Figure 2). The architecture was implemented using ROS2 (Figure 3). The experiments demonstrated that the robot head is capable of tracking objects of interest almost instantaneously, and some videos can be seen in the following link https://n9.cl/00qv56 (accessed on 30 September 2024). Previous studies have not addressed the segmentation of fruits with complex color patterns or rough textures. The results obtained in this work allow a robot to approach pineapples, assess their condition, and make decisions regarding the supply of fertilizers, water, and other agricultural factors. Additionally, the system can determine the optimal harvest time. The multivariate Gaussian filter can be trained and optimized to detect other rough fruits such as soursop or melon. Future work will focus on an omnidirectional robot (Figure 1) that captures images of different pineapples to assess their health status based on their color and texture. This supports decision-making for harvesting, insecticide application, and other agricultural tasks. It is also planned to integrate a 3D vision sensor to combine depth information with 2D information, in order to have a more robust system that can better handle environmental variations. Although the pineapples will not be in motion, as the robot moves, its head must move to keep the pineapple in its field of view. For this reason, the results obtained in this work are important to continue with the next phase of the project. The architecture proposed in this work was implemented in ROS2, which operates using a node-based structure, where each node represents a specific task. To enhance the performance of the proposed system, it can be configured within a network structure that allows for simultaneous task execution and communication link failures [38]. Furthermore, the graph-based optimization methods reviewed in [39] will be further investigated to optimize PID controller parameters and improve image segmentation for object tracking. This optimization aims to enhance the system’s ability to accurately match and track objects with complex color patterns.

Author Contributions

Conceptualization, S.H.-M. and C.M.-M.; methodology, S.H.-M., C.M.-M., A.M.-H. and S.F.R.-P.; software, S.H.-M. and C.M.-M.; validation, S.H.-M., C.M.-M., A.M.-H., I.M.-C. and S.F.R.-P.; formal analysis, S.H.-M., C.M.-M., A.M.-H., I.M.-C. and S.F.R.-P.; investigation, S.H.-M., C.M.-M., A.M.-H., I.M.-C. and S.F.R.-P.; resources, S.H.-M., C.M.-M., A.M.-H., I.M.-C. and S.F.R.-P.; writing—original draft preparation, S.H.-M., C.M.-M., A.M.-H., I.M.-C. and S.F.R.-P.; writing—review and editing, S.H.-M., C.M.-M., A.M.-H., I.M.-C. and S.F.R.-P.; visualization, S.H.-M., C.M.-M., A.M.-H., I.M.-C. and S.F.R.-P.; supervision, S.H.-M., C.M.-M., A.M.-H., I.M.-C. and S.F.R.-P. All authors have read and agreed to the published version of the manuscript.

Funding

This research received no external funding.

Institutional Review Board Statement

Not applicable, as no participants involved.

Informed Consent Statement

Informed consent was obtained from all subjects who were shown in the figures and videos.

Data Availability Statement

Publicly available videos with the robot head tracking can be found here https://n9.cl/00qv56 (accessed on 30 September 2024).

Conflicts of Interest

The authors declare no conflicts of interest.

References

  1. Feidakis, M.; Gkolompia, I.; Marnelaki, A.; Marathaki, K.; Emmanouilidou, S.; Agrianiti, E. NAO robot, an educational assistant in training, educational and therapeutic sessions. In Proceedings of the 2023 IEEE Global Engineering Education Conference (EDUCON), Kuwait, Kuwait, 1–4 May 2023; pp. 1–6. [Google Scholar] [CrossRef]
  2. Sulistijono, I.A.; Rois, M.; Yuniawan, A.; Binugroho, E.H. Teleoperated Food and Medicine Courier Mobile Robot for Infected Diseases Patient. In Proceedings of the TENCON 2021—2021 IEEE Region 10 Conference (TENCON), Auckland, New Zealand, 7–10 December 2021; pp. 620–625. [Google Scholar] [CrossRef]
  3. Sunardi, M.; Perkowski, M. Behavior Expressions for Social and Entertainment Robots. In Proceedings of the 2020 IEEE 50th International Symposium on Multiple-Valued Logic (ISMVL), Miyazaki, Japan, 9–11 November 2020; pp. 271–278. [Google Scholar] [CrossRef]
  4. Fischer, K. Defining Interaction as Coordination Benefits both HRI Research and Robot Development: Entering Service Interactions. In Proceedings of the 2023 32nd IEEE International Conference on Robot and Human Interactive Communication (RO-MAN), Busan, Republic of Korea, 28–31 August 2023; pp. 213–219. [Google Scholar] [CrossRef]
  5. Christensen, H.; Amato, N.; Yanco, H.; Mataric, M.; Choset, H.; Drobnis, A.; Goldberg, K.; Grizzle, J.; Hager, G.; Hollerbach, J.; et al. A roadmap for us robotics—From internet to robotics 2020 edition. Found. Trends Robot. 2021, 8, 307–424. [Google Scholar] [CrossRef]
  6. Siciliano, B.; Khatib, O.; Kröger, T. Springer Handbook of Robotics; Springer: Berlin/Heidelberg, Germany, 2008; Volume 200. [Google Scholar]
  7. Cao, Y.; Ke, Z.; Li, S.; Zhao, S.; Wang, J.; Xu, S. Data-Driven Trajectory Tracking Control Algorithm Design for Fast Migration to Different Autonomous Vehicles. In Proceedings of the 2024 IEEE Intelligent Vehicles Symposium (IV), Jeju Island, Republic of Korea, 2–5 June 2024; pp. 2709–2716. [Google Scholar] [CrossRef]
  8. Ayranci, A.A.; Erkmen, B. Edge Computing and Robotic Applications in Modern Agriculture. In Proceedings of the 2024 International Congress on Human-Computer Interaction, Optimization and Robotic Applications (HORA), Istanbul, Turkey, 23–25 May 2024; pp. 1–6. [Google Scholar] [CrossRef]
  9. Duca, O.; Minca, E.; Filipescu, A.; Cernega, D.; Solea, R.; Filipescu, A. Flexible Manufacturing with Integrated Robotic Systems in the Context of Industry 5.0. In Proceedings of the 2023 IEEE 28th International Conference on Emerging Technologies and Factory Automation (ETFA), Sinaia, Romania, 12–15 September 2023; pp. 1–7. [Google Scholar] [CrossRef]
  10. Ariza-Sentís, M.; Vélez, S.; Martínez-Peña, R.; Baja, H.; Valente, J. Object detection and tracking in Precision Farming: A systematic review. Comput. Electron. Agric. 2024, 219, 108757. [Google Scholar] [CrossRef]
  11. Tang, Y.; Chen, M.; Wang, C.; Luo, L.; Li, J.; Lian, G.; Zou, X. Recognition and Localization Methods for Vision-Based Fruit Picking Robots: A Review. Front. Plant Sci. 2020, 11, 510. [Google Scholar] [CrossRef] [PubMed]
  12. Hu, N.; Su, D.; Wang, S.; Nyamsuren, P.; Qiao, Y.; Jiang, Y.; Cai, Y. LettuceTrack: Detection and tracking of lettuce for robotic precision spray in agriculture. Front. Plant Sci. 2022, 13, 1003243. [Google Scholar] [CrossRef] [PubMed]
  13. Su, F.; Fang, G. Moving object tracking using an adaptive colour filter. In Proceedings of the 2012 12th International Conference on Control Automation Robotics & Vision (ICARCV), Guangzhou, China, 5–7 December 2012; IEEE: Piscataway, NJ, USA, 2012; pp. 1048–1052. [Google Scholar]
  14. Clark, M.; Feldpausch, D.; Tewolde, G.S. Microsoft kinect sensor for real-time color tracking robot. In Proceedings of the IEEE International Conference on Electro/Information Technology, Milwaukee, WI, USA, 5–7 June 2014; IEEE: Piscataway, NJ, USA, 2014; pp. 416–421. [Google Scholar]
  15. Terven, J.; Córdova-Esparza, D.M.; Romero-González, J.A. A Comprehensive Review of YOLO Architectures in Computer Vision: From YOLOv1 to YOLOv8 and YOLO-NAS. Mach. Learn. Knowl. Extr. 2023, 5, 1680–1716. [Google Scholar] [CrossRef]
  16. Chen, Y.; Xu, H.; Chang, P.; Huang, Y.; Zhong, F.; Jia, Q.; Chen, L.; Zhong, H.; Liu, S. CES-YOLOv8: Strawberry Maturity Detection Based on the Improved YOLOv8. Agronomy 2024, 14, 1353. [Google Scholar] [CrossRef]
  17. Ukida, H.; Terama, Y.; Ohnishi, H. Object tracking system by adaptive pan-tilt-zoom cameras and arm robot. In Proceedings of the 2012 Proceedings of SICE Annual Conference (SICE), Akita, Japan, 20–23 August 2012; IEEE: Piscataway, NJ, USA, 2012; pp. 1920–1925. [Google Scholar]
  18. Saragih, C.F.D.; Kinasih, F.M.T.R.; Machbub, C.; Rusmin, P.H.; Rohman, A.S. Visual Servo Application Using Model Predictive Control (MPC) Method on Pan-tilt Camera Platform. In Proceedings of the 2019 6th International Conference on Instrumentation, Control, and Automation (ICA), Bandung, Indonesia, 31 July–2 August 2019; pp. 1–7. [Google Scholar] [CrossRef]
  19. Yosafat, S.R.; Machbub, C.; Hidayat, E.M.I. Design and implementation of Pan-Tilt control for face tracking. In Proceedings of the 2017 7th IEEE International Conference on System Engineering and Technology (ICSET), Shah Alam, Malaysia, 2–3 October 2017; pp. 217–222. [Google Scholar] [CrossRef]
  20. Chen, J.; Tian, G. A Tuning Method for Speed Tracking Controller Parameters of Autonomous Vehicles. Appl. Sci. 2024, 14, 10209. [Google Scholar] [CrossRef]
  21. Li, K.; Bai, Y.; Zhou, H. Research on Quadrotor Control Based on Genetic Algorithm and Particle Swarm Optimization for PID Tuning and Fuzzy Control-Based Linear Active Disturbance Rejection Control. Electronics 2024, 13, 4386. [Google Scholar] [CrossRef]
  22. Liang, H.; Zou, J.; Zuo, K.; Khan, M.J. An improved genetic algorithm optimization fuzzy controller applied to the wellhead back pressure control system. Mech. Syst. Signal Process. 2020, 142, 106708. [Google Scholar] [CrossRef]
  23. Chen, Y.S.; Hung, Y.H.; Lee, M.Y.J.; Chang, J.R.; Lin, C.K.; Wang, T.W. Advanced Study: Improving the Quality of Cooling Water Towers’ Conductivity Using a Fuzzy PID Control Model. Mathematics 2024, 12, 3296. [Google Scholar] [CrossRef]
  24. Wang, D.; Tan, D.; Liu, L. Particle swarm optimization algorithm: An overview. Soft Comput. 2018, 22, 387–408. [Google Scholar] [CrossRef]
  25. Arulkumaran, K.; Deisenroth, M.P.; Brundage, M.; Bharath, A.A. Deep reinforcement learning: A brief survey. IEEE Signal Process. Mag. 2017, 34, 26–38. [Google Scholar] [CrossRef]
  26. Goldberg, D.E. The Design of Innovation: Lessons from and for Competent Genetic Algorithms; Springer Science & Business Media: Berlin/Heidelberg, Germany, 2013; Volume 7. [Google Scholar]
  27. Lambora, A.; Gupta, K.; Chopra, K. Genetic algorithm—A literature review. In Proceedings of the 2019 International Conference on Machine Learning, Big Data, Cloud and Parallel Computing (COMITCon), Faridabad, India, 14–16 February 2019; IEEE: Piscataway, NJ, USA, 2019; pp. 380–384. [Google Scholar]
  28. Hernandez-Mendez, S.; Maldonado-Mendez, C.; Marin-Hernandez, A.; Rios-Figueroa, H.V. Detecting falling people by autonomous service robots: A ROS module integration approach. In Proceedings of the 2017 International Conference on Electronics, Communications and Computers (CONIELECOMP), Cholula, Mexico, 22–24 February 2017; pp. 1–7. [Google Scholar] [CrossRef]
  29. Quigley, M.; Conley, K.; Gerkey, B.; Faust, J.; Foote, T.; Leibs, J.; Wheeler, R.; Ng, A.Y. ROS: An open-source Robot Operating System. In Proceedings of the ICRA Workshop on Open Source Software, Kobe, Japan, 12–17 May 2009; Volume 3, p. 5. [Google Scholar]
  30. Yang, Y.; Azumi, T. Exploring real-time executor on ros 2. In Proceedings of the 2020 IEEE International Conference on Embedded Software and Systems (ICESS), Shanghai, China, 10–11 December 2020; IEEE: Piscataway, NJ, USA, 2020; pp. 1–8. [Google Scholar]
  31. Hossain, M. World pineapple production: An overview. Afr. J. Food Agric. Nutr. Dev. 2016, 16, 11443–11456. [Google Scholar] [CrossRef]
  32. Peng, G.; Lam, T.L.; Hu, C.; Yao, Y.; Liu, J.; Yang, F. Introduction to ROS 2 and Programming Foundation. In Introduction to Intelligent Robot System Design: Application Development with ROS; Springer: Berlin/Heidelberg, Germany, 2023; pp. 541–566. [Google Scholar]
  33. Sigut, J.; Castro, M.; Arnay, R.; Sigut, M. OpenCV Basics: A Mobile Application to Support the Teaching of Computer Vision Concepts. IEEE Trans. Educ. 2020, 63, 328–335. [Google Scholar] [CrossRef]
  34. Prince, S.J. Computer Vision: Models, Learning, and Inference; Cambridge University Press: Cambridge, UK, 2012. [Google Scholar]
  35. Adhilpk. Pineapple Dataset. 2023. Available online: https://www.kaggle.com/datasets/adhilpk/pineapple (accessed on 21 February 2025).
  36. Borase, R.P.; Maghade, D.; Sondkar, S.; Pawar, S. A review of PID control, tuning methods and applications. Int. J. Dyn. Control 2021, 9, 818–827. [Google Scholar] [CrossRef]
  37. Tu, Y.H.; Wang, R.F.; Su, W.H. Active Disturbance Rejection Control—New Trends in Agricultural Cybernetics in the Future: A Comprehensive Review. Machines 2025, 13, 111. [Google Scholar] [CrossRef]
  38. Wang, S.; Wang, M. The strong connectivity of bubble-sort star graphs. Comput. J. 2018, 62, 715–729. [Google Scholar] [CrossRef]
  39. Pan, C.H.; Qu, Y.; Yao, Y.; Wang, M.J.S. HybridGNN: A Self-Supervised Graph Neural Network for Efficient Maximum Matching in Bipartite Graphs. Symmetry 2024, 16, 1631. [Google Scholar] [CrossRef]
Figure 1. Omnidirectional robot used in the experiments. The robot’s head, located at the top, where a webcam is mounted on the pan–tilt unit.
Computation 13 00069 g001
Figure 2. The two images on the left show the robot head mounted on an PTU, with a webcam housed inside. The angular positions of the PTU are obtained using an Arduino Due board. The image on the right illustrates PTU, which consists of two motors: one for movement along the x-axis and another for movement along the y-axis.
Computation 13 00069 g002
Figure 4. Communication graph of nodes and topics in ROS2.
Computation 13 00069 g004
Figure 5. A total of 35 photos of pineapples were used to train the MGF and optimize its parameters with the GA.
Computation 13 00069 g005
Figure 6. In the upper part, 3 images are shown where the body of the pineapple are manually colored in black. The lower part shows the images generated in MATLAB, where the black pixels are changed to white, and the remaining pixels are colored black.
Computation 13 00069 g006
Figure 7. The segmented pineapples are shown using the best individual from the GA.
Computation 13 00069 g007
Figure 8. The image processing steps applied to calculate the centroid of the pineapple body are shown: (a) the original image, (b) the segmented image with the MGF filter optimized with the GA, (c) the image resulting from the application of the smoothing filter, (d) the image after contour detection, and (e) the blue point indicating the centroid of the pineapple contour.
Computation 13 00069 g008
Figure 9. The upper images depict pineapples captured in an outdoor environment, while the lower images display the segmented pineapple highlighted with a green outline.
Computation 13 00069 g009
Figure 10. Images of pineapples with green hues captured in an outdoor environment [35]. The green outline indicates the segmentation of a pineapple, which is an incorrect detection.
Computation 13 00069 g010
Figure 11. Images of pineapples with shades similar to those used during training taken from [35]. The green circle highlights the segmented pineapple, while the blue dot represents the centroid of the segmented area. In (b,c,e,g,h), the segmentation results are accurate. In (a), only the pineapple body with yellow hues was segmented. In (d,f), partial segmentation of the pineapple body is observed due to occlusions in these images.
Computation 13 00069 g011
Figure 12. The visual information is processed to segment the object of interest, and this centroid is calculated. Two PID controllers in the pan and tilt unit are used, in order to track the object with a minimum error and soft movement. For this purpose, the centroid of the object is located at the center of the plane image.
Computation 13 00069 g012
Figure 13. The images show the green square placed at the bottom of the board. In (a,c), the centroid of the green object does not coincide with the center of the image plane; in (b,d), the control action was applied, and the centroid of the green object was positioned near the center of the image plane. The purple circle indicates the segmented object.
Computation 13 00069 g013
Figure 14. It shows the change in the average error for both pan and tilt across the 20 repetitions.
Computation 13 00069 g014
Figure 15. Tracking the green object with the robot head. The purple circle indicates the segmented object.
Computation 13 00069 g015
Figure 16. It shows the change in the average error in the pan and tilt of the 20 repetitions by following the moving green object. The PID was optimized with the GA.
Computation 13 00069 g016
Figure 17. It shows the change in the average error in the pan and tilt of the 20 repetitions by following the moving green object.
Computation 13 00069 g017
Figure 18. The images show the pineapple placed on a table. In the images of the left column, the robot head does not observe the centroid of the pineapple in the center of its image plane. In the images in the right column, the control action is observed to have been performed, and the centroid of the pineapple is close to the center of the image plane. The purple circle indicates the segmented object.
Computation 13 00069 g018
Figure 19. It shows the change in the average error in the pan and tilt of the 20 repetitions. The PID was optimized manually.
Computation 13 00069 g019
Figure 20. Tracking the pineapple with the robot head. The purple circle indicates the segmented object.
Computation 13 00069 g020
Figure 21. The figure shows the change in the average error in the pan and tilt across the 20 repetitions while tracking the moving pineapple.
Computation 13 00069 g021
Table 1. GA Statistical Results for Optimizing MGF Parameters.
MetricValue
Mean73.12%
Median71.5%
Standard Deviation14.7
Best Fit98%
Worst Fit53%
Table 2. GA statistical results for Optimizing PID Parameters.
MetricIAEIndividual
Mean202.32
Median201.50
Standard Deviation63.08
Best PanFit88 K p = 0.20 K i = 0.010 K d = 0.534
Best Tilt Fit K p = 0.23 K i = 0.008 K d = 0.535
Table 3. Statistical Results of PID.
Average Absolute Error (Pixels)Standard Deviation (Pixels)
Optimization MethodPanTiltPanTilt
AG1.591.151.61.74
Manually2.642.323.822.81
Disclaimer/Publisher’s Note: The statements, opinions and data contained in all publications are solely those of the individual author(s) and contributor(s) and not of MDPI and/or the editor(s). MDPI and/or the editor(s) disclaim responsibility for any injury to people or property resulting from any ideas, methods, instructions or products referred to in the content.

