Article

The Problem of Effective Evacuation of the Population from Floodplains under Threat of Flooding: Algorithmic and Software Support with Shortage of Resources

by
Oksana Yu. Vatyukova
,
Anna Yu. Klikunova
,
Anna A. Vasilchenko
,
Alexander A. Voronin
,
Alexander V. Khoperskov
*,† and
Mikhail A. Kharitonov
Volgograd State University, Universitetsky pr., 100, 400062 Volgograd, Russia
*
Author to whom correspondence should be addressed.
These authors contributed equally to this work.
Computation 2023, 11(8), 150; https://doi.org/10.3390/computation11080150
Submission received: 29 June 2023 / Revised: 26 July 2023 / Accepted: 27 July 2023 / Published: 1 August 2023
(This article belongs to the Special Issue Control Systems, Mathematical Modeling and Automation II)

Abstract

:
Extreme flooding of the floodplains of large lowland rivers poses a danger to the population due to the vastness of the flooded areas. This requires the organization of safe evacuation in conditions of a shortage of temporary and transport resources due to significant differences in the moments of flooding of different spatial parts. We consider the case of a shortage of evacuation vehicles, in which the safe evacuation of the entire population to permanent evacuation points is impossible. Therefore, the evacuation is divided into two stages with the organization of temporary evacuation points on evacuation routes. Our goal is to develop a method for analyzing the minimum resource requirement for the safe evacuation of the population of floodplain territories based on a mathematical model of flood dynamics and minimizing the number of vehicles on a set of safe evacuation schedules. The core of the approach is a numerical hydrodynamic model in shallow water approximation. Modeling the hydrological regime of a real water body requires a multi-layer geoinformation model of the territory with layers of relief, channel structure, and social infrastructure. High-performance computing is performed on GPUs using CUDA. The optimization problem is a variant of the resource investment problem of scheduling theory with deadlines for completing work and is solved on the basis of a heuristic algorithm. We use the results of numerical simulation of floods for the Northern part of the Volga-Akhtuba floodplain to plot the dependence of the minimum number of vehicles that ensure the safe evacuation of the population. The minimum transport resources depend on the water discharge in the Volga river, the start of the evacuation, and the localization of temporary evacuation points. The developed algorithm constructs a set of safe evacuation schedules for the minimum allowable number of vehicles in various flood scenarios. The population evacuation schedules constructed for the Volga-Akhtuba floodplain can be used in practice for various vast river valleys.

1. Introduction

Statistics show an increase in the number of floods and annual losses from them, models forecast an increase in these trends [1,2,3], and 35–45 percent of the total number of natural disasters are due to hydrological events. The Center for Research on the Epidemiology of Disasters (CRED) 2022 reports highlight floods as the greatest hazard for many regions [4]. The death toll for the year was 5193 in Pakistan, India, Nigeria, South Africa, and Brazil alone. Moreover, the number of people affected by the floods in Pakistan and Bangladesh alone exceeded 40 million people. The economic losses are $35 billion in total in Pakistan, Australia, China, Nigeria, and India. For example, global climate and hydrological forecasts indicate an increase in the area that will be affected by floods in the future [5]. Thus, urbanized regions, transport networks, and basic infrastructure are under increasing threat of destruction due to floods.
The situation with the frequency of floods and their consequences in Russia and the CIS as a whole is in line with global trends [6,7,8,9]. Severe floods can be distinguished in the basin of the Amur River [10], the drainage basin of Lake Baikal [11], the regions of the Sochi Black Sea Coast and Krasnodar Territory [12] and other regions. Catastrophic events with a flood depth of more than 1.5 m are among the most severe types of emergency situations. Cases of flooding over an area of 100–1000 km 2 belong to the category of large floods, and the excess of 1000 km 2 has catastrophic consequences. Catastrophic floods due to heavy rains occur regularly in many regions of the country, the consequences of which are intensified due to the destruction of dams or the overflow of reservoirs [13,14]. Heavy rains in China triggered floods across the country in July 2020 that affected several million people and killed more than 140. Bangladesh is an example of a huge densely populated mega-region with regular flooding, since most of the country is floodplain [15].
Long-term efforts to create the hydraulic structures complex made it possible to significantly reduce the risk of high water in the Neva River and flooding of St. Petersburg [16]. A separate problem is surge floods, which are typical, for example, for the Kaliningrad region, the Lower Don [17], the Kuban river delta [7], the Black Sea bays [18], etc. The causes of severe floods are due to tsunami [19] and ice jams [20]. The most severe consequences are, as a rule, floods in mountainous areas. Note the catastrophic events in Krymsk (2012, Caucasus Mountains) [21], the accident at the Vajont dam (Vajont, 1963, Italy) [22,23], etc.
The limited time and transport resources are the main problem in organizing the effective evacuation of the population during floods. However, this problem can be largely compensated for by the availability of a relatively accurate forecast of the development of the emergency for some regions. Such water objects are the floodplains of large lowland rivers regulated by hydroelectric dams. Therefore, floodplains pose a serious danger to the life of the population during spring floods or heavy rainfall [15,24,25,26,27]. The effects of flash floods in urban areas are more severe. The influence of the anthropogenic factor can increase the number of flood victims in urban areas, especially in the road network [28,29]. Therefore, evacuation plans must be well-prepared and include the road network and traffic conditions.
Dam hydrograph control systems stimulate intensive floodplain urbanization and reduce the threat of large floods, but do not eliminate them. A slight excess of the safe level of flooding of these territories occurs quite often [1,30].
The low population density in vast floodplain areas and the flat relief make it very difficult to organize effective evacuation by land transport due to flooding of evacuation routes. On the other hand, the flooding of territories occurs relatively slowly with large differences in the flooding moments of different parts. This makes it possible to organize safe land evacuation with a relatively small number of vehicles in the presence of a reliable forecast of the spatial dynamics of flood waters and timely notification of the population. Therefore, the algorithms for organizing the safe evacuation of the population of floodplain territories under the conditions of a fairly accurate forecast of the development of floods are of great practical importance [31,32]. The improvement of high-performance computing technologies provides such forecasting and the development of appropriate algorithms has become possible on the basis of interdisciplinary simulations and solving various high-dimensional optimization problems [17,33,34,35,36,37,38,39,40].
Perhaps the main difficulty in modeling and optimizing evacuation processes is the high uncertainty of the components of the evacuation situation, in particular, the number of the evacuated population in each of the human settlements (HS), the moments of flooding of the HS, sections of the road network, the start time of evacuation, the number of vehicles for evacuation, localization of evacuation points (EP). The criterion for the effectiveness of the organization of evacuation is also ambiguous.
The problems of organizing the evacuation of the population during floods and modeling the corresponding evacuation situations are actively discussed in modern scientific literature. The most popular areas of research are listed below.
(A)
The choice of evacuation routes and locations of evacuation points are traditional problems [41,42,43,44,45,46,47,48,49,50,51,52]. The evacuation time is often chosen as an efficiency criterion [42,44,46,47,48,49], and the evacuation cost is an additional criterion [45,46,49].
(B)
Self-evacuation transport models [31,32,53,54] belong to the class of traffic microsimulations, describing the spread of traffic jams in the transport network. Stochastic programming methods allow minimizing the risk and time spent on the road to develop evacuation recommendations [54].
(C)
Uncertainty in the behavior of self-evacuating people when choosing evacuation routes (ER) and EP is studied on the basis of game-theoretic and agent-based modeling [47,50,53,55,56,57]. Simulating individual behavior over large areas using complex behavior models is computationally intensive.
These problems are relevant when urban areas are flooded, when overcoming the transport collapse with unorganized spontaneous self-evacuation of the population is essential. A high rate of flooding or the lack of a good forecast, the remoteness of evacuation points, the late start of evacuation require the involvement of the maximum possible number of vehicles to minimize evacuation time, which can exacerbate the problem of transport collapse. Therefore, the optimal choice of evacuation routes is an effective means of reducing the risk to life. Modeling the uncertainty in people’s behavior when choosing self-evacuation routes makes it possible to most accurately predict the development of an evacuation situation and make the choice of optimal organized evacuation routes. Maximizing the number of evacuation vehicles is not relevant in the case of low population density over a large area, low flooding rate, and a sufficiently accurate flood forecast. Thus, the traffic flows of spontaneous and organized evacuation do not create life risks. On the other hand, the lack of evacuation transports can be a major problem in such a situation.
Probabilistic modeling of the flooding occurrence and assessment of its risk for different zones of the territory are carried out in [58,59,60,61]. Flood risk assessment in the middle Chao Phraya River Basin (CPRB) was simultaneously analyzed and mapped as the product of flood hazard, and social vulnerability maps generated by fuzzy Analytic Hierarchy Process (AHP) and fuzzy logic [62]. This was calculated based on a physical status of evacuees, safe evacuation condition, shortest evacuation path, flood shelter, and road capacity. The aim of [63] is to identify urban areas in the Hail region that would be affected by simulated worst-case flash floods. The data sources for the soil type, infiltration, and initial moisture were utilized to create the coverage and index maps. To generate virtual floods, the authors ran the GSSHA model within the Watershed Modeling System (WMS) program to create the hazard map for flash flooding.
The authors of [64] performed the flood hazard assessment for a simulated 500-year flood event in the downstream floodplain of Onondaga Creek within Syracuse City, New York State, USA. Communities near Onondaga Creek were assigned designated evacuation shelters based on accessibility and distance to the shelters. The shortest possible evacuation routes were calculated. The impact of the lack of transport and time resources during evacuation on the mortality rate during floods is studied in [65]. The use of temporary engineering structures in areas of possible catastrophic flooding can significantly increase the efficiency of evacuation. The possibility of reducing flood damage through the construction of anti-flood dams is considered in [26,66]. An important direction is to identify the negative impact of floods on the health of the evacuated population [67,68]. It should be emphasized that such studies are carried out for specific areas, since each real water body has characteristic features [26,31,41,42,43,48,50,53,55,56,57,58,65].
General issues in [46,69,70] are the closest to our study. The above article is devoted to the problem of finding optimal evacuation routes using temporary shelters to minimize the total evacuation time and the risk of a possible secondary evacuation from several temporary shelters to permanent ones with restrictions on the total evacuation time, the number of vehicles and the capacity of the shelters. The authors proposed an approximation algorithm of polynomial complexity for solving the formulated two-criteria problem of integer programming. In addition, three model relationships between speed and traffic density are investigated. However, a specific territory is not considered in [46], and an example of model calculations is presented only for three NPs and three EPs.
Finally, since the most important component of evacuation modeling is a hydrodynamic model for forecasting the hydrological regime of a flooded area, we point out the current results of such computer modeling for various water systems [12,16,17,21,23,33,38,71,72]. Modeling of floods near rivers has shown its effectiveness for constructing cadastral maps of water supply [24,36,73]. Numerical models of water dynamics make it possible to better understand the mechanisms of occurrence of catastrophic consequences of floods, for example, for the tragedy in Krymsk (Krasnodar region, Russia) in 2012 [21]. Tsunamis or sea storm surges in estuaries, especially in the presence of wide deltas, are a source of flooding. Hydrodynamic models of such events describe well the dynamics of water level rise [8,17,37,74]. Separately, we single out a series of works devoted to the study of the hydrological regime of the Volga-Akhtuba Floodplain (VAF) during the spring flood, since the VAF is the testing ground for our study [24,25,75,76,77,78].
The minimization of risk to life is the general task of effectively organizing the evacuation of the population during floods in the literature cited above. Special cases are the minimization of the evacuation time of the population, and the maximization of the number of evacuated residents under given conditions (evacuation time and number of vehicles). The result is an optimal traffic schedule. Solving this problem is associated with several difficulties. First, there are no efficient solution algorithms due to the large dimension. Second, the constructed schedules are very sensitive to small changes in the number of vehicles. This instability hinders the practical implementation of optimal schedules under conditions of real transport uncertainty. Third, such optimal schedules may not be safe because they do not cover the entire population.
Our approach is based on solving the adjoint problem of finding the minimum number of vehicles that ensure the safe evacuation of the entire population. The proposed algorithm constructs a sequence of safe schedules corresponding to a sequence of decreasing number of vehicles. It is important that each of the schedules differs slightly from the two adjacent ones. Thus, the set of safe schedules is stable to changes in the number of vehicles and therefore can be used in real floods under conditions of transport uncertainty. The proposed approach is most effective in conditions of moderate floods in river floodplains with low population density and relative proximity to evacuation points. These conditions provide a sufficient margin of time for the repeated movement of each evacuation transport both along the same and along several different evacuation routes at a low average traffic flow density of the self-evacuating population.
The aim of our work is to develop a method for analyzing the minimum resource support for the safe evacuation of the population of floodplain areas based on a mathematical model for the development of floods and solving the problem of minimizing the number of vehicles on a set of safe evacuation schedules. The work [79] is devoted to finding the dependence of the vehicles minimum number on the parameters of the flood and the start of the evacuation, ensuring the safe evacuation of the entire population to permanent evacuation points. This work is aimed at solving the problem of safe evacuation in the event of a shortage of vehicles. In this case, the safety of evacuation is ensured by its division into two stages with the deployment of temporary evacuation points along evacuation routes.

2. Formulation of the Problem

Our study is aimed at calculating the functional dependence of the acceptable risk area boundary on the parameters of the evacuation situation: the hydrograph, the number of evacuation vehicles, the moment the evacuation begins, etc. We consider the evacuation of the entire population with its stay on ERs and in temporary EPs for an acceptable time as an acceptable risk. Here we do not study the problems of unorganized evacuation and the presence of the population in flooded HSs. Thus, our goal is to study the boundary of the domain of solution existence to the conditions system
R h ( E , S h ) = 0 , R e ( E , S h ) R ( l i m ) ,
where R h is the function of hydrological risk (damage to health and the threat of life loss due to being in a flooded area), R e = max i , j ( ϑ i j ) ( i = 1 , , N j , j = 1 , , n ) is the risk function due to a long stay on the ER and/or in the temporary EP under adverse external conditions (damage to health), N j is the number of inhabitants of the settlement j, ϑ i j is the duration of stay of the i-th inhabitant of the j-th HS on the ER in the temporary EP, n is the number of human settlements, R ( l i m ) is the maximum admissible value of the function R e . The evacuation situation tuple E in (1) is defined as follows:
E ( t ) = K f l ( t , Q ) , N , G , t ( 0 ) , M ,
where t is the time after the start of the flood, K f l ( t , Q ) is the digital map of the flooded area, Q = Q ( t ) is the river discharge (hydrograph), N = N 1 N n is the vector of the total number of human settlements, G is the road network graph, t ( 0 ) = t 1 ( 0 ) t n ( 0 ) is the evacuation start moment vector, M is the number of evacuation vehicles.
The construction of the parameters t ( 0 ) and M is the result of the preliminary stage of organizing the evacuation. These values form the time and transport resources of the evacuation schedule S h = G ˜ , | | m i , j | | , where G ˜ is the evacuation route graph, m i , j is the evacuation transport schedule matrix ( t = t ( 0 ) , T ; j = 1 , n ) along directed graph edges evacuation routes G ˜ . The elements of the matrix determine the number of vehicles on the j-th ER at the time t, where T is the end of the evacuation, not exceeding the flooding time of HS and ER according to the maps K f l ( t , Q ) , t ( 0 ) = min ( t 1 ( 0 ) , , t n ( 0 ) ) .
The solution of the optimization problem
M ( K f l ( t , Q ) , N , G ˜ , t ( 0 ) , S h s e c , R ( l i m ) ) min S h s e c
belongs to the boundary of the existence domain of the system solution (1), where S h s e c is the admissible (safe) schedule that ensures the fulfillment of constraints (1). This problem is a variant of the resource investment problem or a mirror copy of the classic RCPSP (Resource-constrained project scheduling with time windows) scheduling problem with deadlines [80,81,82,83,84].
We propose the algorithm for solving the problem (2) and the results of its implementation in simulation modeling of flood development in the Northern part of the Volga-Akhtuba floodplain (further abbreviations NPVAF and VAF are used).

3. Materials and Methods

3.1. Hydrodynamic Model of Flooding

This section is devoted to describing a model for forecasting the hydrological situation in an area that is under the threat of severe flooding. The model is based on shallow water equations [34,35,36,75] and has already been used to solve a wide range of problems related to modeling the hydrological regime as the Northern part of the Volga-Akhtuba Floodplain (NPVAF) and other river systems. This numerical model became the basis for the creation of flood cadastral maps [24], decision-making systems for the socio-economic development of floodplain territories [25], and the implementation expertise of various engineering projects [76].
The dynamics of surface waters on a non-uniform terrain b ( x , y ) are based on the system of Saint-Venant equations in the following form [33,37,85,86]:
H t + ( H u x ) x + ( H u y ) y = q ( x , y , t ) ,
( H u x ) t + u x ( H u x ) x + u y ( H u x ) y = g H x ( b + H ) + H f x ( s u m ) + H f x ( q ) ,
( H u y ) t + u x ( H u y ) x + u y ( H u y ) y = g H y ( b + H ) + H f y ( s u m ) + H f y ( q ) ,
where H ( x , y , t ) is the surface water depth, u ( x , y , t ) = u x , u y is the velocity of the vertically averaged flow determined by the x and y components ( u x , u y ), q is the functions sum of sources ( q > 0 ) and sinks ( q < 0 ) of water, g is the acceleration of gravity, ( f x ( q ) , f y ( q ) ) is the specific force associated with the given source function q (because changes in mass due to q cause corresponding changes in momentum). The specific force f ( s u m ) = f x ( s u m ) , f y ( s u m ) depends on various factors [33,37,72], including the bottom friction f ( b ) , the Coriolis forces, the wind action with speed of W , the internal friction due to turbulent viscosity, etc. (Figure 1). Equation (3) is the mass conservation law for an incompressible liquid layer with the source q. Equations (4) and (5) determine the law of change of two momentum components under the action of forces on the right side of these equations.
The quality of a hydrological forecast essentially depends on the force of bottom friction and the properties of the underlying surface
f ( b ) = g n M 2 H 4 / 3 u u ,
where n M ( x , y ; H ) is the roughness coefficient (or Manning coefficient), which determines the intensity of hydrological resistance to flow [87]. The value of n M ( x , y ) can strongly depend on coordinates ranging from 0.02 to 0.2, depending on the features of the underlying earth’s surface. The unit of n M is s/m 1 / 3 and is traditionally not specified.
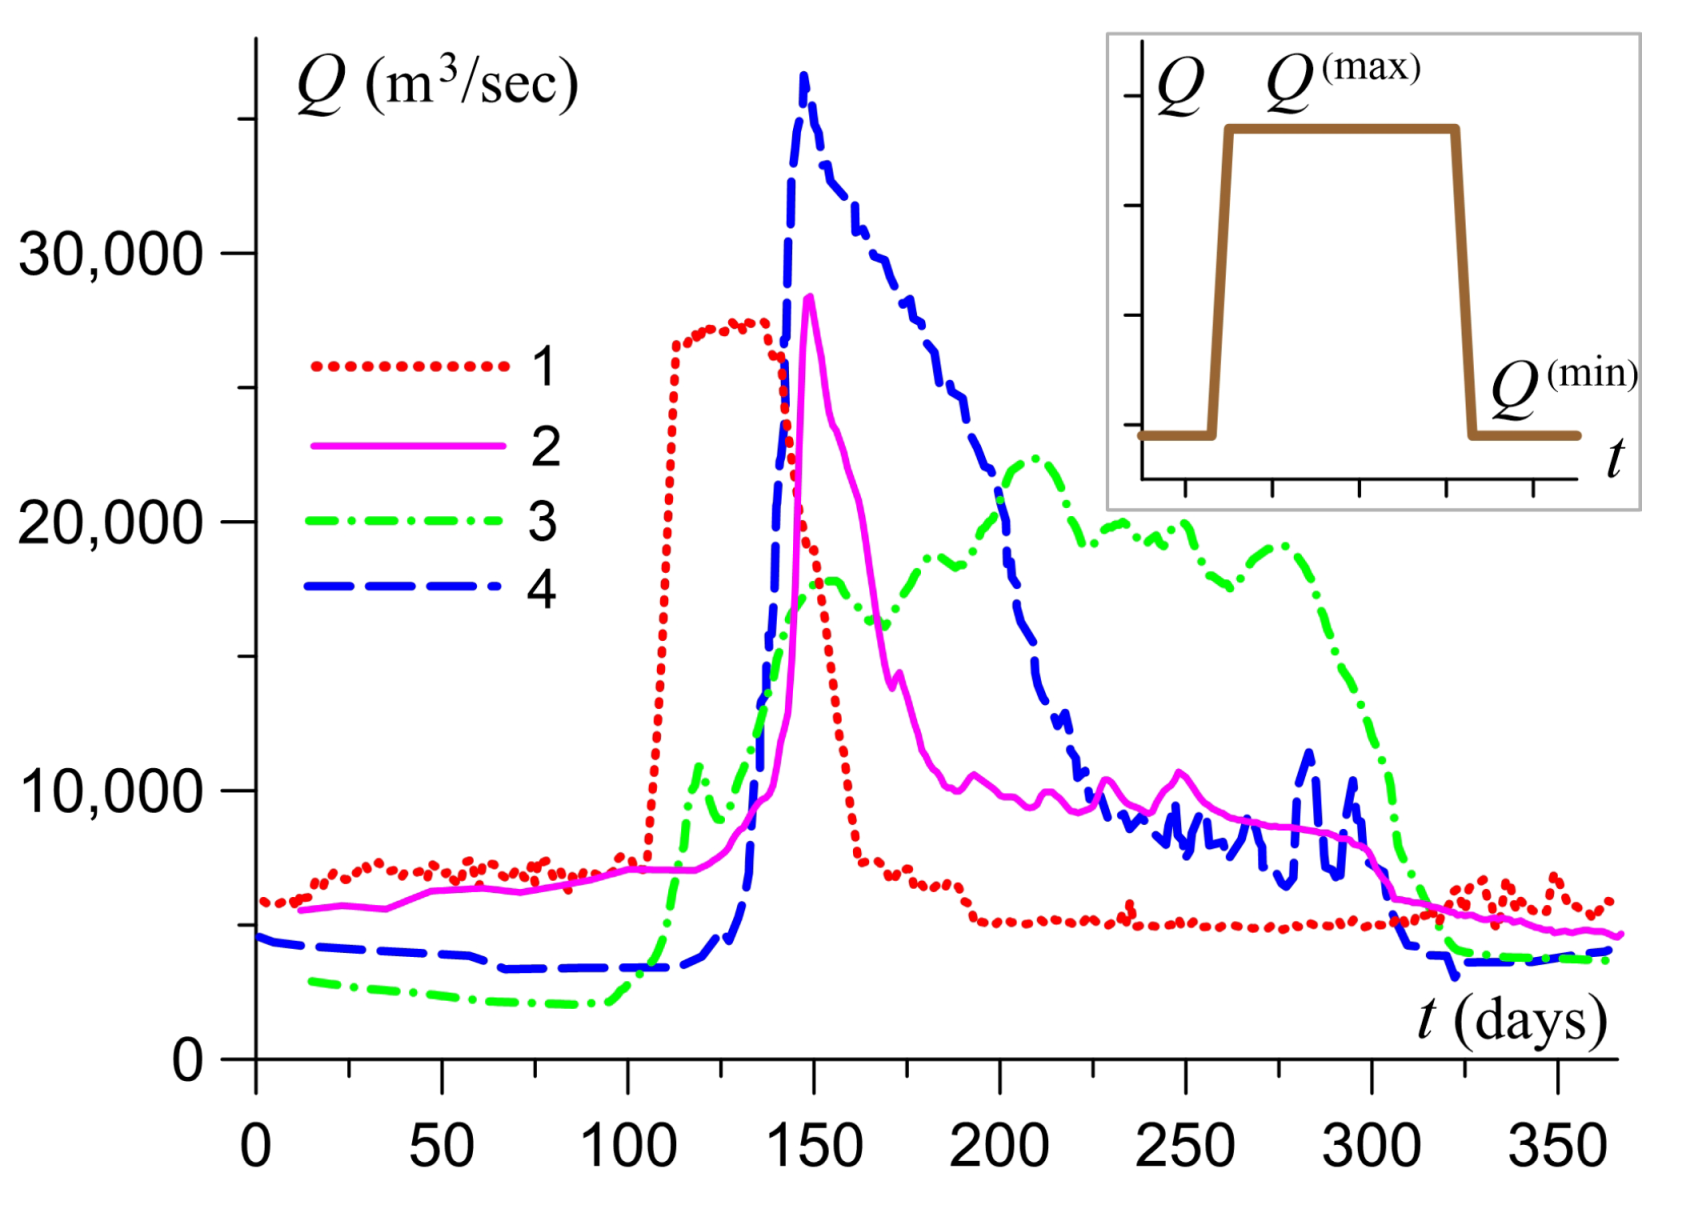
The source function is determined by two factors. First, the work of hydraulic structures, precipitation, river, and surface runoff are responsible for the ingress of water into the computational domain. Second, infiltration into the soil and evaporation removes water from the study area (see Figure 1) [85]. River discharge is the volume of water passing through the cross-section per unit time ( Q ( t ) ). The dependence Q ( t ) is also called the river hydrograph, which is the most important characteristic of the hydrological regime of a water body and floodplain areas (Figure 2). The period of seasonal flooding in spring or due to prolonged rains is characterized by an increase in Q by several times compared to the low water level. Such a hydrograph may have a complex form (see Figure 2), but we use a rectangular hydrograph with a maximum value of Q ( max ) and a low water value of Q ( min ) (see the inset in Figure 2) when solving the problem of organizing safe evacuation in Section 3.5.
Numerical integration of Equations (3)–(5) is based on the Combined Smoothed Particle Hydrodynamics—Total Variation Diminishing, CSPH-TVD), which uses both the smoothed particle algorithm (SPH) and the TVD mesh algorithm at various computational stages [35,72].
The method provides conservatism and good balance. It is possible to carry out end-to-end stable calculations of the moving boundary between the dry bottom and the liquid on the topography, which contains arbitrary inhomogeneities, including waterfalls [87]. These properties of the numerical algorithm make it possible to simulate the dynamics of flooding with non-monotonous behavior of Q ( t ) , when water enters a certain area and then leaves it. The TVD part of the algorithm requires the use of a grid that covers the entire computational domain. We restrict ourselves to a homogeneous grid in the Cartesian coordinate system with cells ( x i ; y j ) :
x i = x 0 + i Δ x , y j = y 0 + j Δ y , i = 0 , 1 , , N x , j = 0 , 1 , , N y ,
where Δ x and Δ y are the cell sizes in the corresponding direction. The product N x · N y gives the total number of cells in the numerical model.

3.2. Digital Hydrological Landscape Model as the Basis for Flood Modeling

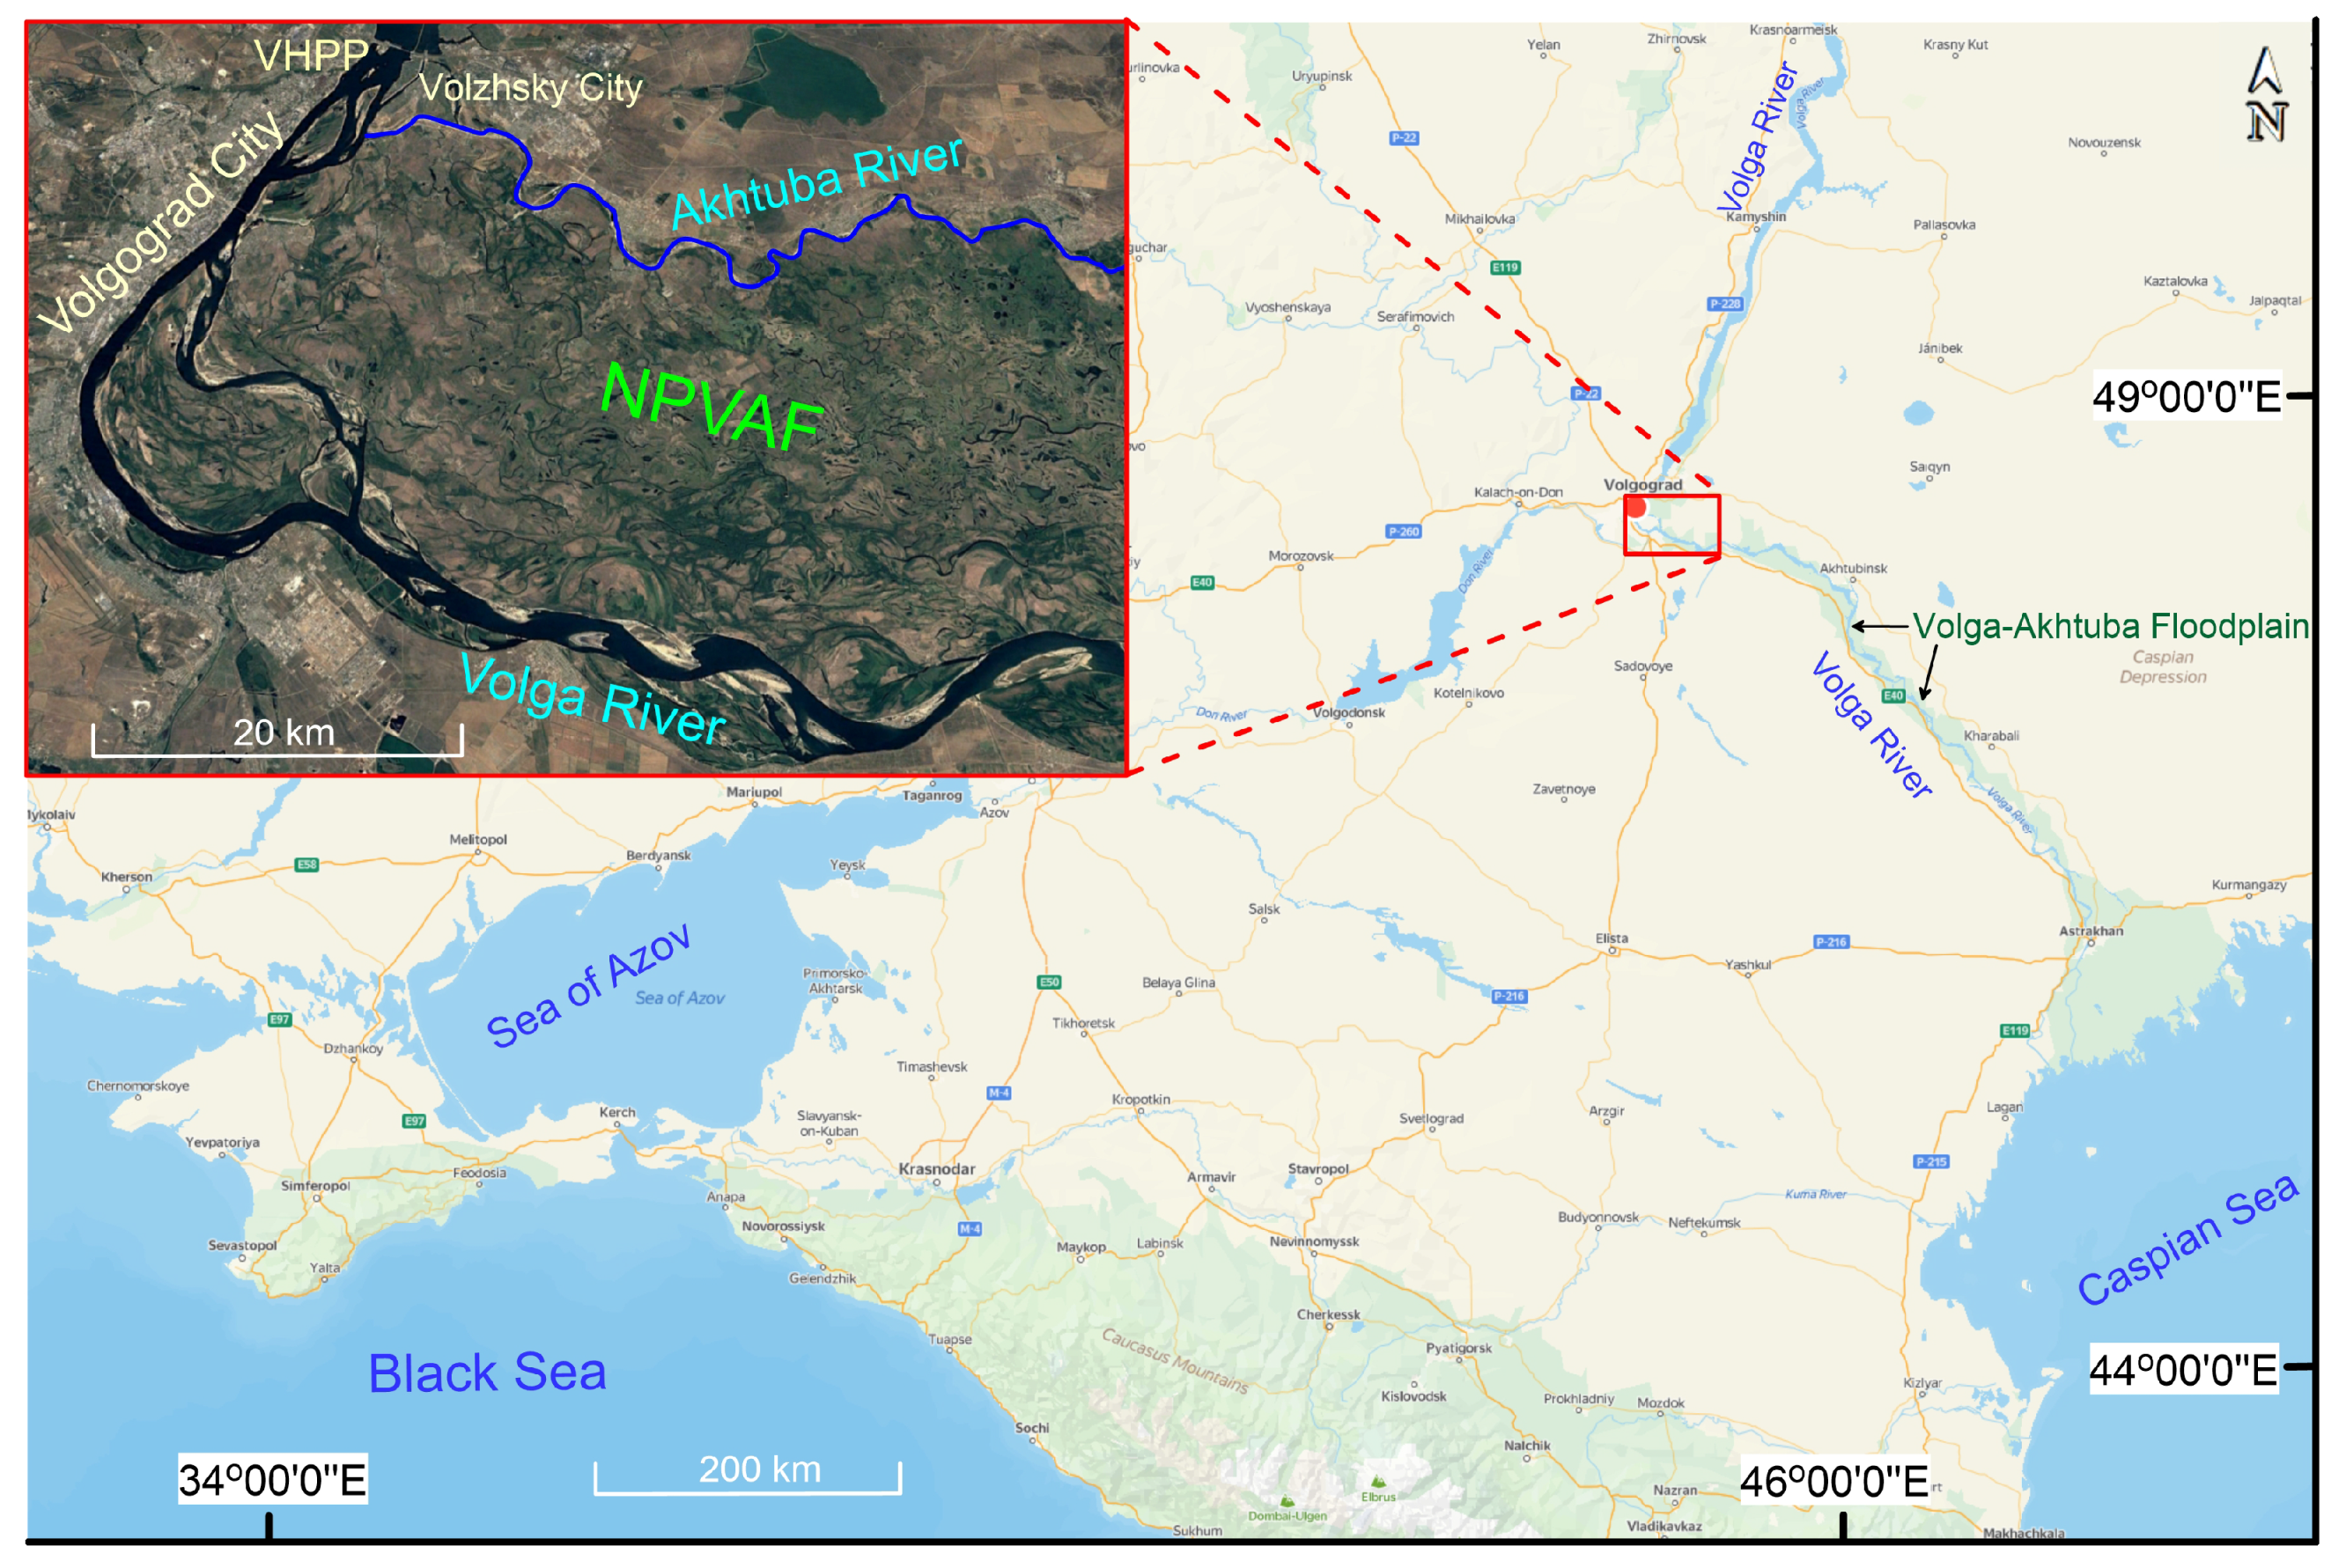
We use the tested model of surface water dynamics for the Northern part of the Volga-Akhtuba Floodplain (NPVAF, Figure 3). The inset in the figure shows the NPVAF between the Volga and Akhtuba rivers below the dam of the Volga HPP (VHPP). The typical distance between the Volga river and the Akhtuba River in the VAF is 25–30 km. The VAF region is covered by a grid with the cell size of Δ x = Δ y = 15 m as the base model.
The choice of a specific area for water regime modeling requires setting the Digital Hydrological Landscape Model (DHLM [77]), which includes a set of spatial matrixes on the ( x i ; y j ) grid. When studying the dynamics of surface waters, one can limit oneself to the matrixes b i j , n M i j . More complex models with groundwater and sediment dynamics require additional matrixes characterizing the properties of soil and water-resistant layer [35,75]. The digital hydrological landscape model defines the hydrological structure of the territory, consisting of surface flow, groundwater, and atmospheric water, and establishes the relationships between natural structures and hydrological processes [88]. The DHLM contains a set of digital geoinformation models required for hydrodynamic simulations in a given area.
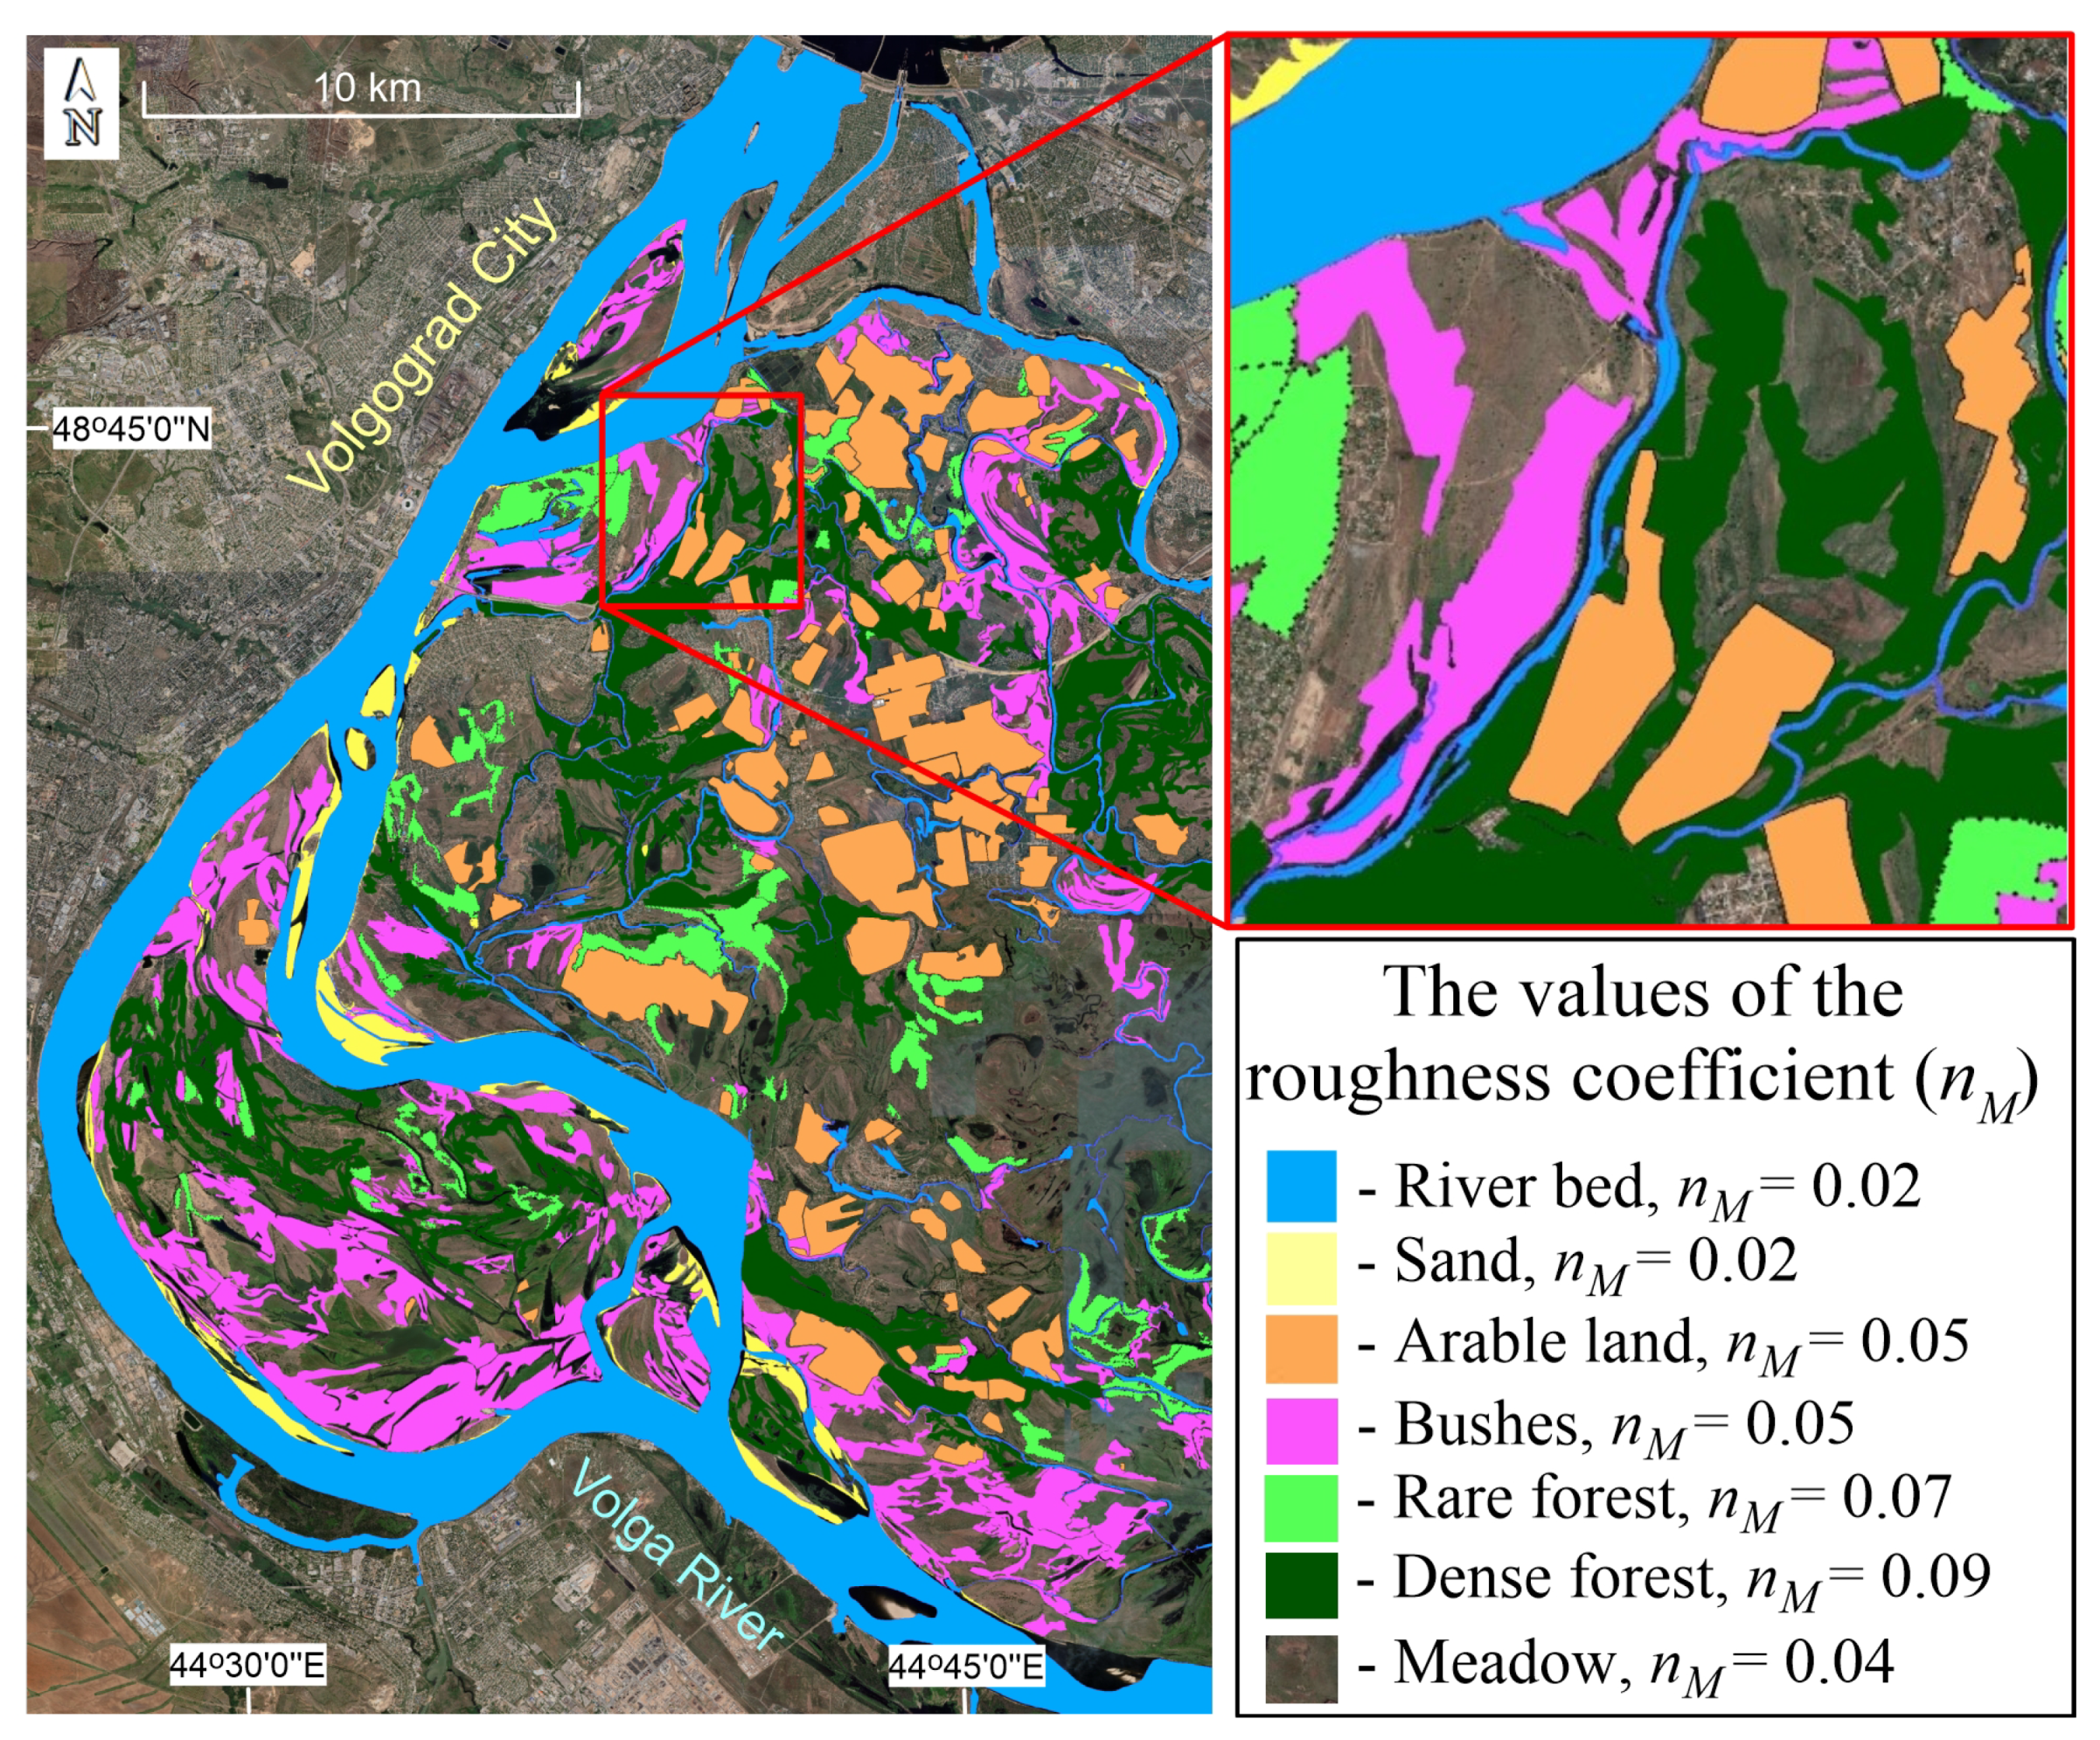
The DHLM is based on a digital elevation model (DEM) and data on the hydrological network, which is a vector map of all watercourses. Small-scale inhomogeneities of the underlying surface provide hydrological resistance to the flow, which requires specifying in (6) the spatial distribution of the roughness coefficient n M on the grid ( x i ; y j ) (Figure 4). Different colors show different levels of n M ( x , y ) ), which are determined, among other things, by the nature of vegetation, soil properties, building density, etc. For the study of groundwater hydrology, the DHLM contains data on the depth of groundwater water, soil characteristics, infiltration coefficient, and porosity coefficient. In addition, water dynamics may depend on meteorological characteristics, such as the amount of precipitation, snowmelt patterns, and the rate of moisture evaporation.
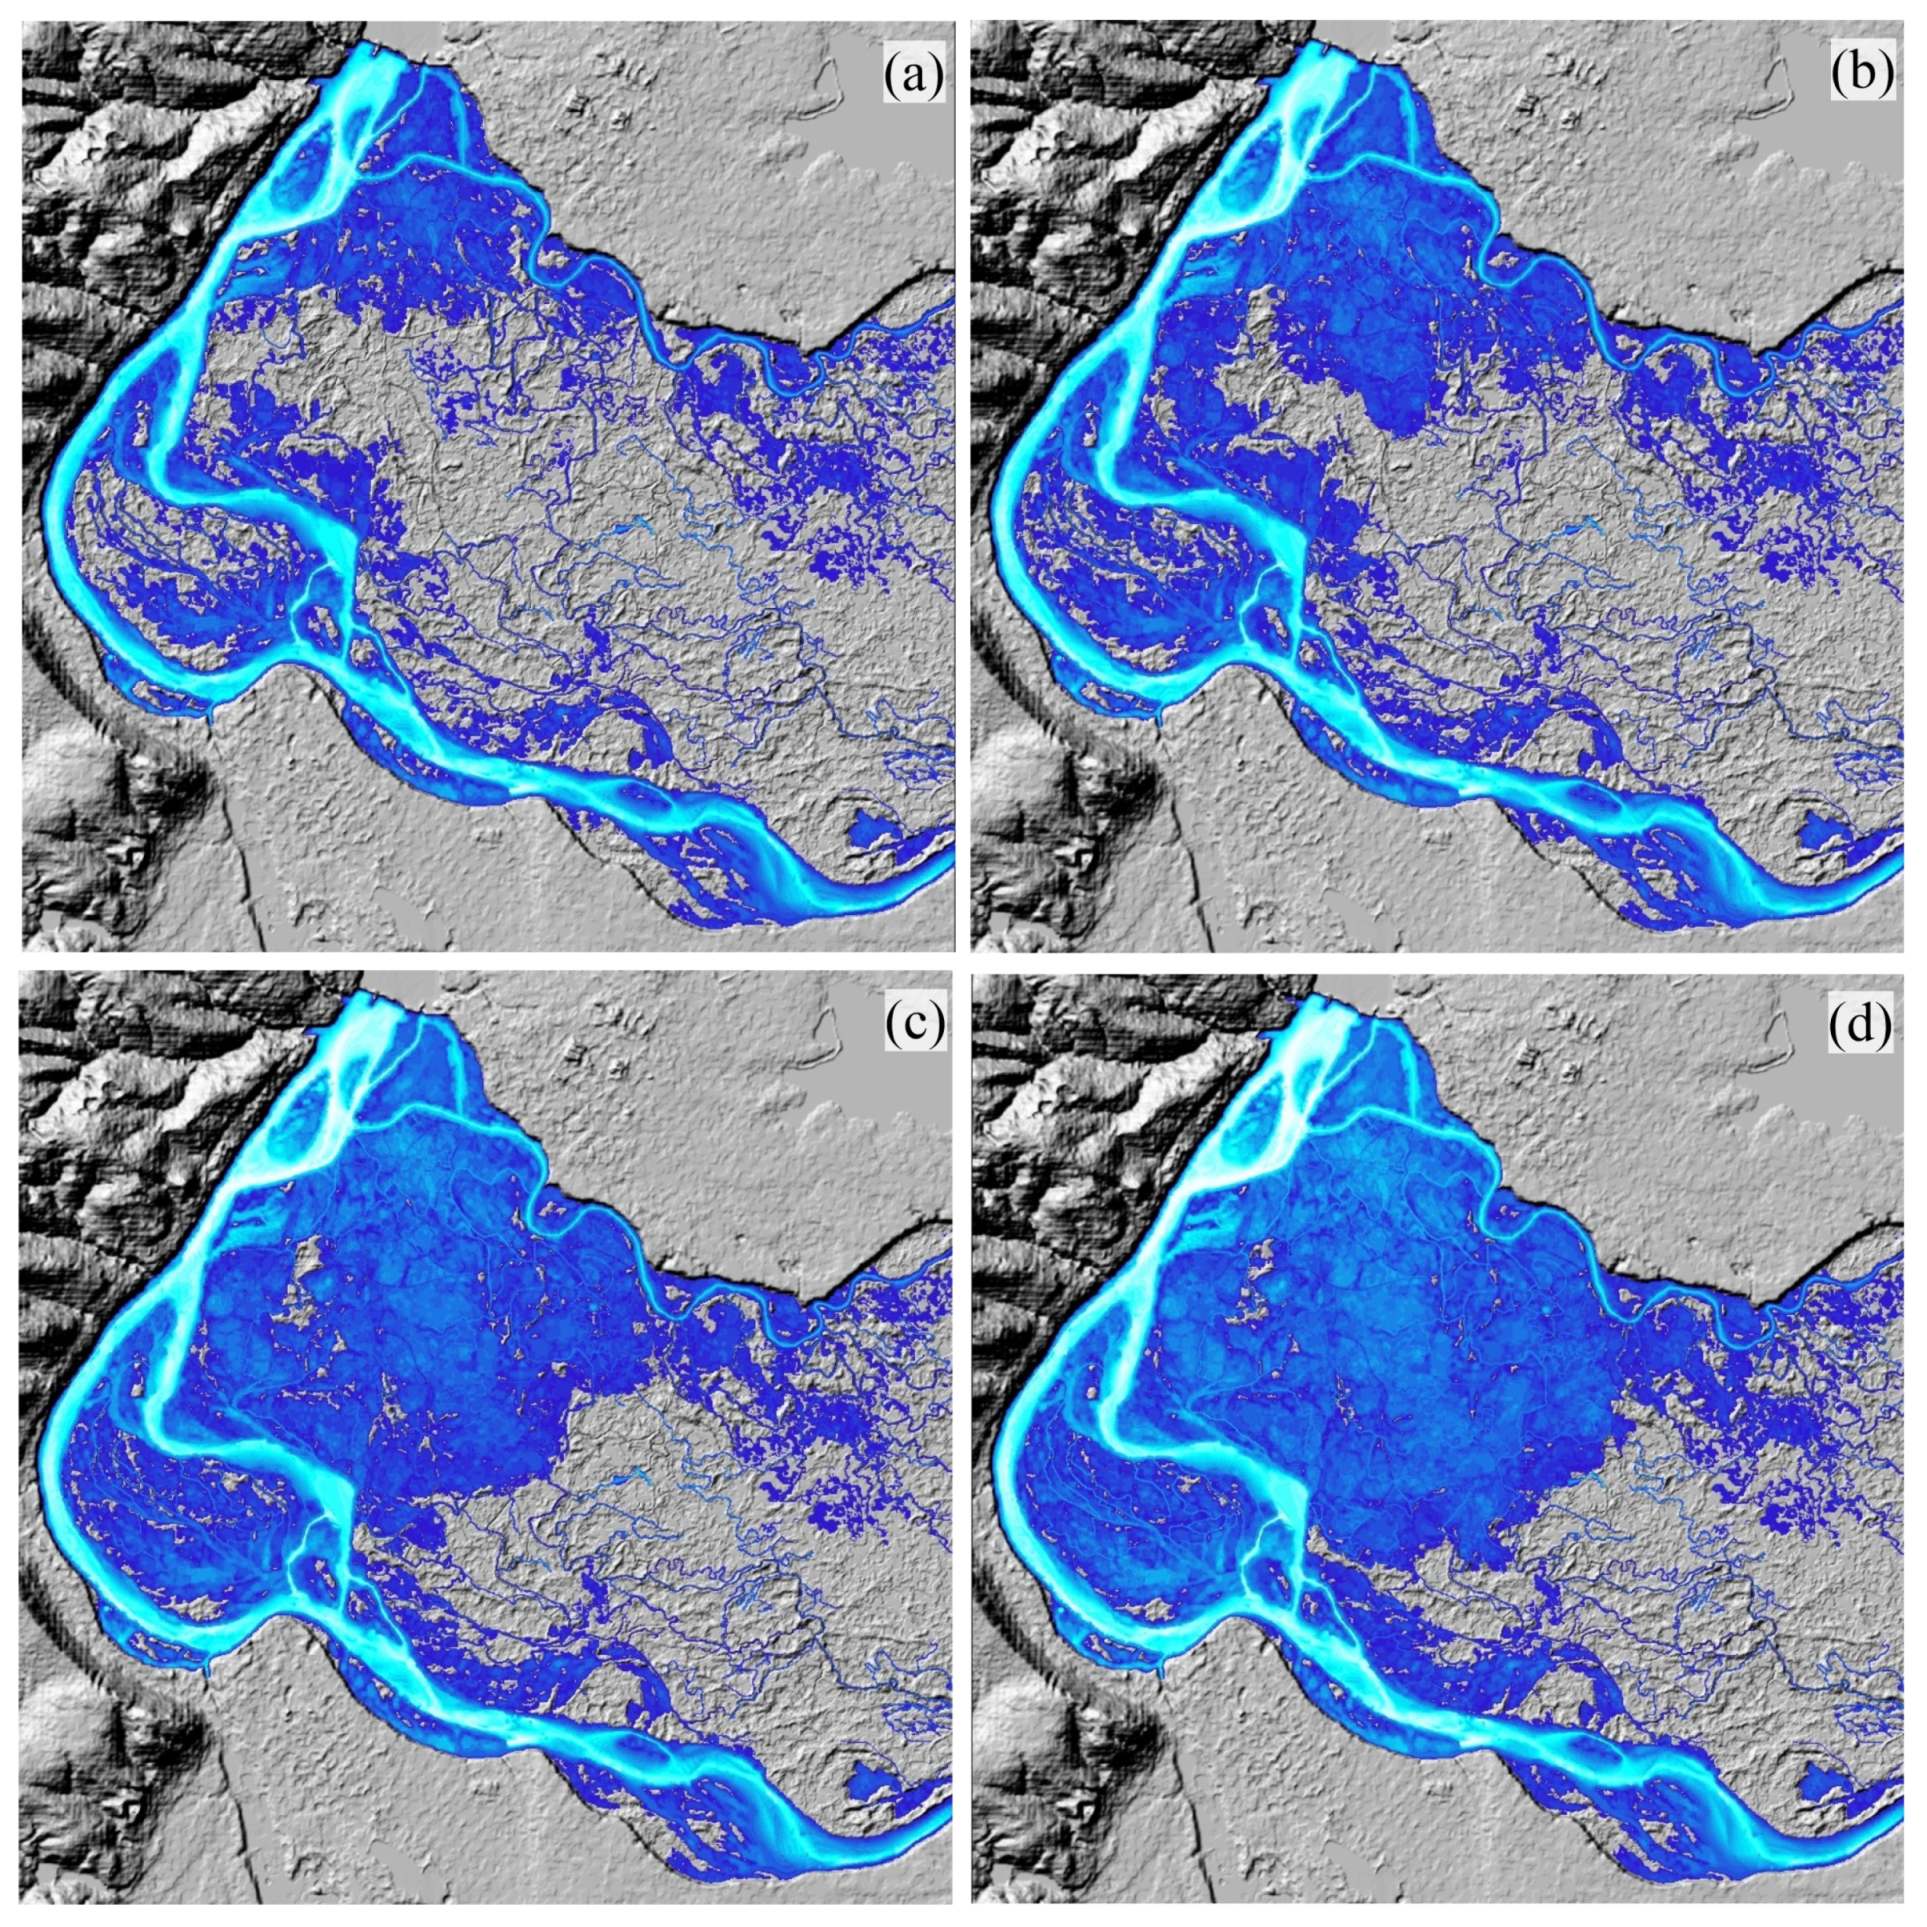
The hydrological regime of NPVAF is determined by the discharge of water flow through the dam Q ( t ) (m 3 /s). The territory of the entire VAF is characterized by a complex branched system of natural canals, the so-called eriks, which ensure the water flow from the Akhtuba and the Volga to the flat part of the interfluve when approximately Q > 17,000 m 3 /s [77]. Moreover, approximately 70–80% of water enters the floodplain through the Akhtuba River and 20–30% directly from the Volga through small canals on the left side. The contribution from the Akhtuba is the main one and the corresponding flooded area dominates compared to the direct contribution from the Volga (see Figure 3).
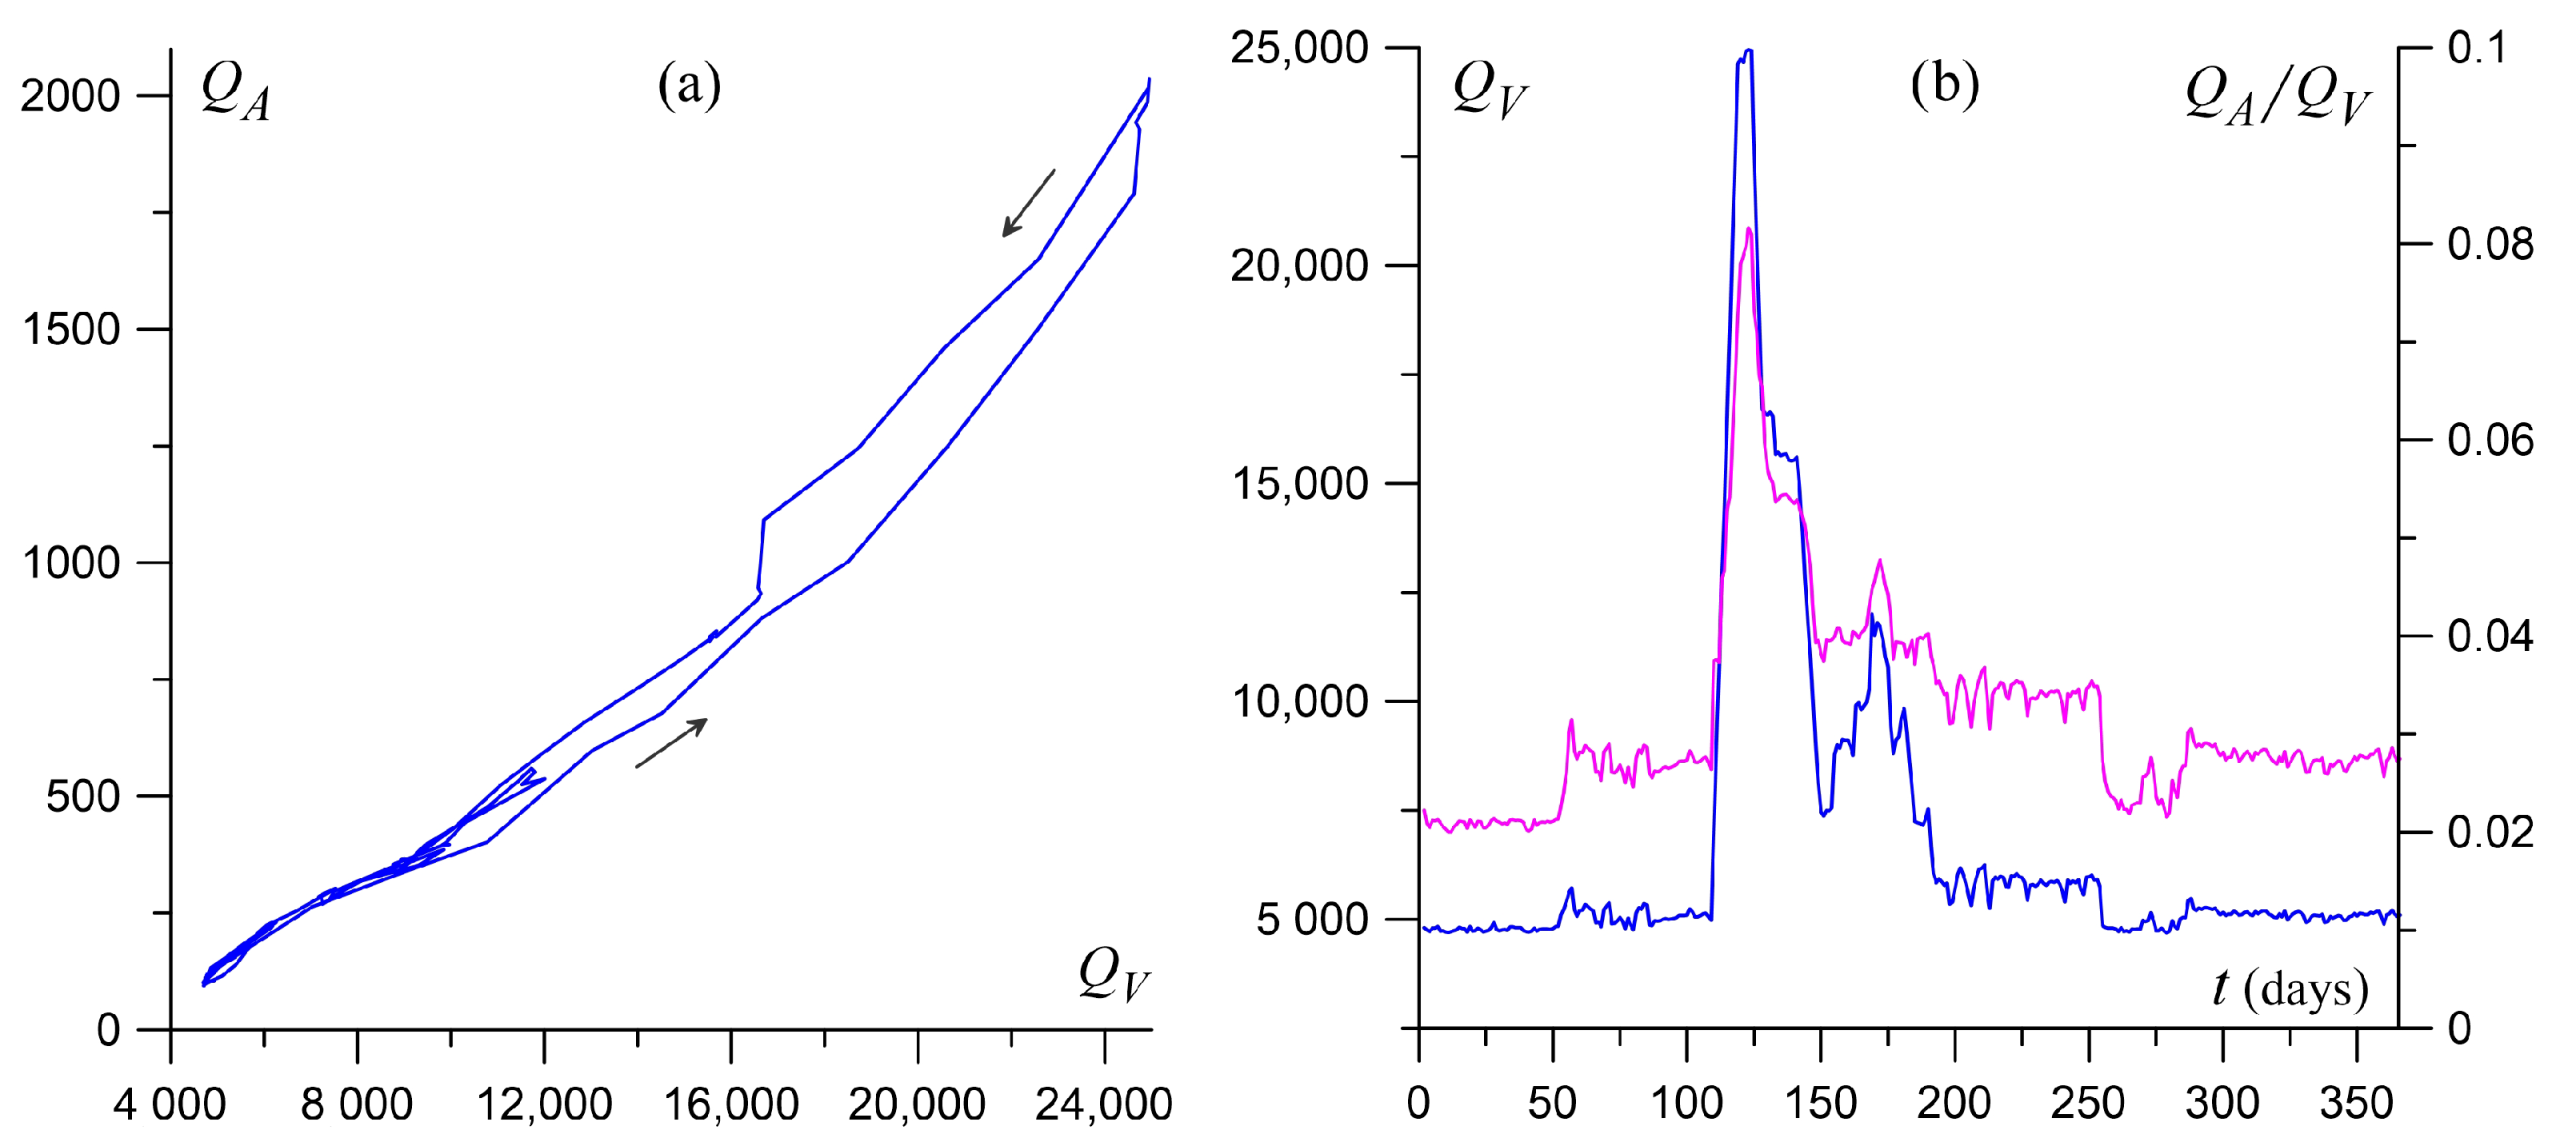
The value of water flow from the Volga river to Akhtuba plays a key role in the hydrological regime of the entire floodplain. The water discharge in the Akhtuba River Q A ( t ) directly depends on the discharge in the Volga river Q V ( t ) . Figure 5 shows such a hydrological relationship based on the results of numerical simulation for 2022, which has a characteristic hysteresis shape. The ratio Q A / Q V is in the range of 0.02–0.08, and only two percent of the Volga’s water enters the Akhtuba during the low season. The spring flooding stage is characterized by an increase in this proportion to 8 percent at its peak.
If the discharge level of the Volga river Q ( max ) exceeds approximately 30,000 m 3 /s, then an emergency occurs in the NPVAF. The catastrophic situation begins approximately with Q ( max ) > 35,000 m 3 /s. The level above 45 thousand m 3 /s in the Volga channel has not been observed in recent decades. Therefore, we believe that higher water discharge can only be caused by dam failure (Figure 6).
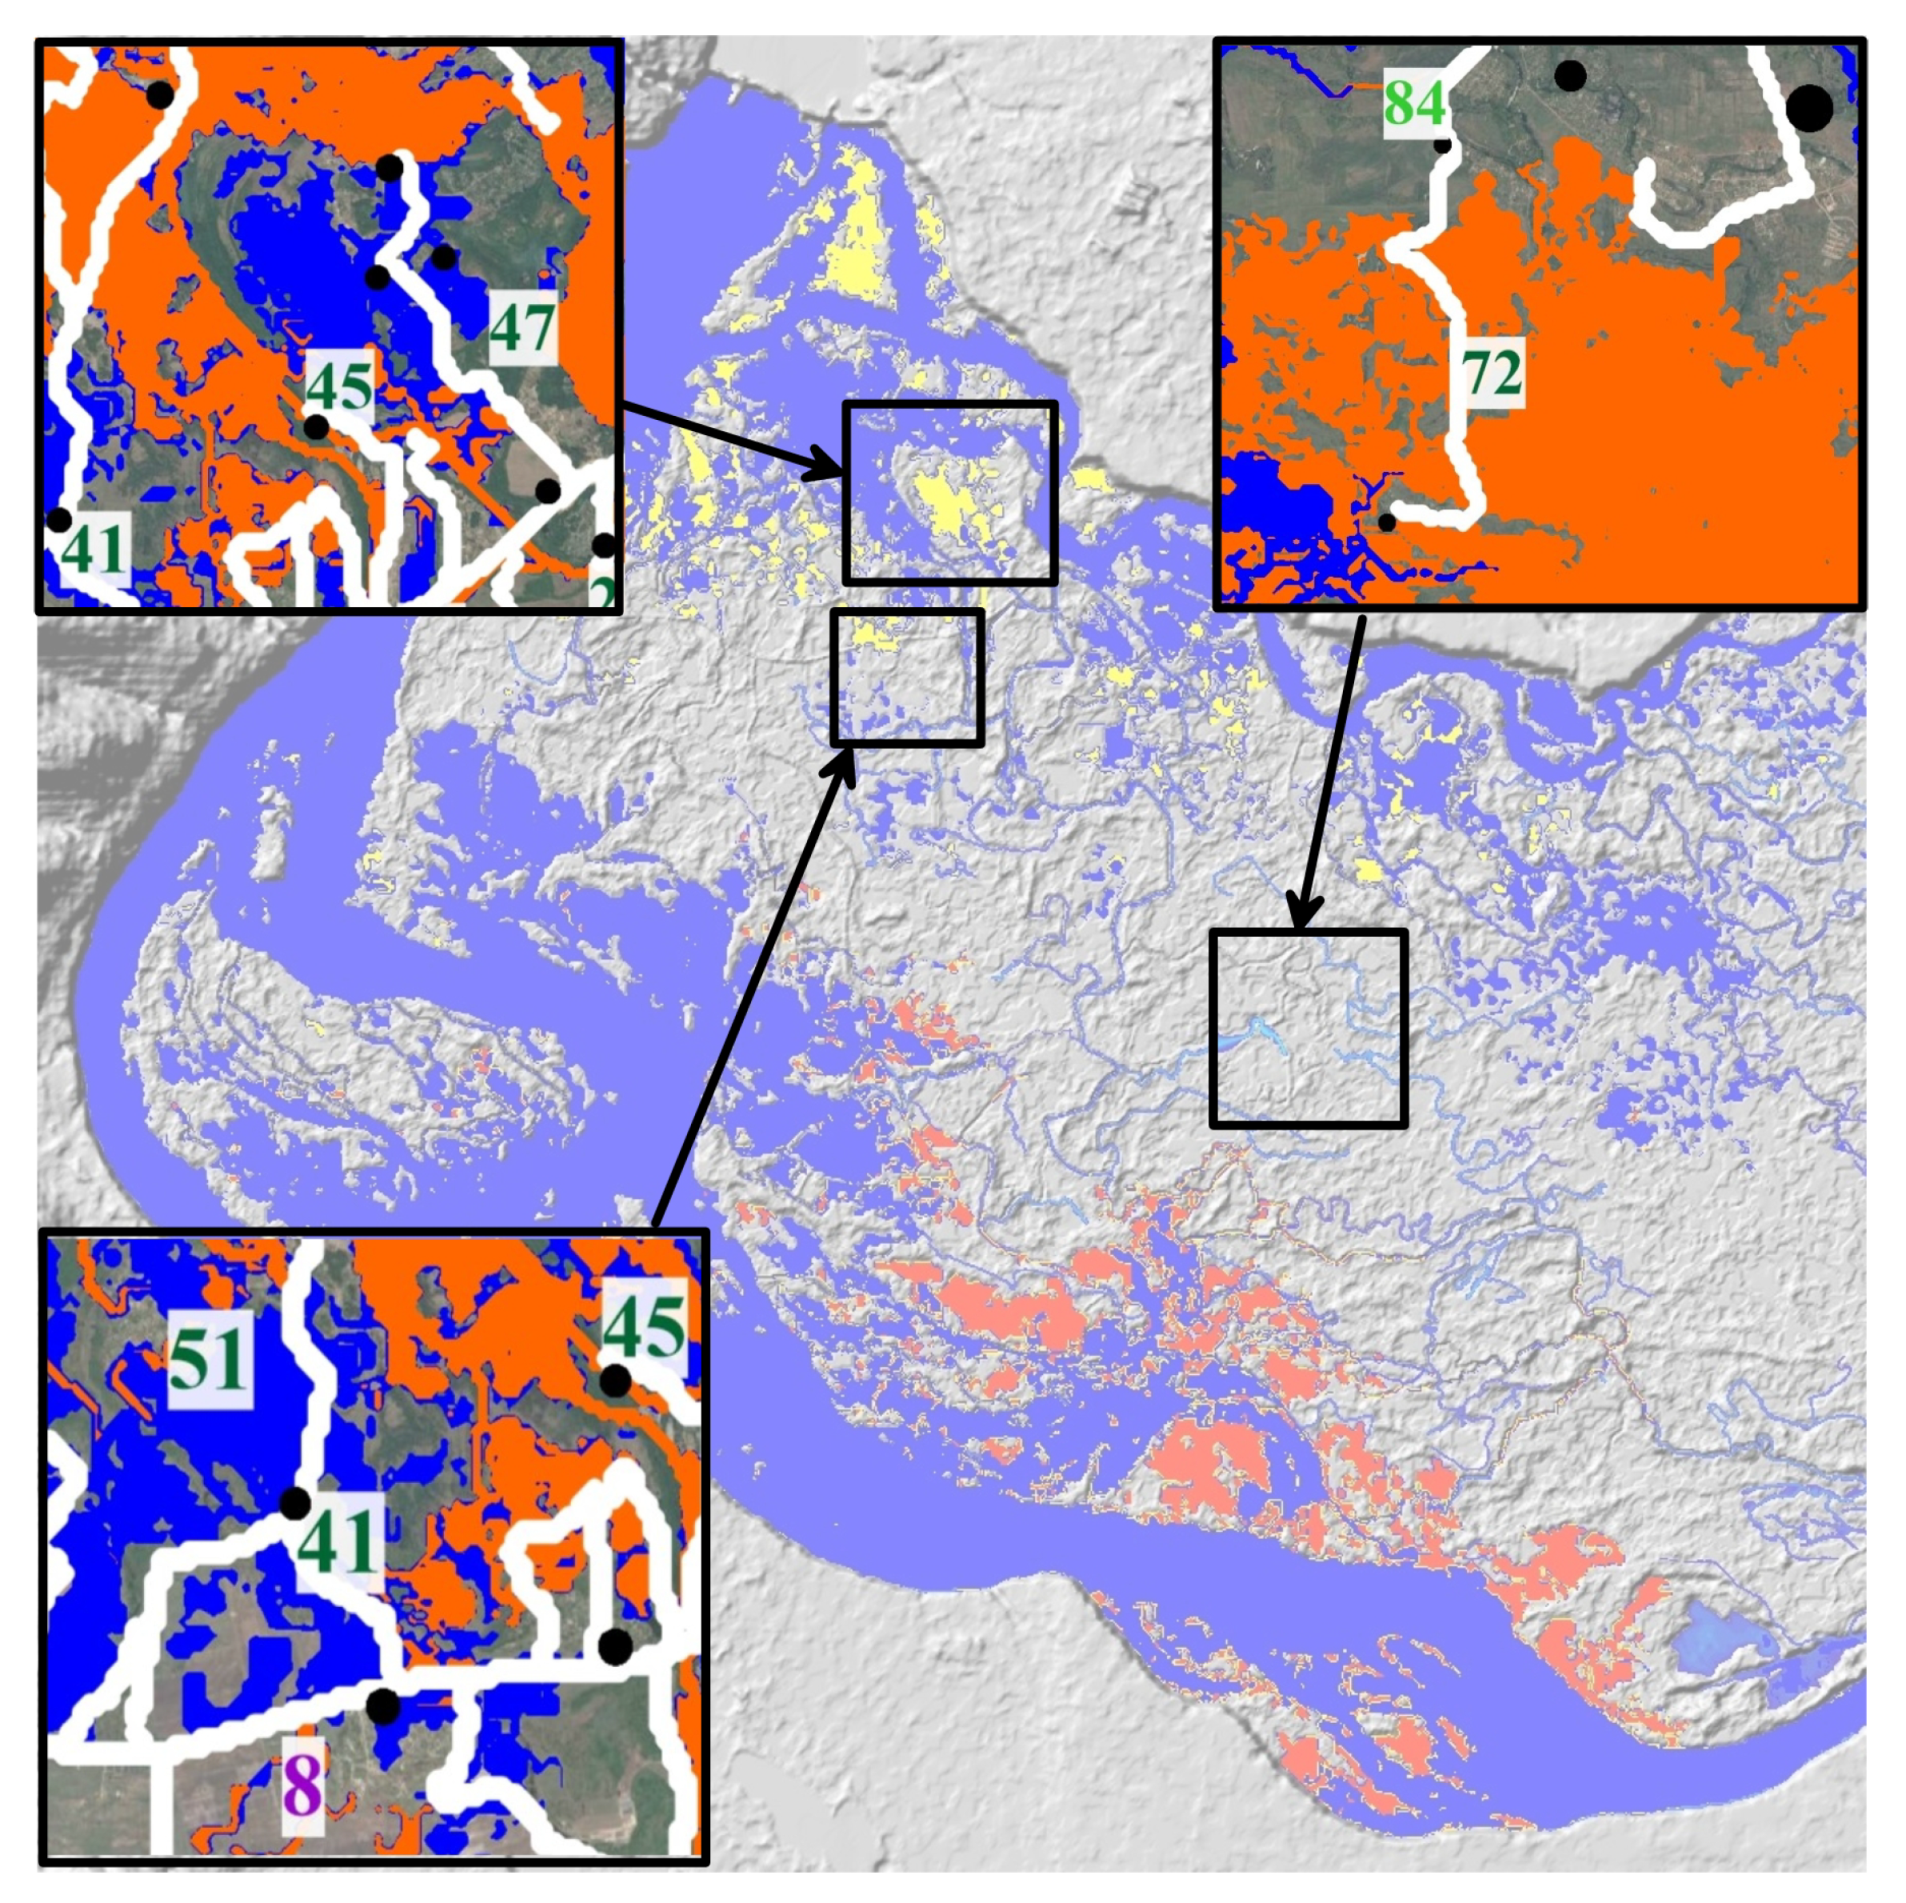
Figure 7 shows the result of the flood simulation at Q ( max ) = 45,000 m 3 / s at time t = 15 h for two models n M . Red color highlights areas that are flooded in the model n M const, but remain without water when n M = const. Yellow color defines areas under water at n M = const, but not flooded at non-uniform n M . Blue color indicates areas flooded in both cases. The upper left inset shows the result of flooding at time t = 16 h: orange highlights the flooded areas in the model n M const, blue is the result for n M = const. Some HSs and ERs (for example, No. 47) are flooded when n M = const. Similarly, the lower inset depicts calculations at the time t = 19 h, when ERs No. 8, 41, 51 are flooded at n M = const; however, settlements and above escape routes are not flooded in the model n M const. The upper right inset ( t = 25 h) demonstrates the opposite situation, when the calculation with n M const gives the flooding of both the settlement and ER No. 72. Thus, the heterogeneity of the roughness coefficient seems to be an important factor in modeling the hydrological regime for solving the problem of organizing evacuation.
Thus, the emergency situation development model is a multi-layer geoinformation model of the floodplain, including layers of altitudinal topography, channel structure, road network, distribution of settlements with data on the number of inhabitants, as well as numerous layers of catastrophic floods maps, which are built based on the results of hydrodynamic simulations. Each such layer characterizes flooding at certain points in time (for example, hourly data). The topological structure of the road network is represented by the graph G.

3.3. Algorithm for Calculating the Flooding Moments of Settlements and Evacuation Routes

Real hydrographs of river floods Q ( t ) have the form of a single-peak function or a sequence of peaks. The forecast Q ( t ) becomes known shortly before the start of the flood. Therefore, direct hydrodynamic modeling for flood mapping can be difficult. In this regard, we calculate an approximate vector of flooding moments for settlements and evacuation routes based on <<base>> vectors of flooding moments, using the results of numerical simulations with constant hydrographs Q j ( Q j < Q j + 1 , j = 1 , . . . , n ) . The values of Q j and n are selected so that the approximation error does not exceed a given value (for example, 5 percent).
The predictive emergency hydrograph is stepped, forming a sequence of constant hydrographs Q ( t ) = { Q i c } ( i = 1 , , m ) of the same duration Δ t . At the first stage of the algorithm, we form a set of constant hydrographs Q ˜ i ( i = 1 , , m ) , given on the intervals [ t 0 , t o + i Δ t ] , whose water volume is equal to the volumes of the parts of the original hydrograph Q ( t ) on the same intervals. The inequality Q j Q ˜ i Q j + 1 determines the search for the pair Q j , Q j + 1 in the array Q j ( j = 1 , , n ) for each Q i ˜ ( i = 1 , , m ) . If the <<base>> vector for Q j + 1 contains numbers belonging to the time interval [ t 0 + ( i 1 ) Δ t , t 0 + i Δ t ] , then they become elements of the moment vector of flooding settlements and road sections for Q ( t ) . These data allow us to calculate the vector of the maximum allowable duration of the safe evacuation of residents of each flooded settlement (Table 1). This table contains the flooding moments of settlements and evacuation routes of the northern part of the floodplain. Distances to the nearest flooding points are also indicated. These data are computed from direct numerical hydrodynamic modeling for two maximum hydrograph values and two hydrological resistance models with constant and non-uniform Manning coefficients. These results of numerical simulations made it possible to formulate the problem of finding the minimum resource for the safe evacuation of the floodplain population.

3.4. Creation of Safe Schedule

An arbitrary evacuation schedule using the i-th STER is described by the evacuation matrix m i t j , ( i = 1 , , K j ; t = t ( 0 ) , , T ; T = max j τ i j , j = 1 , , n ), where m i t j is the number of transport means that simultaneously evacuate the population from the j-th NP along its part of the i-th STER at the time step t, t ( 0 ) is the moment of evacuation start, τ i j is the flood times of ERs, K j is the number of temporary EPs on the jth ER. An admissible (safe) schedule S h s e c ( t ( 0 ) , Q , R ( l i m ) ) is such that the elements of the evacuation matrix ensure the evacuation of the entire population of the flooded area before the onset of a dangerous situation. The safe schedule of the 1st stage satisfies the following condition
M ˜ i j ( 1 ) = p i j = 1 P i j ( 1 ) m ˜ i p j j , m i t j = m i t j ( 0 ) , m i t j ( p i j ) = m i t j ( p i j 1 ) m ˜ i p i j j , m ˜ i p i j j = min m i p i j j ( p i j 1 ) , , m i p i j + θ i j j ( p i j 1 ) , N j a M ˜ i j ( 1 ) , p i j = 1 , , P i j ( 1 ) , P i j ( 1 ) τ j ^ t j ( 0 ) θ i j + 1 , i = 1 , , K , t = p i j , , p i j + θ i j 1 , j = 1 , , n ,
where a is the capacity of one vehicle, θ i j ( Q ) = θ ( L i j ( Q ) is the duration of one trip of an evacuation vehicle from the jth HS in its part ith STER with length L i j (forth-and-back). It is important that the values of P i j ( 1 ) are defined ambiguously in (7). The minimum value ( P ^ i j ( 1 ) ) satisfies the inequalities
N j a M ˜ i j ( 1 ) ( P ^ i j ( 1 ) ) < 1 + N j a ,
which determines the actual duration of the 1st stage of evacuation from j-th HS by i-th STER.
The safe evacuation schedule of the second stage satisfies the condition
M ˜ i j ( 2 ) = p i j = 1 P i j ( 2 ) m ˜ i p i j j , m t j = m i t j ( 0 ) , m i t j ( p i j ) = m i t j ( p i j 1 ) m ˜ i p i j j , m ˜ i p i j j = min m i p i j j ( p i j 1 ) , , m i p i j + θ i j j ( p i j 1 ) , N j a M ˜ i j ( 2 ) , p i j = 1 , , P i j ( 2 ) , P i j ( 2 ) R ( l i m ) θ ˜ i j + 1 , i = 1 , , K ; K = j = 1 n K j , t = p i j , , p i j + θ ˜ i j 1 ; j = 1 , , n ,
where θ ˜ i j = θ ( L ˜ i j ) is the time of the evacuation of the population of the j-th NP from the temporary EP to the permanent EP along the second part of the i-th STER of length L ˜ i j . The values of ( P i j ( 2 ) ) in (8) are also not uniquely defined. The smallest of them ( P ^ i j ( 2 ) ) satisfies the inequalities N j a M ˜ i j ( 2 ) ( P ^ i j ( 2 ) ) < 1 + N j a , which determines the actual duration of the 2nd stage of evacuation from the j-th HS.
We assume that the beginning of the 2nd stage of evacuation at each ER begins immediately after the end of the 1st stage. The set of beginning moments of the 2nd stage is described by the vector t ( 0 ) . A formal statement of the problem of minimizing the number of vehicles M on the sets of safe schedules (7), (8) and STER with parameters Q, t , ( 0 ) , R ( l i m ) has the form:
M i m i n ( t ( 0 ) , Q , R ( l i m ) ) = max t ( M i t ) min m i t j , M i t = j = 1 n m i t j , t = t ( 0 ) , , T i ; T i = max j ( T i j ( 1 ) + P ^ i j ( 2 ) ) ; i = 1 , , K , M m i n ( t ( 0 ) , Q , R ( l i m ) ) = min i M i m i n ( t ( 0 ) , Q , R ( l i m ) ) .
The moment of completion of the 1st stage of evacuation from the j-th HS along the i-th STER is equal to
T i j ( 1 ) = t j ( 0 ) + P ^ i j ( 1 ) + θ i j 1 .
The maximum duration of the 2nd stage of evacuation is equal to R ( l i m ) for the sequential implementation of two stages of evacuation from the j-th HS in the case of T i j ( 1 ) R ( 0 ) . The sequential implementation of the stages does not satisfy the system inequality (1) when T i j ( 1 ) > R ( l i m ) . Therefore, it is necessary either to implement both stages of evacuation in parallel, or to select the vector t ( 0 ) so that the inequality T i j ( 1 ) R ( l i m ) is satisfied automatically. This condition limits the number of admissible schedules and is necessary for the correct operation of the algorithm described below for solving the problem (7)–(9). We then consider the sequential implementation of two evacuation stages, with the second evacuation stage from each temporary EP starting immediately after the completion of the first stage. In this case, the matrixes (7) and (8) can be combined into one and taking p i j = T i j ( 1 ) + 1 , , T i j ( 1 ) + P ^ i j ( 2 ) in (8).
The transport-pedestrian implementation of the 1st stage in the problem (7)–(9) requires the elimination of HSs located at a distance of less than 5 km from temporary EPs. The first stage is carried out on foot for the above HSs.
The result of solving problems (9) and (10) is the minimum allowable number of vehicles and the schedule of their movement, which provides a two-stage safe evacuation of the entire population. The safety of the 1st stage means the evacuation of the entire population of each human settlement to a temporary evacuation point before the flooding of the settlement and the evacuation route begins. The safety of the 2nd stage means the evacuation of the population from each temporary evacuation point to a permanent evacuation point in a time not exceeding the allowable value. The solution procedure is based on constructing a sequence of safe schedules and calculating the required number of transports. Each schedule in this sequence uses the entire allowed evacuation time, but the number of vehicles is reduced in each successive schedule until the limit is reached. Thus, the entire found sequence of schedules can be used for practical purposes.
The heuristic algorithm for solving the problem (7)–(9) is a multi-step process of redistributing vehicles between ERs throughout the evacuation. The initial admissible evacuation schedule m i t j ( 0 ) is the schedule in which each vehicle moves along a single ER. This schedule implements the 1st stage of evacuation from the j-th HS along the i-th STER, which began at the moment t j ( 0 ) in a time not exceeding τ ^ j t j ( 0 ) . If the condition τ ^ j > R ( l i m ) is satisfied for some j, then only t j ( 0 ) are considered that ensure the inequality τ ^ j t j ( 0 ) R ( l i m ) . Since the condition T i j ( 1 ) R ( l i m ) is satisfied, the number of vehicles used at the 1st stage of evacuation at each EM ensures evacuation at the 2nd stage as well.
The first part of the algorithm implements the sequential distribution of a possible reserve of vehicles, formed at the end of the 1st stage of evacuation from the j-th HS along the i-th STER at the moment τ ^ j , to other ERs. An improved admissible traffic schedule for the corresponding ER is compiled for each potential reserve assignment with the largest possible reduction in the number of cars in m i t j ( 0 ) . If the maximum of this reduction is reached on a single ER, then the corresponding assignment is accepted. If the maximum is reached on several ERs (equal to J k ), then the improved admissible schedule is calculated for each of them and the moment of appearance of its reserve ϑ i k j is determined, the value of which is equal to Δ m i k j ( j = 1 , 2 , , J k ) . The assignment is made to the route with the maximum reserve index I R i k j = Δ m i k j ϑ i k j . If the maximum of this index is reached on several routes, then the reserve is assigned to the route with the minimum value of ϑ i k j . If these values are the same for several routes, then the assignment is made to any of them. The reserve of cars is distributed over several routes if it is redundant for one route. The algorithm assumes that the routes of movement of assigned vehicles to new routes during the time Δ t are free from flooding. This is performed in particular when passing all paths through a single constant EP. If there are several such EPs, then this problem requires investigation. The complete release of evacuation transport for the population from the j-th HS occurs after the completion of the 2nd stage of evacuation. This transport is also distributed in the manner described above. The algorithm for constructing a sequence of improved schedules ( m i t j ( 0 ) , m i t j ( 1 ) , ...) ends after the release of all vehicles.
The second part of the algorithm is a multi-step process of heuristic construction of admissible schedules with a further decrease in the total number of vehicles by one at each step. Since the number of vehicles is fixed, the admissible schedule is constructed by the sequential distribution of vehicles between evacuation routes at each moment of time in the direction from the end of the evacuation to its beginning. Routes with the longest allowable evacuation time have higher priority. Thus, the algorithm maximizes the reserve of machines at each time step. Such a reserve can be used on routes with minimum allowable evacuation times. The algorithm stops when it is impossible to construct an admissible schedule in this way.

3.5. Construction of the Function of Minimum Resource Support for Safe Evacuation and Selection of Evacuation Routes

The solution to the problem (2) is based on the construction of the hierarchical graph of ERs G ˜ . Directed edges of G ˜ form paths from each HS to one permanent EP. The evacuation route graph G ˜ is a subgraph of the graph G. Its edges define escape routes, which are the last to be flooded. We replace the maps K f l ( t , Q ) with the data array Λ = τ 1 , , τ n , L 1 , , L n in the tuple E using the ERs and emergency evolution models. The array Λ contains the coordinates of each pair of vectors ( τ j , L j ) , which define the moments of flooding of road sections on the j-th evacuation route and the distance from them to jth HS.
Possible locations for temporary EPs are marked on each ER. The path from these EPs to at least one permanent EP is not flooded according to the flood development forecast. Temporary EPs are intended to be used when there is a lack of vehicles to safely evacuate the population to permanent EPs. The evacuation of the population to temporary EPs is carried out in two stages: (1) evacuation of all residents from HSs to temporary EPs, (2) evacuation from temporary EPs to permanent EPs. If the temporary EP is located close to the HS (no more than 5 km), then the 1st stage of evacuation can be carried out both by vehicle and on foot. We reduce the values of ϑ i j by a factor of k when calculating the parameter R e in the case of placing temporary EPs in buildings.
Each collection of n temporary ERs forms a set of temporary evacuation routes (STER). Thus, the total number of STER is K = j = 1 n K j , where K j is the number of temporary EPs on j-th ER. The maximum duration of the 1st stage of evacuation on the j-th ER is determined by the moment of flooding of its first section τ ^ j = min i τ i j ( i = 1 , . . . , I j ) , where I j is the number of flooded areas on the j-th ER.

4. Results

The Minimum Resource Support Function for the Safe Evacuation of the Northern Part of the Volga-Akhtuba Floodplain Population

The Volga-Akhtuba floodplain (VAP) is located in the lower reaches of the Volga river between the Volga and Akhtuba rivers (see Figure 3). The discharge of the Volga river is regulated by the flow of water through the dam of the Volga Hydroelectric Power Plant (VHPP). The development of the federal road network in the floodplain has become a powerful stimulus for the socio-economic development and population growth of this region. The creation of a system for managing the hydrological safety of this territory is an urgent task in the context of the increasing urbanization of the NPVAF.
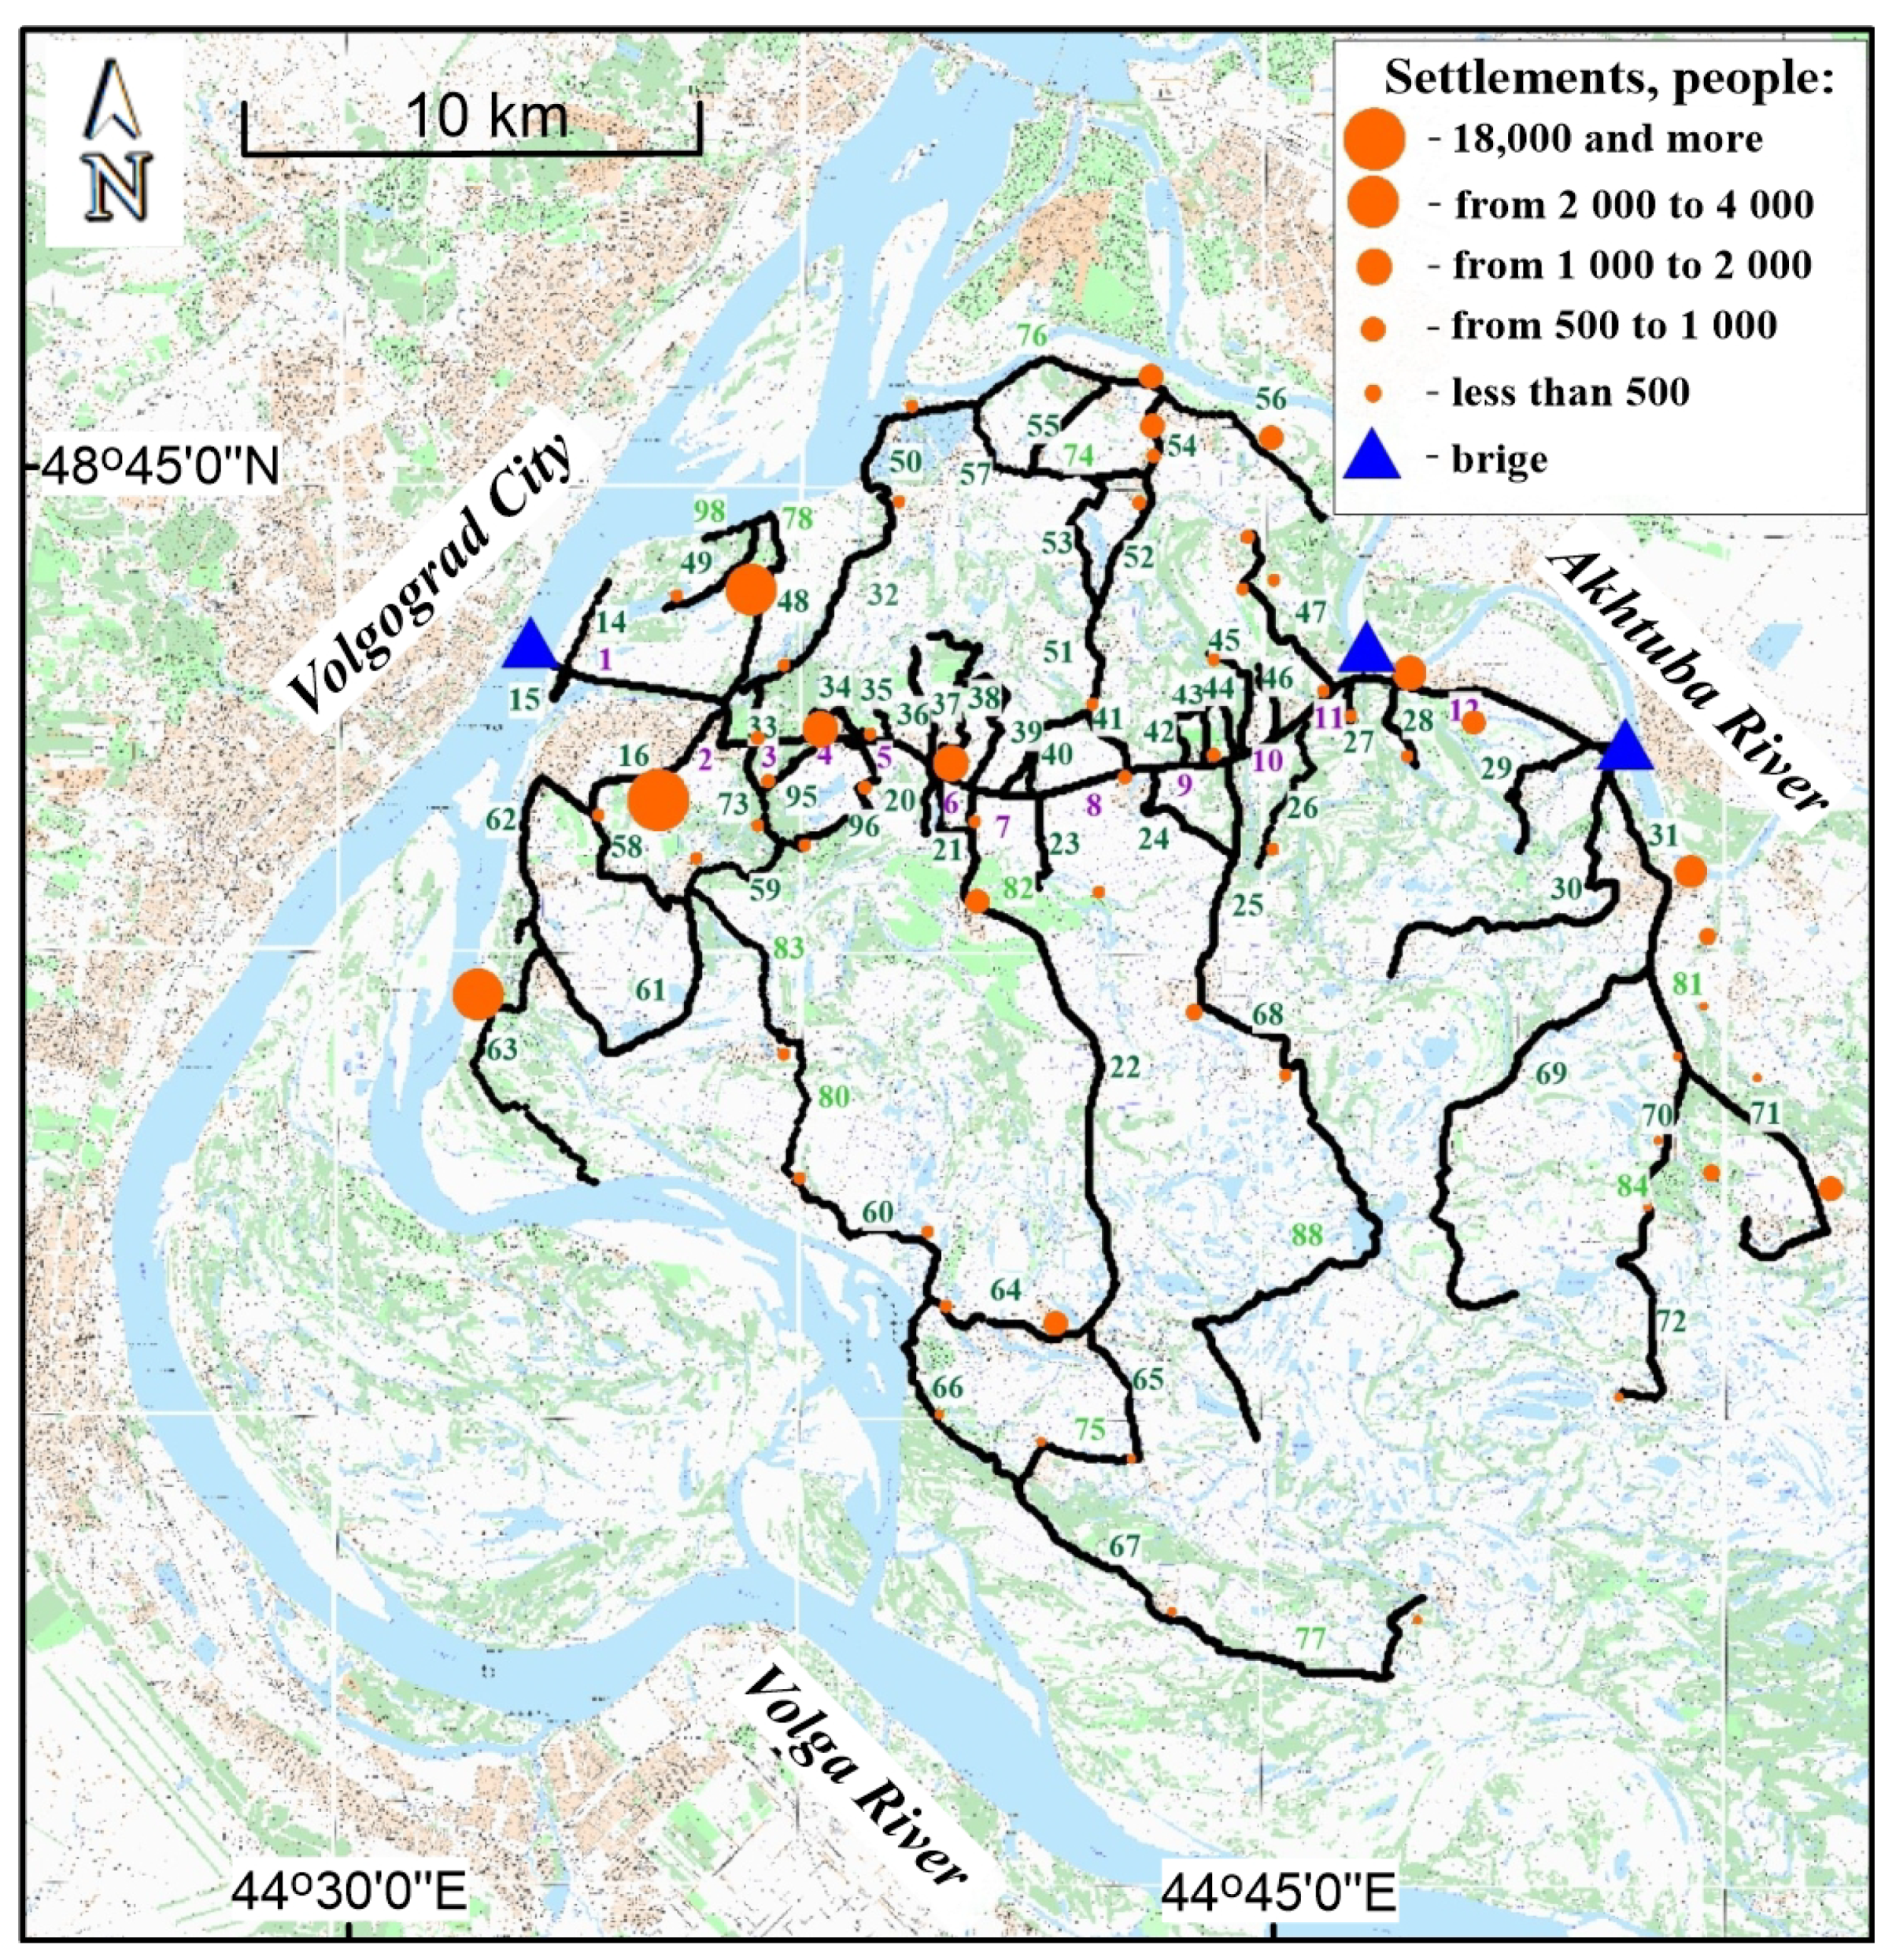
The map of the NPVAF road network with the numbers of its local sections (edges of the graph G) and the location of settlements are shown in Figure 8. The triangles mark bridges across the Volga and Akhtuba rivers, where permanent EPs are also located. Table 2 describes the composition of ERs. The algorithm for solving the problem (7)–(9) involves moving the released vehicles to new routes during the evacuation. The road connecting permanent EPs is not flooded by hydrographs at Q 60,000 m 3 s 1 . Therefore, the paths of vehicles between ERs are free from flooding.
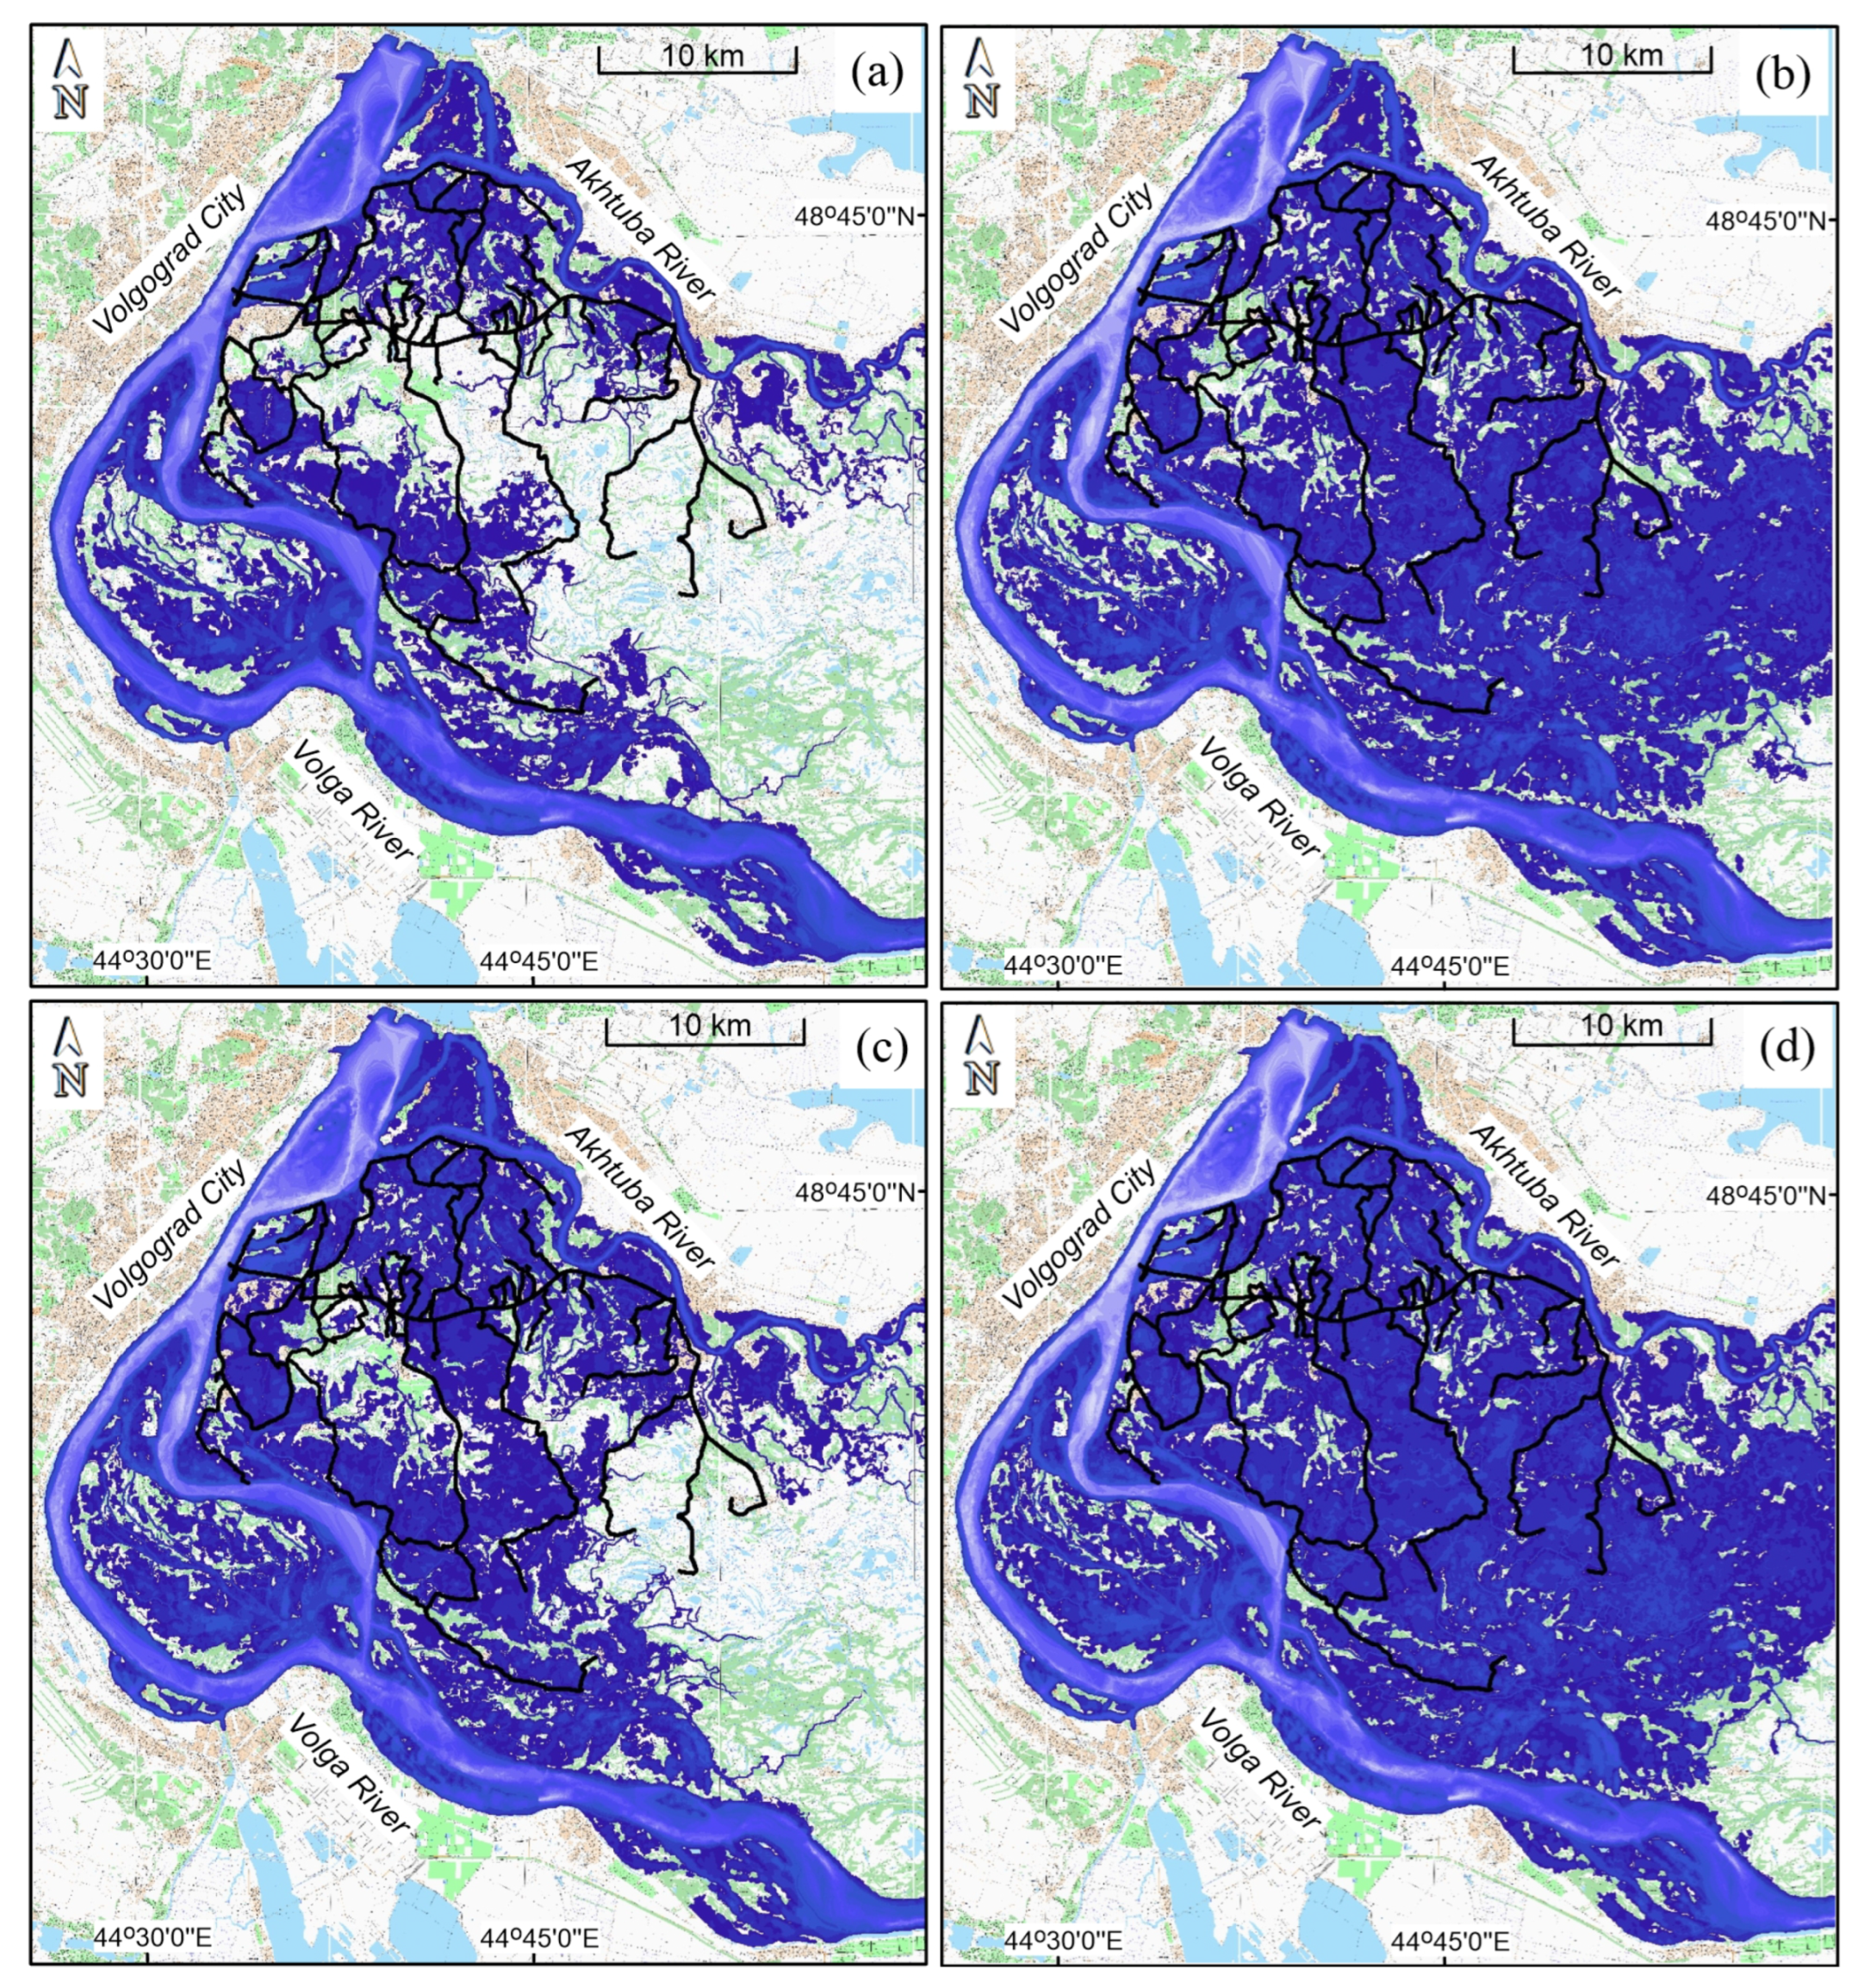
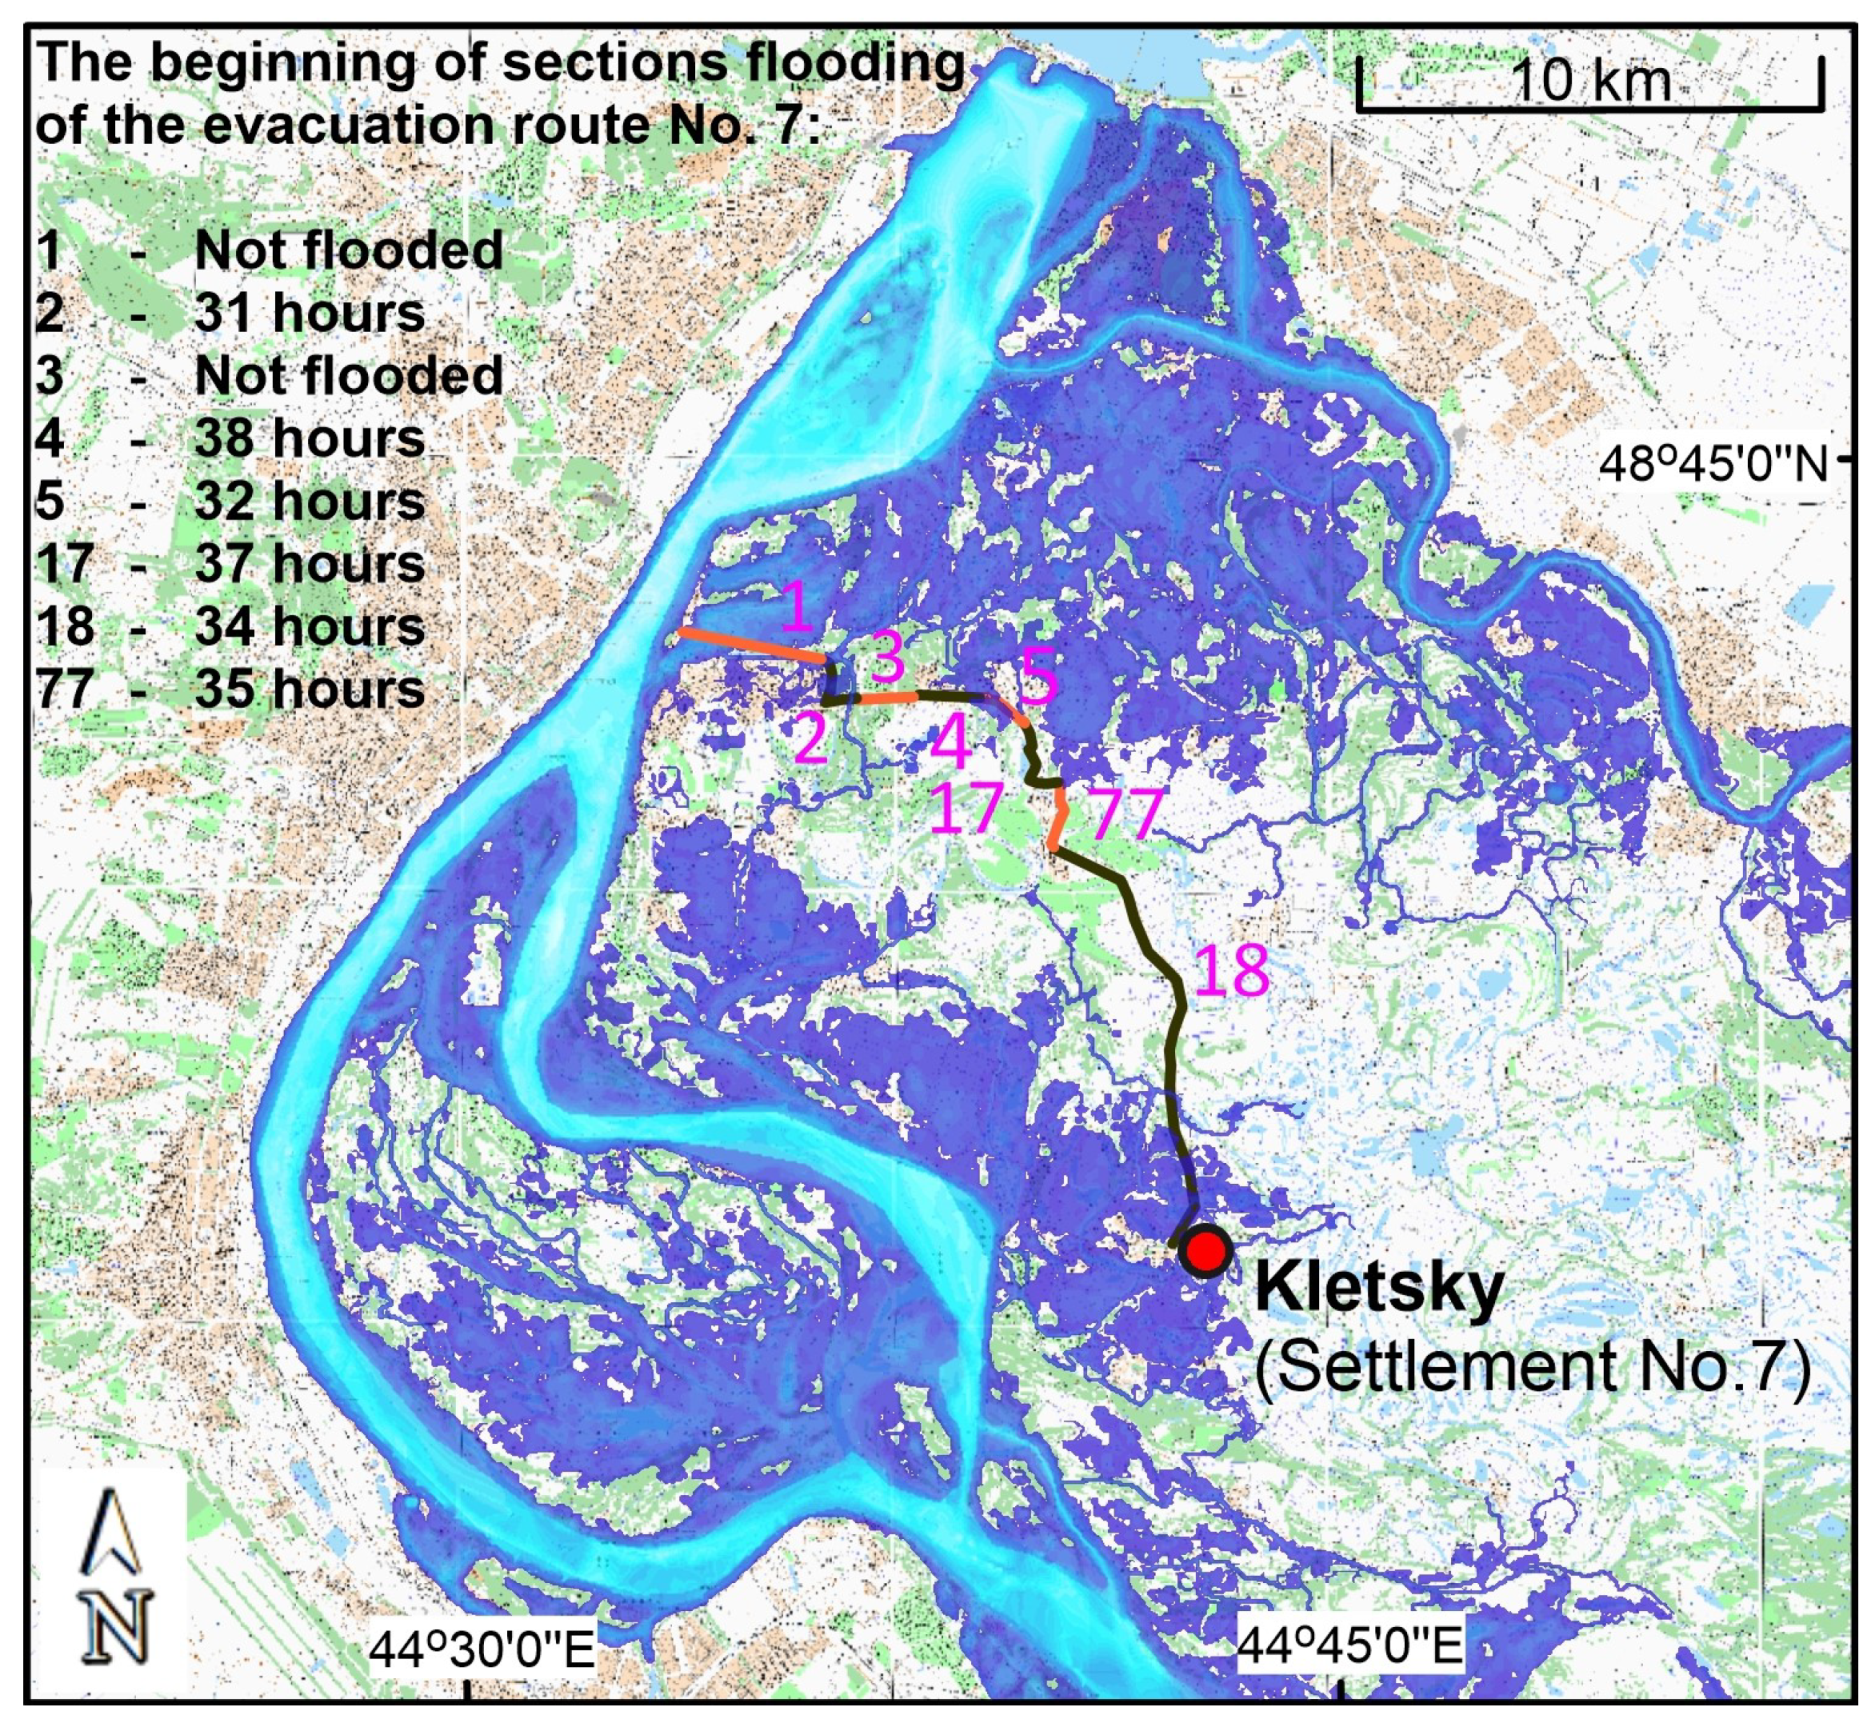
The calculation of the parameters of the evacuation situation was based on the dynamics of HSs and ERs flooding of the NPVAF area for Q ( min ) = 5000 m 3 / c, Q ( max ) [28,000 ÷ 60,000] m 3 / s with the construction of flood maps K f l ( t , Q ( max ) ) every hour. The modeling results show that the flooding of settlements starts at Q ( max ) 29,000 m 3 / s and occurs during the first four days. Figure 9 shows examples of flood maps for several emergency parameter values.
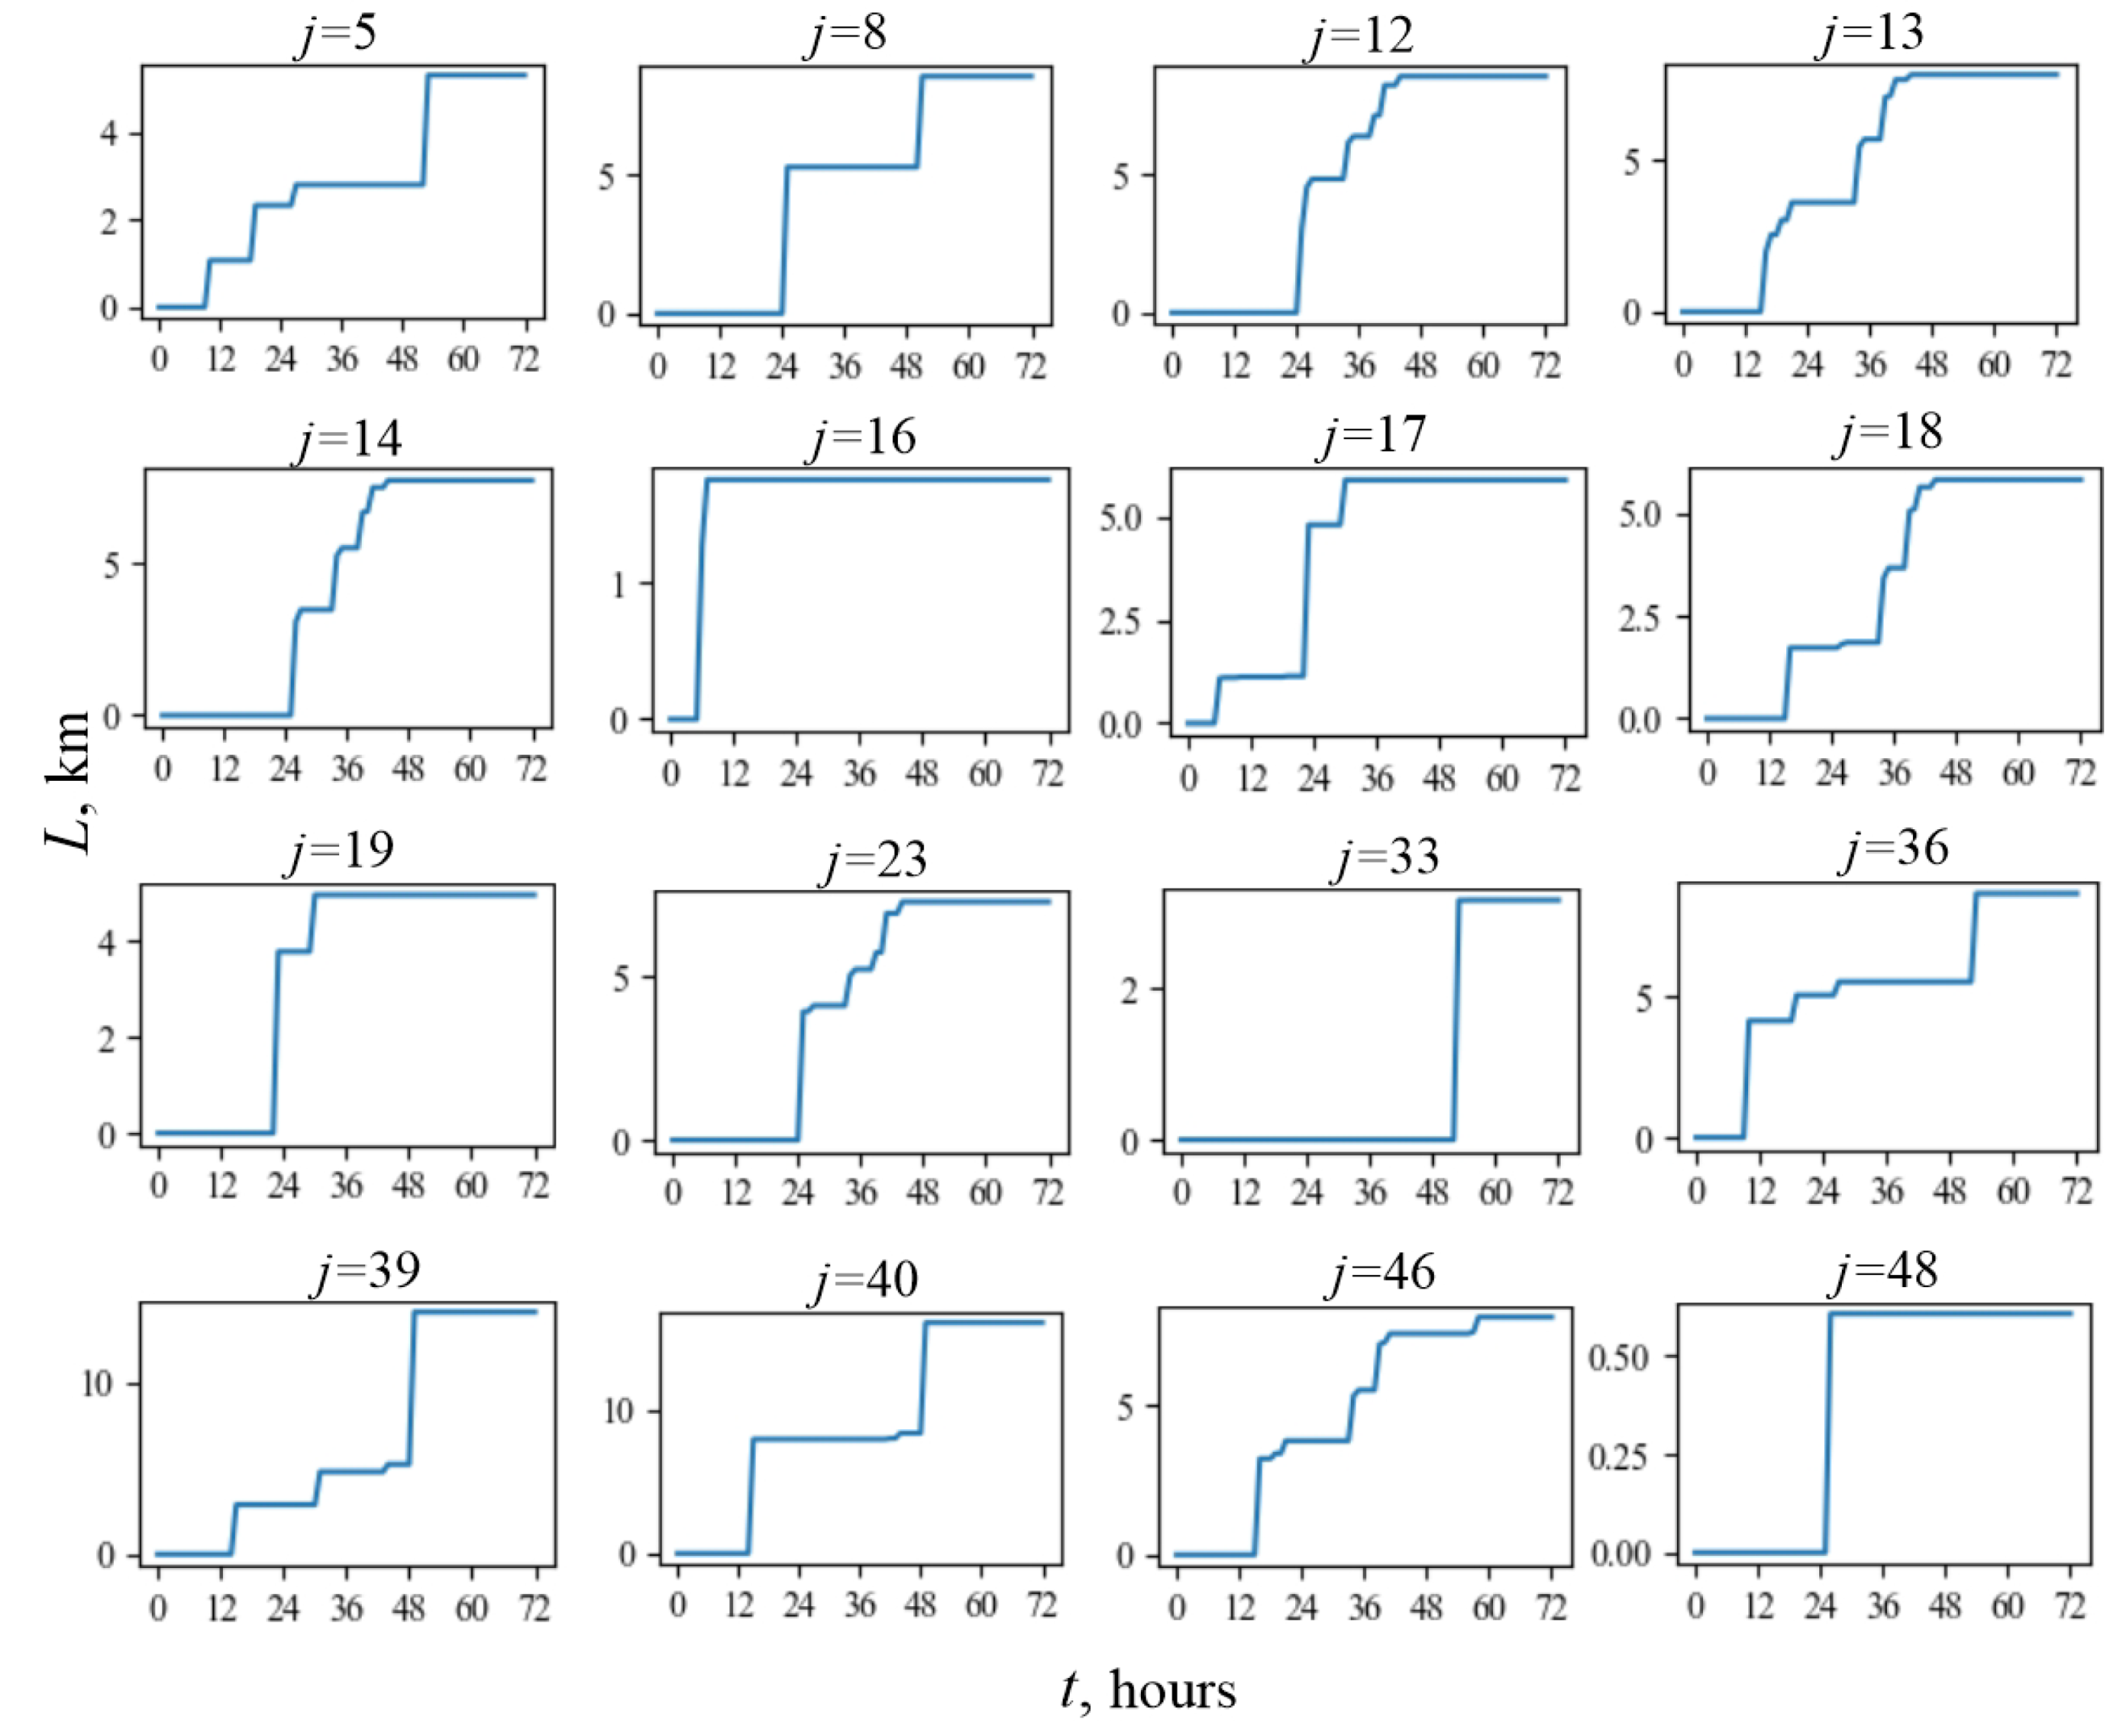
Figure 10 shows the dynamics of flooding of ERs for various settlements (j) flooded in the first 27 h of the emergency. The time after the start of flooding is plotted on the horizontal axes. The distance from HS to flooded areas of ERs is shown on the vertical axes. Each breakpoint on the graphs corresponds to the appearance of a new flooding section of the evacuation route with the coordinates of the corresponding vectors of the array Λ . The duration of the 1st stages of evacuation is determined by the first coordinates of these vectors and their length is given by the last coordinates. Figure 11 shows the features of the process of flooding temporary evacuation point on the example of one road to understand the dependencies in Figure 10.
The search for an approximate solution of the problem (7)–(9) was carried out for the NPVAF, using a series of computational experiments with parameters Q ( max ) [30,000–60,000] m 3 / s; t ( 0 ) [0–8] h; R ( l i m ) [6–30] hs for three STERs: 1-stage evacuation to permanent EPs (STER1); 2-stage evacuation with the shortest ERs of the 1st stage (STER2), the temporary EPs of which are located on the highway; 2-stage evacuation to temporary EPs located in the nearest settlements (STER3). In the latter case (STER3), the value of R ( l i m ) changes by a factor of k, where the coefficient k is given by an expert.
All settlements are divided into five classes by types (transport, pedestrian) and time groups ( t j ( 0 ) = t ( 0 ) , t j ( 0 ) = τ j ^ R ( l i m ) > t ( 0 ) ) of the 1st evacuation stage for each fixed set of parameters Q ( max ) , t ( 0 ) , R ( l i m ) , STER2, STER3. Table 3 contains the distribution of the number of settlements and their inhabitants by these classes for three hydrographs and R ( l i m ) = 24 h. The composition of the 2nd classes changes monotonically with the increase in water discharge, and the composition of the 3rd classes shows non-monotonic behavior (see Table 3). Most of the population moves from classes K 1 and K 2 to classes K 3 and K 4 as Q ( m a x ) grows, which is due to the earlier start of evacuation.
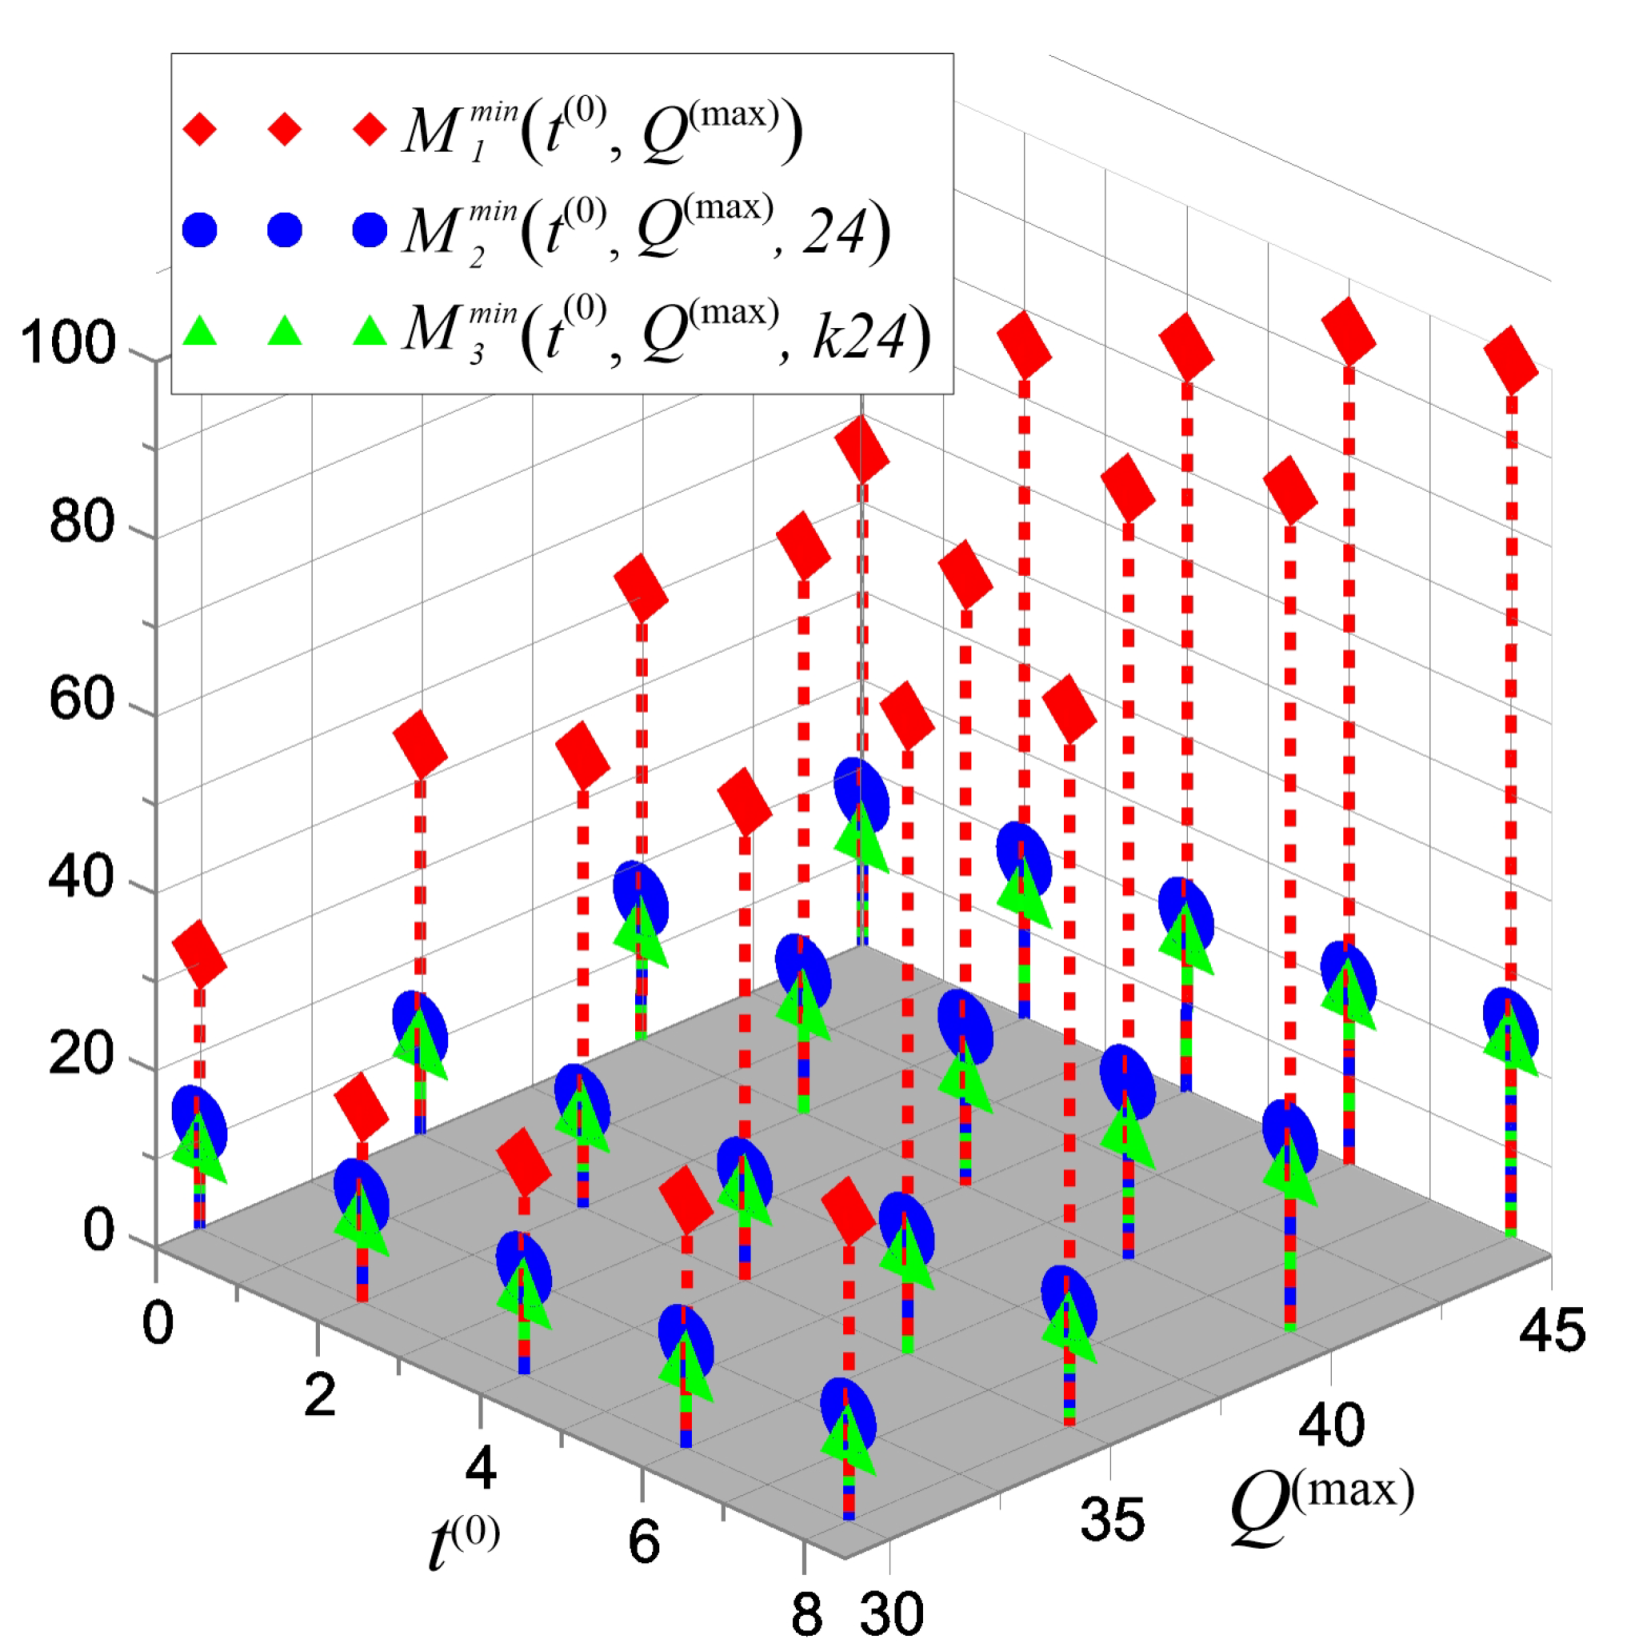
The heuristic algorithm described above made it possible to construct the series of schedules S h i s e c ( t ( 0 ) , Q ( max ) , R ( l i m ) ) , i = 1 , 2 , 3 for each of the three STERs and the corresponding approximate functions of the minimum transport provision for the safe evacuation of the population:
(1)
M 1 m i n ( t ( 0 ) , Q ( max ) ) for 1-stage safe vehicle-pedestrian evacuation in NPVAF;
(2)
M 2 m i n ( t ( 0 ) , Q ( max ) , 24 ) for 2-stage safe pedestrian evacuation of the population in the NPVAF;
(3)
M 3 m i n ( t ( 0 ) , Q ( max ) , k 24 ) for 2-stage safe vehicle-pedestrian evacuation in NPVAF with accommodation of the temporary evacuation points in settlements, k = 3 / 2 (see Figure 12).
The constructed schedules are conditionally safe, since the inhabitants of HS no.16 are excluded at t ( 0 ) > 5 and the inhabitants of HS no.17 at t ( 0 ) > 6 (see Table 2).
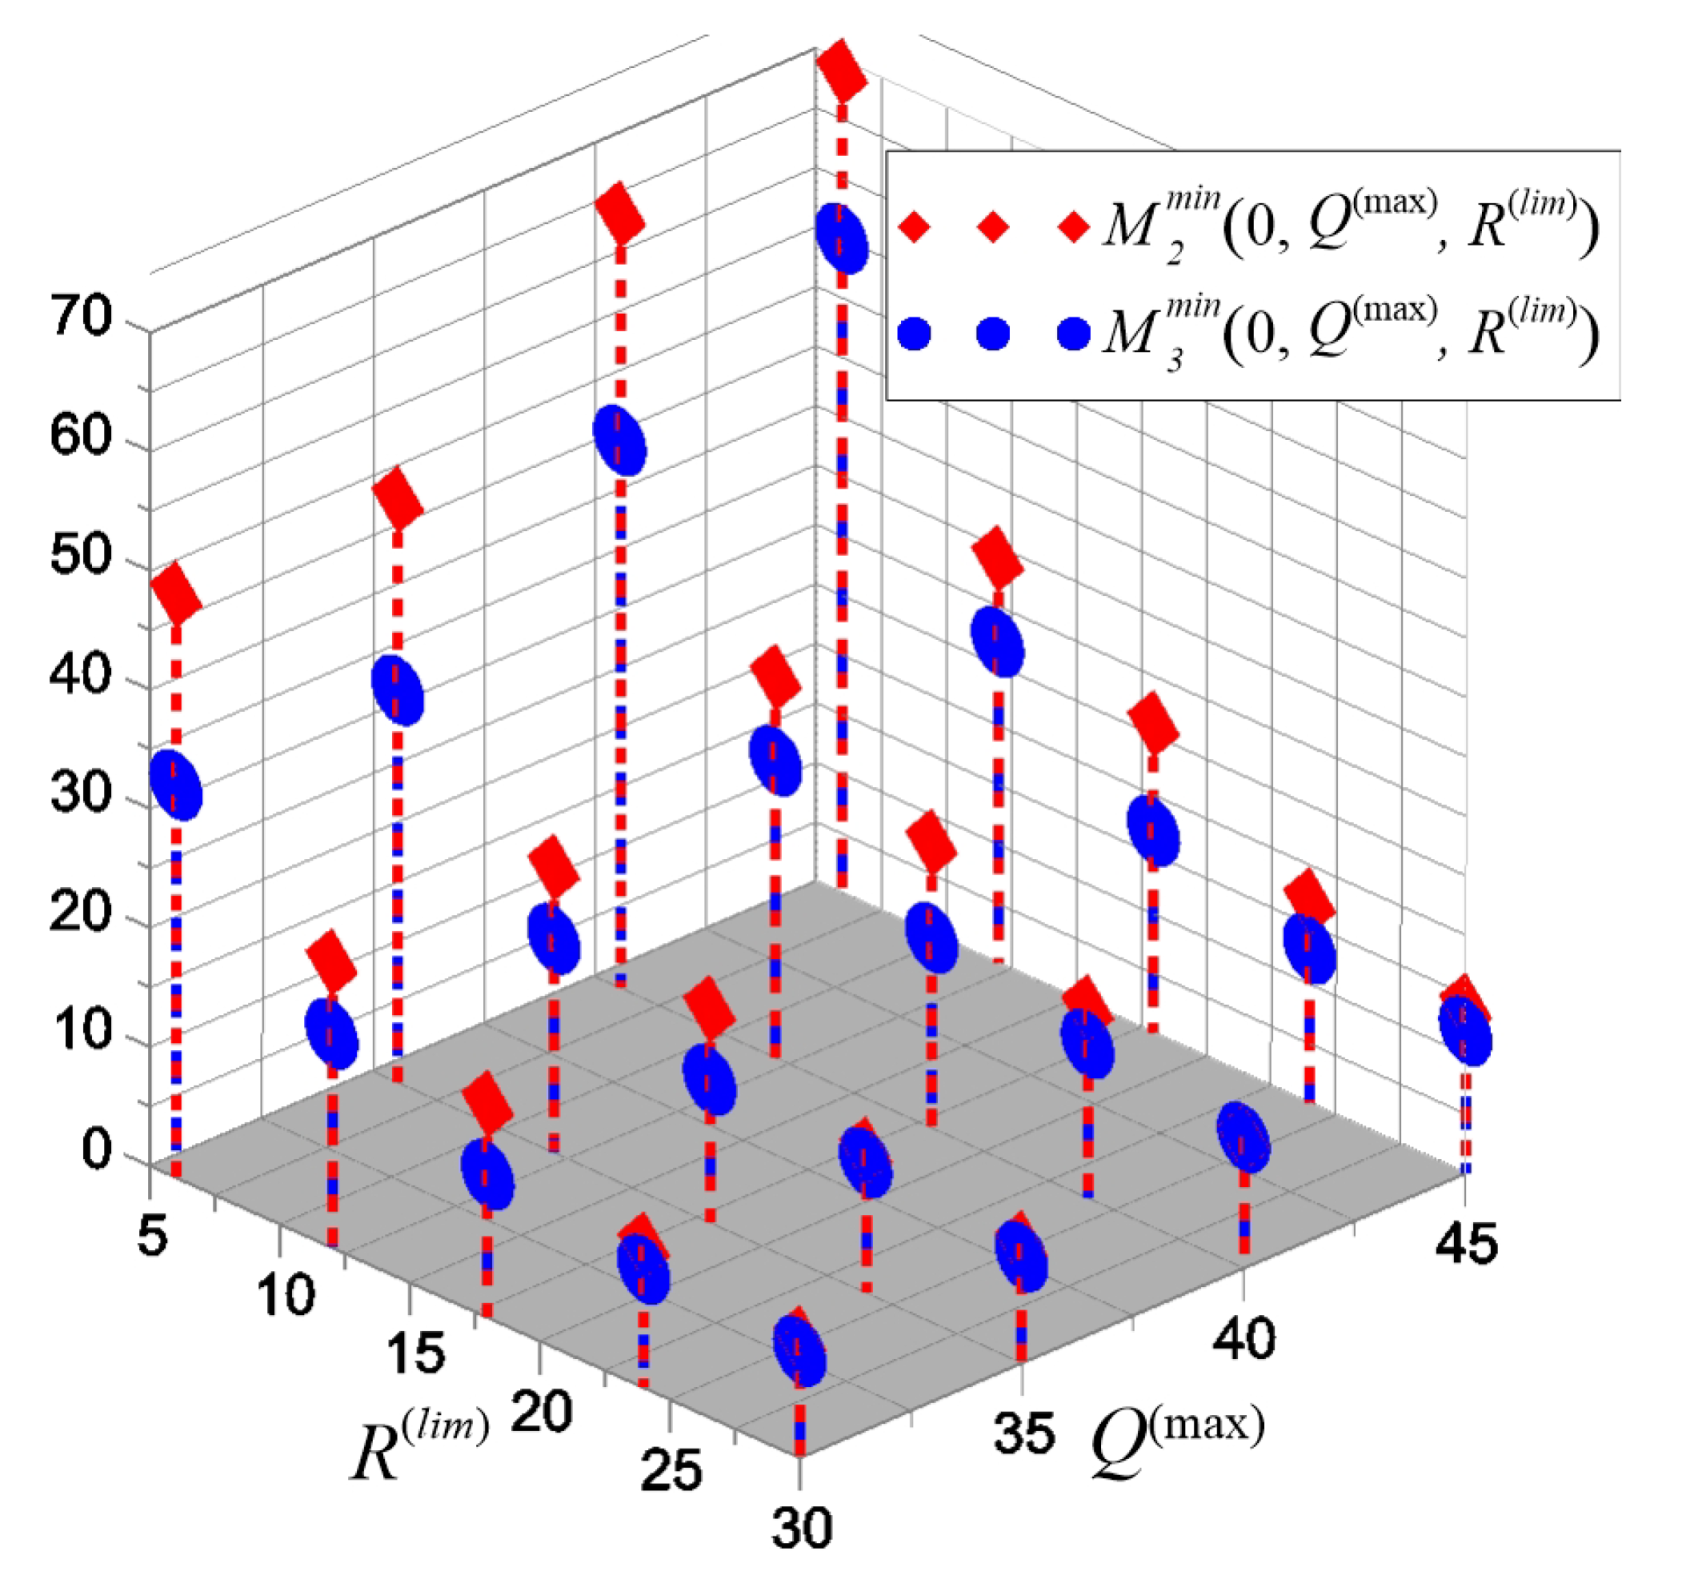
The value of R ( l i m ) can decrease under adverse weather conditions and increase under favorable ones. This affects the minimum level of transport support for the 2nd stage of evacuation. Figure 13 shows the dependencies M 2 m i n ( t ( 0 ) = 0 , Q ( max ) , R ( l i m ) ) and M 3 m i n ( t ( 0 ) , Q ( max ) , R ( l i m ) ) .
Figure 12 shows that the minimum number of machines corresponds to the function M 3 m i n ( t ( 0 ) , Q ( max ) , 24 ) , although its difference from the function M 2 m i n ( t ( 0 ) , Q ( max ) , 24 ) is insignificant. Within our evacuation model, this property is preserved for k 1.1 over the entire range of parameters t ( 0 ) , Q ( max ) , R ( l i m ) indicated above. Thus, the solution to the problem (7)–(9) is the function M 3 m i n ( t ( 0 ) , Q ( max ) , R ( l i m ) ) in the considered range of parameters t ( 0 ) , Q ( max ) , R ( l i m ) . A slight difference from the function M 2 m i n ( t ( 0 ) , Q ( max ) , R ( l i m ) ) can be explained by the fact that STER3 is provided at the 1st stage by a larger number of vehicles than STER2, and at the 2nd stage by a smaller number.

5. Discussion

Comparison of the results of the algorithm’s implementation of 1-stage vehicle evacuation [79] and 2-stage vehicle-pedestrian evacuation in this work showed that the use of 2-stage vehicle-pedestrian evacuation reduces the limit of transport support for safe evacuation by 2–3.5 times in the Northern part of the Volga-Akhtuba floodplain. We emphasize that the placement of temporary EPs in places closest to flooded settlements is appropriate only if the evacuation starts late. The placement of temporary EPs in settlements in other cases increases the values of the minimum transport resources of the 1st stage of evacuation to a lesser extent than it reduces them in the 2nd stage. However, we did not analyze the possibility of real placement of the evacuated population in social infrastructure facilities in the floodplain.
The critical shortage of time for organizing evacuation in the VAF occurs quite early. Therefore, it cannot be compensated for by the redundancy of the transport resource. At the same time, the number of settlements with rapid flooding is small. The best recommendation for such settlements is to embank or raise the flooded sections of the evacuation route to the required height.
Comparison of the results of hydrodynamic modeling with various roughness models shows differences in the forecasts of the flooding moments of some settlements and evacuation routes within 2 h (see Table 1). Moreover, flooding can be both earlier and later. A later start of an evacuation can have a significant impact on the evacuation organization. This indicates the relevance of creating heterogeneous roughness models for each specific area of potential flooding.
We did not consider the influence of social factors on the solution of our optimization problem. First, a significant effect is the dependence of the pedestrian evacuation time on the age and gender characteristics of the population, the season, the presence of panic, etc. [89,90,91,92,93,94,95]. Another significant effect is associated both with the refusal of part of the population to evacuate, and with the uncertainty in the behavior of people evacuating on their own, for example, when choosing evacuation routes and evacuation points [89,96,97]. The third factor is the problem of the intensity of the traffic flow of self-evacuation of the population by private transport (see transport models of self-evacuation [31,32]). The study of the influence of these factors on the evacuation organization and its resource provision is the subject of future research. The created algorithms and the results obtained can be the basis for future studies on the problem of evacuation of the population of floodplain territories during floods. The first goal of such research is to find the optimal organization of land evacuation of a part of the population in the event of a shortage of transport resources for the safe evacuation of the entire population. Then, the optimization aim is to minimize the life risk of the population remaining in the flooded area. The second goal is to search for and optimize hydrotechnical projects for protecting the area from floods in order to reduce the life risk of the population (embankment of settlements, protective dams, raising the roadbed sections). The third goal is to develop a plan for the safest urbanization of the floodplain.

6. Conclusions

We propose a method for estimating the minimum resource support for the safe evacuation of the population of floodplain areas under flood threat based on the mathematical model of surface water dynamics and minimizing the number of evacuation vehicles on a set of safe evacuation schedules. The method involves evacuation in two stages with a shortage of cars with the optimal placement of temporary evacuation points on evacuation routes. The used flood development model contains the multilayer geoinformation model of the territory with layers of relief, channel structure, road network, and settlements, as well as the numerical hydrodynamic model. We describe the two-level problem of finding optimal locations for temporary evacuation points on evacuation routes and finding the minimum number of vehicles that ensure the safe evacuation of the population. The heuristic algorithm for solving it has been developed and studied.
A feature of the flood dynamics in floodplain areas is the territorial and temporal distribution of flood threats, which makes it possible to replace the risk minimization problem with a more deterministic and simple task of finding an acceptable (safe) evacuation schedule with the available reserve of transport evacuation means. The uncertainty of this reserve is overcome by solving the problem of minimizing the number of vehicles on a set of safe evacuation schedules. We consider the flooding of the Northern part of the Volga-Akhtuba floodplain as a result of a strong water discharge through the dam as a testing ground for applying the developed method. Our results show that the construction of the function of the minimum resource support for safe evacuation for a specific floodplain area makes it possible to carry out such an evacuation with a shortage of transport resources using different moments at the start of flooding.
The possibility of practical implementation of admissible schedules of organized evacuation with minimal resource support requires their advanced preparation in a wide range of parameters of the emergency water discharge.
It is necessary to single out another danger for floodplains associated with heavy precipitation. Then water can enter the floodplain not only through the riverbed, but also through spatially distributed sources. Such situations require special modeling of the hydrological regime, but our approach to organizing the evacuation of the population remains unchanged.

Author Contributions

Conceptualization, M.A.K. and A.A.V. (Alexander A. Voronin); methodology, A.A.V. (Alexander A. Voronin), A.V.K.; software, A.Y.K. (Section 3.1 and Section 3.2), A.A.V. (Anna A. Vasilchenko) (Section 3.3), O.Y.V. (Section 3.4 and Section 3.5); validation, A.Y.K. (Section 3.1 and Section 3.2), O.Y.V. and A.A.V. (Anna A. Vasilchenko) (Section 4); formal analysis, M.A.K. and A.A.V. (Alexander A. Voronin); investigation, O.Y.V. and A.A.V. (Anna A. Vasilchenko) (Section 4)), A.Y.K. (Section 3.1 and Section 3.2); computational experiments, A.A.V. (Anna A. Vasilchenko), A.Y.K.; data curation, O.Y.V. (evacuation parameters), A.Y.K. (spatial elevation data); writing—original draft preparation, A.A.V. (Alexander A. Voronin), A.V.K.; writing—review and editing, A.A.V. (Alexander A. Voronin), A.V.K., A.Y.K. (review of flooding and hydrodynamic modeling); visualization, O.Y.V., A.A.V. (Anna A. Vasilchenko), A.Y.K.; supervision, M.A.K.; funding acquisition, M.A.K., A.A.V. (Anna A. Vasilchenko). All authors have read and agreed to the published version of the manuscript.

Funding

This research was funded by the Russian Science Foundation (grant no. 23-21-00176) https://rscf.ru/project/23-21-00176/ (accessed on 26 July 2023).

Data Availability Statement

Not applicable.

Acknowledgments

The authors thank Sergey Khrapov for providing software “EcoGIS-Simulation” for numerical modeling of surface water dynamics in the Volga-Akhtuba floodplain.

Conflicts of Interest

The authors declare no conflict of interest.

References

  1. Arnell, N.W.; Lloyd-Hughes, B. The global-scale impacts of climate change on water resources and flooding under new climate and socio-economic scenarios. Clim. Chang. 2014, 122, 127–140. [Google Scholar] [CrossRef] [Green Version]
  2. Cea, L.; Costabile, P. Flood risk in urban areas: Modelling, management and adaptation to climate change. A review. Hydrology 2022, 9, 50. [Google Scholar] [CrossRef]
  3. Duan, L.; Liu, C.; Xu, H.; Pan, H.; Liu, H.; Yan, X.; Liu, T.; Yang, Z.; Liu, G.; Dai, X.; et al. Susceptibility Assessment of Flash Floods: A Bibliometrics Analysis and Review. Remote Sens. 2022, 14, 5432. [Google Scholar] [CrossRef]
  4. The Centre for Research on the Epidemiology of Disasters. Available online: https://www.cred.be/publications (accessed on 27 July 2023).
  5. Alizadeh, B.; Li, D.; Hillin, J.; Meyer, M.A.; Thompson, C.M.; Zhang, Z.; Behzadan, A.H. Human-centered flood mapping and intelligent routing through augmenting flood gauge data with crowdsourced street photos. Adv. Eng. Inform. 2022, 54, 101730. [Google Scholar] [CrossRef]
  6. Ivanova, O.; Ivanov, M.; Revetria, R. Estimation of the environmental damage of floods in Russia at the end of the 20th century. IOP Conf. Ser. Mater. Sci. Eng. 2019, 492, 012019. [Google Scholar] [CrossRef]
  7. Frolova, N.L.; Kireeva, M.B.; Magrickiy, D.V.; Bologov, M.B.; Kopylov, V.N.; Hall, J.; Semenov, V.A.; Kosolapov, A.E.; Dorozhkin, E.V.; Korobkina, E.A.; et al. Hydrological hazards in Russia: Origin, classification, changes and risk assessment. Nat. Hazards 2017, 88, 103–131. [Google Scholar] [CrossRef]
  8. Belikov, V.V.; Borisova, N.M.; Glotko, A.V. Numerical hydrodynamic 2D-simulation of the inundation of Tulun town on the Iya R. during Flood 2019. Water Resour. 2021, 48, 713–725. [Google Scholar] [CrossRef]
  9. Zemtsov, S.P.; Goryachko, M.D.; Baburin, V.L.; Krylenko, I.N.; Yumina, N.M. Integrated assessment of socio-economic risks of hazardous hydrological phenomena in Slavyansk municipal district. Nat. Hazards 2016, 82, 43–61. [Google Scholar] [CrossRef]
  10. Danilov-Danilyan, V.I.; Gelfan, A.N.; Motovilov, Y.G.; Kalugin, A.S. Disastrous flood of 2013 in the Amur basin: Genesis, recurrence assessment, simulation results. Water Resour. 2014, 41, 115–125. [Google Scholar] [CrossRef]
  11. Grigorev, V.Y.; Kharlamov, M.A.; Semenova, N.K.; Sazonov, A.A.; Chalov, S.R. Impact of precipitation and evaporation change on flood runoff over Lake Baikal catchment. Environ. Earth Sci. 2023, 82, 16. [Google Scholar] [CrossRef]
  12. Belikov, V.V.; Vasil’eva, E.S.; Prudovskii, A.M. Numerical modeling of a breach wave through the dam at the Krasnodar reservoir. Power Technol. Eng. 2010, 44, 269–278. [Google Scholar] [CrossRef]
  13. Veremenyuk, V.V.; Ivashechkin, V.V.; Nemerovets, O.V. Modeling of Process for Level Changes in Cascade of Two Channel Water Reservoirs in Case of Flooding. Sci. Tech. 2019, 18, 146–154. [Google Scholar] [CrossRef]
  14. Wang, W.; Chen, W.; Huang, G. Research on Flood Propagation for Different Dam Failure Modes: A Case Study in Shenzhen, China. Front. Earth Sci. 2020, 460, 527363. [Google Scholar] [CrossRef]
  15. Ferdous, M.R. Socio-Hydrological Dynamics in Bangladesh-Understanding the Interaction Between Hydrological and Social Processes along the Jamuna Floodplain; CRC Press: Leiden, The Netherlands, 2020; p. 205. [Google Scholar]
  16. Zakharchuk, E.A.; Tikhonova, N.A.; Sukhachev, V.N. Spatial structure and propagation of the Neva flood waves. Russ. Meteorol. Hydrol. 2020, 45, 245–253. [Google Scholar] [CrossRef]
  17. Sukhinov, A.I.; Chistyakov, A.E.; Nikitina, A.V.; Kuznetsova, I.Y.; Atayan, A.M.; Protsenko, E.A.; Litvinov, V.N. Supercomputer-Based Simulation of the Hydrodynamics of River Mouth Areas. Commun. Comput. Inf. Sci. 2021, 1437, 255–269. [Google Scholar] [CrossRef]
  18. Divinsky, B.V.; Fomin, V.V.; Kosyan, R.D.; Ratner, Y.D. Extreme wind waves in the Black Sea. Oceanologia 2020, 62, 23–30. [Google Scholar] [CrossRef]
  19. Kuprin, A.V.; Novakov, A.D.; Kantarzhi, I.G.; Gubina, N.A. Local and General Scours Caused by Tsunami Waves. Power Technol. Eng. Vol. 2021, 54, 836–840. [Google Scholar] [CrossRef]
  20. Zemtsov, V.A.; Vershinin, D.A.; Inishev, N.G. Imitation modeling of ice dams (case study of Tom’River, Western Siberia). ICE Snow 2015, 54, 59–68. [Google Scholar] [CrossRef]
  21. Alekseevskii, N.I.; Krylenko, I.N.; Belikov, V.V.; Kochetkov, V.V.; Norin, S.V. Numerical Hydrodynamic Modeling of Inundation in Krymsk on 6–7 July 2012. Power Technol. Eng. 2014, 48, 179–186. [Google Scholar] [CrossRef]
  22. De Caro, M.; Crosta, G.B.; Castellanza, R.; Agliardi, F.; Volpi, G.; Alberti, S. 2D Modelling of rockslide displacements by non-linear time dependent relationships. In Landslides and Engineered Slopes. Experience, Theory and Practice; CRC Press: London, UK, 2016; pp. 765–770. [Google Scholar] [CrossRef]
  23. Paronuzzi, P.; Bolla, A.; Pinto, D.; Lenaz, D.; Soccal, M. The clays involved in the 1963 Vajont landslide: Genesis and geomechanical implications. Eng. Geol. 2021, 294, 106376. [Google Scholar] [CrossRef]
  24. Klikunova, A.Y.; Dyakonova, T.A.; Agafonnikova, E.O.; Makoveev, I.S.; Kornaukhova, M.A.; Radchenko, V.P. Modeling of flooding of settlements during the spring flood. Math. Phys. Comput. Simul. 2021, 24, 63–72. [Google Scholar] [CrossRef]
  25. Isaeva, I.I.; Voronin, A.A.; Khoperskov, A.V.; Dubinko, K.E.; Klikunova, A.Y. Decision Support System for the Socio-Economic Development of the Northern Part of the Volga-Akhtuba Floodplain (Russia). Commun. Comput. Inf. Sci. 2019, 1083, 63–77. [Google Scholar] [CrossRef] [Green Version]
  26. Wyzga, B.; Kundzewicz, Z.W.; Konieczny, R.; Piniewski, M.; Zawiejska, J.; Radecki-Pawlik, A. Comprehensive approach to the reduction of river flood risk: Case study of the Upper Vistula Basin. Sci. Total. Environ. 2018, 631, 1251–1267. [Google Scholar] [CrossRef]
  27. Rizzo, C.; Maranzoni, A.; D’Oria, M. Probabilistic mapping and sensitivity assessment of dam-break flood hazard. Hydrol. Sci. J. 2023, 68, 700–718. [Google Scholar] [CrossRef]
  28. Chatzichristaki, C.; Stefanidis, S.; Stefanidis, P.; Stathis, D. Analysis of the flash flood in Rhodes Island (South Greece) on 22 November 2013. Silva Balc. 2015, 16, 76–86. [Google Scholar]
  29. Diakakis, M.; Deligiannakis, G. Vehicle-related flood fatalities in Greece. Environ. Hazards 2013, 12, 278–290. [Google Scholar] [CrossRef]
  30. Belyakova, A.Y.; Ivanyo, Y.M.; Petrova, S.A. Modeling of rare rain floods on the example of middle rivers of Angara basin. IOP Conf. Ser. Earth Environ. Sci. 2021, 677, 042103. [Google Scholar] [CrossRef]
  31. Alam, M.D.J.; Habib, M.A. Mass evacuation of Halifax, Canada: A dynamic traffic microsimulation modeling approach. Procedia Comput. Sci. 2019, 151, 535–542. [Google Scholar] [CrossRef]
  32. Yin, D.; Wang, S.; Ouyang, Y. ViCTS: A novel network partition algorithm for scalable agent-based modeling of mass evacuation. Comput. Environ. Urban Syst. 2020, 80, 101452. [Google Scholar] [CrossRef]
  33. Nguyen-Thi, L.Q.; Nguyen, V.D.; Pierens, X.; Coorevits, P. An experimental and numerical study of the influence of viscosity on the behavior of dam-break flow. Theor. Comput. Fluid Dyn. 2021, 35, 345–362. [Google Scholar] [CrossRef]
  34. Dyakonova, T.; Khoperskov, A.; Khrapov, S. Numerical Model of Shallow Water: The Use of NVIDIA CUDA Graphics Processors. Commun. Comput. Inf. Sci. 2016, 687, 132–145. [Google Scholar] [CrossRef] [Green Version]
  35. Khrapov, S.S.; Khoperskov, A.V. Application of Graphics Processing Units for Self-Consistent Modelling of Shallow Water Dynamics and Sediment Transport. Lobachevskii J. Math. 2020, 41, 1475–1484. [Google Scholar] [CrossRef]
  36. Klikunova, A.Y.; Khoperskov, A.V.; Agafonnikova, E.O.; Kuz’mich, A.S.; Dyakonova, T.A.; Khrapov, S.S.; Gusev, I.M. Creation of cadastral maps of flooding based on numerical modeling. J. Comput. Eng. Math. 2019, 6, 3–17. [Google Scholar] [CrossRef]
  37. Shaikh, A.A.; Pathan, A.I.; Waikhom, S.I.; Agnihotri, P.G.; Islam, M.; Singh, S.K. Application of latest HEC-RAS version 6 for 2D hydrodynamic modeling through GIS framework a case study from coastal urban foodplain in India. Model. Earth Syst. Environ. 2022, 9, 1369–1385. [Google Scholar] [CrossRef]
  38. Akiyanova, F.; Ongdas, N.; Zinabdin, N.; Karakulov, Y.; Nazhbiyev, A.; Mussagaliyeva, Z.; Atalikhova, A. Operation of Gate-Controlled Irrigation System Using HEC-RAS 2D for Spring Flood Hazard Reduction. Computation 2023, 11, 27. [Google Scholar] [CrossRef]
  39. Lamichhane, N.; Sharma, S. Development of flood warning system and flood inundation mapping using field survey and LiDAR data for the Grand River near the city of Painesville, Ohio. Hydrology 2017, 4, 24. [Google Scholar] [CrossRef] [Green Version]
  40. Yu, X.; Zhang, J. The Application and Applicability of HEC-HMS Model in Flood Simulation under the Condition of River Basin Urbanization. Water 2023, 15, 2249. [Google Scholar] [CrossRef]
  41. Alam, M.D.J.; Habib, M.A.; Pothier, E. Shelter locations in evacuation: A Multiple Criteria Evaluation combined with flood risk and traffic microsimulation modeling. Int. J. Disaster Risk Reduct. 2021, 53, 102016. [Google Scholar] [CrossRef]
  42. Hsiao, C.C.; Sun, M.C.; Chen, A.Y.; Hsu, Y.T. Location problems for shelter-in-place deployment: A case study of vertical evacuation upon dam-break floods. Int. J. Disaster Risk Reduct. 2021, 57, 102048. [Google Scholar] [CrossRef]
  43. Kim, K.; Pant, P.; Yamashita, E. Integrating travel demand modeling and flood hazard risk analysis for evacuation and sheltering. Int. J. Disaster Risk Reduct. 2018, 31, 1177–1186. [Google Scholar] [CrossRef]
  44. Kongsomsaksakul, S.; Yang, C.; Chen, A. Shelter location-allocation model for flood evacuation planning. J. East. Asia Soc. Transp. Stud. 2005, 6, 4237–4252. [Google Scholar] [CrossRef]
  45. Mollah, A.K.; Sadhukhan, S.; Das, P.; Anis, M.Z. A cost optimization model and solutions for shelter allocation and relief distribution in flood scenario. Int. J. Disaster Risk Reduct. 2018, 31, 1187–1198. [Google Scholar] [CrossRef]
  46. Na, L.; Xueyan, S.; Mingliang, Q. A bi-objective evacuation routing engineering model with secondary evacuation expected costs. Syst. Eng. Procedia 2012, 5, 1–7. [Google Scholar] [CrossRef] [Green Version]
  47. Oh, W.S.; Yu, D.J.; Muneepeerakul, R. Efficiency-fairness trade-offs in evacuation management of urban floods: The effects of the shelter capacity and zone prioritization. PLoS ONE 2021, 16, e0253395. [Google Scholar] [CrossRef]
  48. Rahman, M.; Chen, N.; Islam, M.M.; Dewan, A.; Pourghasemi, H.R.; Washakh, R.M.A.; Nepal, N.; Tian, S.; Faiz, H.; Alam, M.; et al. Location-allocation modeling for emergency evacuation planning with GIS and remote sensing: A case study of Northeast Bangladesh. Geosci. Front. 2021, 12, 101095. [Google Scholar] [CrossRef]
  49. Wen, Y.; Zhang, N. Evacuation and Settlement Model of Personnel in Major Flood Disasters and Its Application. IOP Conf. Ser. Earth Environ. Sci. 2019, 304, 042016. [Google Scholar] [CrossRef]
  50. Liu, X.; Lim, S. An agent-based evacuation model for the 2011 Brisbane City-scale riverine flood. Nat. Hazards 2018, 94, 53–70. [Google Scholar] [CrossRef]
  51. Chelariu, O.-E.; Iatu, C.; Ionuț, M. A GIS-Based Model for Flood Shelter Locations and Pedestrian Evacuation Scenarios in a Rural Mountain Catchment in Romania. Water 2022, 14, 3074. [Google Scholar] [CrossRef]
  52. Lee, Y.H.; Kim, H.I.; Han, K.Y.; Hong, W.H. Flood Evacuation Routes Based on Spatiotemporal Inundation Risk Assessment. Water 2020, 12, 2271. [Google Scholar] [CrossRef]
  53. Nakanishi, H.; Wise, S.; Suenaga, Y.; Manley, E. Simulating emergencies with transport outcomes Sim (SETOSim): Application of an agent-based decision support tool to community evacuation planning. Int. J. Disaster Risk Reduct. 2020, 49, 101657. [Google Scholar] [CrossRef]
  54. Davidson, R.A.; Nozick, L.K.; Wachtendorf, T.; Blanton, B.; Colle, B.; Kolar, R.L.; DeYoung, S.; Dresback, K.M.; Yi, W.; Yang, K.; et al. An integrated scenario ensemble-based framework for hurricane evacuation modeling: Part 1—Decision support system. Risk Anal. 2020, 40, 97–116. [Google Scholar] [CrossRef] [PubMed]
  55. Li, Y.; Hu, B.; Zhang, D.; Gong, J.; Song, Y.; Sun, J. Flood evacuation simulations using cellular automata and multiagent systems—A human-environment relationship perspective. Int. J. Geogr. Inf. Sci. 2019, 33, 2241–2258. [Google Scholar] [CrossRef]
  56. Shirvani, M.; Kesserwani, G.; Richmond, P. Agent-based simulator of dynamic flood-people interactions. J. Flood Risk Manag. 2021, 14, e12695. [Google Scholar] [CrossRef]
  57. Yang, L.E.; Scheffran, J.; Süsser, D.; Dawson, R.; Chen, Y.D. Assessment of flood losses with household responses: Agent-based simulation in an urban catchment area. Environ. Model. Assess. 2018, 23, 369–388. [Google Scholar] [CrossRef] [Green Version]
  58. Manna, P.; Anis, M.Z.; Das, P.; Banerjee, S. Probabilistic modeling of flood hazard and its risk assessment for eastern region of India. Risk Anal. 2019, 39, 1615–1633. [Google Scholar] [CrossRef]
  59. Lu, C.; Zhou, J.; He, Z.; Yuan, S. Evaluating typical flood risks in Yangtze River Economic Belt: Application of a flood risk mapping framework. Nat. Hazards 2018, 94, 1187–1210. [Google Scholar] [CrossRef]
  60. Kidyaeva, V.; Chernomorets, S.; Krylenko, I.; Wei, F.; Petrakov, D.; Su, P.; Yang, H.; Xiong, J. Modeling potential scenarios of the Tangjiashan Lake outburst and risk assessment in the downstream valley. Front. Earth Sci. 2017, 11, 579–591. [Google Scholar] [CrossRef]
  61. Maranzoni, A.; D’Oria, M.; Rizzo, C. Quantitative flood hazard assessment methods: A review. J. Flood Risk Manag. 2022, 16, e12855. [Google Scholar] [CrossRef]
  62. Jamrussri, S.; Toda, Y. Available Flood Evacuation Time for High-Risk Areas in the Middle Reach of Chao Phraya River Basin. Water 2018, 10, 1871. [Google Scholar] [CrossRef] [Green Version]
  63. Hamdy, O.; Abdelhafez, M.H.H.; Touahmia, M.; Alshenaifi, M.; Noaime, E.; Elkhayat, K.; Alghaseb, M.; Ragab, A. Simulation of Urban Areas Exposed to Hazardous Flash Flooding Scenarios in Hail City. Land 2023, 12, 353. [Google Scholar] [CrossRef]
  64. Si, Y.; Li, J.; Si, Y. Urban Flood Loss Estimation and Evacuation Design Based on a 500-Year Extreme Flood Event in Syracuse City. Water 2023, 15, 3. [Google Scholar] [CrossRef]
  65. Karbasi, M.; Shokoohi, A.; Saghafian, B. Loss of life estimation due to flash floods in residential areas using a regional model. Water Resour. Manag. 2018, 32, 4575–4589. [Google Scholar] [CrossRef]
  66. Voronin, A.; Kharitonov, M.; Vasilchenko, A.; Isaeva, I. Control Model for Hydrologic Safety of Flooded Territories. In Proceedings of the 2021 3rd International Conference on Control Systems, Mathematical Modeling, Automation and Energy Efficiency, SUMMA 2021, Lipetsk, Russia, 10–12 November 2021; pp. 344–348. [Google Scholar] [CrossRef]
  67. Du, W.; FitzGerald, G.J.; Clark, M.; Hou, X.Y. Health impacts of floods. Prehospital Disaster Med. 2010, 25, 265–272. [Google Scholar] [CrossRef] [PubMed]
  68. Penning-Rowsell, E.; Tapsell, S.; Wilson, T. Key policy implications of the health effects of floods. In Extreme Weather Events and Public Health Responses; Springer: Berlin/Heidelberg, Germany, 2005; pp. 207–223. [Google Scholar] [CrossRef]
  69. Ruidas, D.; Saha, A.; Islam, A.R.M.T.; Costache, R.; Pal, S.C. Development of geo-environmental factors controlled flash flood hazard map for emergency relief operation in complex hydro-geomorphic environment of tropical river, India. Environ. Sci. Pollut. Res. 2022, 1–16. [Google Scholar] [CrossRef] [PubMed]
  70. Borowski, E.; Stathopoulos, A. Protection or Peril of Following the Crowd in a Pandemic-Concurrent Flood Evacuation. Nat. Hazards Rev. 2023, 24, 04022045. [Google Scholar] [CrossRef]
  71. Atayan, A.M.; Nikitina, A.V.; Sukhinov, A.I.; Chistyakov, A.E. Mathematical modeling of hazardous natural phenomena in a shallow basin. Comput. Math. Math. Phys. 2022, 62, 269–286. [Google Scholar] [CrossRef]
  72. Khoperskov, A.; Khrapov, S. A Numerical Simulation of the Shallow Water Flow on a Complex Topography. In Numerical Simulations in Engineering and Science; Rao, S., Ed.; InTechOpen: London, UK, 2018; pp. 237–254. [Google Scholar] [CrossRef] [Green Version]
  73. Dyakonova, T.A.; Krivko, V.V.; Agafonnikova, E.O.; Klikunova, A.Y.; Sokolovskiy, E.V.; Savin, E.S. Determination of the boundaries of flooded zones based on hydrodynamic modeling. Math. Phys. Comput. Simul. 2020, 23, 12–22. [Google Scholar] [CrossRef]
  74. Khrapov, S.S.; Agafonnikova, E.O.; Klikunova, A.Y.; Radchenko, V.P.; Baskakov, E.V.; Savin, E.S.; Makoveev, I.S.; Khrapov, N.S. Numerical modeling of self-consistent dynamics of shallow waters, traction and suspended sediments: I. Influence of commercial sand mining on the safety of navigation in the channel of the Volga river. Math. Phys. Comput. Simul. 2022, 25, 31–57. [Google Scholar] [CrossRef]
  75. Khrapov, S.S. Numerical modeling of self-consistent dynamics of shallow and ground waters. Math. Phys. Comput. Simul. 2021, 24, 45–62. [Google Scholar] [CrossRef]
  76. Agafonnikova, E.O.; Klikunova, A.Y.; Khoperskov, A.V. A computer simulation of the Volga river hydrological regime: A problem of water-retaining dam optimal location. Bull. South Ural. State Univ. Ser. Math. Model. Program. Comput. Softw. 2017, 10, 148–155. [Google Scholar] [CrossRef]
  77. Isaeva, I.I.; Voronin, A.A.; Khoperskov, A.V.; Kharitonov, M.A. Modeling the Territorial Structure Dynamics of the Northern Part of the Volga-Akhtuba Floodplain. Computation 2022, 10, 62. [Google Scholar] [CrossRef]
  78. Khrapov, S.; Pisarev, A.; Kobelev, I.; Zhumaliev, A.; Agafonnikova, E.; Losev, A.; Khoperskov, A. The Numerical Simulation of Shallow Water: Estimation of the Roughness Coefficient on the Flood Stage. Adv. Mech. Eng. 2013, 5, 787016. [Google Scholar] [CrossRef]
  79. Voronin, A.; Vasilchenko, A.; Klikunova, A.; Vatyukova, O.; Khoperskov, A. The Problem of Safe Evacuation of Large Floodplains Population During Flooding. Adv. Syst. Sci. Appl. 2022, 22, 65–78. [Google Scholar] [CrossRef]
  80. Drexl, A.; Kimms, A. Optimization guided lower and upper bounds for the resource investment problem. J. Oper. Res. Soc. 2001, 52, 340–351. [Google Scholar] [CrossRef] [Green Version]
  81. Neumann, K.; Schwindt, C.; Zimmermann, J. Recent results on resource-constrained project scheduling with time windows: Models, solution methods, and applications. Cent. Eur. J. Oper. Res. 2002, 10, 113–148. [Google Scholar]
  82. Neumann, K.; Zimmermann, J. Procedures for resource leveling and net present value problems in project scheduling with general temporal and resource constraints. Eur. J. Oper. Res. 2000, 127, 425–443. [Google Scholar] [CrossRef]
  83. Ranjbar, M.; Kianfar, F.; Shadrokh, S. Solving the resource availability cost problem in project scheduling by path relinking and genetic algorithm. Appl. Math. Comput. 2008, 196, 879–888. [Google Scholar] [CrossRef]
  84. Yamashita, D.S.; Armentano, V.A.; Laguna, M. Robust optimization models for project scheduling with resource availability cost. J. Sched. 2007, 10, 67–76. [Google Scholar] [CrossRef]
  85. Fraccarollo, L.; Toro, E.F. Experimental and numerical assessment of the shallow water model for two-dimensional dam-break type problems. J. Hydraul. Res. 1995, 33, 843–864. [Google Scholar] [CrossRef]
  86. Wang, J.S.; Ni, H.G.; He, Y.S. Finite-difference TVD scheme for computation of dam-break problems. J. Hydraul. Eng. 2000, 126, 253–262. [Google Scholar] [CrossRef]
  87. D’yakonova, T.A.; Khrapov, S.S.; Khoperskov, A.V. The problem of boundary conditions for the shallow water equation. Vestn. Udmurt. Univ. Mat. Mekhanika Komp’Yuternye Nauk. 2016, 26, 401–417. (In Russian) [Google Scholar] [CrossRef] [Green Version]
  88. Winter, T.C. The concept of hydrologic landscapes 1. JAWRA J. Am. Water Resour. Assoc. 2001, 37, 335–349. [Google Scholar] [CrossRef]
  89. Mazzoleni, M.; Brandimarte, L. Modelling flood awareness in floodplain dynamics. Hydrol. Sci. 2023, 604–613. [Google Scholar] [CrossRef]
  90. Mondal, M.S.H. Factors of Influence on Evacuation Behaviour: Survey Results from the Riverine Floodplain Communities in Bangladesh. Quaest. Geogr. 2021, 40, 85–93. [Google Scholar] [CrossRef]
  91. Lim, M.B.; Lim, H.; Piantanakulchai, M. Factors Affecting Flood Evacuation Decision and Its Implication to Transportation Planning. J. East. Asia Soc. Transp. Stud. 2013, 10, 163–177. [Google Scholar]
  92. Dawson, R.J.; Peppe, R.; Wang, M. An agent-based model for risk-based flood incident management. Nat. Hazards 2011, 59, 167–189. [Google Scholar] [CrossRef]
  93. Siebeneck, L.K.; Cova, T.J. Spatial and temporal variation in evacuee risk perception throughout the evacuation and return-entry process. Risk Anal. 2022, 32, 1468–1480. [Google Scholar] [CrossRef]
  94. Wang, Z.; Huang, J.; Wang, H.; Kang, J.; Cao, W. Analysis of Flood Evacuation Process in Vulnerable Community with Mutual Aid Mechanism: An Agent-Based Simulation Framework. Int. J. Environ. Res. Public Health 2020, 17, 560. [Google Scholar] [CrossRef] [Green Version]
  95. Munawar, H.S.; Mojtahedi, M.; Hammad, A.W.A.; Ostwald, M.J.; Waller, S.T. An AI/ML-Based Strategy for Disaster Response and Evacuation of Victims in Aged Care Facilities in the Hawkesbury-Nepean Valley: A Perspective. Buildings 2022, 12, 80. [Google Scholar] [CrossRef]
  96. Prasad, S. Assessing the need for evacuation assistance in the 100 year floodplain of South Florida. Appl. Geogr. 2016, 67, 67–76. [Google Scholar] [CrossRef]
  97. Li, X.; Maghelal, P.; Arlikatti, S.; Dorsett, C. Review of evacuee mobilization challenges causing time-lag: Conceptualizing a new framework. Emerg. Manag. Sci. Technol. 2022, 2, 1–9. [Google Scholar] [CrossRef]
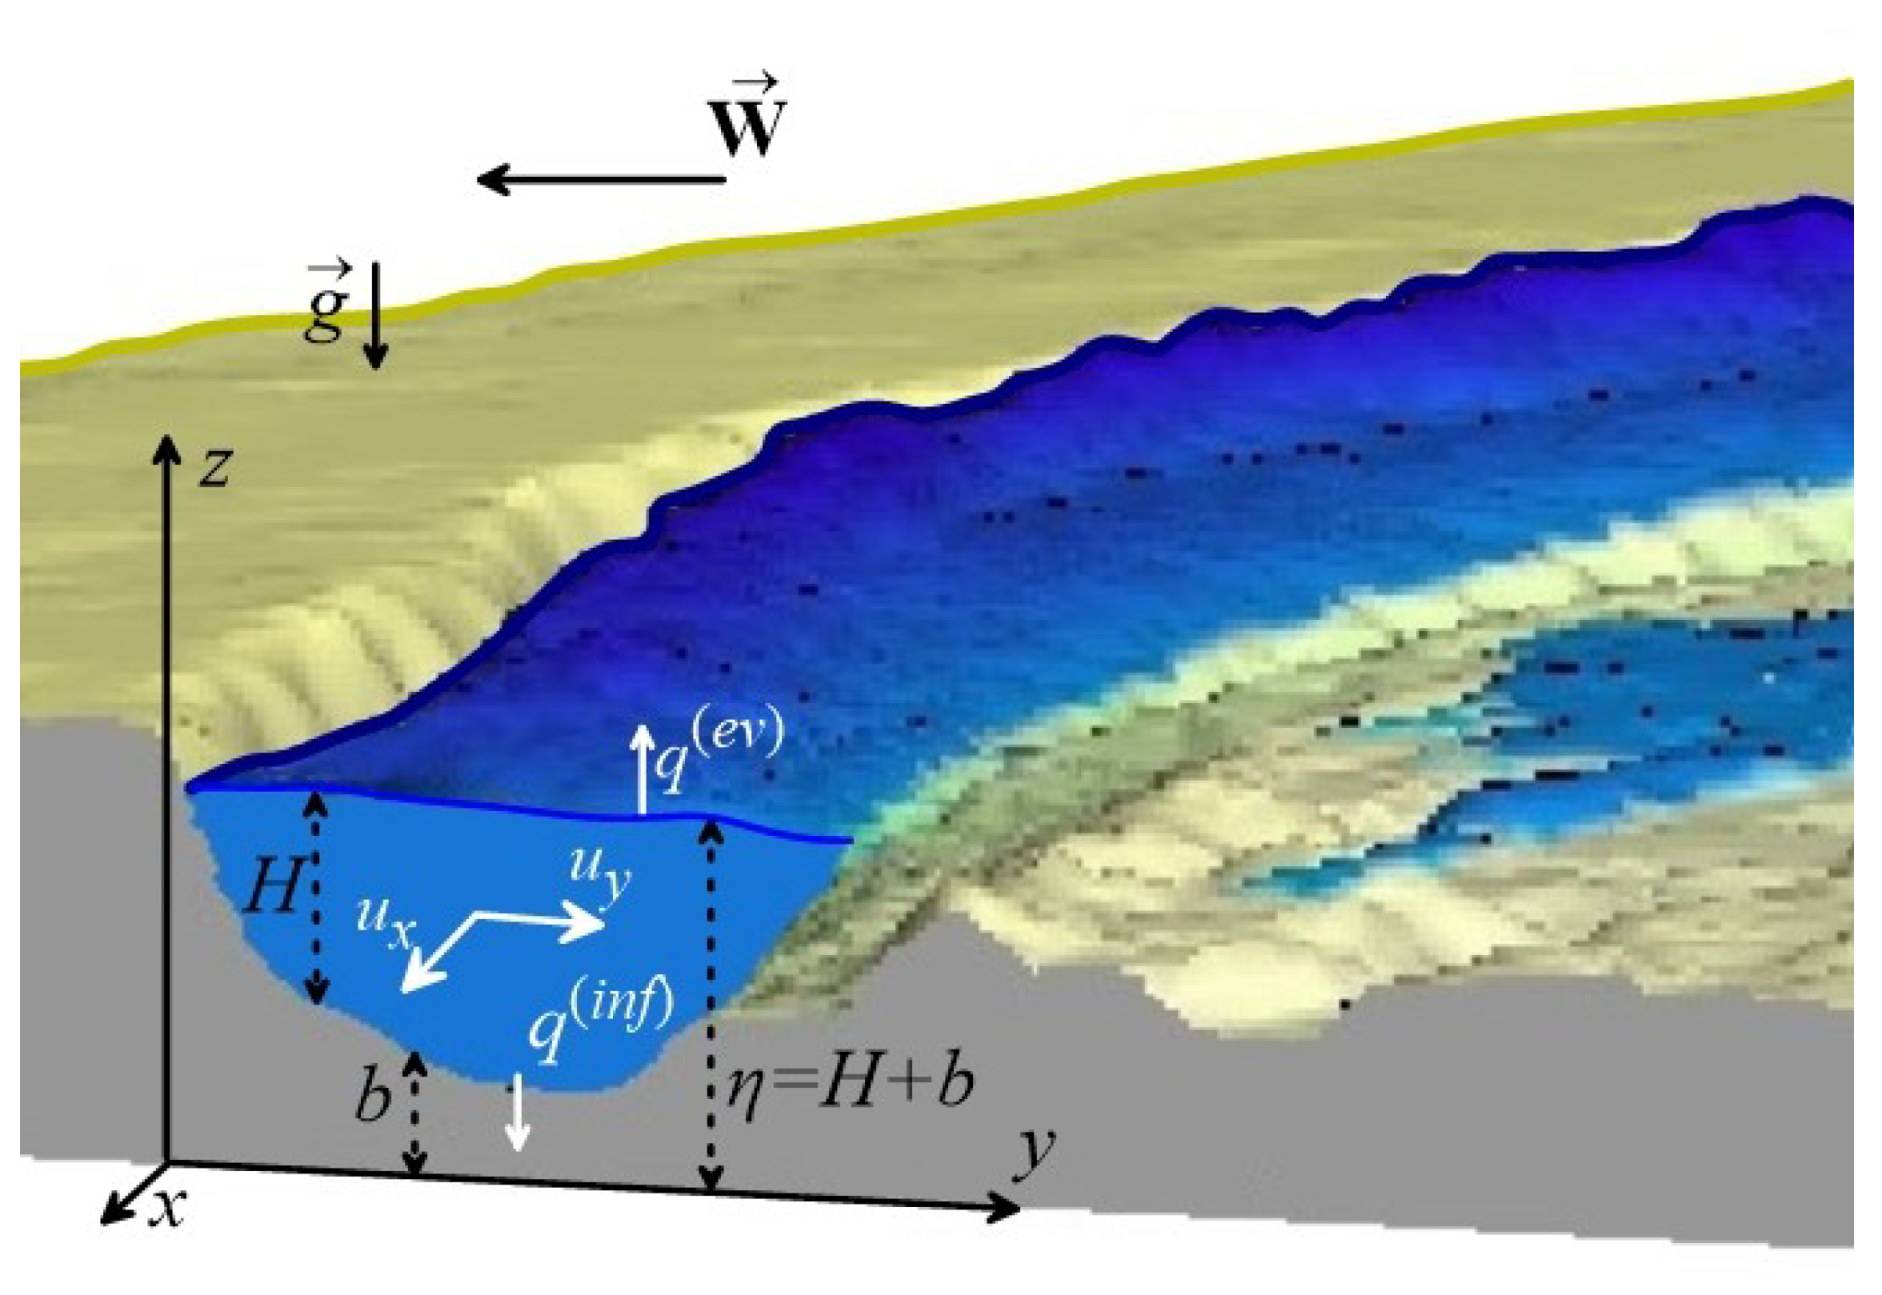
Figure 1. Shallow water model schema.
Computation 11 00150 g001
Figure 2. Examples of rivers water discharge: 1—The Volga river at the gauging station Dam Downstream of the Volga HPP in 2016; 2—the Yenisei River at the gauging station in the village Podkamennaya Tunguska in 2016; 3—the Amur River at the gauging station at the Komsomolsk in 2016; 4—the Ob River at the gauging station at the Salekhard in 2016. The inset shows the model hydrograph used in what follows.
Computation 11 00150 g002
Figure 3. Geographical position of the Northern part of the Volga-Akhtuba floodplain (NPVAF) in the lower reaches of the Volga river (Yandex.Maps + Image Landsat/Copernicus).
Computation 11 00150 g003
Figure 4. The distribution of the coefficient n M for the computational domain of the floodplain and its fragment (see inset on the right for the red box on the left) in our model.
Computation 11 00150 g004
Figure 5. Dependencies Q A ( Q V ) (a) and Q V ( t ) (b) in 2022. The arrows on the right show the hysteresis bypass direction. The right axis in the right panel shows the ratio Q A / Q V (magenta line).
Computation 11 00150 g005
Figure 6. Flooding maps of the Volga-Akhtuba floodplain at the time of t = 5 h at: Q = 65,000 m 3 / s, Q = 100,000 m 3 / s (a,b); Q = 150,000 m 3 / s, Q = 200,000 m 3 / s (c,d).
Computation 11 00150 g006
Figure 7. Comparison of NPVAF flooding modeling results for Q ( max ) = 45,000 m 3 / s at a constant value of the roughness coefficient n M = 0.045 and with a non-uniform distribution n M ( x , y ) . The numbers on the map represent the different evacuation routes.
Computation 11 00150 g007
Figure 8. Digital model of the NPVAF road network and location of settlements. The roads are numbered.
Computation 11 00150 g008
Figure 9. Flood maps and hazard levels for settlements in the NPVAF at Q ( max ) = 35,000 m 3 / s: t = 32 h and t = 72 h (a,b); Q ( max ) = 45,000 m 3 / s: t = 32 h and t = 48 h (c,d).
Computation 11 00150 g009
Figure 10. Dynamics of sections flooding of evacuation routes for settlements flooded in the first 72 h of an emergency. The vertical axes display the distances from the settlement to the flooded sections of the evacuation route.
Computation 11 00150 g010
Figure 11. The process of sequential flooding of the evacuation route is shown by numbers to clarify Figure 10.
Computation 11 00150 g011
Figure 12. Approximate functions of the minimum transport resources for one-stage and two-stage evacuation algorithms vs. t ( 0 ) , Q ( max ) at R ( l i m ) = 24 h.
Computation 11 00150 g012
Figure 13. Approximate functions of the minimum transport reserve for the two-stage evacuation algorithm vs. Q ( max ) , R ( l i m ) at t ( 0 ) = 0 h.
Computation 11 00150 g013
Table 1. The times of the flooding beginning of human settlements and roads during the first day of a large flood for the constant Manning coefficient ( n M = 0.045) and the spatially distributed one ( n M const); t s is the flooding time of settlement; t r is the start time of flooding of the evacuation route from the corresponding settlement; L is the length of the evacuation route.
Q ( max ) = 35,000 m 3 / s Q ( max ) = 60,000 m 3 / sL, km
t s t r t s t r
n M = 0.045 n M  
const
n M = 0.045 n M  
const
n M = 0.045 n M  
const
n M = 0.045 n M  
const
1252525252525252516.25
225252525161425256.85
325252525141325255.25
4171725257616172.45
52525151615158921.35
6252525251515141534.15
7252525251718141529.9
82525252599121221.55
9252525251718141518.1
10252525251618161911.6
11252525251011101120
1225251415887621.8
1324251213775525.65
1421222224768918.7
151111252555141510.2
16151556663313.85
17252533662215.5
1818191516886622.5
1925251617995512.2
202425252599111213.65
2125252525101011127.6
2225252525111211127.6
232525141511127621.8
2425252525111013136.6
2525252525151616173.6
2625252525111213138.15
2725252525131313147.9
28252525251314131410.4
29252525252525212115.6
30252525252525212121.5
31252525251920161713.7
32252525251617131311.3
33252525251515161916.6
34252525252525161914.7
35252525252122161914.7
362525151625258927.25
37252525252122141535.45
38252525252122141532.9
39252523242323141540.6
40252523242525141547.95
41252525251820161910.2
42252525251919141514.5
4325252525121212114.95
44252525252525161910.2
4525252525252516199.45
4622231516776624.35
47252525251820141510.2
482122242577777.2
4925252525201925256.85
5025252525242525256.85
51252525252325212115.6
52252525252525212116.5
53252525252525161914
54252525251210151410.4
55252525251112121319.35
56252525251213111219.05
Table 2. Compositions of permanent evacuation routes.
Number of HSNumber of Permanent ERList of Permanent ER Road NumbersNumber of HSNumber of Permanent ERList of Permanent ER Road Numbers
1166, 75, 26272538, 8, 9, 10
2, 49, 50275, 26282619, 8, 9, 10
332629, 512765, 75, 26
4410302867, 78, 65, 75, 26
5555, 74, 77, 54, 68, 1, 0312963, 20, 9, 10
6659, 17, 76, 16, 4, 3, 2, 1, 0323018, 7, 8, 9, 10
7717, 76, 16, 4, 3, 2, 1, 0333174, 77, 54, 68, 1, 0
8858, 57, 14, 034, 353277, 54, 68, 1, 0
9976, 16, 4, 3, 2, 1, 0363361, 55, 74, 77, 54, 68, 1, 0
101080, 2, 1, 0373470, 60, 17, 76, 16, 4, 3, 2, 1, 0
111132, 5, 4, 3, 2, 1, 0383560, 17, 76, 16, 4, 3, 2, 1, 0
12, 231251, 49, 47, 46, 36, 7, 8, 9, 10393662, 70, 60, 17, 76, 16, 4, 3, 2, 1, 0
131350, 69, 48, 46, 36, 7, 8, 9, 10403772, 62, 70, 60, 17, 76, 16, 4, 3, 2, 1, 0
141449, 47, 46, 36, 7, 8, 9, 1041, 443868, 1, 0
15, 471514, 0423953, 14, 0
161644, 73, 43, 0434023, 10
171745, 27, 045412, 1, 0
181869, 48, 46, 36, 7, 8, 9, 10464252, 69, 48, 46, 36, 7, 8, 9, 10
191927, 0484343, 0
202046, 36, 7, 8, 9, 10524478, 65, 75, 26
21, 222142, 10534529, 3, 2, 1, 0
242241, 9, 10544625
252322, 10554735, 6, 5, 4, 3, 2, 1, 0
262440, 9, 10564833, 5, 4, 3, 2, 1, 0
Table 3. Distribution of settlements and their inhabitants into classes by types and time groups of the 1st stage of evacuation for two STER and three values of the river discharges. The arrows show the dynamics of the composition of the classes with the growth of Q ( max ) . The cells contain: “the number of settlements / the total number of inhabitants in these settlements”.
Class DefinitionClass Dynamics Q ( max ) =
35,000 m 3 /s
Q ( max ) =
45,000 m 3 /s
Q ( max ) =
60,000 m 3 /s
K 0 : No evacuation K 0 → ( K 1 , K 2 )31/10,01519/48255/815
K 1 : Pedestrian  evacuation 
at  the 1st stage at
t j ( 0 ) = τ ^ j R j ( l i m ) > t ( 0 )
K 1 →( K 2 , K 3 )STER2: 9/3690
STER3: 8/3490
STER2: 6/3130
STER3: 5/2930
STER2: 9/2415
STER3: 7/2015
K 2 : Transport evacuation
at the 1st stage at
t j ( 0 ) = t ( 0 )
K 2 K 4 STER2: 6/3375
STER3: 10/21,505
STER2: 14/7070
STER3: 18/25,200
STER2: 27/10,855
STER3: 30/28,885
K 3 : Pedestrian  evacuation 
at  the 1st stage at
t j ( 0 ) = t ( 0 )
K 3 K 4 STER2: 8/21,170
STER3: 7/3040
STER2: 12/21,660
STER3: 8/3530
STER2: 12/24,270
STER3: 9/6240
K 4 : Transport evacuation
at the 1st stage at
t j ( 0 ) = τ ^ j R j ( l i m ) > t ( 0 )
K 4 STER2: 2/555
STER3: 3/755
STER2: 5/2120
STER3: 6/2320
STER2: 3/450
STER3: 5/850
Disclaimer/Publisher’s Note: The statements, opinions and data contained in all publications are solely those of the individual author(s) and contributor(s) and not of MDPI and/or the editor(s). MDPI and/or the editor(s) disclaim responsibility for any injury to people or property resulting from any ideas, methods, instructions or products referred to in the content.