Article

Operation of Gate-Controlled Irrigation System Using HEC-RAS 2D for Spring Flood Hazard Reduction

by
Farida Akiyanova
1,
Nurlan Ongdas
2,*,
Nurlybek Zinabdin
1,
Yergali Karakulov
1,
Adlet Nazhbiyev
1,
Zhanbota Mussagaliyeva
1 and
Aksholpan Atalikhova
1
1
International Science Complex Astana, 01000 Astana, Kazakhstan
2
ON-Oekohydroprojekt, 120400 Aiteke Bi, Kazakhstan
*
Author to whom correspondence should be addressed.
Computation 2023, 11(2), 27; https://doi.org/10.3390/computation11020027
Submission received: 8 November 2022 / Revised: 17 January 2023 / Accepted: 31 January 2023 / Published: 6 February 2023

Abstract

:
Flooding events have been negatively affecting the Republic of Kazakhstan, with higher occurrence in flat parts of the country during spring snowmelt in snow-fed rivers. The current project aims to assess the flood hazard reduction capacity of Alva irrigation system, which is located in the interfluve area of Yesil and Nura Rivers. The assessment is performed by simulating spring floods using HEC-RAS 2D and controlling the gates of the existing system. A digital elevation model of the study domain was generated by integration of Sentinel-1 radar images with the data obtained from bathymetrical survey and aerial photography. Comparison of the simulated inundation area with a remote sensing image of spring flood in April 2019 indicated that the main reason for differences was due to local snowmelt in the study domain. Exclusion of areas flooded by local snowmelt, which were identified using the updated DEM, from comparison increased the model similarity to 70%. Further simulations of different exceedance probability hydrographs enabled classification of the study area according to maximum flood depth and flood duration. Theoretical changes on the dam crest as well as additional gates were proposed to improve the system capacity by flooding agriculturally important areas, which were not flooded during the simulation of the current system. The developed model could be used by local authorities for further development of flood mitigation measures and assessment of different development plans of the irrigation system.

1. Introduction

Riverine floods are one of the destructive and complex natural phenomena that are accompanied by significant negative social, economic and environmental consequences [1]. It has been estimated that floods account for one third of all geophysical hazards in the world [2]. According to Shahabi et al., Haltas et al. and Tellman et al. [3,4,5], extreme weather conditions, rapid urbanization, growing floodplain settlements, poor watershed management and inadequate response to natural disasters are the main causes of rising flood-event-related losses. Huang et al. [6] state that the mechanisms of flooding have become more complicated under anthropogenic influence and climate change. These conclusions are confirmed by the catastrophic floods that swept Germany, Belgium, Switzerland and the Netherlands in summer 2021, and the risks associated with these events are predicted to increase in the future due to several reasons, such as climate change, anthropogenic modifications of landscapes and other socio-economic factors [7]. The Republic of Kazakhstan is in the flood-affected countries list, with 1010 settlements having flood risk [8]. This natural hazard presents an annual pattern, and the highest risk is caused by spring snowmelt. In the last 15 years, there have been more than 300 floods in Kazakhstan, more than two thirds of which were caused by spring snowmelt [
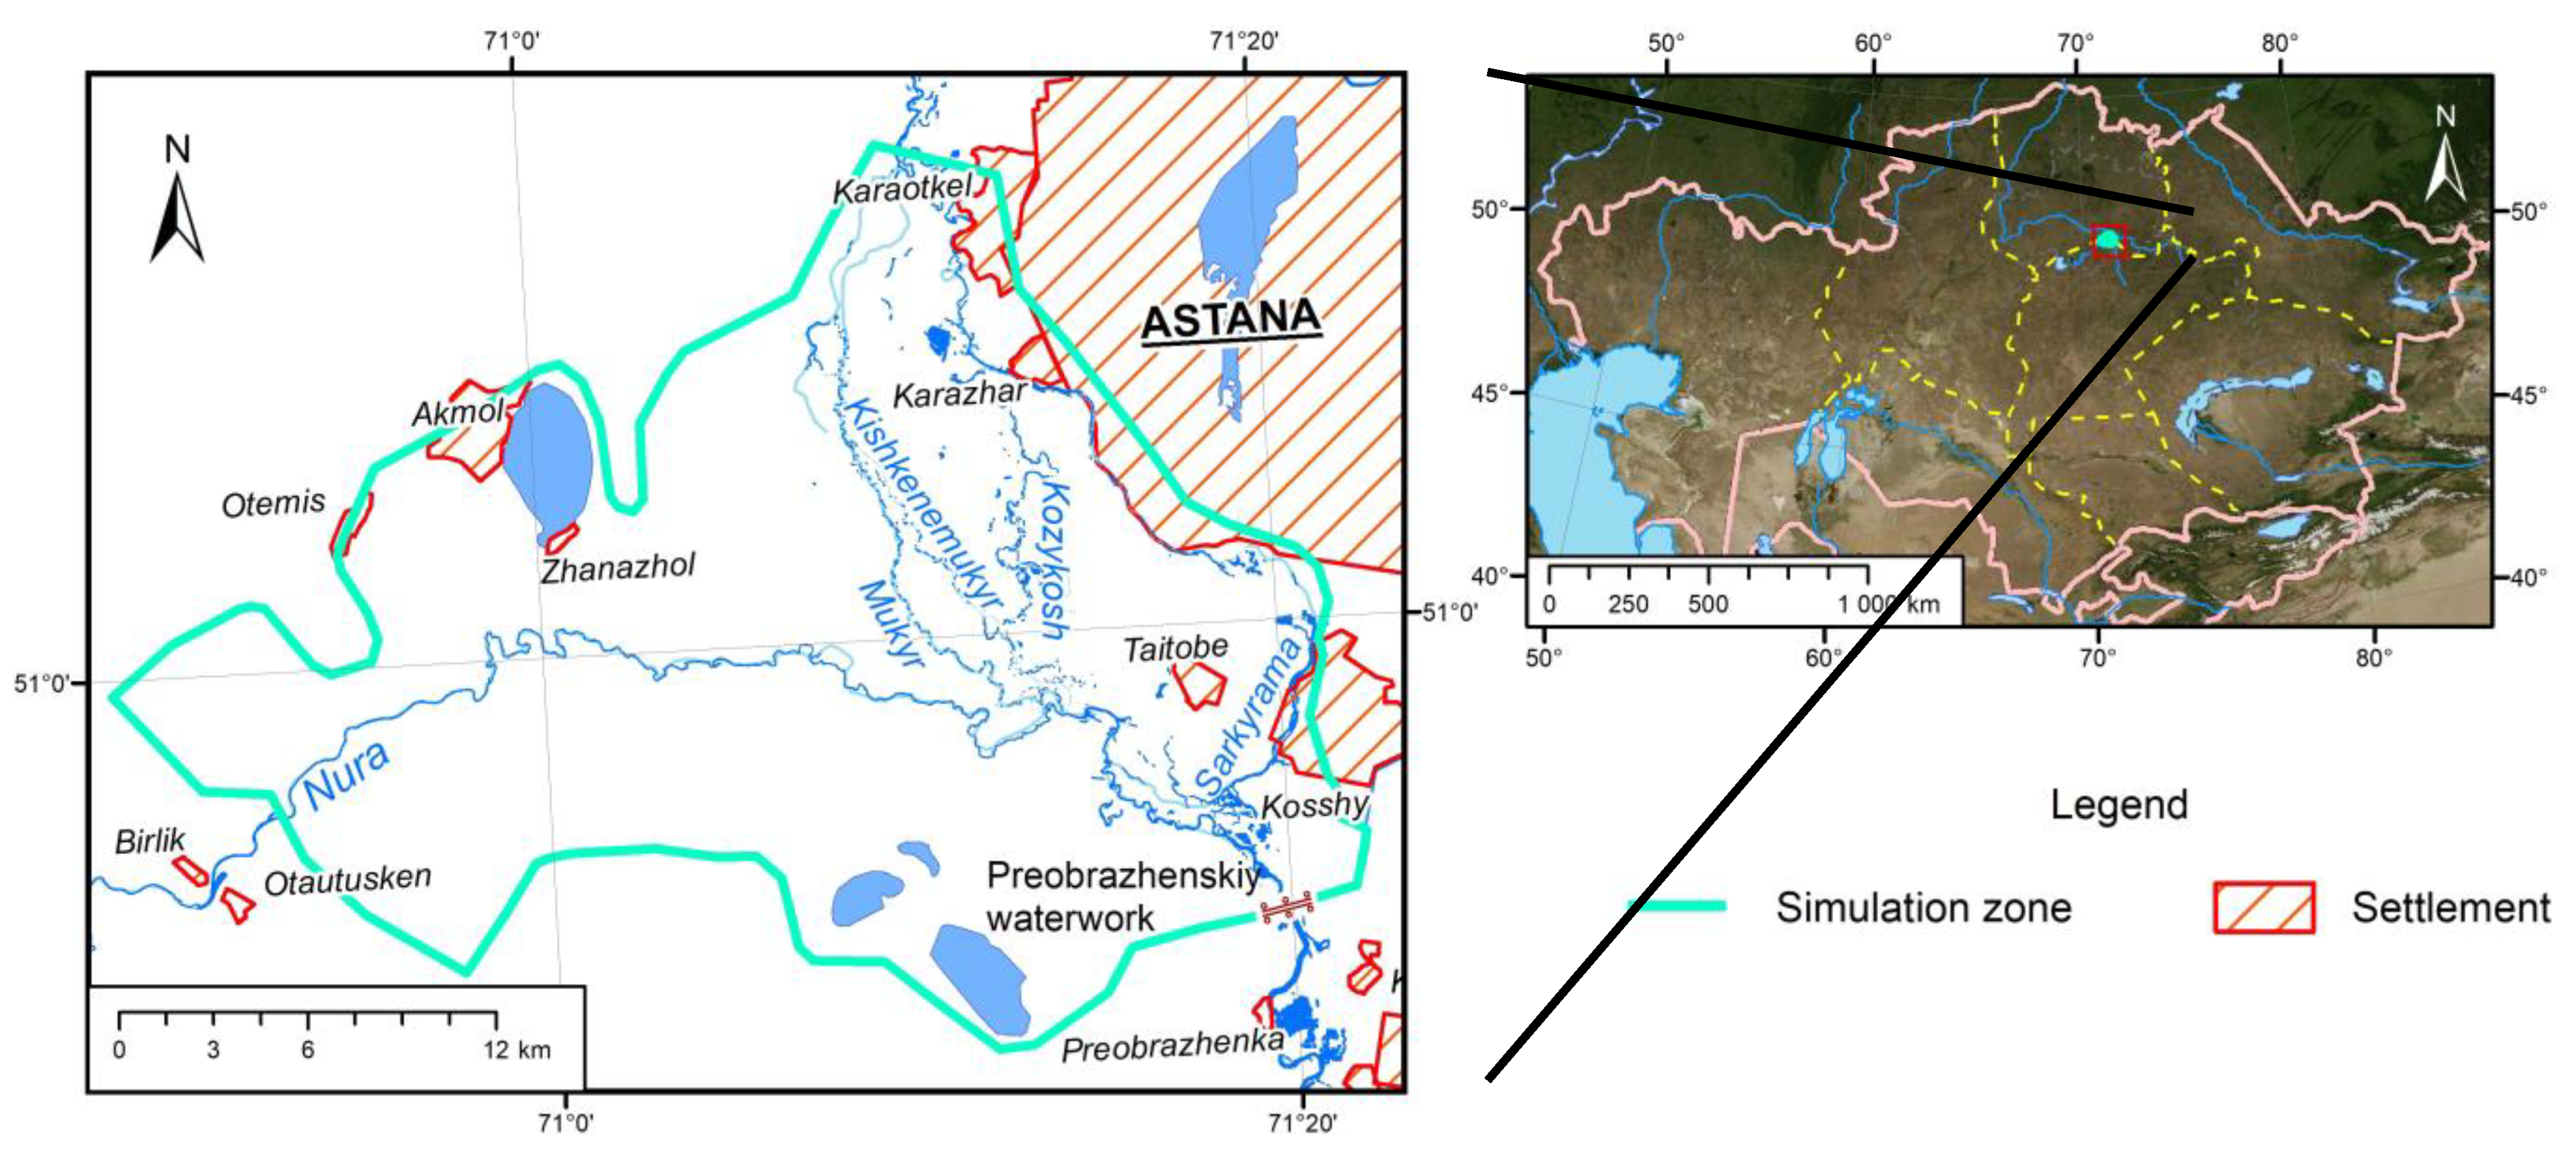
9]. The recent flooding events during spring snowmelt have mainly affected Aktobe and West Kazakhstan Regions, causing hundreds of people to evacuate and financial losses in the state budget. However, as the news from Turkestan Region in spring 2022 illustrates, pluvial floods can also cause significant flood risk to some settlements. Flooding is also a problem for the capital city Astana and the settlements in its suburban zone. The most active population growth in the country and construction of facilities in the floodplains of Nura and Yesil Rivers have significantly increased the flood risk. Water resources of these rivers are the major source for coping with intensive growth of the city. The research area is located on the interfluve of two large rivers, Nura and Yesil, within the suburban zone of Astana. A complex of natural (topographic, climatic and hydrological conditions) and anthropogenic (regulation regime for hydraulic structures, the state of protective structures) factors result in a flood hazard here [10]. Among the different hydraulic structures in this interfluve area, the study focuses on Alva liman (“liman”: temporary flooding of land with spring snowmelt to increase crop yield) irrigation system. It stays closed during most of the spring flood season and is opened only at the end for collection of water for later agricultural use. Considering the potential flood hazard, use of this existing water infrastructure for flood hazard reduction can provide additional benefits to local authorities during a flooding event. The present study aims to assess the capacity of Alva irrigation system by controlling its gates. Therefore, this study involves mainly flood hazard assessment combined with operation of hydraulic structure gates.
Due to worldwide occurrence of flooding events and a range of flood types (coastal, riverine, urban, flash, etc.), flood hazard assessment studies are still a hot topic. In general, flood hazard is defined as a threatening event, including its probability of occurrence [11], and hazard assessment is one of the flood risk assessment steps in addition to exposure assessment, vulnerability assessment and risk assessment [12]. The available literature indicates that flood hazard assessment is a key step in flood risk assessment as it evaluates danger to people and territory due to flooding [12]. Flood hazard is assessed primarily using the distribution in the study domain of the following flood characteristics: water depth, flow velocity, etc. [11,12,13], and these characteristics can be derived using different methods, such as hydraulic modelling [13,14,15], GIS [16,17,18], remote sensing [19,20,21] and in combination with other methods [22,23,24]. Development of inundation water depth enables estimation of damage/losses to the elements of a flood prone area [13]. Later, this information can be used for evaluation of different protection measures and flood disaster mitigation strategies. Ideally, flood disaster mitigation strategies should be based on a comprehensive assessment of the flood risk combined with a thorough investigation of uncertainties associated with the risk assessment procedure [25].
With development of computing power, parallel computing, availability of input data of higher accuracy and growth of remote sensing data for calibration, use of hydraulic models became popular. Currently, there are several hydraulic/hydrodynamic models available, such as Iber, HEC-RAS, Mike 21, TUFLOW, SOBEK, BASEMENT and others. These models simulate movement of water using mathematical equations that are based on the principles of conservation of mass and momentum [26]. Each of them has been assessed at different simulation conditions, with their own advantages/disadvantages. Among the various hydraulic models available, HEC-RAS is gaining popularity with recent developments starting from version 6.0. Its application purposes include flood inundation mapping [27], urban flood risk analysis [28], 1D simulations [29], flash flood modelling [30], dam failure [31], etc. For example, Madhuri et al. [28] assessed water depth, structure risk and productiveness of different flood adaptation practices to reduce building risk due to urban floods for climate change scenarios. Mustafa et al. [32] analyzed the influence of various structure representation methods for urban flood modelling using HEC-RAS 2D for the Toce River. Costabile et al. [33] used HEC-RAS 2D as a fully integrated hydrologic–hydrodynamic model. In this paper, they performed benchmarking analysis of rain on a grid approach of HEC-RAS 2D for simulation of storm-event hazard assessment. Pathan et al. [27] assessed the influence of different mesh sizes on flood depth and extent on River Purna. Munoz et al. [34] evaluated performance of HEC-RAS 2D and Delft3D-Flexible Mesh for simulating total water level (TWL) in Delaware Bay. Such simulations need to consider several factors, such as river discharge, tide, surge, wind and wave-induced water depth, and represent flood dynamics in coastal areas. El Shafy et al. [30] applied HEC-RAS for identification of flash flood prone areas in coastal areas of Wadi Reem Basin. Zeiger et al. [35] integrated SWAT and HEC-RAS for simulation of rain on grid hydrodynamics at a basin scale. El Bilali et al. [36] applied an integrated methodology based on Monte Carlo simulation, HEC-RAS 2D and HEC-LifeSim to model flood risk probability due to a dam break event in Sidi Yahya Zaer, Morocco. Papaioannou et al. [37] applied inhomogeneous bed roughness coefficients for simulation of a flash flood event in 2006 in Greece. The findings showed that uncertainty induced by the roughness coefficient dominates the modeling approach (1D, 2D, combined 1D–2D).
The second approach of this study assessed the capacity of Alva irrigation system to reduce flood hazard by controlling its gates. Operation of hydraulic structure gates and optimization of operation are ongoing research topics and have been studied for many different conditions. For example, Tinoco et al. [38] assessed operation management of planned reservoirs for irrigation systems. The study consisted of conceptual modelling of an integrated system and application of a parametrized method for optimization of reservoir operation. He et al. [39] performed a study on reservoir operation for flood control based on chaotic particle swarm optimization. Myo Lin et al. [40] applied model predictive control to operate a multi-reservoir system with two control objectives, i.e., flood mitigation and water saving, for a case study of Sittaung River. Kim et al. [41] introduced an effective flood control measure using optimal operation of estuary barrage. Nguyen et al. [42] developed a flood control operating strategy for a multi-reservoir system in the Vu Gia Thu Bon catchment. Gois et al. [43] proposed a reservoir operation approach where both quantity and quality aspects are considered using the multiobjective genetic algorithm.
As indicated earlier, this project aims to assess the potential of Alva irrigation system for flood hazard reduction in the interfluve area of Yesil and Nura Rivers. Studies using hydraulic modelling and operation of hydraulic structure gates have never been completed for the Republic of Kazakhstan. Use of HEC-RAS 2D for operation of hydraulic structure gates during a flooding event is not well covered in the existing scientific literature. In addition, the developed model is characterized by the presence of a complex irrigation system with 25 sluice gates. The results of the project have the potential to be used by local authorities for assessment of different flood mitigation measures and development plans. Operation of the Alva system’s gates could reduce flood hazard at a lower cost compared to new structural measures as these gates exist but are not used for this purpose. Operation of gates, which diverts part of the Nura River discharge into the interfluve area, can play a crucial role in balancing the load in the Nura River, thus reducing hydraulic hazard in the downstream area.

2. Materials and Methods

2.1. Study Site Description

The study area is located within the interfluve area of Yesil and Nura Rivers (Figure 1). The peculiarity of this interfluve territory is the absence of a pronounced watershed delineation, which results in overflow of water from hypsometrically higher Nura River (345–349 m.a.s.l.) during flood periods into Yesil River valley (335–338 m.a.s.l.). These rivers are characterized by a short-term spring flood (around 1–1.5 months), during which up to 86–93% of the annual runoff passes, and a long dry period, which is characterized by absence of runoff in some flat areas of the rivers during dry years. The interfluve area is a valley-like depression up to 6 km wide with a general slope towards Yesil River. Water discharge from Nura to Yesil Rivers occurs through the temporary channels of Sarkyrama, Kozygosh and Mukyr. Since 1959, the interfluve has been actively transformed by construction of irrigation system and dams, which blocked the former channels (Sarkyrama, Kozygosh and Mukyr). This territory was originally used for irrigation of floodplain meadows and irrigated agriculture [44]. In the last high-water period (2015–2019), due to the impact of spring floods on the interfluve area, many settlements were flooded, causing significant economic damage. To protect the population, new dams were urgently built; consequently, the territory was practically not used for agricultural production. There are 17 settlements in this area, which cover the territory of 8 rural districts of the Tselinograd Region: A kmol, Nuresilsky, Karaotkelsky, Kosshinsky, Arailinsky, Rakymzhan Koshkarbaeva, Talapkersky, Kabanbai Batyr. The total population is 96,140 people, 52.7% of which belong to the urban population. The total modelling area comprised 59,560 hectares, including the section of Nura River starting from the Preobrazhenskiy waterwork till Birlik settlement (Figure 1).

2.2. Input Data Collection and Preparation

Figure 2 below illustrates the methodological workflow used in this research, involving processing of input data, development of hydraulic model, etc.
Water release data from the Preobrazhenskiy waterwork as well as the mode of operation of existing hydraulic structures were obtained from the Akmola branch of the Republican State Enterprise “Kazvodkhoz”. The latest data on hourly releases from the Preobrazhenskiy for the spring flood period were available for April 2019 (Figure 3). Land cover data were obtained upon request from the Akimat of Tselinograd Region (Figure 4), and initial roughness values were assigned based on HEC-RAS manual.
To study the river network of the interfluve area, methods of remote sensing were used. Multi-temporal and multispectral satellite images from the Sentinel-2 (2020) and PlanetScope (2020) spacecraft were deciphered [45,46]. The main methods of remote sensing and geoinformation mapping were methods of controlled clustering, methods for determining water bodies (normalized difference water index (NDWI) [47] and methods for assessing spatial changes in objects, including water bodies (change detection) [48]. Based on application of the NDWI and change detection, territories prone to flooding during spring flood in different years and a comparative spatial analysis of the flooded areas was performed [49].

2.3. Hydraulic Structures in the Study Area

Preobrazhenskiy waterwork, located on the Nura River, has a capacity of 2 million m3 and started operation in 1973 (Figure 5). Its main purpose is to provide technical water to capital city Astana and water for irrigation of nearby territories. The structure is of a transitional type, so it is not intended to store large volumes of water during the spring snowmelt but to reduce the peak of the flood. However, with a significant inflow of water to Preobrazhenskiy, operators are forced to discharge water in significant volumes (up to 2600 m3/s). Such releases pose a high risk of flooding to downstream areas as well as to the interfluve of Nura and Yesil Rivers, for which it is necessary to take flood hazard minimization measures and to protect settlements and infrastructure from negative impacts.
Alva irrigation system began to be exploited in 1965 and has an area of 12,856 hectares. It includes 17 dams with a total length of 108.2 km and 30 spillways. The dams are earthen, their maximum height varies from 2.7 to 5 m and the average width is 3–4 m (maximum 5.8 m). Dams are quickly eroded and deformed, requiring constant backfilling. In 2018–2019, the gates of the system were reconstructed to resume its operation. Figure 5 illustrates the layout of the system and the location of its gates. Due to the irrigation purpose of the system, it remains closed during most of the spring flood season and collects water only at the end of this period. Since the gates of this system are closed, flood waters bypass the dams and can inundate large areas, whereas, if they were operating, it might be possible to store water downstream the dams.

2.4. Creation of a Digital Elevation Model (DEM)

For 2D flood modeling in HEC-RAS, generation of an accurate DEM is a prerequisite. DEM is used to define the geometric and hydraulic properties of 2D cells and cell faces. For this purpose, radar images of the Sentinel-1 satellite, processed by the multipass interferometric method in the European Space Agency Sentinel Application Platform (ESA SNAP) desktop program, served as the basis for DEM [50] (Figure 6).
As a result of processing, DEM with a spheroidal vertical system and a spatial resolution of 10 m was obtained [51]. Because the study area is flat, the height difference does not exceed 140 m and the absolute excess of the floodplain level above the water level in the riverbed during low water period will not reach 4.5 m; the vertical accuracy of the DEM of 10 m is unacceptable for modeling flood risk. Refinement of DEM in the main parts of the study area was carried out based on the data of absolute marks from topographic maps, reference network obtained as a result of field measurements with the Spectra Professional 60 GNSS receiver, aerial photography and cameral processing of field materials. Detailing of floodplains of rivers and channels and the locations of hydraulic structures was carried out based on aerial photography with the DJI Phantom 4 Multispectral multi-rotor Unmanned Aerial Vehicle (UAV) using the post-processing kinematic (PPK) method [52]. Survey with UAV was carried out within river valleys, which included channels and hydraulic structures with a total of 26,810 photographs. Processing of UAV image was performed using the software Agisoft Photoscan. Aerial photography data of water bodies were supplemented with processed bathymetric survey data obtained during field surveys. Maps of water depth data for water bodies were built for a total length of 33.7 km. Three input data (basis DEM, UAV data and bathymetric data) were combined using the Mosaic tool of ArcGIS 10.6 by setting higher resolution data to have higher priority during refined DEM generation. The result was a DEM with a spatial resolution of 1 m (Figure 7), which was used for modelling purposes.

2.5. Hydraulic Model Development with HEC-RAS

In the current research, simulation of spring flood events in Nura River is accomplished using HEC-RAS hydrodynamic model. This is a free software developed by the US Army Corps of Engineers (USACE) [53]. It has the capacity to perform one-dimensional steady and unsteady flow modelling, 2D unsteady flow modelling and combined 1D –2D unsteady flow routing, sediment transport/mobile bed computations and water temperature/water quality modelling [54]. For simulations in this research, two-dimensional HEC-RAS was used. The main reasons for this choice were: mild slope of the area, absence of clear flow directions in the river valleys and inability of 1D model to represent flow in such complex conditions. In addition, Ghimire et al. [55] found that 2D model with the same sets of geometric conditions and flow conditions provided better results than 1D and coupled 1D/2D. HEC-RAS 2D computes flow rate for a cell boundary using hydraulic properties of the grid and water depth of neighboring cells [54]. Two-dimensional simulations use implicit finite volume algorithm. In comparison to explicit method, implicit method enables a larger computational time step and has improved stability and robustness over traditional finite difference and finite element techniques [56]. All the computations were performed using the diffusion wave equation, which does not consider inertial terms of the momentum equation in the flow field and, therefore, does not require greater computational power and long simulation time as full shallow water equation. This equation allows the program to run with greater stability properties and has the capacity to simulate many modelling applications comparably to full shallow water equation [56]. In addition, the available observed data are insufficient to adequately assess the amount of data that would be produced from the full shallow water equation [57]. HEC-RAS applies sub-grid approach for bottom elevations, which allows for physically based, accurate and stable treatment of wetting and drying processes on very irregular topographies [58]. If typical 2D flood models use a cell size at the scale of meters and time steps that are seconds to accurately represent the complexity of river hydrodynamics, sub-grid approach allows the modeler to use much larger grid size and consequently longer time steps [59]. HEC-RAS 2D uses spatially varying Manning’s roughness coefficients to calculate the flow velocity [59]. A computational mesh was set up at 50 m size to describe the study area, which resulted in 245788 cells overall. 50 m mesh was found to be optimal in the previous study by Ongdas et al. [60] for an area with similar characteristics. The model includes Nura River from Preobrazhenskiy waterwork and covers all the gates of Alva irrigation system (Figure 1). The former channels of Nura River, namely Mukyr, Sarkyrama and Kozygosh, are also included in the model. The mesh geometry was modified using the breaklines that are derived based on the DEM of the study area. Extra attention was paid to correctly represent all the local high grounds, which would act as barriers for flow during the flood event. The slope for outflow boundary conditions was estimated from the DEM as inflow boundary condition release from the Preobrazhenskiy waterwork is assigned.

2.6. Model Calibration

Model calibration is an important step during model creation. This step will test the performance of the model against the observed data. In addition, it is possible to improve the accuracy of the model by applying various coefficients. The main calibration parameters in this study were the roughness coefficients of the respective land cover map (Figure 3). The roughness coefficients of land cover types were calibrated for the case of high flow from April 2019. The model is manually calibrated to obtain a suitable set of roughness coefficients for different zones within the acceptable value range in HEC-RAS manual. The simulated flood zone was compared with a high-resolution PlanetScope satellite image (resolution of 3 m) for 10 April 2019. Model accuracy is evaluated using the following equation [61,62]:
F = ( A A + B + C ) 100
where A is the area correctly predicted to be flooded (wet in both observations and simulations), B is the area overestimated (dry in observations but wet in simulations) and C is the underestimated area of flooding (wet in the observed but dry in the simulations) [63,64]. The F coefficient indicates the level of similarity between the observed and simulated inundation area, with value 100 showing perfect similarity.

2.7. Operation of the Gates in the Alva System

HEC-RAS has an option for scripting operation of hydraulic structures in 2D domains, allowing specific flood control procedures to be applied [64]. There are in total 25 gates in Alva irrigation system, and rules of operation have been assigned to all of them. During the field survey in the summer of 2021, all gate parameters (opening width, height, etc.) were recorded. In addition, with the help of an UAV, aerial images of all dams were taken, which were subsequently included in the DEM of the study area. As a result, the final DEM had an accurate representation of Alva irrigation system and its gates. Operation of the gate corresponded to the rule set specified in the Unsteady Flow Editor:
‘rp26-1′ = Reference Points: WS Elevation(rp26-1, Value at current time step)
‘rp26-2′ = Reference Points: WS Elevation(rp26-2, Value at current time step)
If (‘rp26-1′ > Elevation 1) And (‘rp26-2′ < Elevation 2) Then
          Gate.Opening(Gate 26) = 0.89
Else
          Gate.Opening(Gate 26) = 0
End If
In the rule above, rp26-1 and rp26-2 represent the reference points assigned upstream and downstream of gate 26; Elevation 1 and Elevation 2 represent the threshold water surface elevation (WSEL) values assigned for each gate considering the topography and gate parameters. The reference point values were assigned based on an updated DEM. In the beginning of the scenario, the gates are kept closed, and, as the rule above suggests, they are opened only when the WSEL at the upstream reference point reaches a certain level; moreover, WSEL at the downstream reference point should be lower than a certain level. For ease of operation, the gates are opened and closed fully.

2.8. Model Scenarios

The flood hydrograph from April 2019 corresponded to 10% exceedance probability hydrograph. After calibration of the model with this year, other scenarios were simulated with the calibrated parameters, which corresponded to 1%, 25% and 50% exceedance probability. The selected scenarios reflect the main features of the regime and changes in water content of the Nura River. The initial simulations considered the gates of the Alva system to be closed during these events to represent the real operation conditions. Afterward, the capacity of the Alva system was evaluated by simulation of the same scenarios, with gates operating according to operation rule above. These scenarios were completed on the DEM, which represents the current conditions.
The following scenarios were theoretical, where elevation of dams’ crests was increased (i.e., DEM was modified) in addition to insertion in the model of several new gates and culverts (5 additional gates and 2 culverts). With this new model, 4 scenarios with gates closed and 4 scenarios with gates working were simulated. Overall, there were 16 scenarios that were used for assessment of flood hazard reduction capacity of Alva irrigation system.

3. Results

3.1. Model Calibration

Figure 8 illustrates the actual inundated area during the spring snowmelt on the 10th of April 2019, which was obtained by processing a PlanetScope satellite image. PlanetScope satellites have four spectral channels in the visible band and near-infrared. Thematic processing of remote sensing data consisted of extraction from the multispectral image classes of objects attributed to hydrography by calculation of NDWI [47]. NDWI is an index for identifying and monitoring surface water changes. The algorithm for hydrographic feature extraction consisted of processing satellite images using the above method and automated interpretation in ArcGIS 10.6. The raster images were then converted into vector files.
Calibration of roughness coefficients related to land cover classes resulted in an increase in F coefficient from initial 50% to 52%, which is relatively low. The calibration showed that the most sensitive parameters correspond to those land cover layers that occupy the largest areas, as shown in Table 1. Figure 9 demonstrates the simulated inundation area and observed inundation area. As can be observed, the main underpredicted areas (flooded in satellite images but dry in model result) are located on the left bank of Nura River and northeastern part of the interfluve near the village of Karazhar (Figure 9a). Close inspection of the digitized flood inundation area according to the remote sensing image indicated that some territories located at a higher elevation and protected by dams were also flooded, indicating the influence of other factors than river water. The overlay of these maps on DEM showed that the actual flooding of the higher left-bank part of the Nura River valley is primarily associated with snow melting from the slopes of the denudation plain (Figure 9b). As for the absence of water in the flat part of the interfluve near Karazhar, it is associated with retention of water by longitudinal shafts of a multi-tiered system of limans.

3.2. Models with the Current DEM

Figure 10a–h illustrates the results of simulation of 1, 10, 25 and 50% exceedance probability hydrographs with closed and operating gates of the Alva system. The total flood inundation area from the 100-year return period flood when the gates are closed was 312.0 km2 (Figure 10a). In the case of simulating the same event but with operating gates, the total flooded area was only 1 km2 more, indicating almost no significant difference from the operation of gates (Figure 10b). Geographically, opening affected only the partial flooding of the area located to the west of Karazhar and was associated with opening of the gates in the enclosing dams.
When the real event from April 2019 (10% exceedance probability) was simulated with operating gates, total flooded area increased by 16 km2 (6.34%) (Figure 10d) in comparison to the scenario with closed gates (Figure 10c). Moreover, territorially, these changes affected flooding of territories located on Kozygosh Channel in the northeastern part of the interfluve. The area of flooding during 25% exceedance probability event with closed gates turned out to be 24.0 km2 (Figure 10e) less than with controlled gates (Figure 10f). Geographically, the difference is associated with flooding of territories along Sarkyrama Channel due to opening of the gates. At the same time, in both cases, most of the territory of the former fish hatchery is not flooded due to the absence of gates. Simulation of 50% exceedance probability hydrograph with closed gates resulted in flooding of 123.99 km2 (Figure 10g), whereas, with operating gates, such area increased by 7.53 km2. This difference is mainly associated with the flooding of the area between Kozygosh and Mukyr Channels in connection with the opening of the gates on the separating dams as, during this and previous events, water level upstream of some dams is not high to overflow but high enough to open the gates; controlling the gates resulted in a larger flood area than with the closed dams. A comparative analysis of flooded territories during the above scenarios is shown in Table 2.
Modeling made it possible to estimate the maximum depths during the simulation scenarios (Figure 11a–d, Table 3). An analysis of the flood depth by seven classes demonstrated that 91 to 95.4% of the territory will be flooded with depths of up to 3 m. The largest areas are covered by depths of 0.5–1.5 m when the gates are closed as well as when they are operating. The extent of such depths increases with an inverse dependence on exceedance probability. If, in the case of 100-year return period, such depth occupied 37.7% of the flood area, at 10 and 50% exceedance probability scenarios, it increased to 41.3% and 45.7%, respectively. The smallest flooding depths (up to 0.5 m) are typical for 16.3–32.3% of the territory with closed and 16.5–32.7% with operating gates. Depths from 3 to 5 m are typical for water bodies, and more than 5 m are located mostly in the channels of flooded rivers and quarries for extraction of sand and gravel. As can be seen in Figure 10c,d, during this scenario with operating gates, large areas are flooded, especially in the northeastern part of the interfluve.
Another important modelling result that has importance for agricultural use of the Alva system is the duration of inundation (Figure 12, Table 4). According to Alva irrigation system’s technical specification, it is important that water is kept there between 7 to 14 days in order to obtain good yield. The calculated areas according to the duration of inundation illustrate that, in most of the territory (53.0–67.8%), both with regulated and closed gates, under various scenarios, water will stay 7–14 days (Table 4). It also should be noted that there is also a slight increase in areas up to 7% with controlled gates.

3.3. Model with the Theoretical Changes (Modified DEM and Additional Gates)

Simulation results of the 1, 10, 25 and 50% exceedance probability hydrographs on the modified DEM with additional gates and culverts are illustrated in Figure 13 and Table 5. It should be noted that optimization of the Alva system with addition of new culverts has shown its efficiency. This is clearly observed in the area of the fish hatchery, which was not flooded in the models with the current irrigation system condition. Spatially, the main changes in flooding relate to the northern and northeastern part of the interfluve, which are associated with insufficient water at 25 and 50% of the runoff. Here, with a 50% exceedance probability event, water will not even flow through the supply channel to Lake Zhalanash.
Table 6 shows the distribution of areas according to maximum flood depth. In this case as well, the maximum areas were covered by water depth of 0.5–1.5 m for all scenarios, both with closed and operating gates, and the percentage of such areas from the total inundation area varied between 36 and 48%. At 1% and 10% scenarios with closed gates, maximum flood depth of 1.5–3.0 m covered 36–36.3% of flooded territory, whereas, at 25 and 50% scenarios, such depths covered 23.3 to 24% of the inundated land. It should be noted that, overall, when the gates are operating, the flooding depths are reduced.
Figure 14 illustrates the maximum flood depths during hydrograph simulation from April 2019 on modified DEM. Here, with operating gates, almost 99% of the territory is occupied by depths up to 5 m. Of these, up to 0.5 m water depth is found at 20.1% of the inundated area, which is mainly at the northern and northeastern outskirts of the interfluve. The majority (36.2%) of the flooded area is occupied by a depth of 0.5–1.5 m; these are the territories of Alva irrigation system. Depths from 1.5–3 m and 3–5 m are typical for interfluve water bodies, which occupy 28.7 and 14% of the flooded land, respectively.
Analysis of flood duration data indicates that 57.3 to 67.3% of the simulation area with closed and operating gates is under water for 7–14 days (Figure 15, Table 7). The soils of these territories received optimal watering conditions, which enables an increase in the yield of natural hayfields. As Figure 15 suggests, longer flooding is typical for the lower river floodplains. These features of the flood depth distribution are well illustrated on the simulation map of 10% exceedance probability below.

4. Discussion

Calibration of the model using the satellite image of the flood from April 2019 did not significantly improve the model performance, resulting in model similarity of 52%. The modeling approach used in this project is not considered to be the reason for such performance of the model. For example, the applied diffusion wave model, according to the literature review, has limitations only for urban areas, and, for such a hydrograph, should provide reasonable results [65,
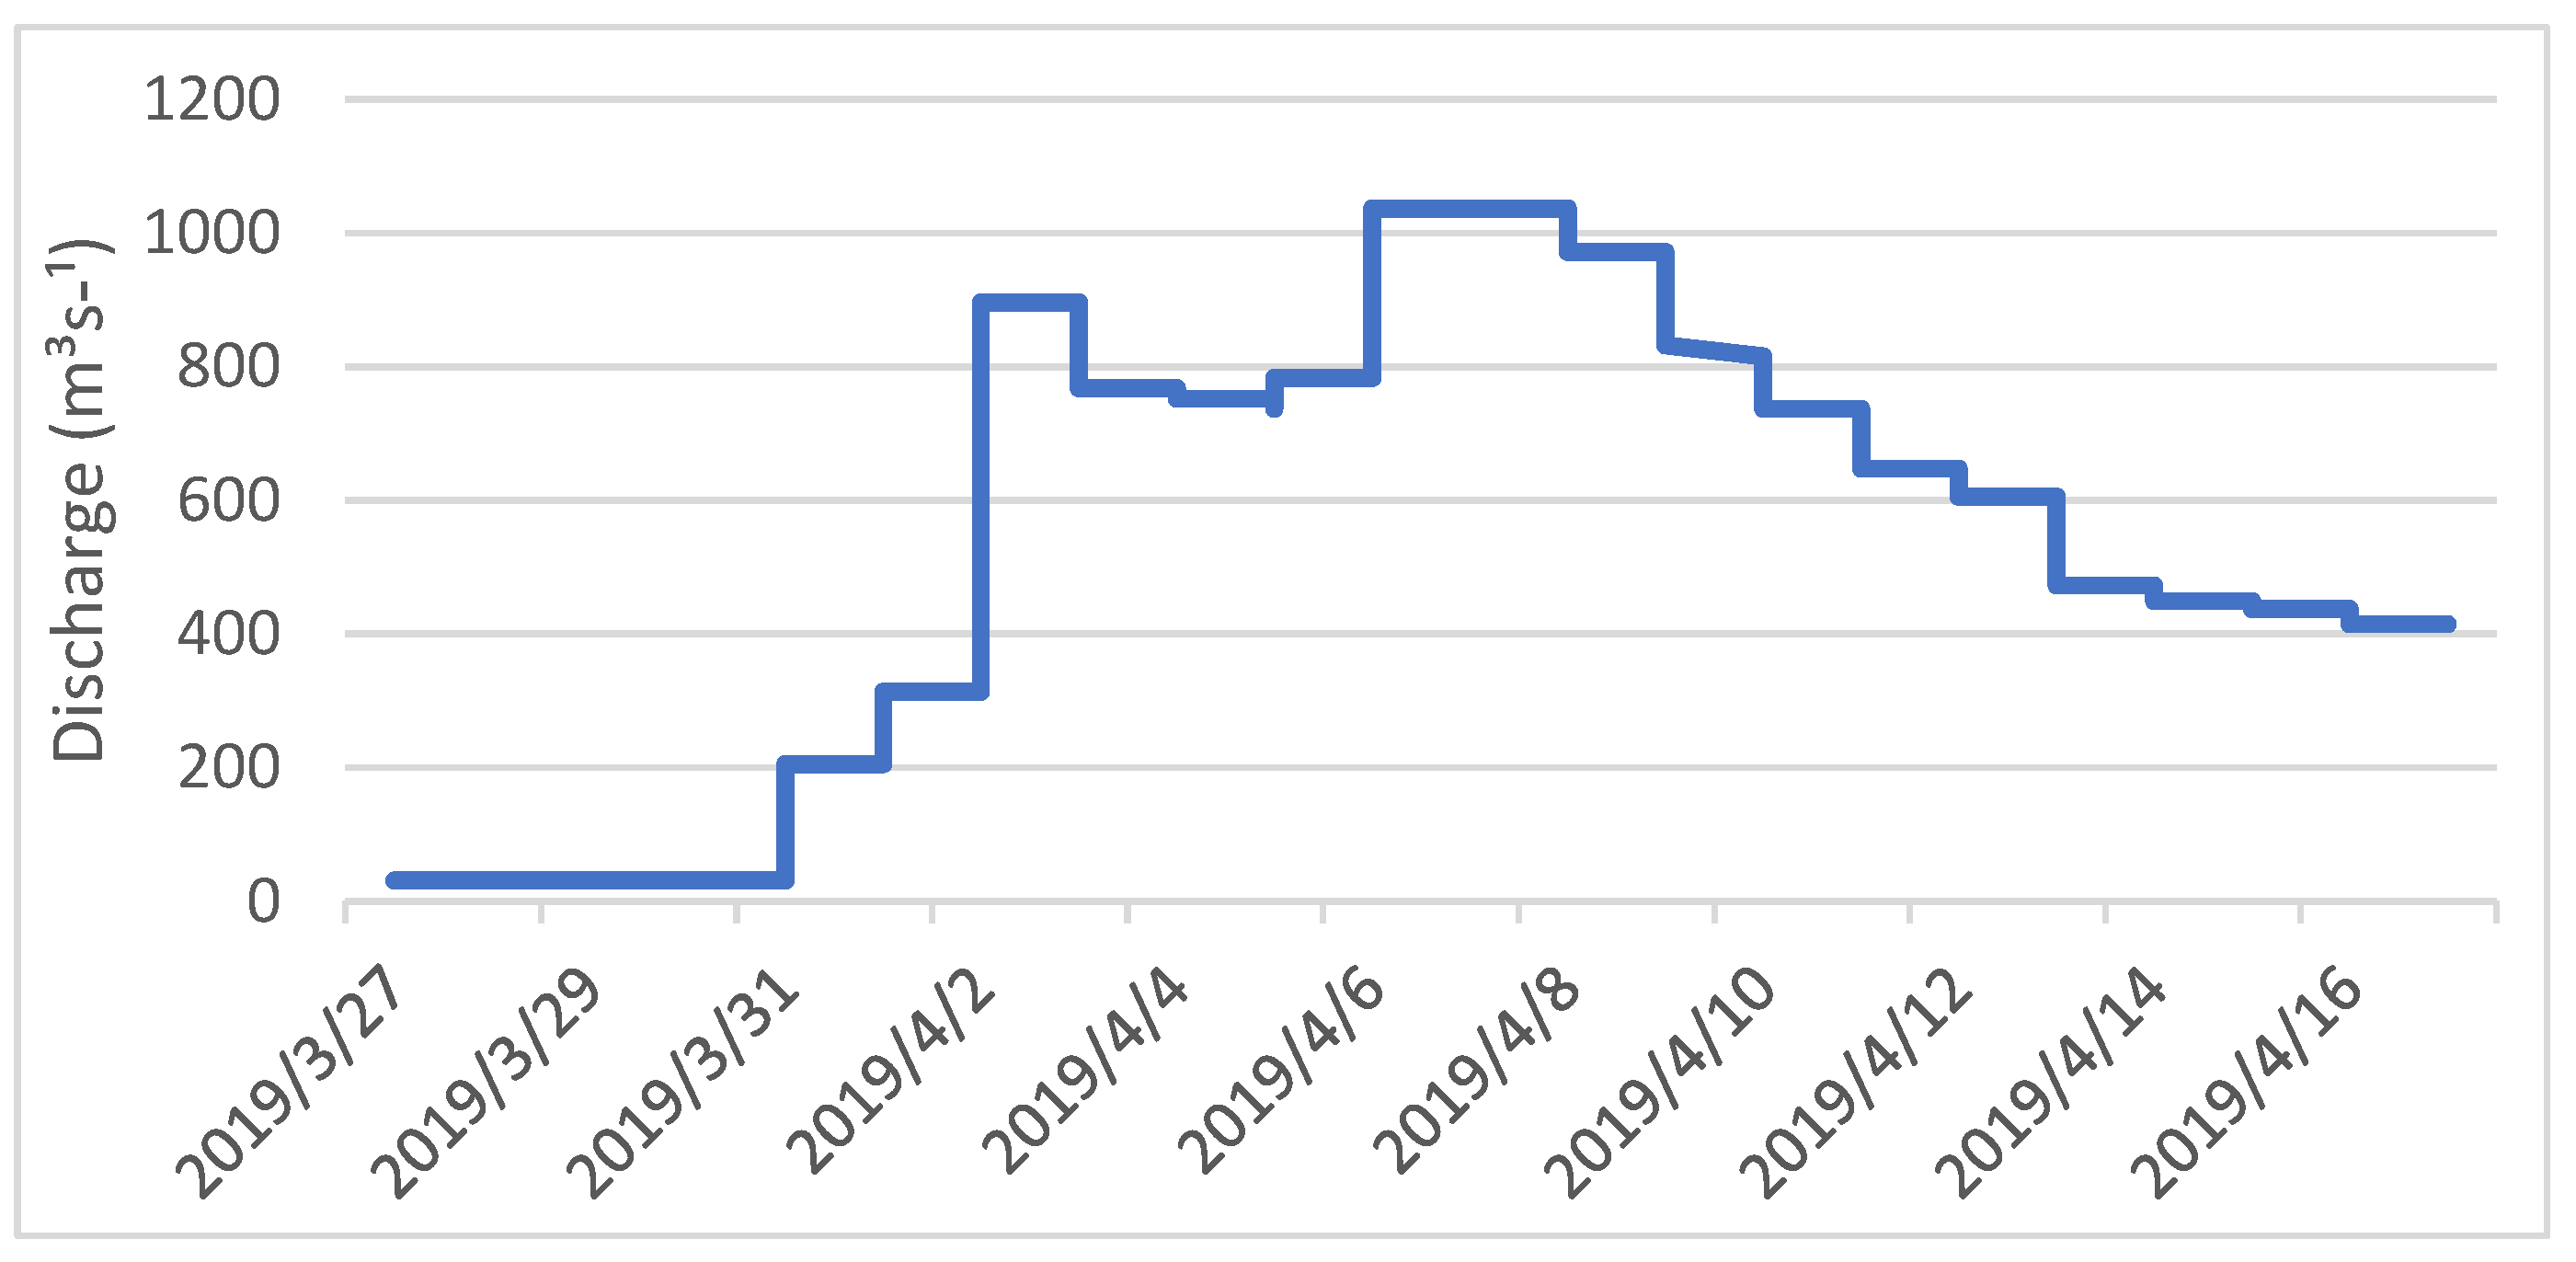
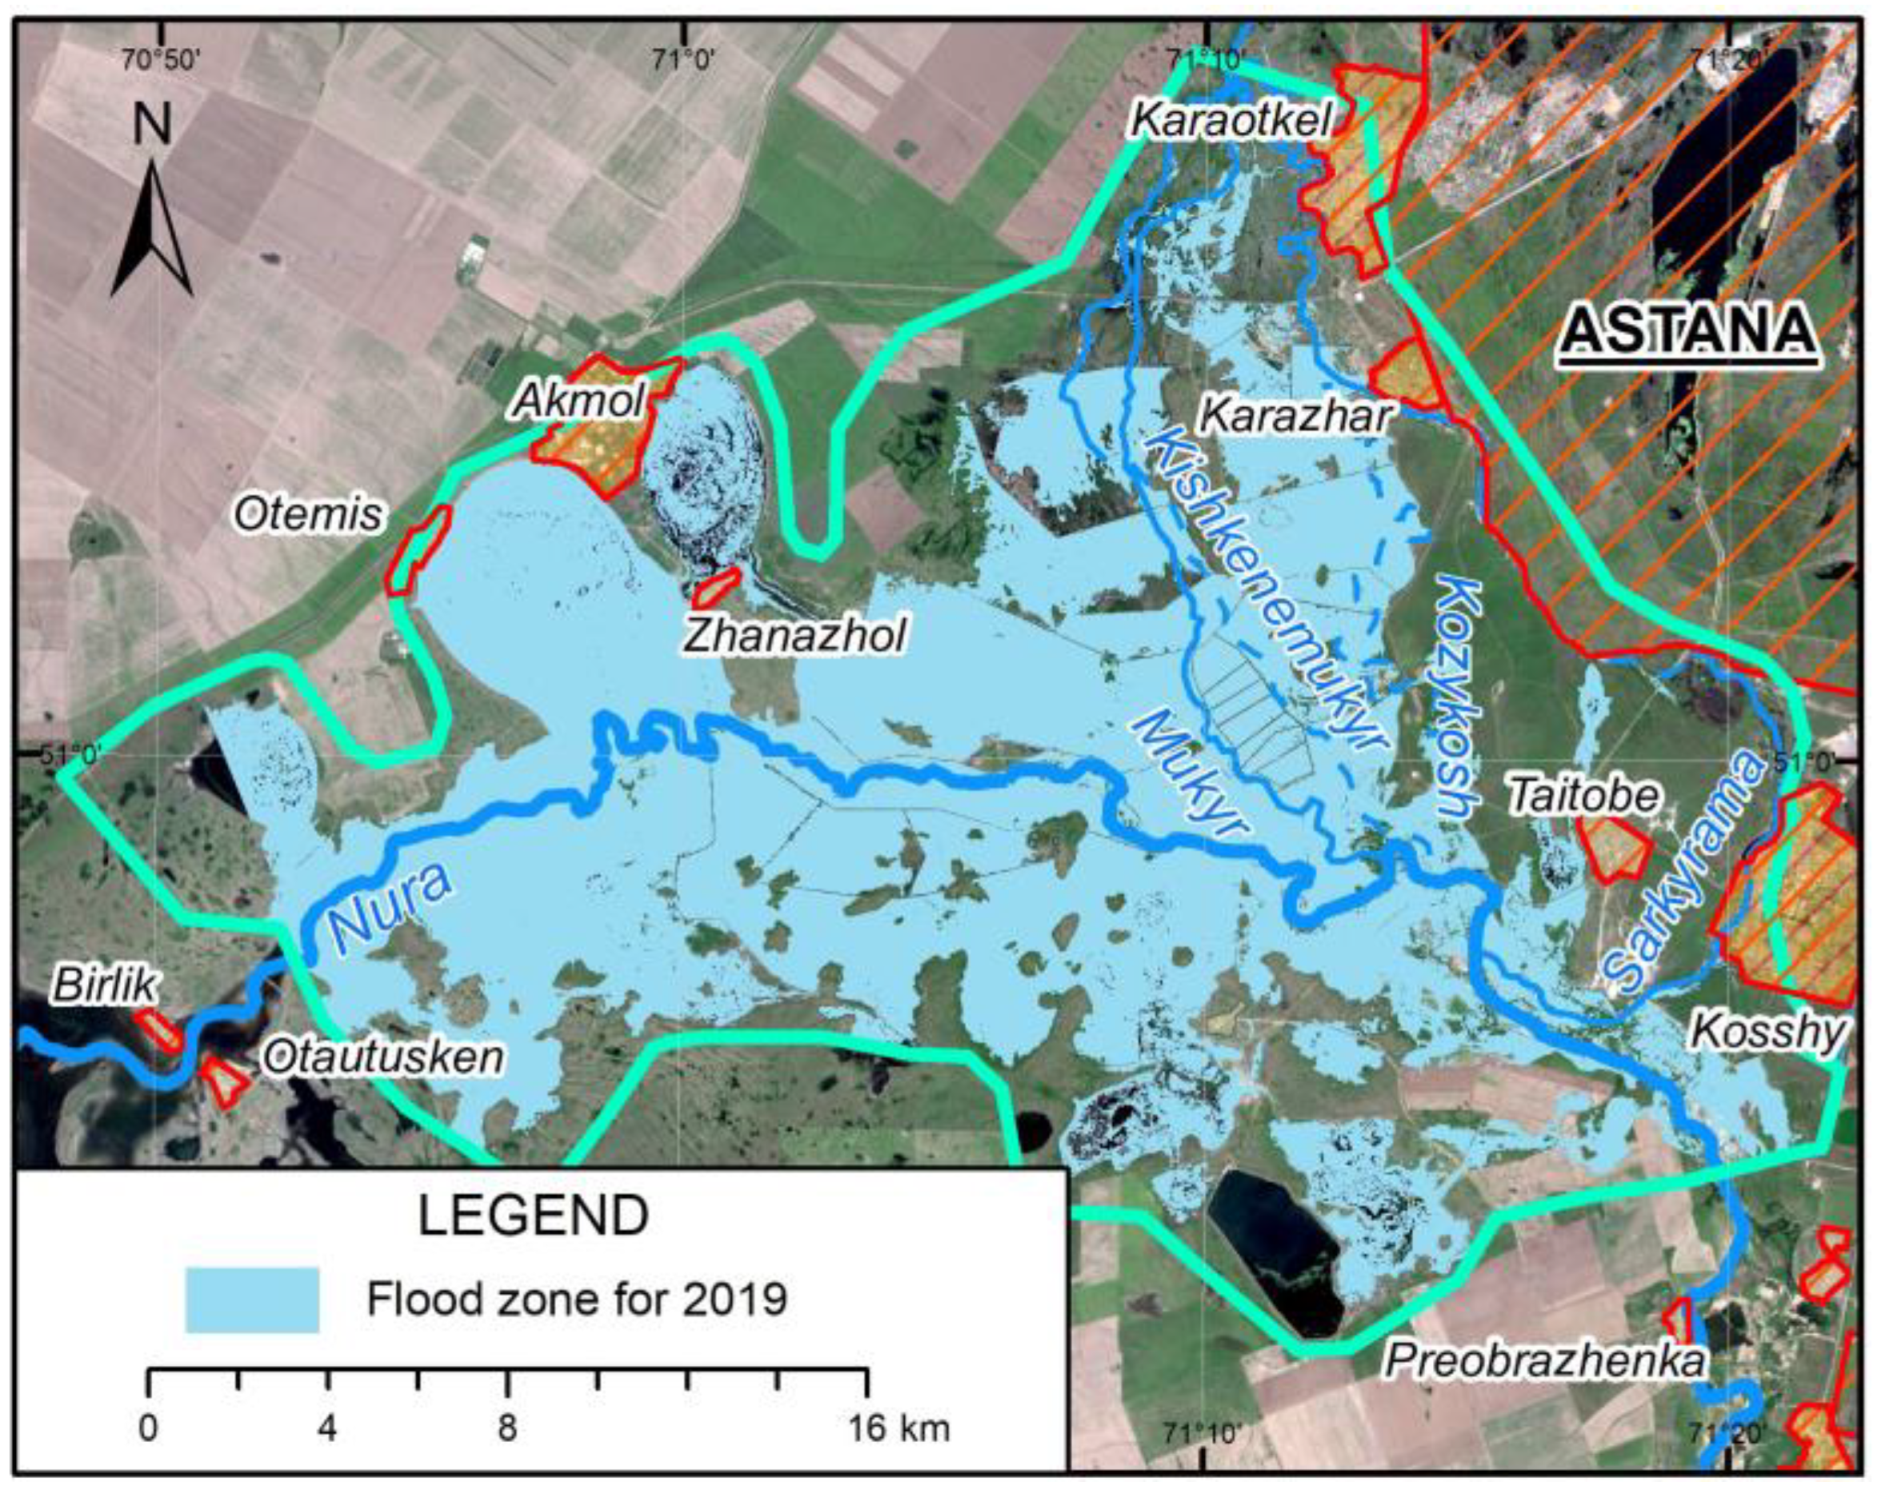
66]. In order to understand the reason for such an outcome, it is necessary to understand the flooding mechanisms of this territory. As was mentioned earlier, the main reason for floods in this area is spring snowmelt, when the snowpack formed during the cold season begins melting due to air temperature warming. The flood of 2019 along the Nura River at the site of the Preobrazhenskiy waterwork began in the beginning of April and lasted until 17 April. The maximum release from the Preobrazhenskiy was 1036.8 m3/s, which occurred between 6 and 8 April (Figure 2). An analysis of the flood inundation areas based on PlanetScope satellite images and use of the NDWI index showed that the maximum flooding of the interfluve area occurred on April 10 (
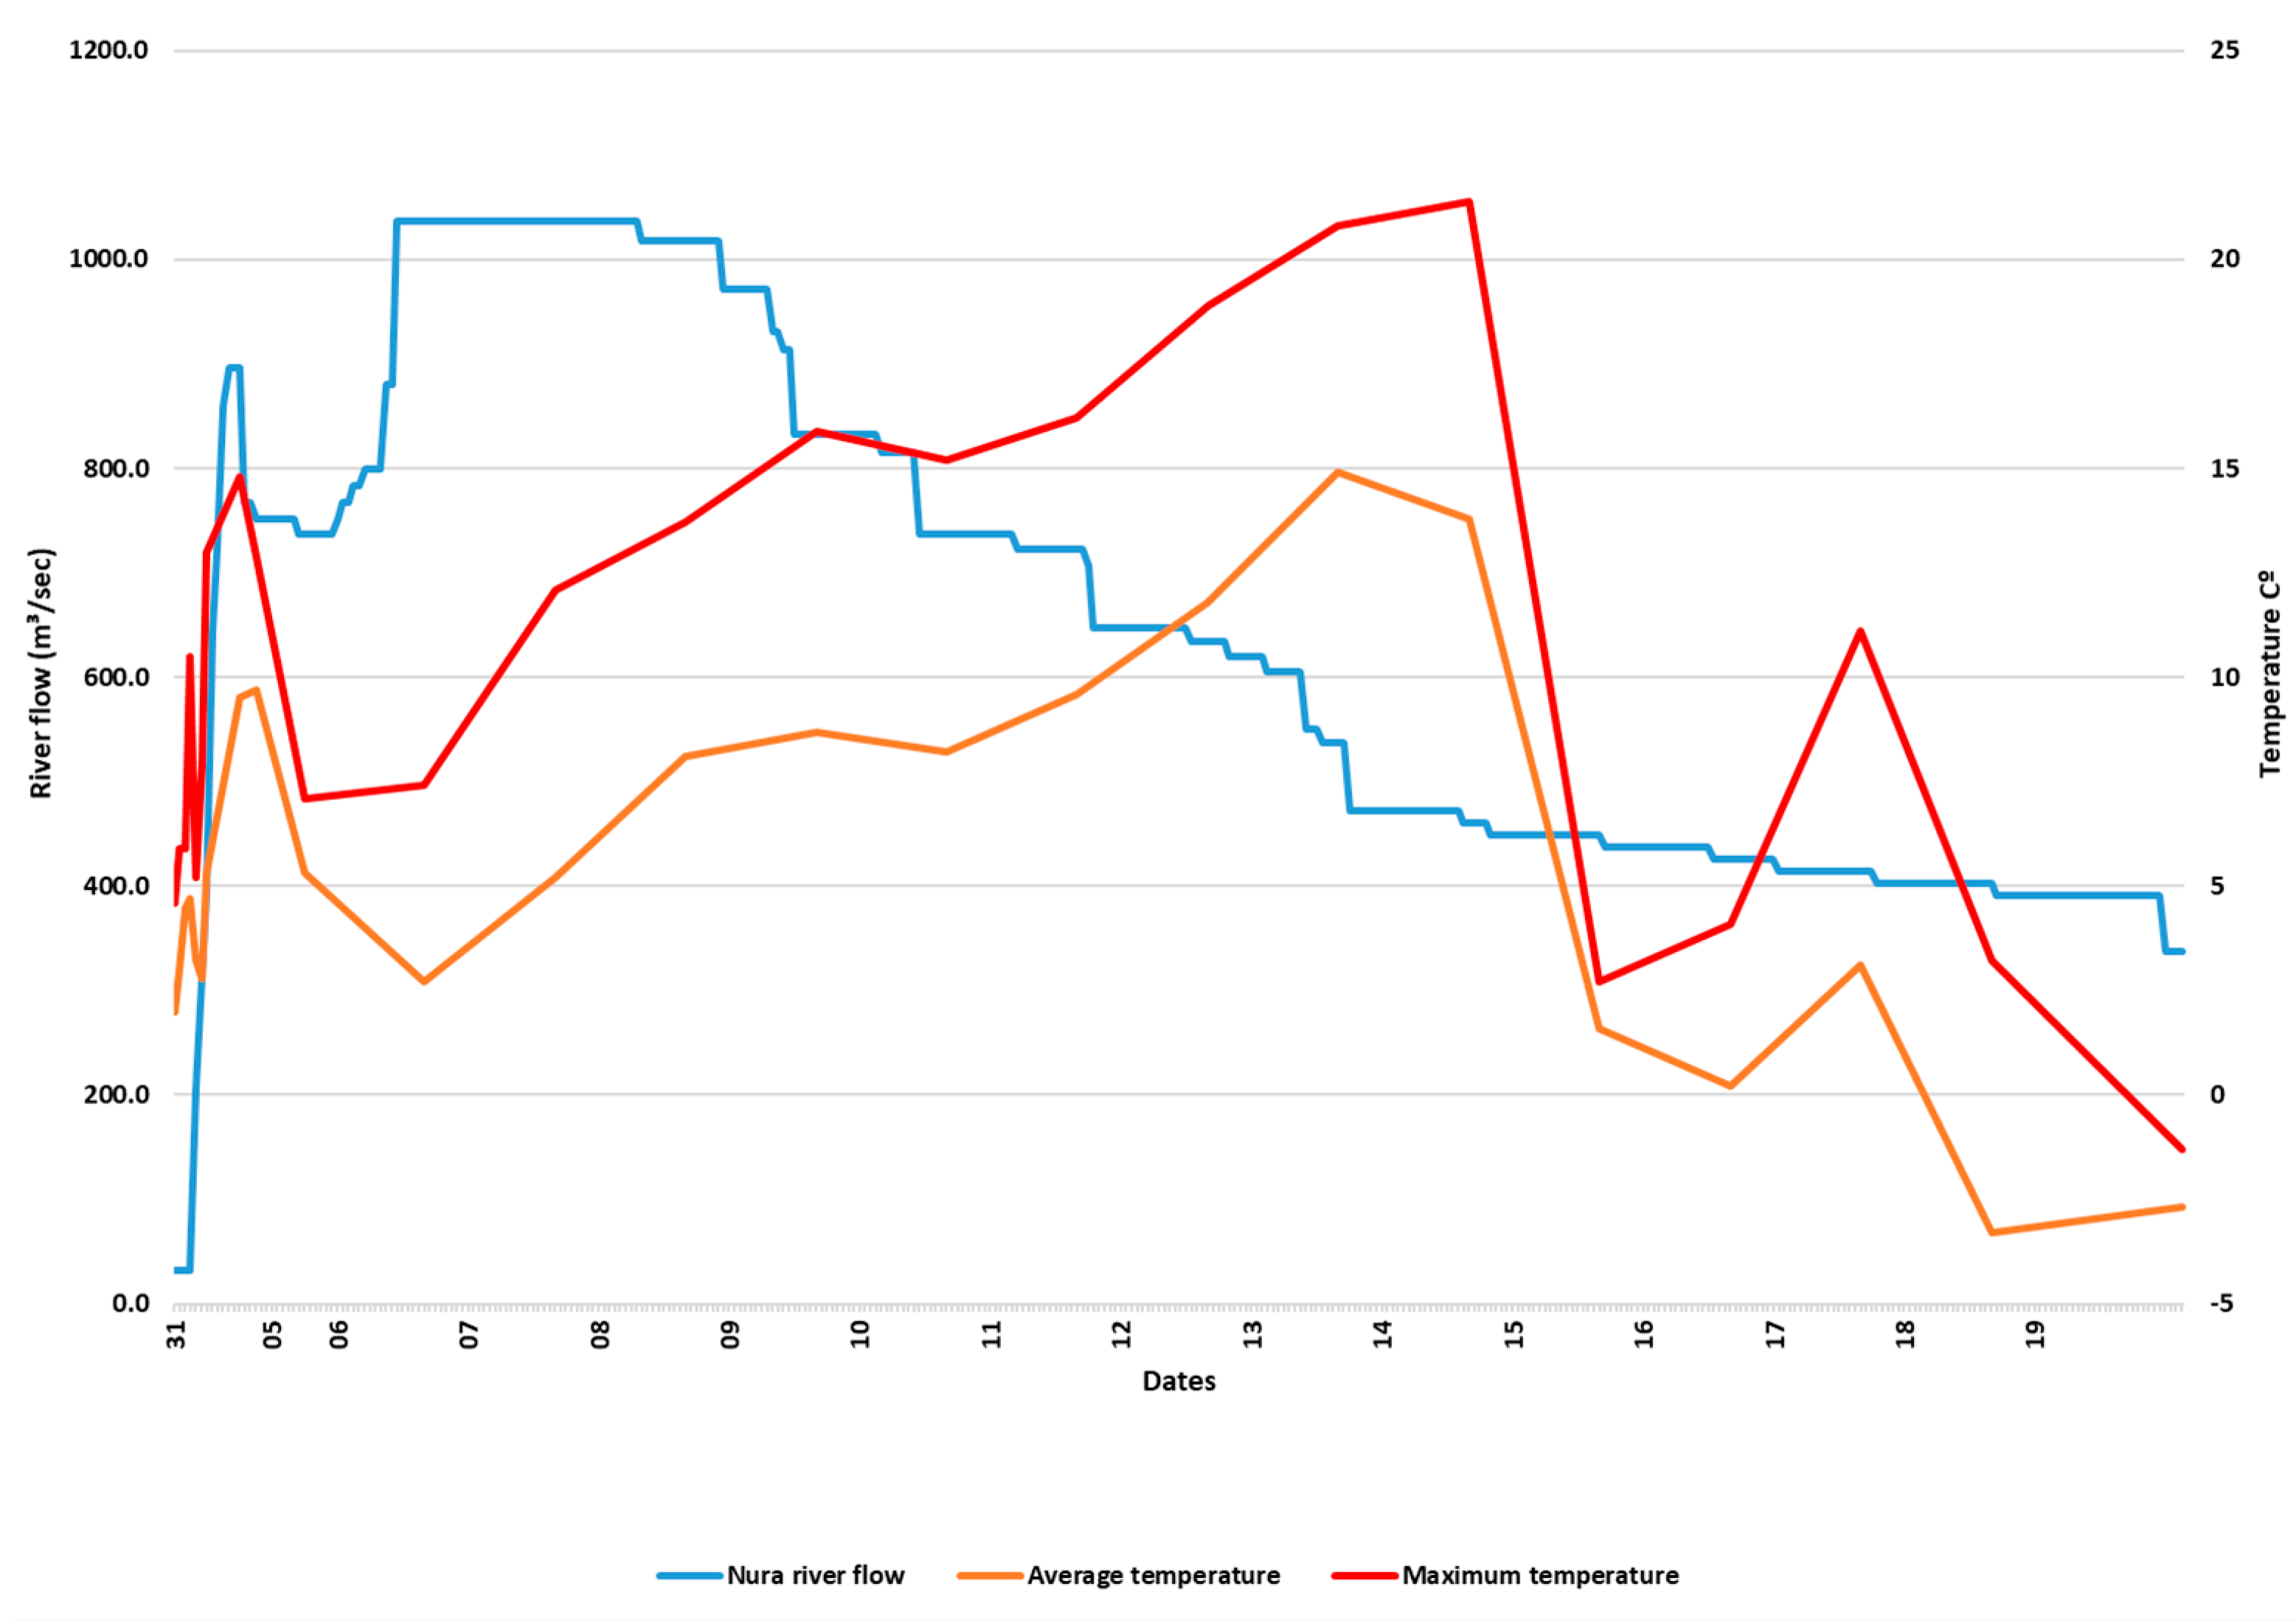
Figure 8). This delay is due to not only the speed of the flood wave reaching the territory of the interfluve but also because mass snow melting began due to a sharp increase in air temperature. Positive temperatures in the study area began on 23 March (Figure 16), but a sharp increase in temperature occurred on 5–6 April, which was reflected in the maximum release of the flood wave on 6–8 April [67]. The final melting of the snow occurred during the second sharp rise in air temperature to 15 °C from 9 to 12 April, which is associated with the maximum inundation of the interfluve area.
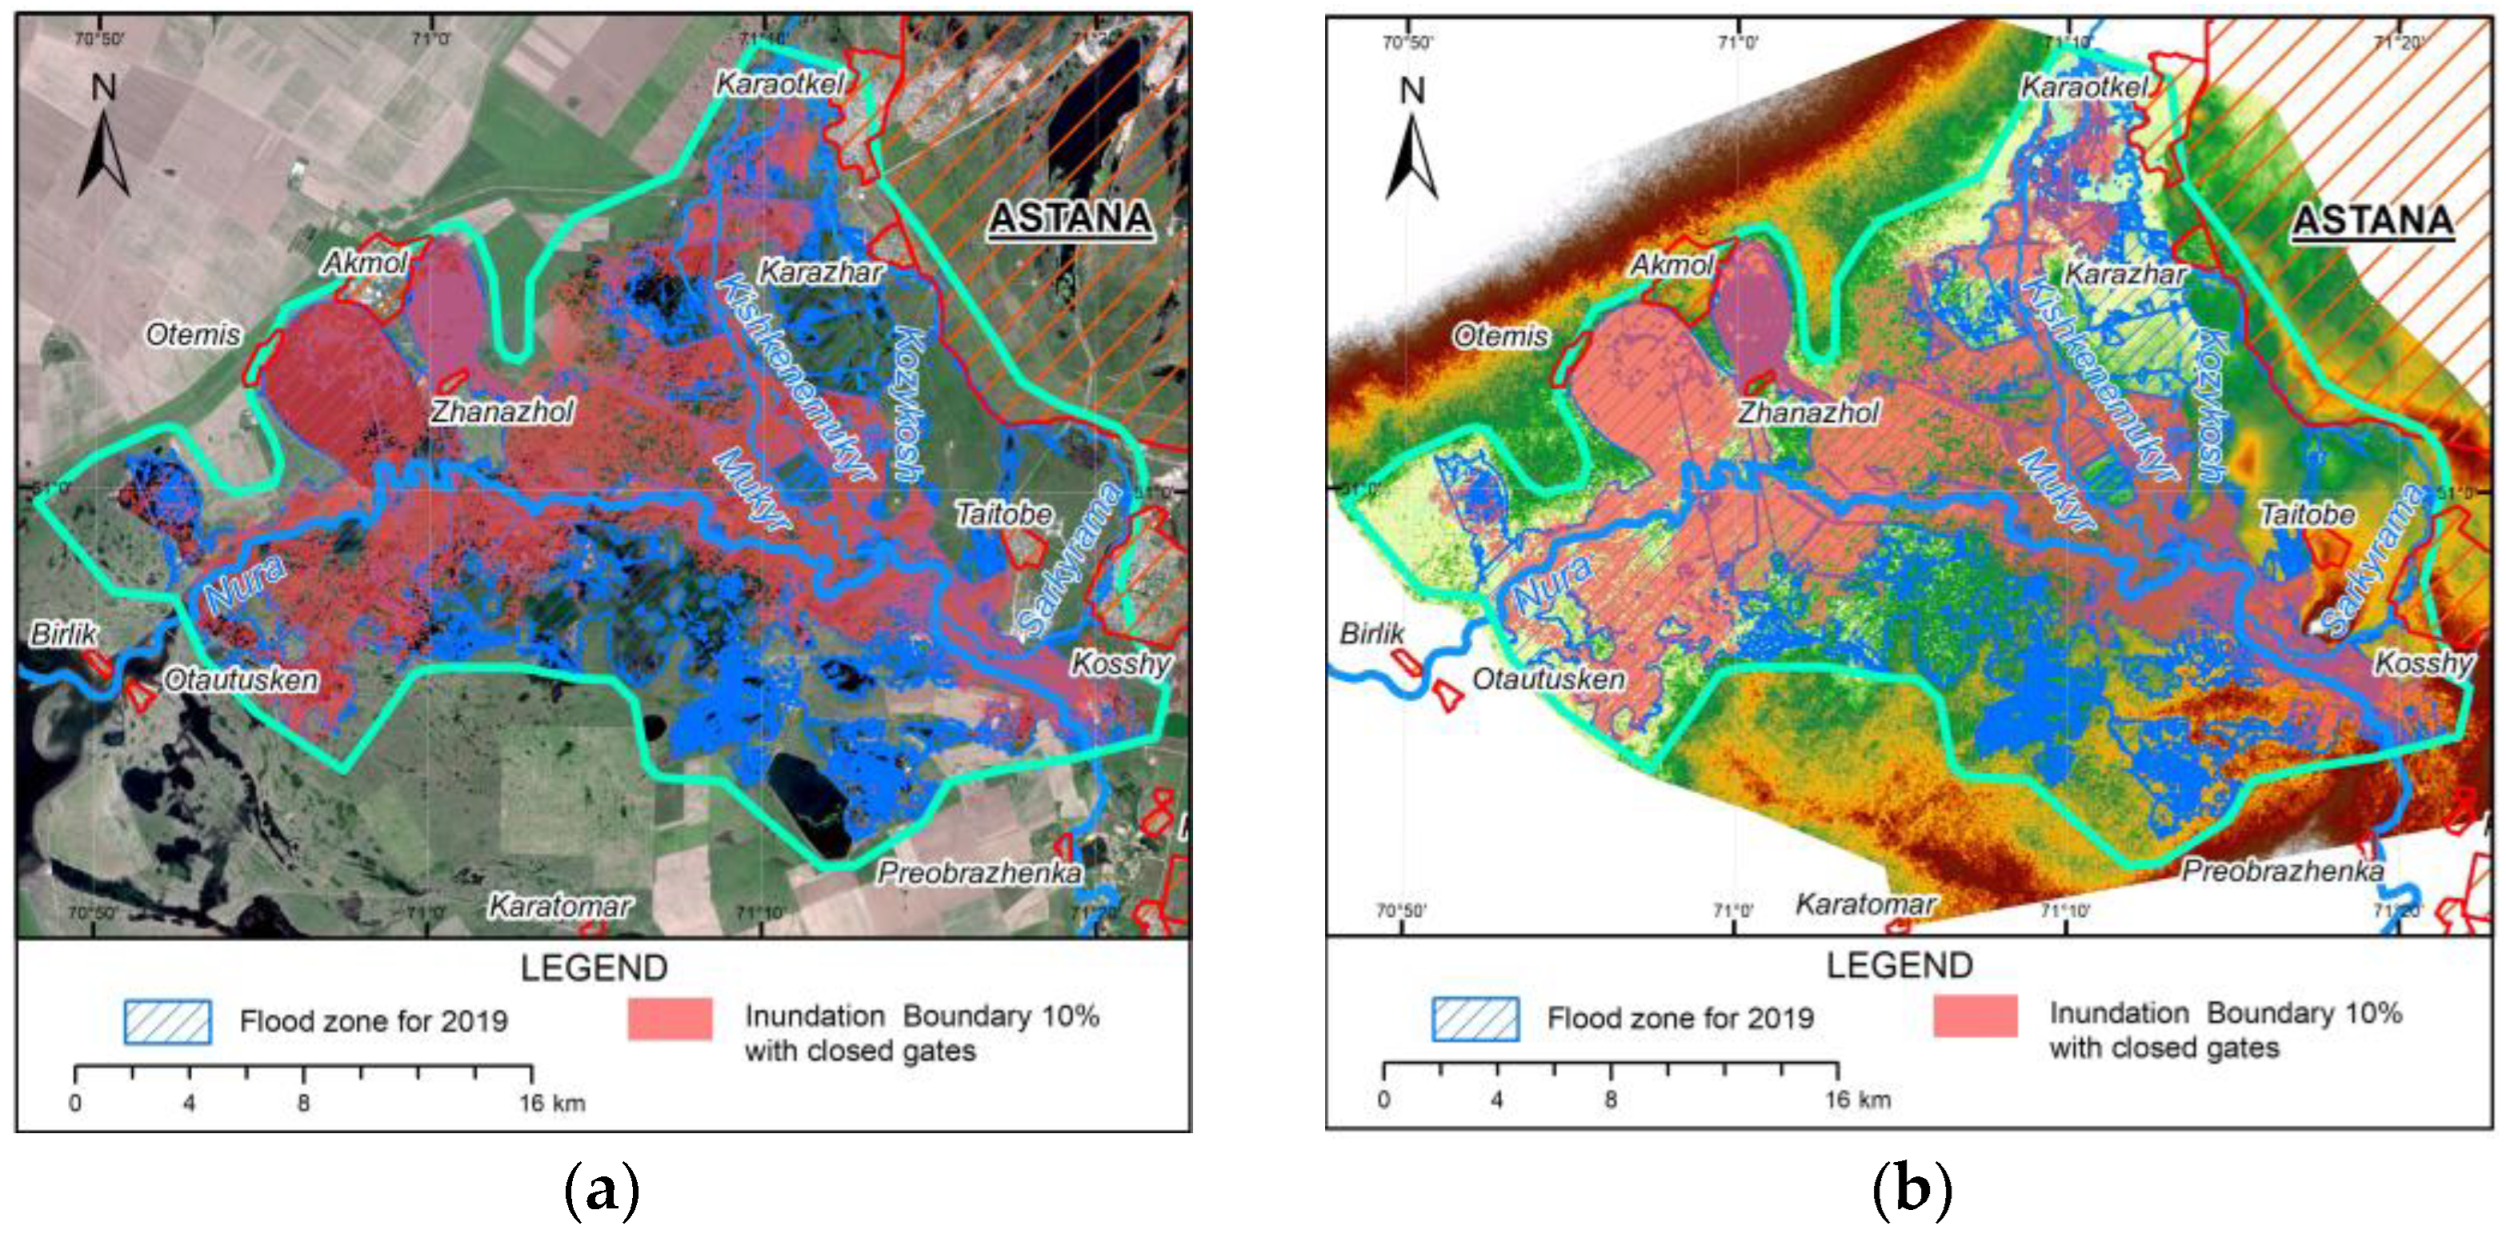
Therefore, the maximum flood inundation area, which was used for calibration, was influenced by water release and additional snowmelt in the study domain, resulting in low similarity of the simulated flooded land. In order to check the model performance without the influence of local snowmelt, the areas where water release from the Preobrazhenskiy cannot reach were removed from the digitized satellite image. These locations mainly consisted of areas downstream the dams on the left bank of Nura River and areas that are topographically located in a higher elevation. Such territories will not have been flooded in the case of such water release from Preobrazhenskiy waterwork. Comparison of modelled inundation area with this remote sensing image resulted in model similarity of 70%, which is a good approximation and indicates that, without the influence of local snowmelt, the model provides acceptable results. The results of the current work contribute to the overall studies related to hydrodynamic modelling of valley rivers in Kazakhstan. Due to hydrologic characteristics (large contribution of snowmelt), topographic conditions, limitations on data availability and other factors, hydraulic modelling studies in Kazakhstan and central Asia in general are uncommon. Previous work by Ongdas et al. [60] identified flood hazard maps, whereas the current study integrated control of hydraulic structure gates into flood hazard evaluation. Even though there is 70% similarity between the simulated flooded area and the flooded area according to the remote sensing image, it is necessary to point out the limitations of the current study, which have affected the model performance:
  • The volume of flood waters during the simulation period for April 2019 amounted to 807.6 million m3, while the accommodating capacity of Alva irrigation system in accordance with the technical passport was 201.6 million m3. Even though the flood volume is significantly higher than the capacity of the irrigation system, the study focused on assessment of the system’s capacity to influence the inundation area.
  • As DEM refinement was performed only on floodplains close to the river, anthropogenic infrastructure (such as highways) not close to the river was not included. According to Papaioannou et al. [68], uncertainties related to input data are one of the main sources of uncertainty related to flood inundation modelling; especially, DEM accuracy and roughness coefficients are the key ones. Alipour et al. [37] argue that, in order to model flood peaks reliably, modelers need to spend resources calibrating the floodplain roughness coefficients using fine DEM and grid resolution. As a result of such refinement of DEM, high grounds that are not close to rivers, which can act as barriers, were not included in the final DEM.
  • Inability to include snowmelt in the model is another limitation of the current modeling study. Snowmelt water is the main cause of high flow in this region in spring. The proposed model did not consider available snow cover and runoff due to snowmelt in the study area. The only input to the model was release from the Preobrazhenskiy waterwork, although it was possible to determine the areas that could not be flooded by this release using the DEM and to remove such areas before estimation of model performance.
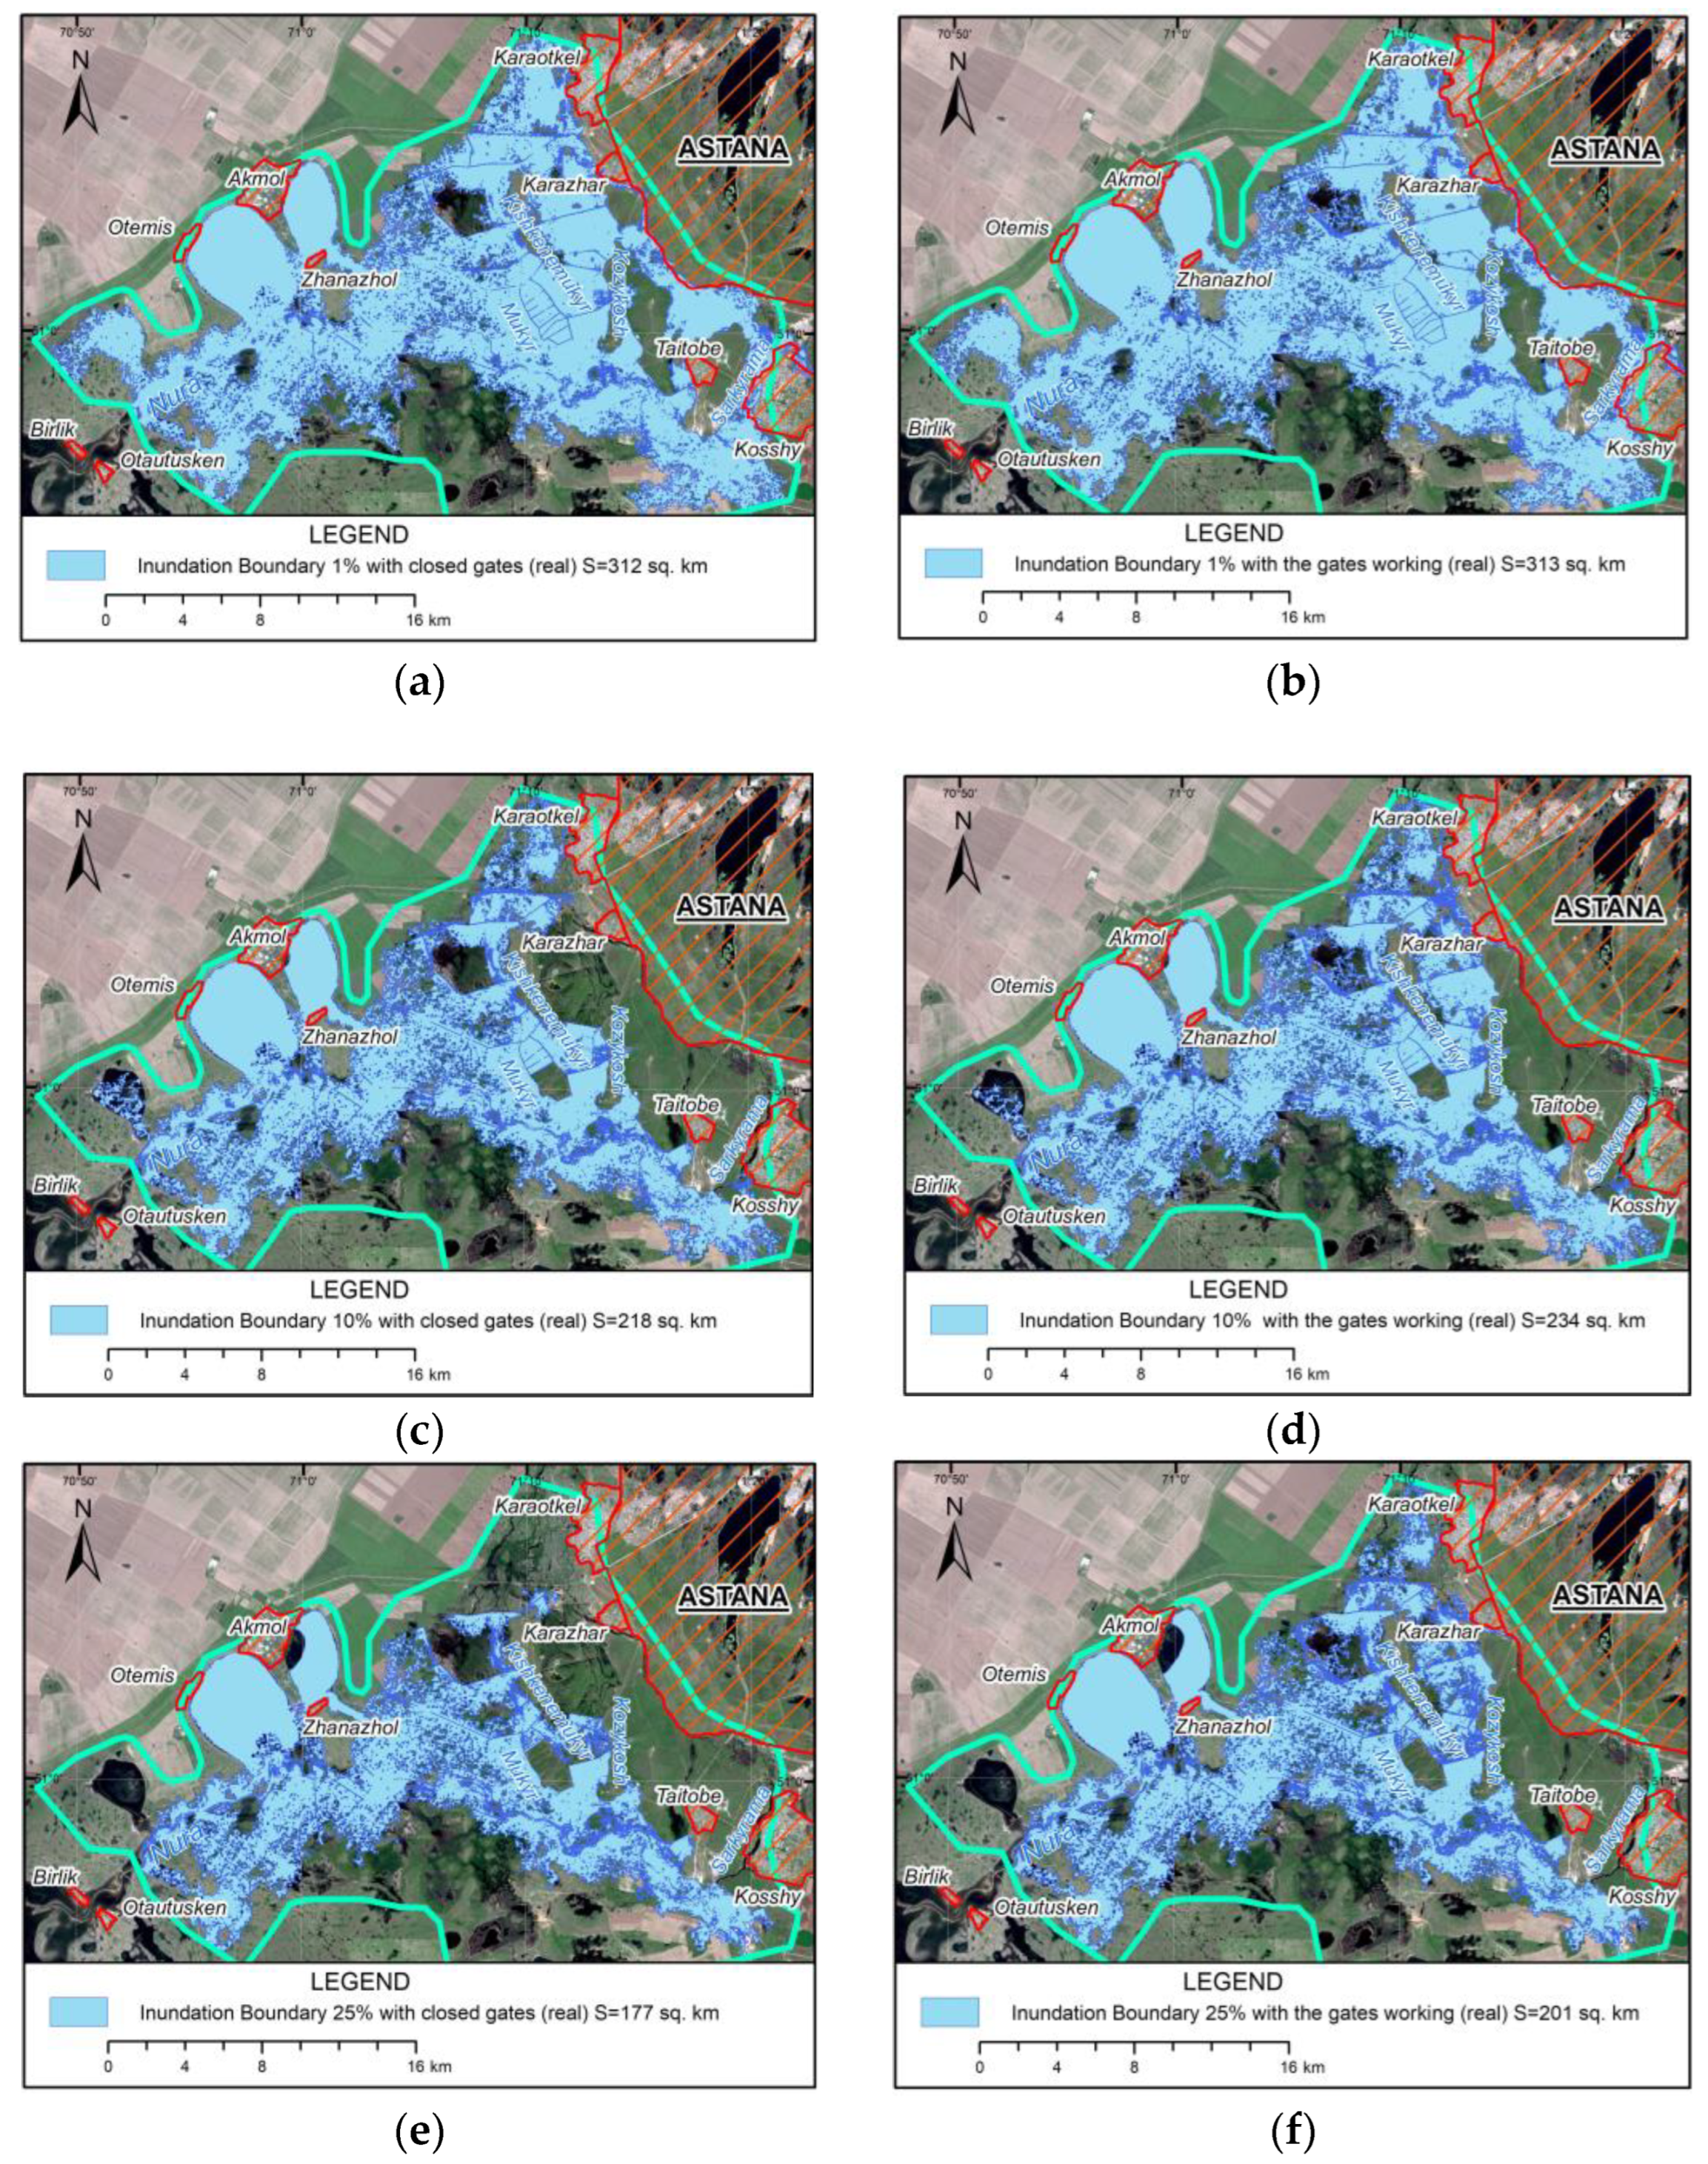
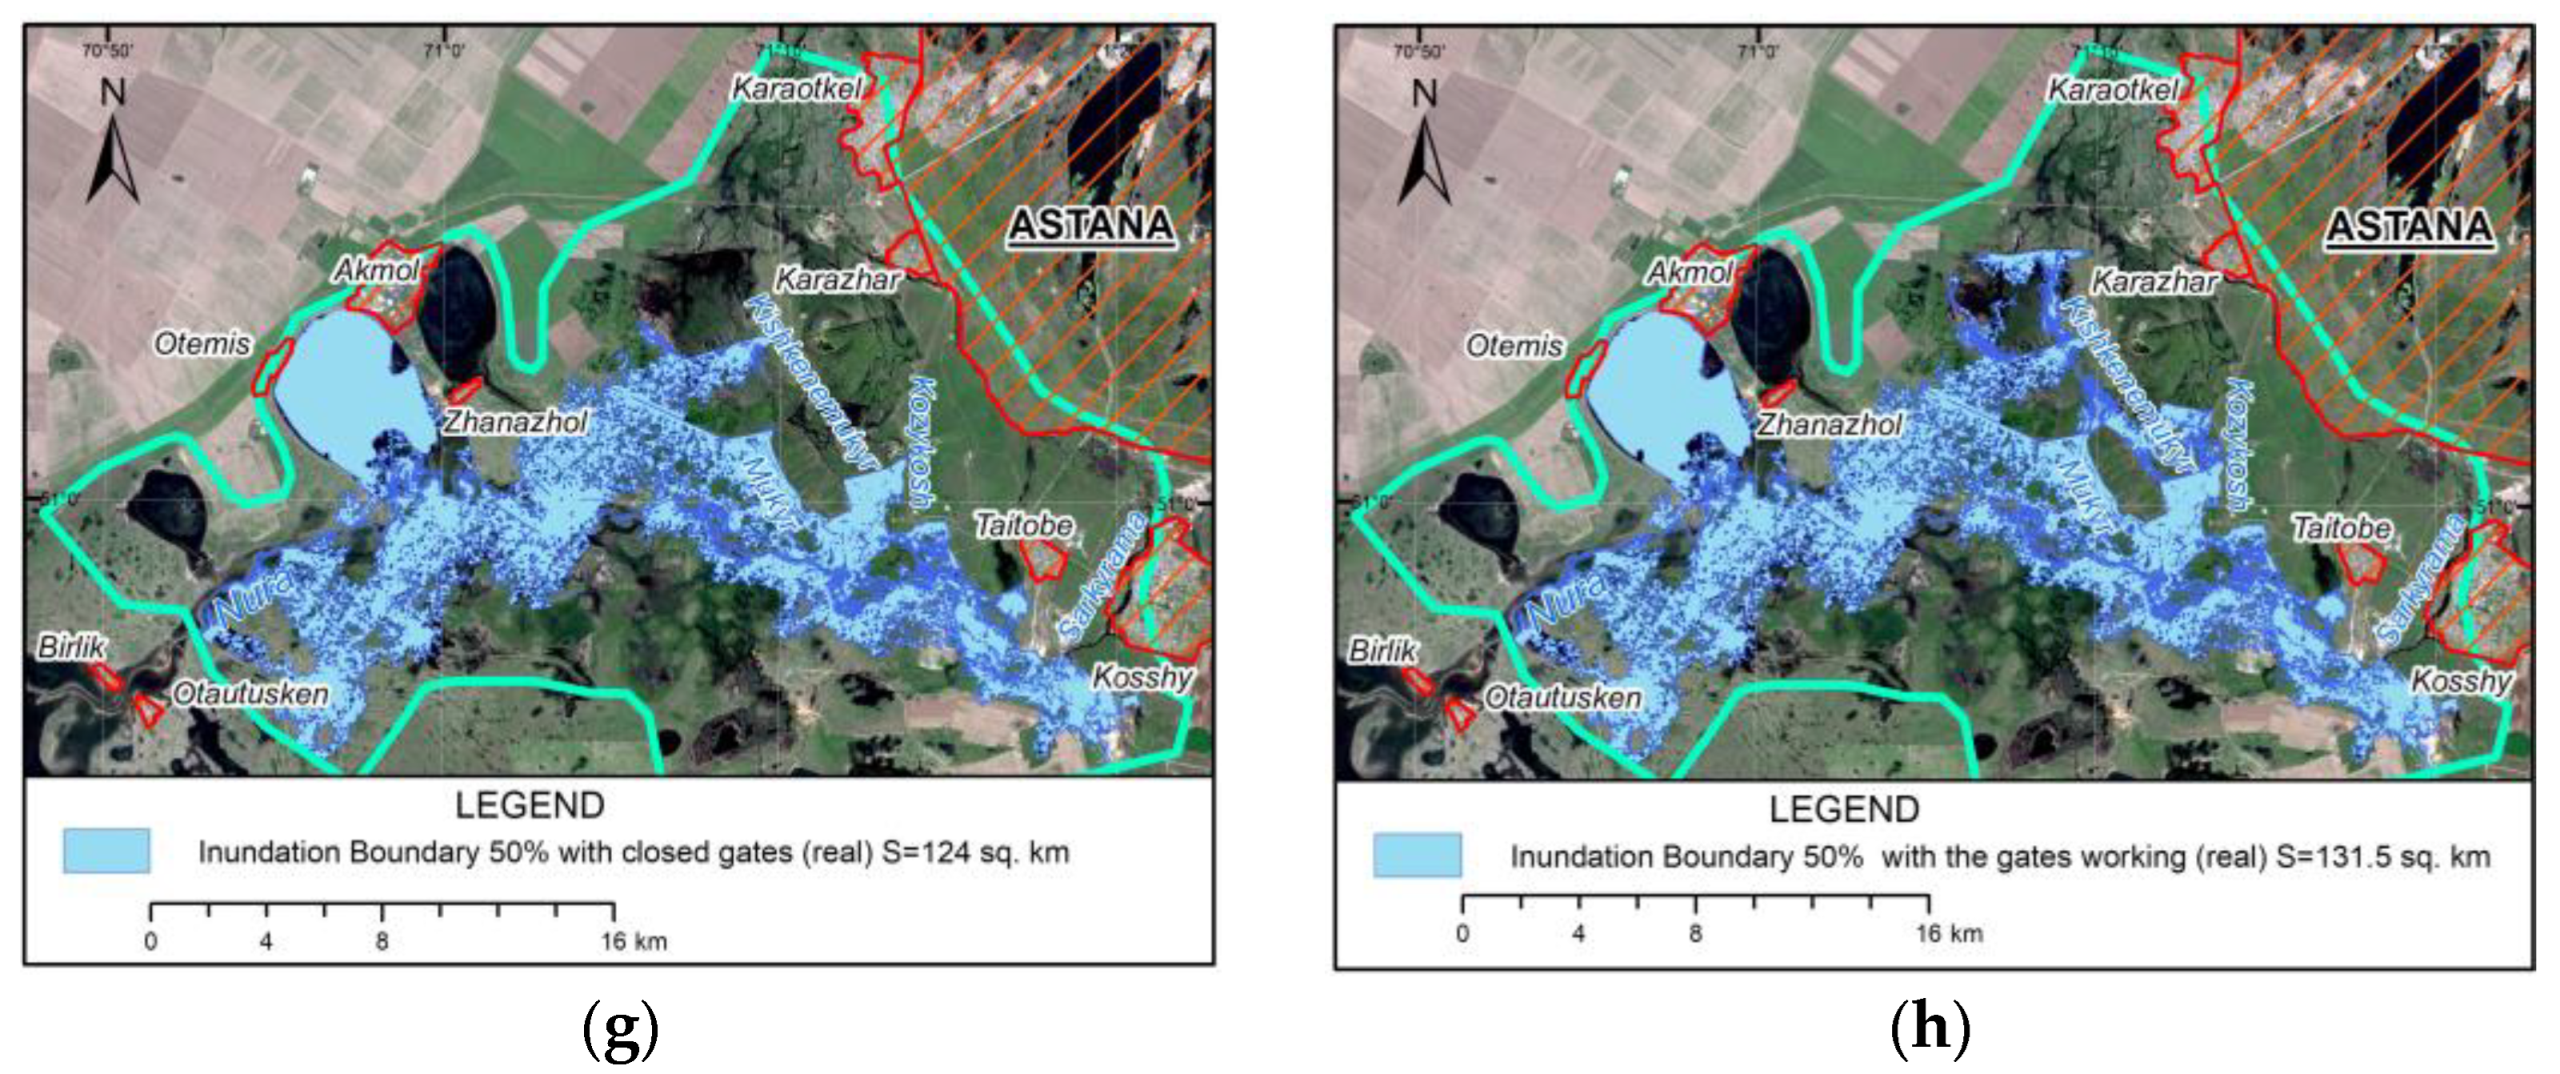
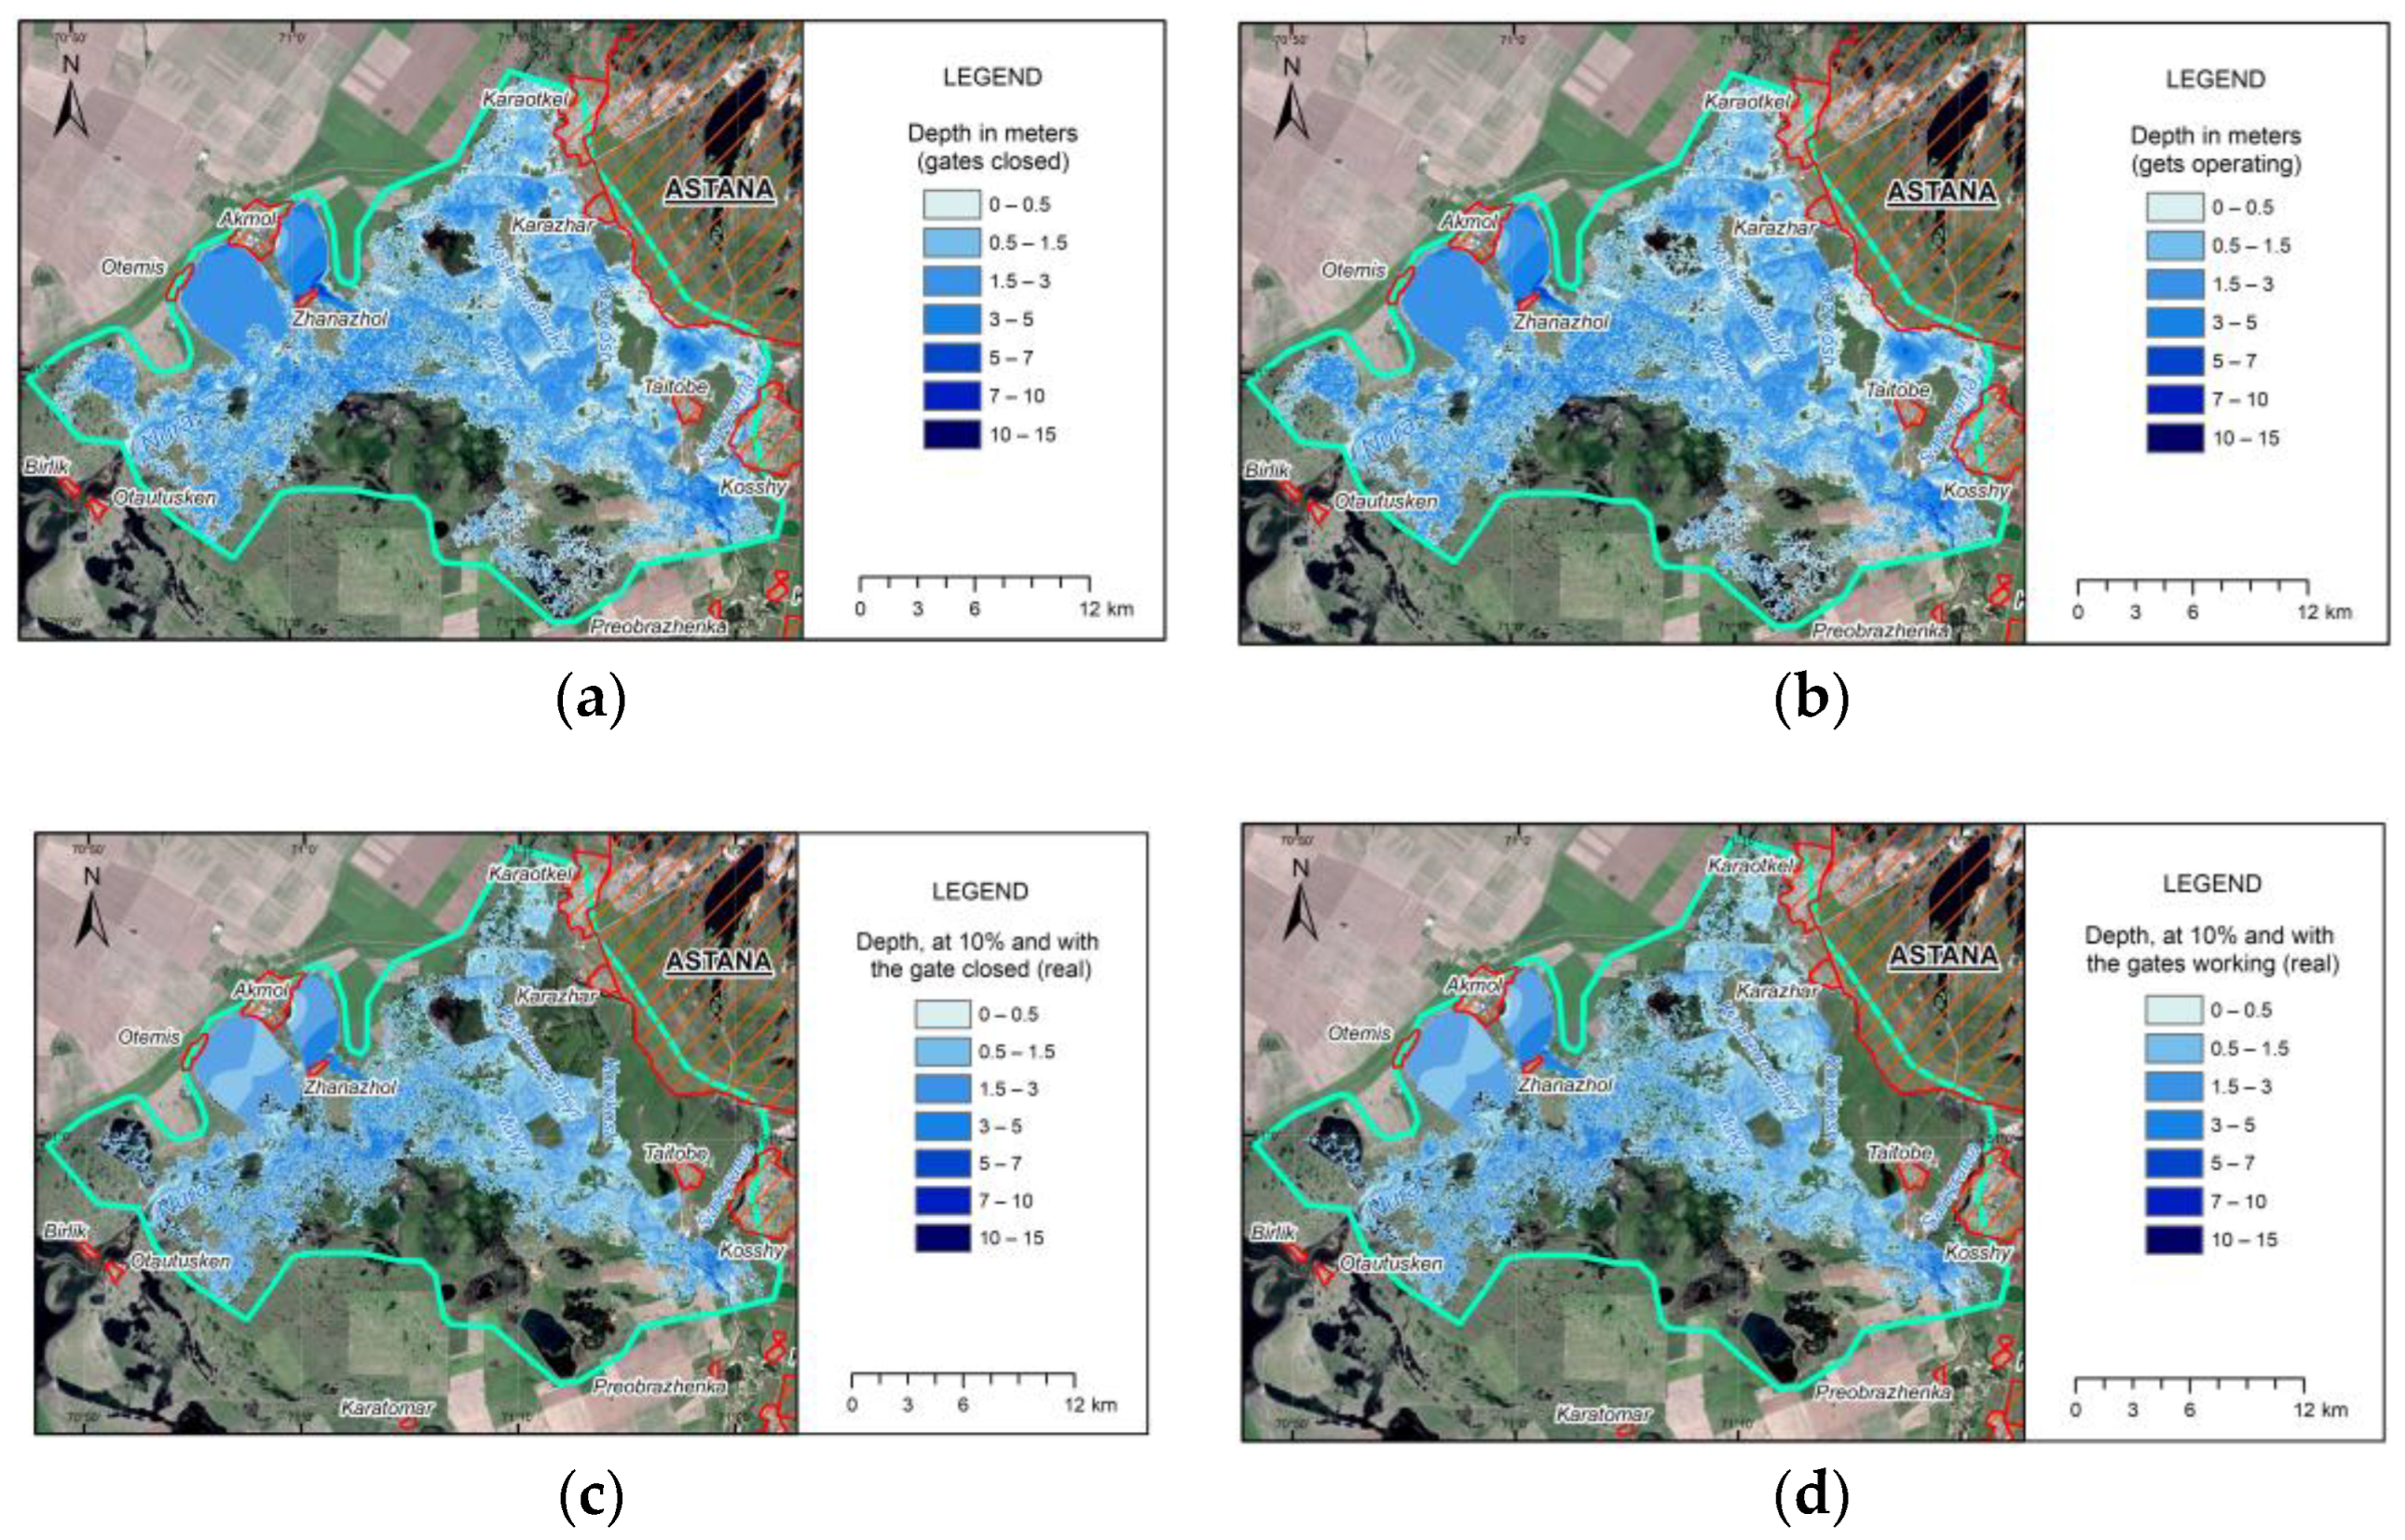
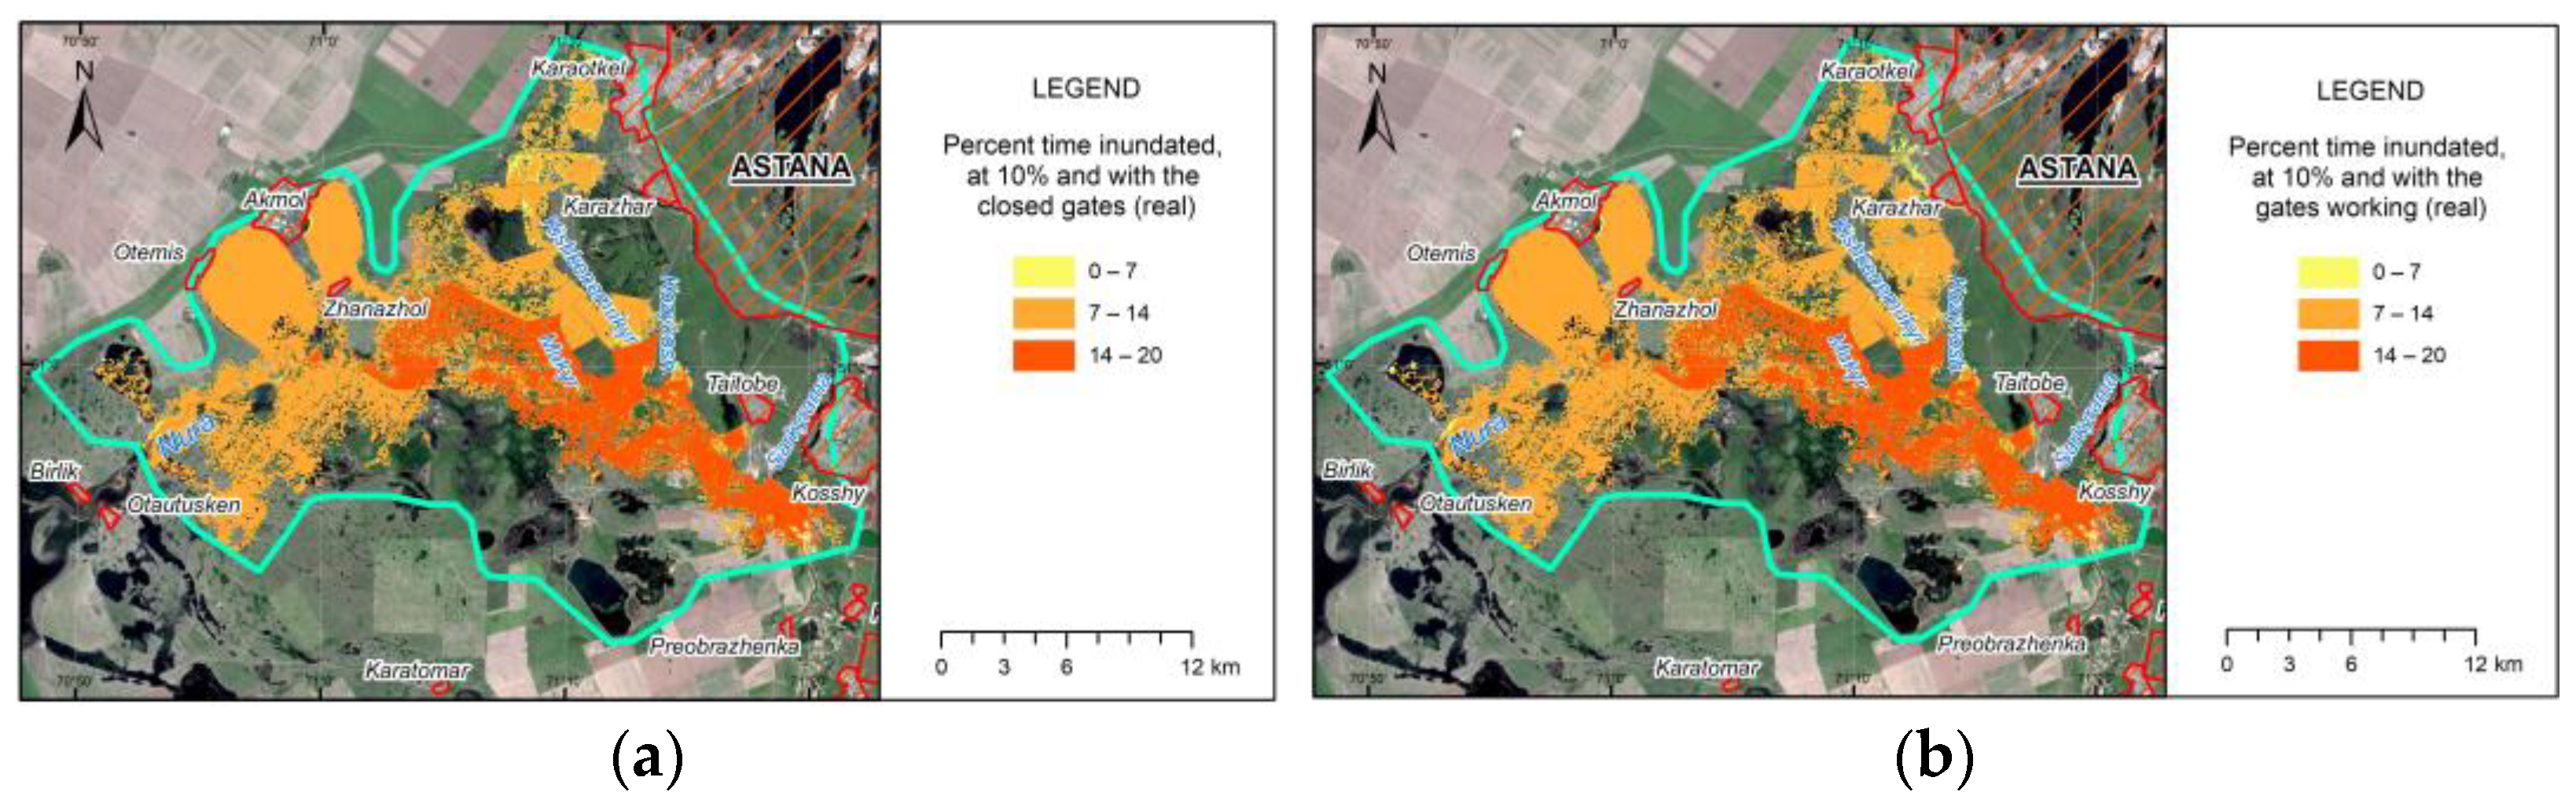
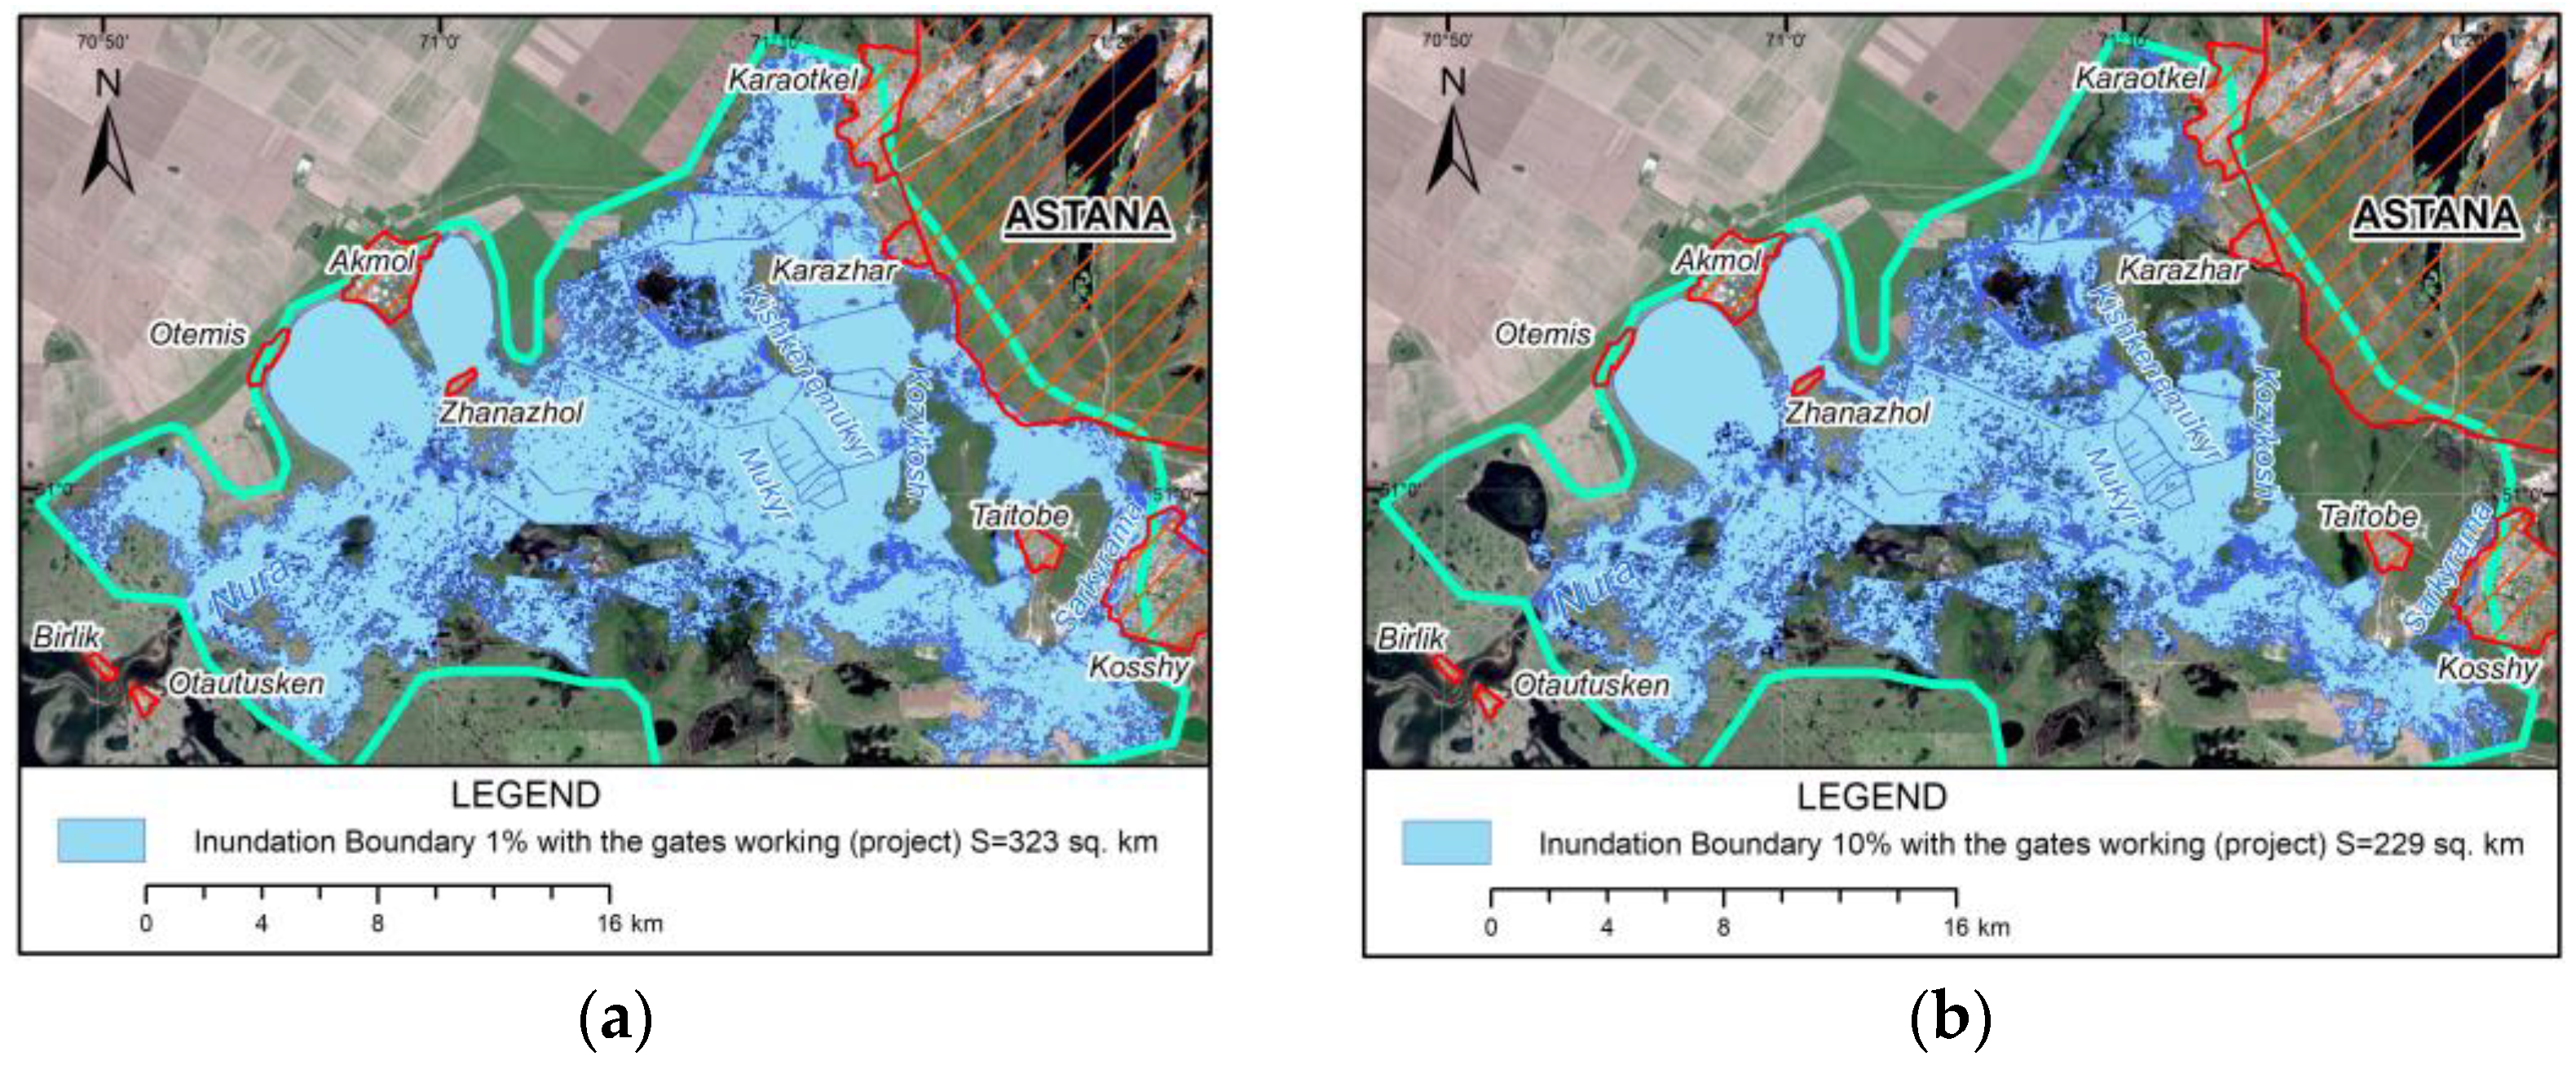
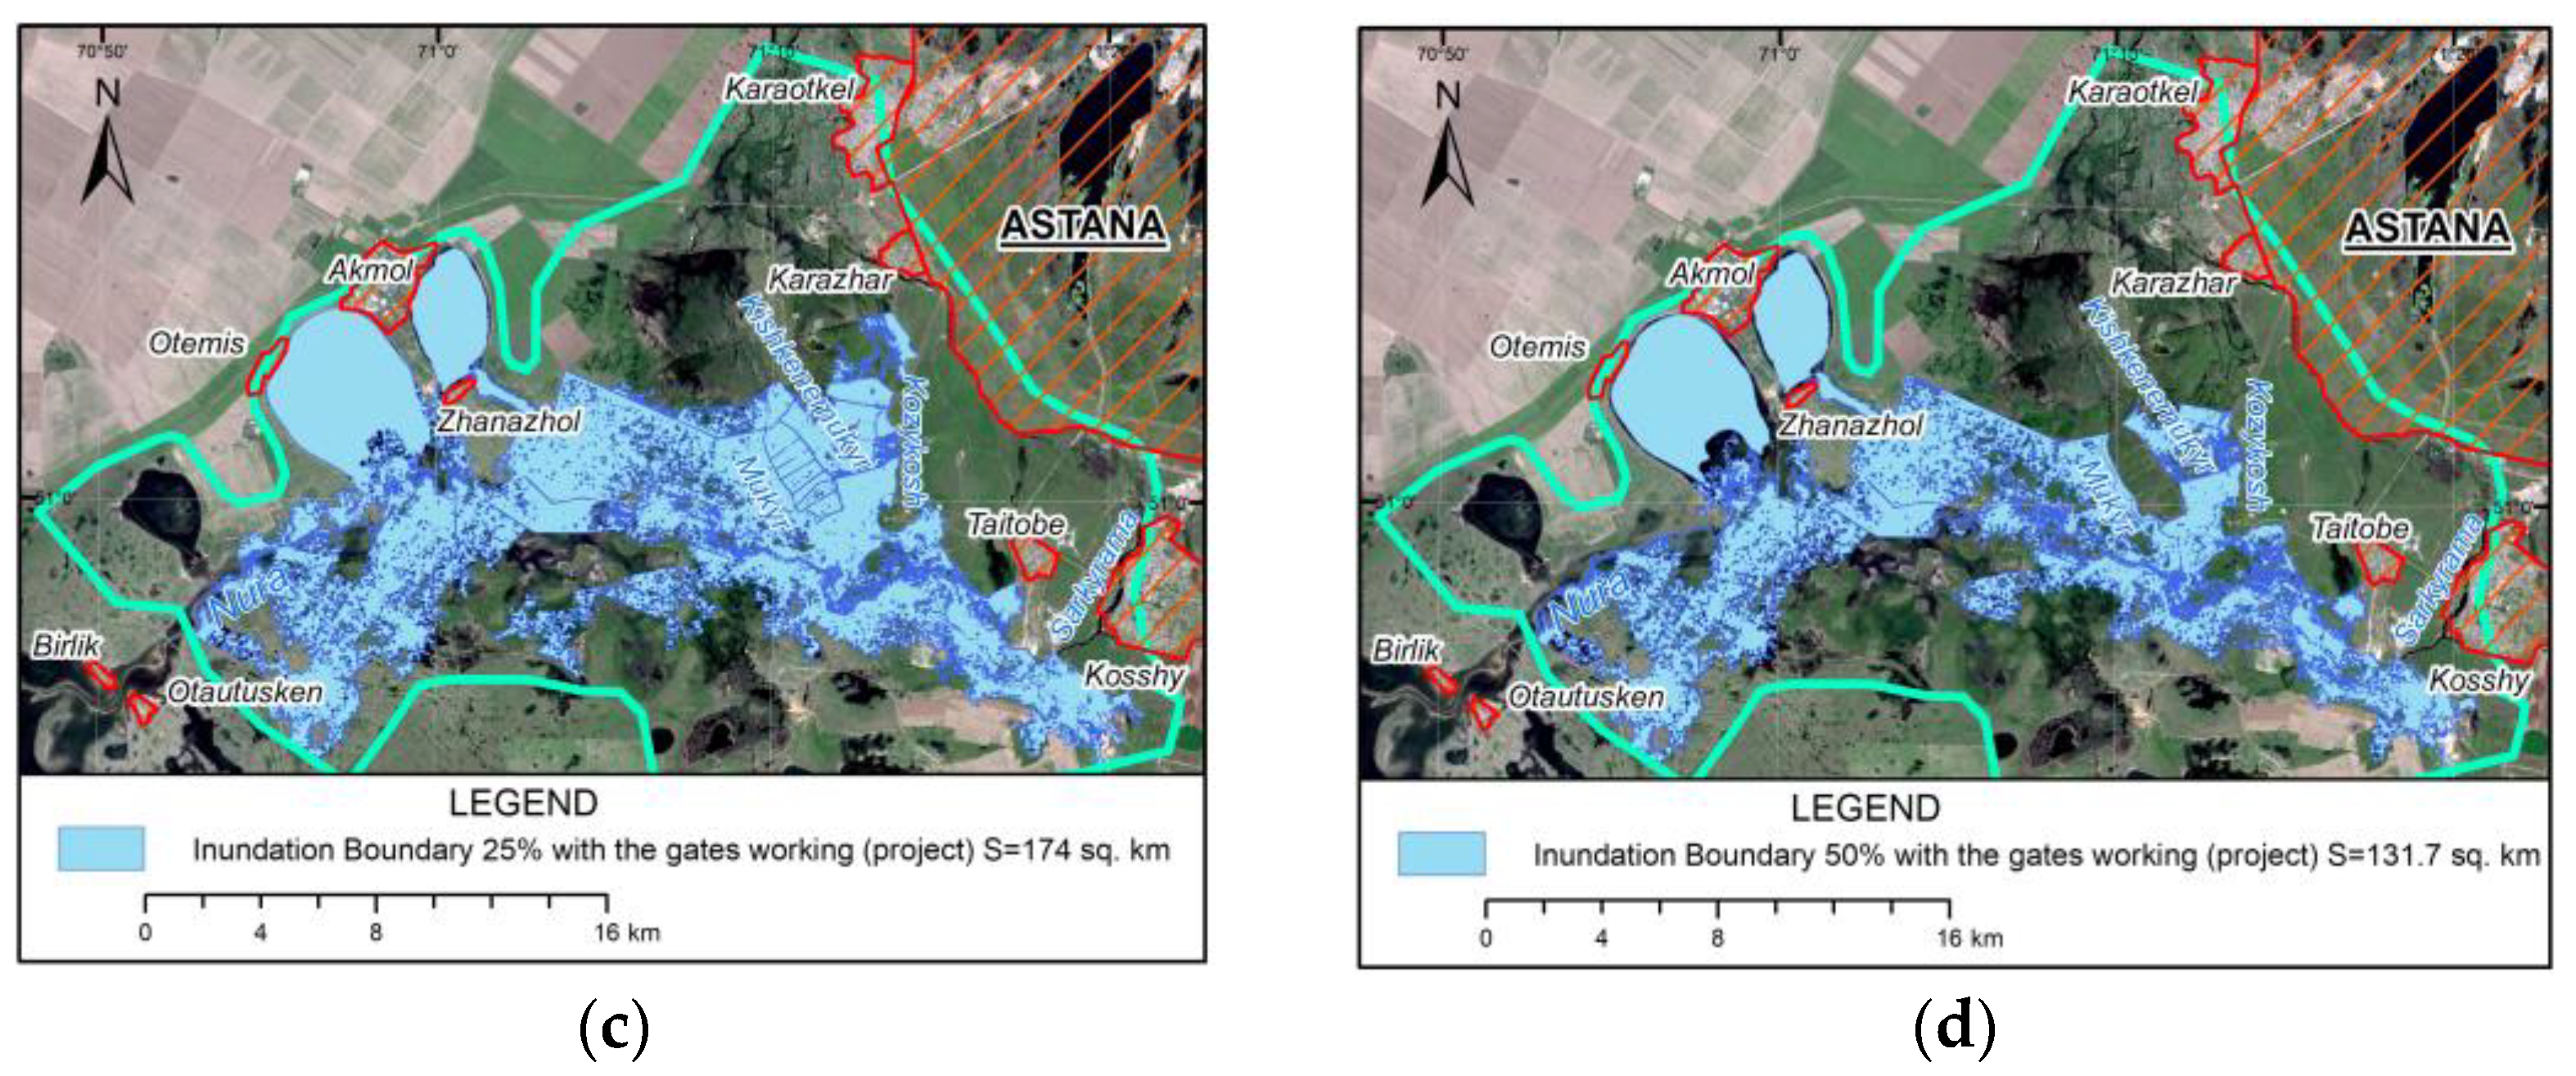
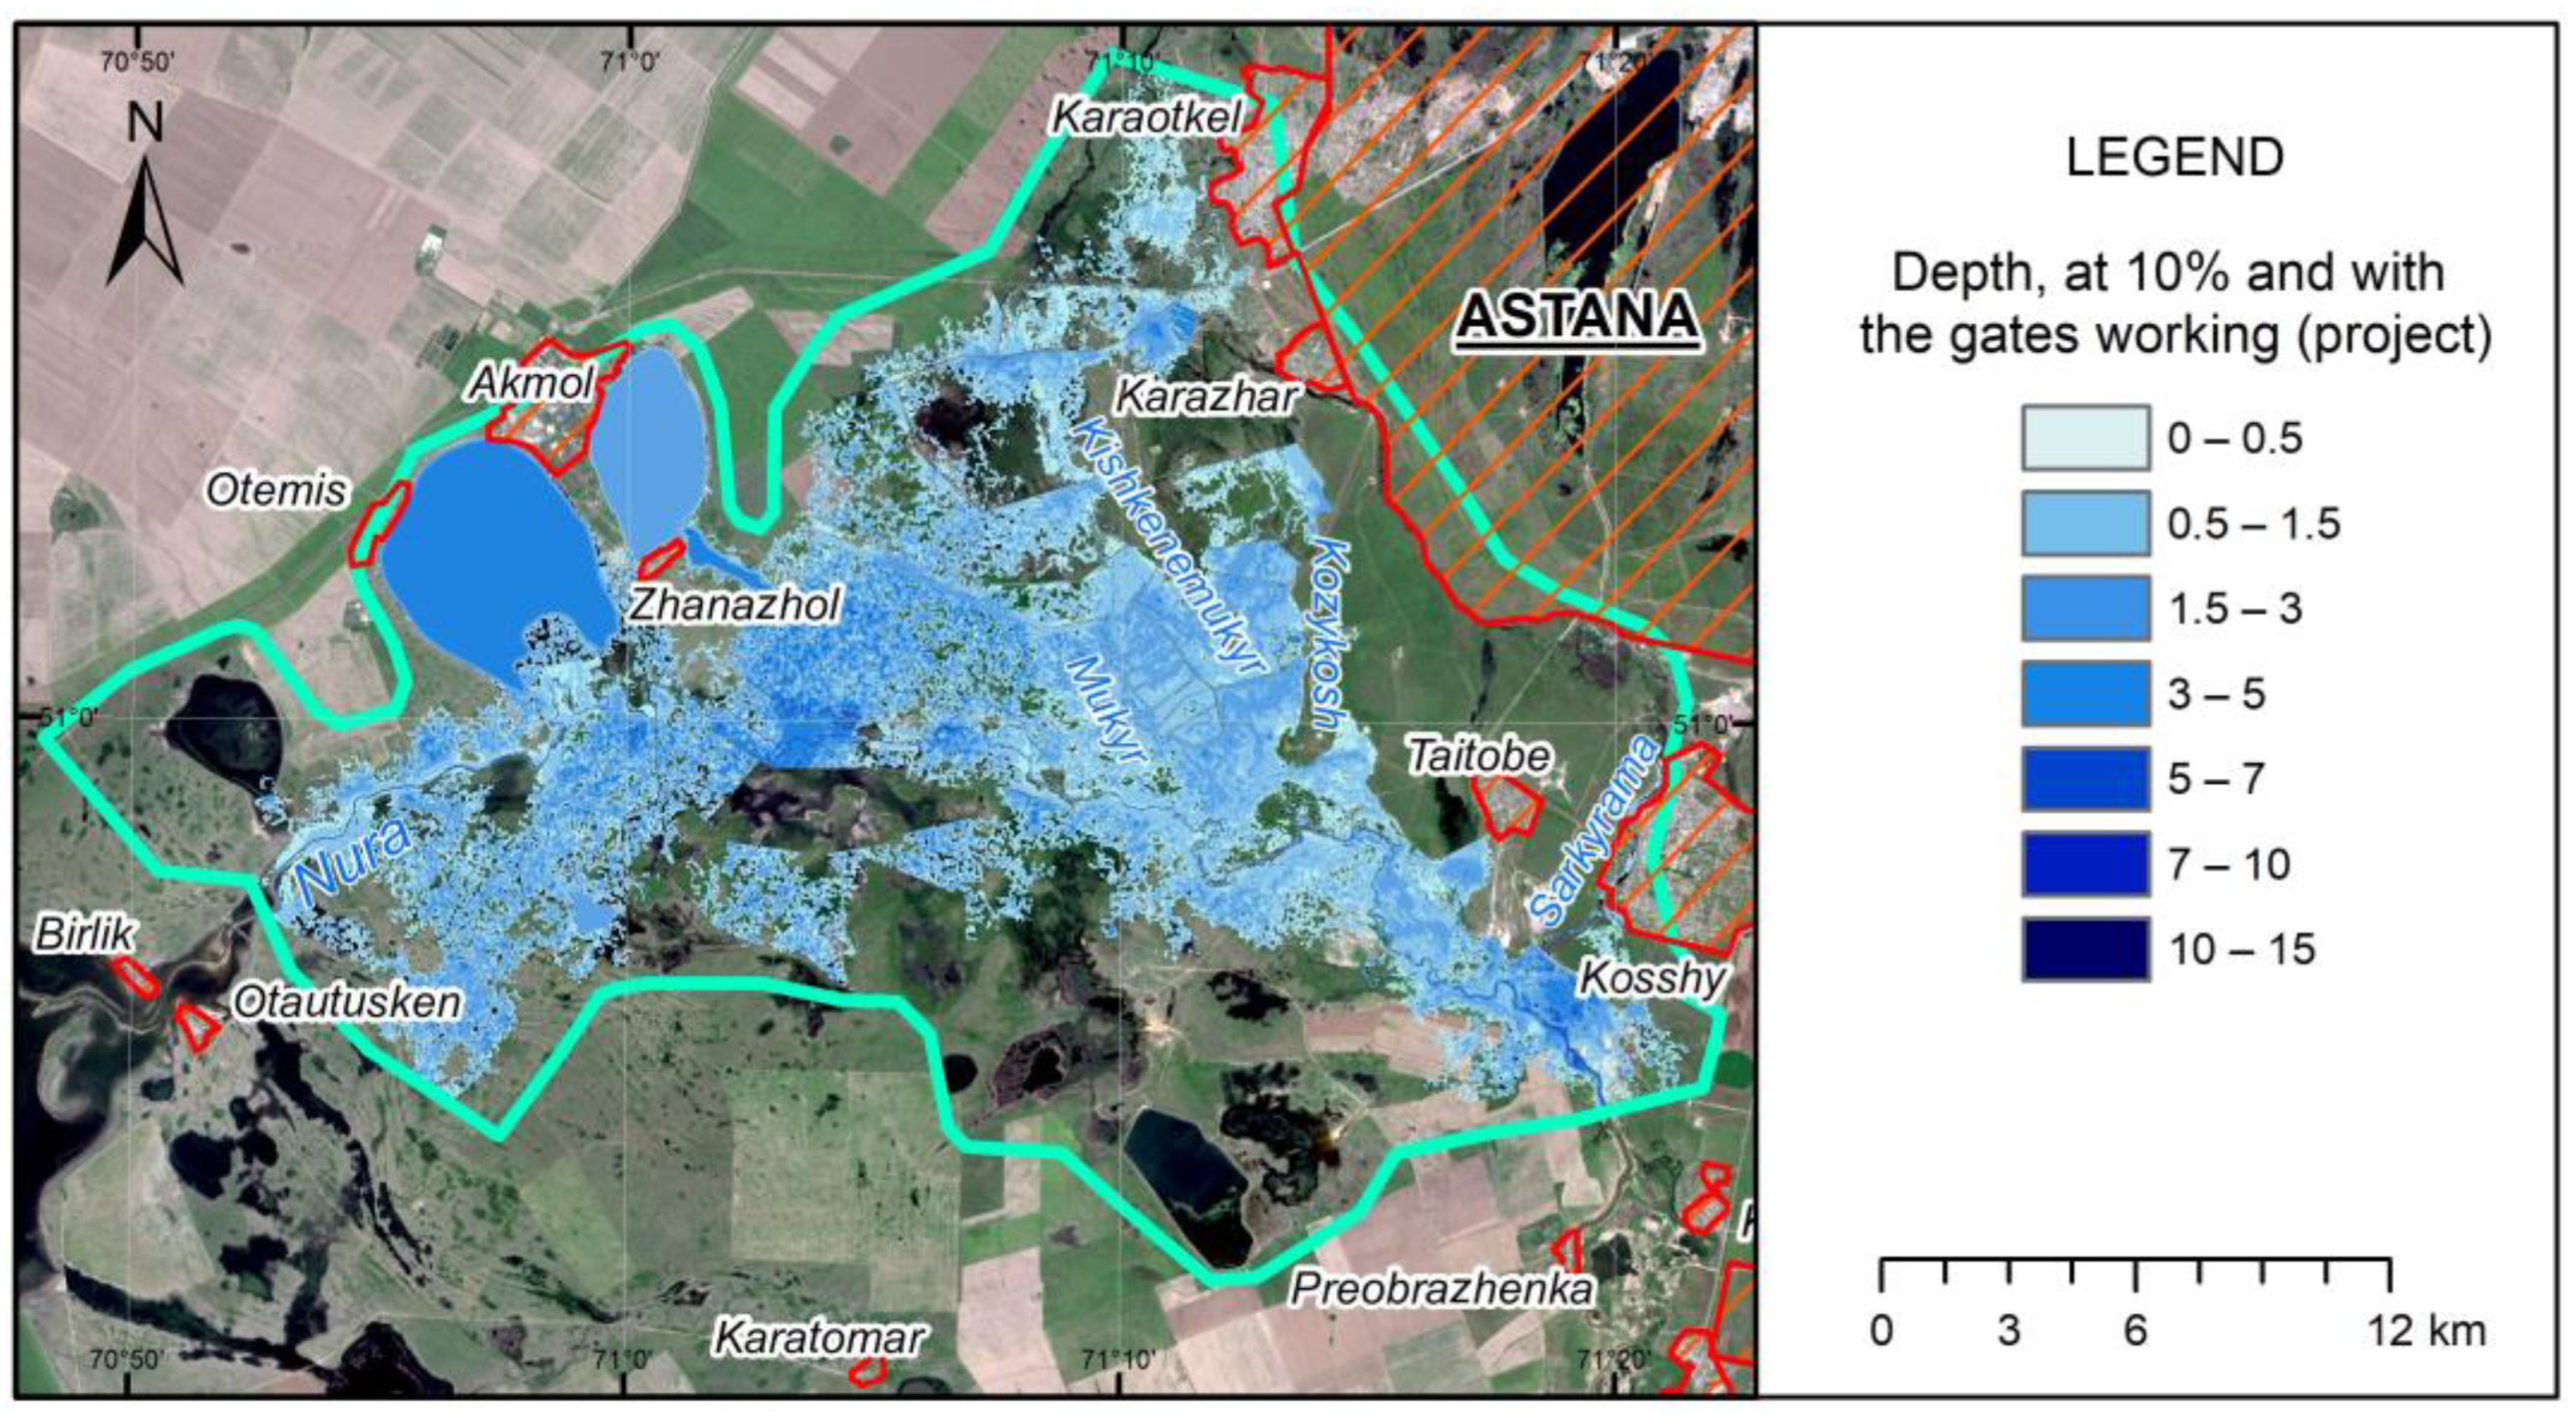
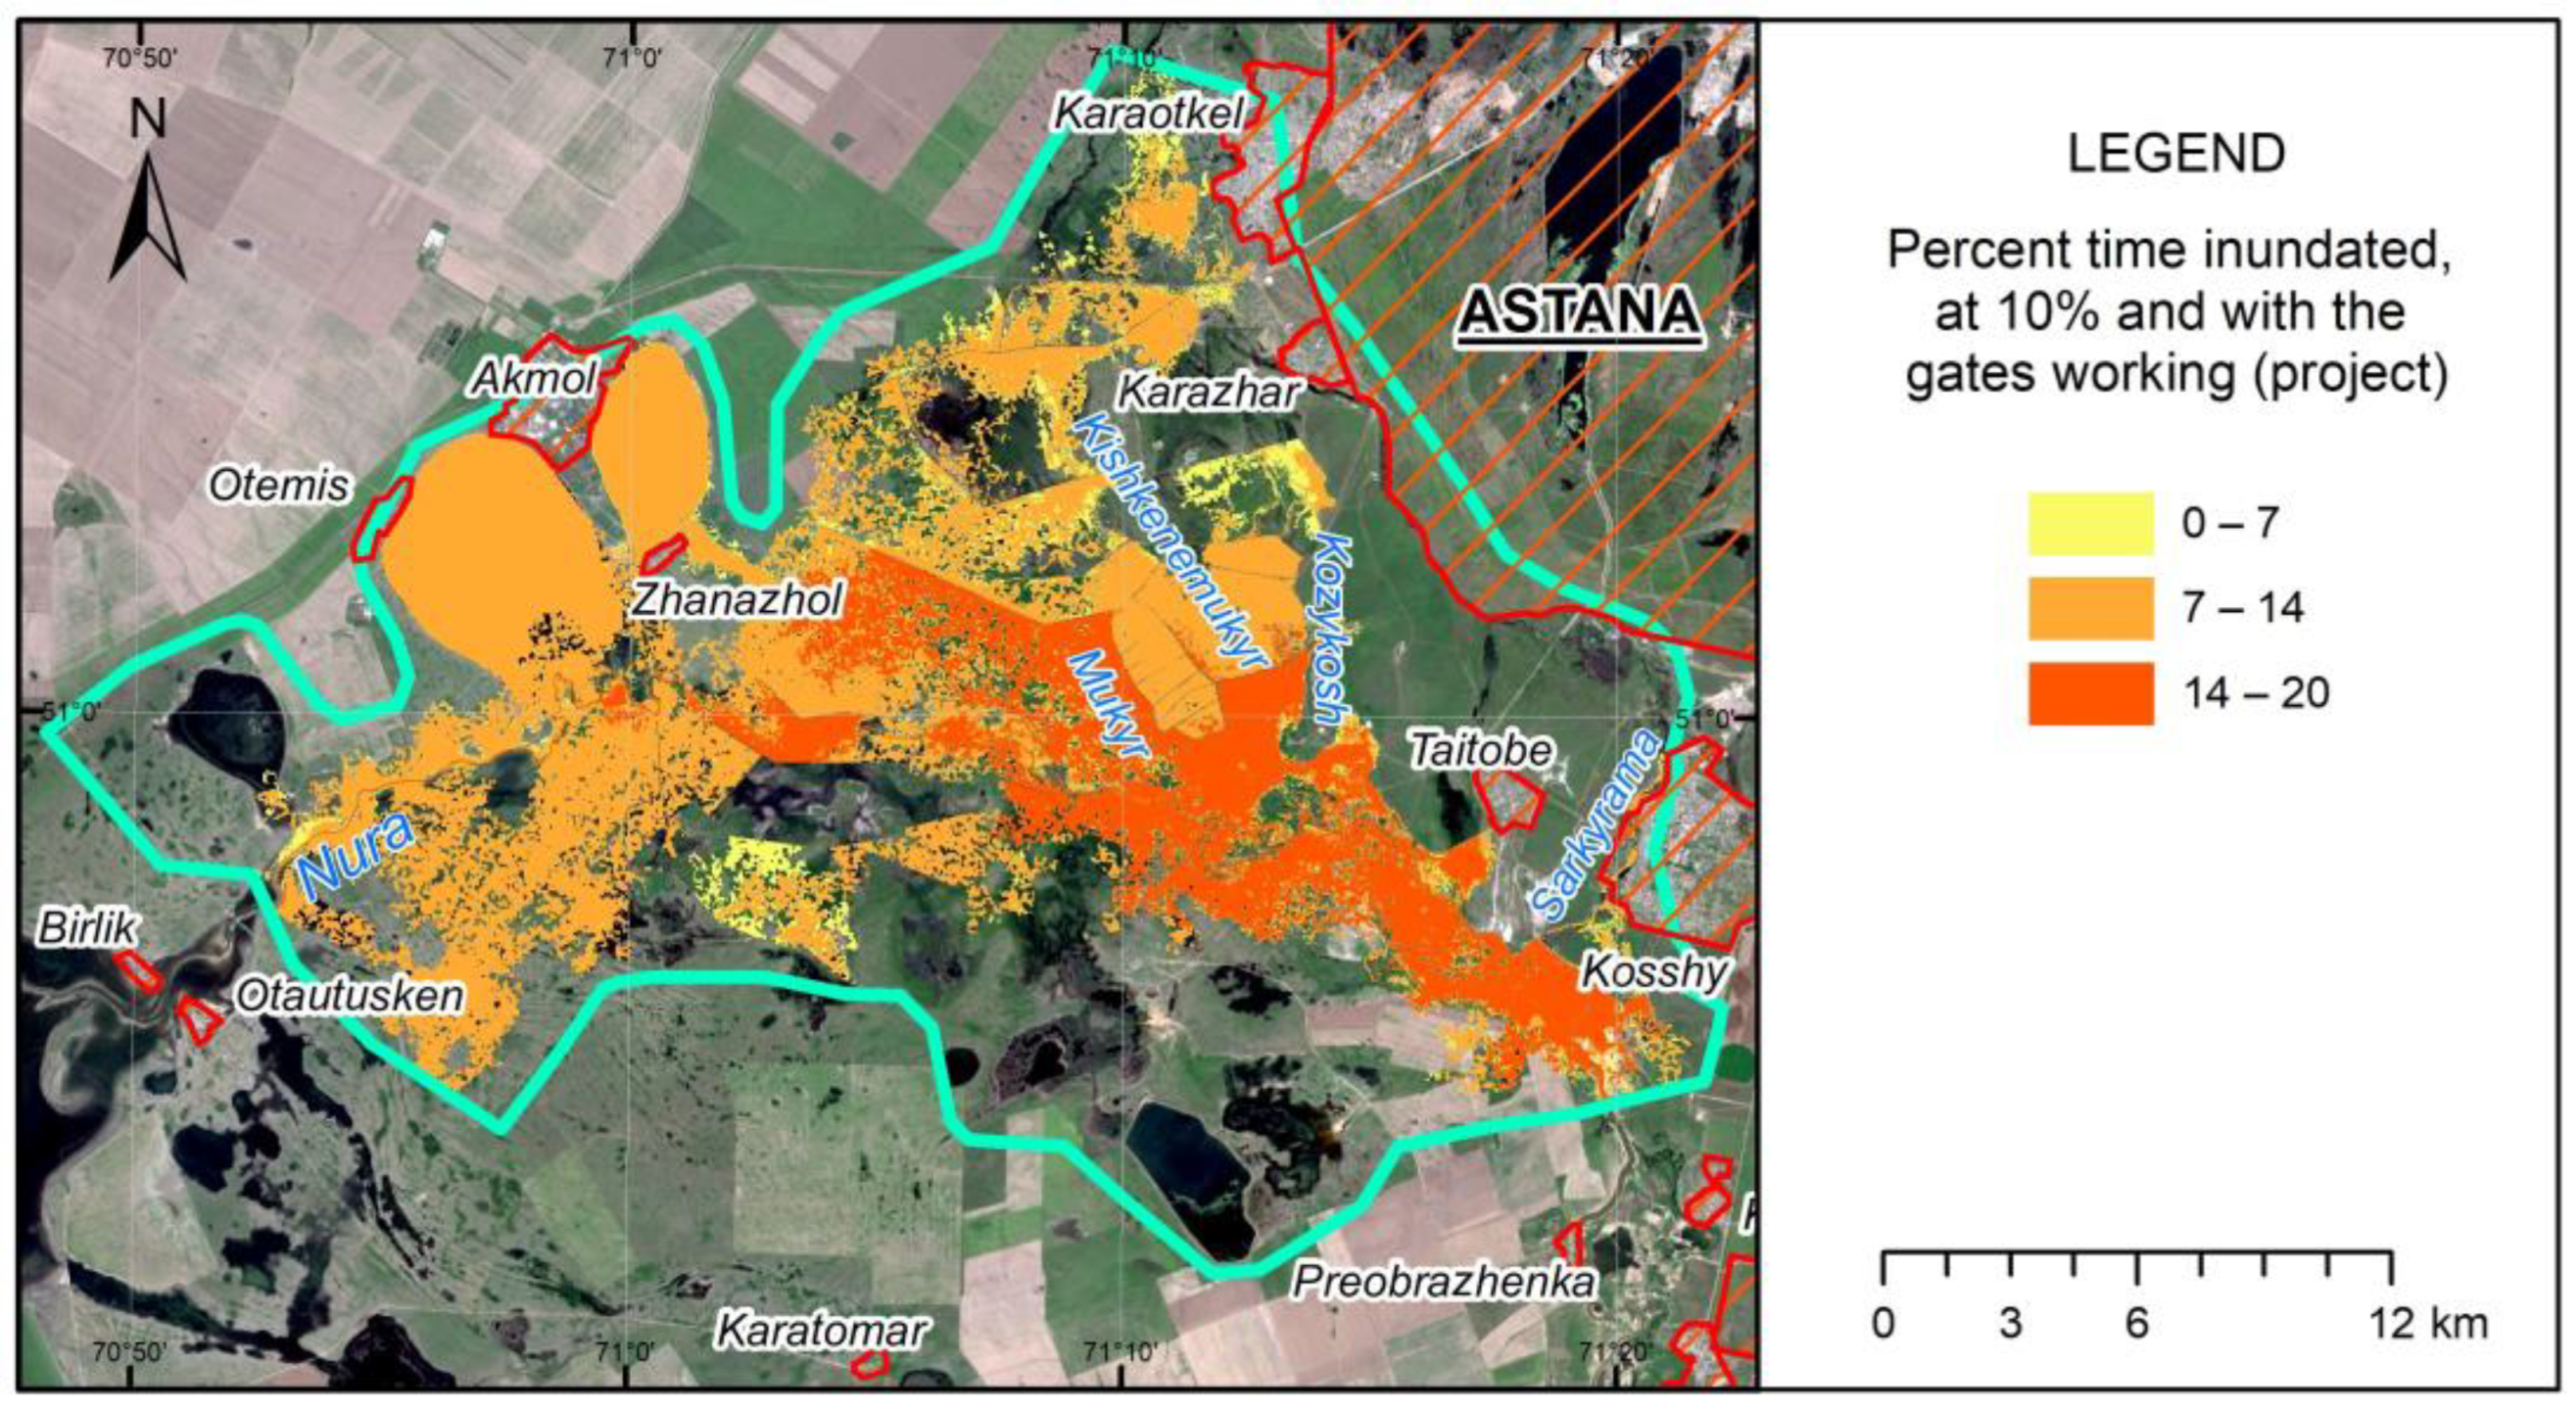
The results of modeling the existing multi-level Alva irrigation system under various scenarios showed that, in general, the system cannot cope with high discharges (1%, 10% exceedance probability flood hydrographs) from the Preobrazhenskiy waterwork, and, at low flow rates (25%, 50% exceedance probability flood hydrographs), water does not spread throughout the interfluve irrigation system. Analysis of the absolute heights of water-retaining dams and irrigation system dams with outlet structures showed that, at certain locations, the dams have been destroyed or dam crest was lowered due to erosion. At the same time, in some areas, the outlet structures were located hypsometrically higher than the enclosing ramparts, so the areas downstream the irrigation dams were not flooded. In addition, the modeling showed that, in the existing system, there are not enough spillways on some dams. Considering the modelling results with the current DEM and existing Alva irrigation system, it was decided to simulate the performance of the Alva system if the dams’ crests were elevated. Five additional gates and culverts were installed. As the results suggest, there are differences in terms of inundation area, maximum flood depth and flood duration. The designed model proposes a partial solution for preserving volume of spring flood water. The volume of flood water during 50% exceedance probability event amounted to 392.1 million m3, while the capacity of the Alva irrigation system is 201.6 million m3. From the difference in volume, most of the water resources in transit pass further along the Nura River. Because the estimated throughput capacity of the head facility on the Nura River is 101.0 m3/s, 174.5 million m3 will pass downstream Nura River during such an event. That is, there is a problem of the need to save 16 million m3 water, which also includes irretrievable losses due to evaporation and infiltration, as well as environmental flow for preservation of interfluve water bodies during a long low-water period. The designed model proposes to send a part of the volume of flood waters to predetermined depressions for further economic use. This is completed by inclusion of supply channels that direct waters to following depressions in addition to deepening of these depressions. First, it is proposed to deepen Lake Zhalanash (the depth of which is 2–2.5 m) and the nearby former delta lake, now Koskopa Swamp, by an additional 2 m. As a result, the volume of Lake Zhalanash will reach 1.24 million m3 and Koskopa Swamp 2.052 million m3.

5. Conclusions

The Republic of Kazakhstan has been experiencing flooding events in several regions, and there is annual occurrence of flooding events during spring snowmelt. This study is devoted to consideration of the possibility of reducing risk of spring floods in the interfluve area of Nura and Yesil Rivers based on control of the sluice gates of Alva irrigation system using HEC-RAS. Optimal operation of the Alva system gates has the potential to lower the flood hazard at a cheaper cost without investing in new structural measures because these gates exist but are not utilized for the purpose of flood hazard reduction. Several exceedance probability hydrographs have been simulated in order to assess the capacity of the Alva system with its gates closed and operating. Additional gates and culverts were added to the existing system and elevations of some dams were increased to simulate potential improvement in system capacity. Assessment of model results in terms of inundation area, flood depth and duration of flooding revealed the following features:
  • Modeling of spring flood of 1% exceedance probability showed the impossibility of managing such high flow by regulating the gates of the existing irrigation system;
  • The flooded area increases with operating gates in the case of low flows. The lower the return period of the flood hydrograph, the larger the difference in flooded area between closed and operating gates;
  • Analysis of the temperature course for the simulated period (27 March–17 April 2019), as well as the structural features of the Nura River valley and the relief of the left-bank hills, made it possible to isolate the territories flooded under the influence of snowmelt; removing them increased the model similarity with remote sensing data from 52% to 70%.
  • Optimization of the irrigation system with addition of gates and elevating the dams has demonstrated efficiency, which is clearly visible at the area of the hatchery, which was not flooded in the models with the existing irrigation system;
  • Modeling has shown that the maximum areas are occupied by water depth of 0.5–1.5 m for all scenarios, both with closed and controlled gates;
Analysis of flood duration data indicates that 57.3% to 67.3% of the flooded area with closed and controlled gates is under water for 7–14 days, which contributes to an increase in the yield of natural hayfields.

Author Contributions

Conceptualization, F.A. and N.O.; methodology, F.A. and N.O.; software, Y.K. and N.O.; validation, Y.K., Z.M. and N.O.; formal analysis, N.Z. and Y.K.; investigation, F.A. and N.O.; resources Y.K., A.N. and Z.M.; writing—original draft preparation, F.A. and N.O.; writing—review and editing, F.A., N.O., A.A. and Z.M.; visualization, N.Z. and Y.K.; project administration, F.A. All authors have read and agreed to the published version of the manuscript.

Funding

This research was funded by The Committee of Science of Ministry of Science and Higher Education of the Republic of Kazakhstan within the framework of project AP08856733 “Assessment of surface water resources and their use at the Nura–Yesil interfluve using geoinformation technologies for agricultural territories’ sustainable development”.

Data Availability Statement

Data available on request due to restrictions.

Conflicts of Interest

The authors declare no conflict of interest. The funders had no role in the design of the study; in the collection, analyses or interpretation of data; in the writing of the manuscript or in the decision to publish the results.

References

  1. Adhikari, P.; Hong, Y.; Douglas, K.R.; Kirschbaum, D.B.; Gourley, J.; Adler, R.; Brakenridge, G.R. A digitized global flood inventory (1998–2008): Compilation and preliminary results. Nat. Hazards 2010, 55, 405–422. [Google Scholar] [CrossRef]
  2. Smith, K.; Ward, R. Floods: Physical Processes and Human Impacts; John Wiley & Sons: New York, NY, USA, 1998; p. 382. [Google Scholar]
  3. Haltas, I.; Yildirim, E.; Oztas, F.; Demir, I. A comprehensive flood event specification and inventory: 1930–2020 Turkey case study. Int. J. Disaster Risk Reduct. 2021, 56, 102086. [Google Scholar] [CrossRef]
  4. Shahabi, H.; Shirzadi, A.; Ghaderi, K.; Omidvar, E.; Al-Ansari, N.; Clague, J.J.; Geertsema, M.; Khosravi, K.; Amini, A.; Bahrami, S. Flood detection and susceptibility mapping using sentinel-1 remote sensing data and a machine learning approach: Hybrid intelligence of bagging ensemble based on k-nearest neighbor classifier. Remote Sens. 2020, 12, 266. [Google Scholar] [CrossRef]
  5. Tellman, B.; Sullivan, J.; Kuhn, C.; Kettner, A.; Doyle, C.; Brakenridge, G.; Erickson, T.; Slayback, D. Satellite imaging reveals increased proportion of population exposed to floods. Nature 2021, 596, 80–86. [Google Scholar] [CrossRef]
  6. Huang, Z.; Wu, H.; Adler, R.F.; Schumann, G.; Gourley, J.J.; Kettner, A.; Nanding, N. Multisourced Flood Inventories over the Contiguous United States for Actual and Natural Conditions. Bull. Am. Meteorol. Soc. 2021, 102, E1133–E1149. [Google Scholar] [CrossRef]
  7. Mel, R.A.; Viero, D.P.; Carniello, L.; D’Alpaos, L. Optimal floodgate operation for river flood management: The case study of Padova (Italy). J. Hydrol. Reg. Stud. 2020, 30, 100702. [Google Scholar] [CrossRef]
  8. Tengrinews. Floods in Kazakhstan. Available online: https://tengrinews.kz/news/pavodki-v-kazahstane-227-naselennyih-punktov-v-zone-riska-465453/ (accessed on 14 April 2022).
  9. Burlibaev, M.Z.; Volchek, A.A.; Kalinin, M.Y. Hydrological natural phenomena (world trends, chronicle of Belarus and Kazakhstan). In Proceedings of the International Scientific and Practical Conference Dedicated to Summing Up the Decade “Water for Life” Declared by the UN “Water Resources of Central Asia and Their Use”, Almaty, Kazakhstan, 22–24 September 2016; Book 2. pp. 372–377. [Google Scholar]
  10. Galperin, R.I. On water hazards in Kazakhstan. In Proceedings of the Materials of the International Scientific and Practical Conference, Dedicated to Summing up the Results of the Decade Declared by the UN “Water for Life” “Water Resources of Central Asia and Their Use, Almaty, Kazakhstan, 22–24 September 2016; Book 2. pp. 378–386. [Google Scholar]
  11. Li, C.; Cheng, X.; Li, N.; Du, X.; Yu, Q.; Kan, G. A Framework for Flood Risk Analysis and Benefit Assessment of Flood Control Measures in Urban Areas. Int. J. Environ. Res. Public Health 2016, 13, 787. [Google Scholar] [CrossRef]
  12. Kvočka, D.; Falconer, R.A.; Bray, M. Flood Hazard Assessment for Extreme Flood Events. Nat. Hazards 2016, 84, 1569–1599. [Google Scholar] [CrossRef]
  13. Tsakiris, G. Flood Risk Assessment: Concepts, Modelling, Applications. Nat. Hazards Earth Syst. Sci. 2014, 14, 1361–1369. [Google Scholar] [CrossRef]
  14. Cai, T.; Li, X.; Ding, X.; Wang, J.; Zhan, J. Flood Risk Assessment Based on Hydrodynamic Model and Fuzzy Comprehensive Evaluation with GIS Technique. Int. J. Disaster Risk Reduct. 2019, 35, 101077. [Google Scholar] [CrossRef]
  15. Zhang, K.; Shalehy, M.H.; Ezaz, G.T.; Chakraborty, A.; Mohib, K.M.; Liu, L. An Integrated Flood Risk Assessment Approach Based on Coupled Hydrological-Hydraulic Modeling and Bottom-up Hazard Vulnerability Analysis. Environ. Model. Softw. 2022, 148, 105279. [Google Scholar] [CrossRef]
  16. Chen, H.; Ito, Y.; Sawamukai, M.; Tokunaga, T. Flood Hazard Assessment in the Kujukuri Plain of Chiba Prefecture, Japan, Based on GIS and Multicriteria Decision Analysis. Nat. Hazards 2015, 78, 105–120. [Google Scholar] [CrossRef]
  17. Bathrellos, G.D.; Karymbalis, E.; Skilodimou, H.D.; Gaki-Papanastassiou, K.; Baltas, E.A. Urban Flood Hazard Assessment in the Basin of Athens Metropolitan City, Greece. Environ. Earth Sci. 2016, 75, 319. [Google Scholar] [CrossRef]
  18. Wang, Z.; Lai, C.; Chen, X.; Yang, B.; Zhao, S.; Bai, X. Flood Hazard Risk Assessment Model Based on Random Forest. J. Hydrol. 2015, 527, 1130–1141. [Google Scholar] [CrossRef]
  19. Mojaddadi, H.; Pradhan, B.; Nampak, H.; Ahmad, N.; Ghazali, A.H. bin Ensemble Machine-Learning-Based Geospatial Approach for Flood Risk Assessment Using Multi-Sensor Remote-Sensing Data and GIS. Geomat. Nat. Hazards Risk 2017, 8, 1080–1102. [Google Scholar] [CrossRef]
  20. Karamuz, E.; Romanowicz, R.J.; Doroszkiewicz, J. The Use of Unmanned Aerial Vehicles in Flood Hazard Assessment. J. Flood Risk Manag. 2020, 13, e12622. [Google Scholar] [CrossRef]
  21. Gebremichael, E.; Molthan, A.L.; Bell, J.R.; Schultz, L.A.; Hain, C. Flood Hazard and Risk Assessment of Extreme Weather Events Using Synthetic Aperture Radar and Auxiliary Data: A Case Study. Remote Sens. 2020, 12, 3588. [Google Scholar] [CrossRef]
  22. Shadmehri Toosi, A.; Calbimonte, G.H.; Nouri, H.; Alaghmand, S. River Basin-Scale Flood Hazard Assessment Using a Modified Multi-Criteria Decision Analysis Approach: A Case Study. J. Hydrol. 2019, 574, 660–671. [Google Scholar] [CrossRef]
  23. Shadmehri Toosi, A.; Doulabian, S.; Ghasemi Tousi, E.; Calbimonte, G.H.; Alaghmand, S. Large-Scale Flood Hazard Assessment under Climate Change: A Case Study. Ecol. Eng. 2020, 147, 105765. [Google Scholar] [CrossRef]
  24. Moftakhari, H.; Schubert, J.E.; AghaKouchak, A.; Matthew, R.A.; Sanders, B.F. Linking Statistical and Hydrodynamic Modeling for Compound Flood Hazard Assessment in Tidal Channels and Estuaries. Adv. Water Resour. 2019, 128, 28–38. [Google Scholar] [CrossRef]
  25. Apel, H.; Thieken, A.H.; Merz, B.; Blöschl, G. Flood Risk Assessment and Associated Uncertainty. Nat. Hazards Earth Syst. Sci. 2004, 4, 295–308. [Google Scholar] [CrossRef]
  26. Fassoni-Andrade, A.C.; Fan, F.M.; Collischonn, W.; Fassoni, A.C.; Paiva, R.C.D. Comparison of numerical schemes of river flood routing with an inertial approximation of the Saint Venant equations. Rbrh 2018, 23. [Google Scholar] [CrossRef]
  27. Pathan, A.I.; Agnihotri, P.G.; Patel, D.; Prieto, C. Mesh grid stability and its impact on flood inundation through (2D) hydrodynamic HEC-RAS model with special use of Big Data platform—A study on Purna River of Navsari city. Arab. J. Geosci. 2022, 15, 659. [Google Scholar] [CrossRef]
  28. Madhuri, R.; Raja, Y.S.L.S.; Raju, K.S.; Punith, B.S.; Manoj, K. Urban flood risk analysis of buildings using HEC-RAS 2D in climate change framework. H2Open J. 2021, 4, 262–275. [Google Scholar] [CrossRef]
  29. Pathan, A.I.; Agnihotri, P.G. Application of new HEC-RAS version 5 for 1D hydrodynamic flood modeling with special reference through geospatial techniques: A case of River Purna at Navsari, Gujarat, India. Model. Earth Syst. Environ. 2021, 7, 1133–1144. [Google Scholar] [CrossRef]
  30. Abd El Shafy, M.; Mostafa, A. Flash Flood Modeling Using HEC-RAS (2D) model on Wadi Reem in the western region, Kingdom of Saudi Arabia. J. Egypt. Acad. Soc. Environ. Development. D Environ. Stud. 2021, 22, 17–32. [Google Scholar] [CrossRef]
  31. Karim, I.R.; Hassan, Z.F.; Abdullah, H.H.; Alwan, I.A. 2D-HEC-RAS Modeling of Flood Wave Propagation in a Semi-Arid Area Due to Dam Overtopping Failure. Civ. Eng. J. 2021, 7, 1501–1514. [Google Scholar] [CrossRef]
  32. Mustafa, A.; Szydłowski, M. Application of different building representation techniques in HEC-RAS 2-D for urban flood modeling using the Toce River experimental case. PeerJ 2021, 9, e11667. [Google Scholar] [CrossRef]
  33. Costabile, P.; Costanzo, C.; Ferraro, D.; Barca, P. Is HEC-RAS 2D accurate enough for storm-event hazard assessment? Lessons learnt from a benchmarking study based on rain-on-grid modelling. J. Hydrol. 2021, 603, 126962. [Google Scholar] [CrossRef]
  34. Muñoz, D.F.; Yin, D.; Bakhtyar, R.; Moftakhari, H.; Xue, Z.; Mandli, K.; Ferreira, C. Inter-Model Comparison of Delft3D-FM and 2D HEC-RAS for Total Water Level Prediction in Coastal to Inland Transition Zones. JAWRA J. Am. Water Resour. Assoc. 2022, 58, 34–49. [Google Scholar] [CrossRef]
  35. Zeiger, S.J.; Hubbart, J.A. Measuring and modeling event-based environmental flows: An assessment of HEC-RAS 2D rain-on-grid simulations. J. Environ. Manag. 2021, 285, 112125. [Google Scholar] [CrossRef]
  36. EL Bilali, A.; Taleb, I.; Nafii, A.; Taleb, A. A practical probabilistic approach for simulating life loss in an urban area associated with a dam-break flood. Int. J. Disaster Risk Reduct. 2022, 76, 103011. [Google Scholar] [CrossRef]
  37. Papaioannou, G.; Markogianni, V.; Loukas, A.; Dimitriou, E. Remote Sensing Methodology for Roughness Estimation in Ungauged Streams for Different Hydraulic/Hydrodynamic Modeling Approaches. Water 2022, 14, 1076. [Google Scholar] [CrossRef]
  38. Tinoco, V.; Willems, P.; Wyseure, G.; Cisneros, F. Evaluation of reservoir operation strategies for irrigation in the Macul Basin, Ecuador. J. Hydrol. Reg. Stud. 2016, 5, 213–225. [Google Scholar] [CrossRef]
  39. He, Y.; Xu, Q.; Yang, S.; Liao, L. Reservoir flood control operation based on chaotic particle swarm optimization algorithm. Appl. Math. Model. 2014, 38, 4480–4492. [Google Scholar] [CrossRef]
  40. Myo Lin, N.; Rutten, M.; Tian, X. Flood Mitigation through Optimal Operation of a Multi-Reservoir System by Using Model Predictive Control: A Case Study in Myanmar. Water 2018, 10, 1371. [Google Scholar] [CrossRef]
  41. Kim, Y.-G.; Jo, M.-B.; Kim, P.; Oh, S.-N.; Choe, J.-H.; Kim, B.-Y.; Rim, H.-M. Effective Flood Control Method in River Downstream Affected by Tidal Effect Using Optimal Operation of Estuary Barrage. J. Waterw. Port Coast. Ocean. Eng. 2021, 147, 04021030. [Google Scholar] [CrossRef]
  42. Nguyen, T.H. Optimal Operation of Multi-Reservoir System for Flood Control: Application to the Vu Gia Thu Bon Catchment, Vietnam. Construction Hydraulique; Université Côte d’Azur: Nice, France, 2020; English. NNT: 2020COAZ4027ff. [Google Scholar]
  43. Gois, M.; Gonçalves, A.; Medeiros, J. Reservoir operation rule in semiarid areas: The quantity-quality approach. J. Hydrol. 2022, 610, 127944. [Google Scholar]
  44. Uryvaeva, V.A. Surface water resources of virgin and fallow lands development areas. Akmola region of the Kazakh SSR. Hydrometeorological Publishing House. Leningrad 1958, 1, 28–29. [Google Scholar]
  45. Copernicus Open Access Hub. Available online: https://scihub.copernicus.eu/dhus/#/home (accessed on 1 March 2022).
  46. PlanetLab. Available online: https://www.planet.com/ (accessed on 3 February 2022).
  47. Gao, B.-C. NDWI—A normalized difference water index for remote sensing of vegetation liquid water from space. Remote Sens. Environ. 1996, 58, 257–266. [Google Scholar] [CrossRef]
  48. Singh, A. Digital change detection techniques using remotely sensed data. Int. J. Remote Sens. 1989, 10, 989–1003. [Google Scholar] [CrossRef]
  49. Arkhipkin, O.P.; Sagatdinova, G.N.; Bralinova, Z.A. Estimation of the potential development of floods based on the analysis of long-term time series of RS. Mod. Probl. Remote Sens. Earth Space 2014, 11, 127–136. [Google Scholar]
  50. Kantemirov, Y.I. Brief theoretical foundations of radar interferometry and its multipass variations Ps and SBas. Geomat. J. 2012, 1, 22–26. [Google Scholar]
  51. ArcGIS Desktop eReference. Available online: https://desktop.arcgis.com/ru/arcmap/10.3/guide-books/map-projections/geoid.htm (accessed on 10 January 2022).
  52. Instructions for Aerial Photography Using the DJI Phantom 4 Geobox RTK/PPK UAV. GEOBOX. Available online: https://geospb.ru/blog/articles/instrukciya-po-aerofotosemochnym-rabotam-afs-s-pomosshyu-bpla-dji-phantom-4-geobox-rtkppk (accessed on 20 July 2021). (In Russian).
  53. HEC-RAS. Available online: https://www.hec.usace.army.mil/software/hec-ras/ (accessed on 15 April 2022).
  54. Brunner, G. HEC-RAS River Analysis System: Hydraulics Reference Manual Version 5.0.; US Army Corps of Engineers Hydrological Engineering Center (HEC): Davis, CA, USA, 2016; pp. 1–538. [Google Scholar]
  55. Ghimire, E.; Sharma, S.; Lamichhane, N. Evaluation of one-dimensional and two-dimensional HEC-RAS models to predict flood travel time and inundation area for flood warning system. ISH J. Hydraul. Eng. 2022, 28, 110–126. [Google Scholar] [CrossRef]
  56. Albo-Salih, H.; Mays, L. Testing of an Optimization-Simulation Model for Real-Time Flood Operation of River-Reservoir Systems. Water 2021, 13, 1207. [Google Scholar] [CrossRef]
  57. Hariri, S.; Weill, S.; Gustedt, J.; Charpentier, I. A balanced watershed decomposition method for rain-on-grid simulations in HEC-RAS. J. Hydroinformatics 2022, 24, 315–332. [Google Scholar] [CrossRef]
  58. Dasallas, L.; Kim, Y.; An, H. Case Study of HEC-RAS 1D–2D Coupling Simulation: 2002 Baeksan Flood Event in Korea. Water 2019, 11, 2048. [Google Scholar] [CrossRef]
  59. Shabani, A.; Woznicki, S.A.; Mehaffey, M.; Butcher, J.; Wool, T.A.; Whung, P.-Y. A coupled hydrodynamic (HEC-RAS 2D) and water quality model (WASP) for simulating flood-induced soil, sediment, and contaminant transport. J. Flood Risk Manag. 2021, 14, e12747. [Google Scholar] [CrossRef]
  60. Ongdas, N.; Akiyanova, F.; Karakulov, Y.; Muratbayeva, A.; Zinabdin, N. Application of HEC-RAS (2D) for Flood Hazard Maps Generation for Yesil (Ishim) River in Kazakhstan. Water 2020, 12, 2672. [Google Scholar] [CrossRef]
  61. Jarihani, A.; Callow, J.; McVicar, T.; Van Niel, T.; Larsen, J. Satellite-derived Digital Elevation Model (DEM) selection, preparation and correction for hydrodynamic modelling in large, low-gradient and data-sparse catchments. J. Hydrol. 2015, 524, 489–506. [Google Scholar] [CrossRef]
  62. Sampson, C.S.; Smith, A.M.; Bates, P.D.; Neal, J.K.; Alfieri, L.; Freer, J.E. A high-resolution global flood hazard model. Water Resour. Res. 2015, 51, 7358–7381. [Google Scholar] [CrossRef] [PubMed]
  63. Shustikova, I.; Domeneghetti, A.; Neal, J.; Bates, P.; Castellarin, A. Comparing 2D capabilities of HEC-RAS and LISFLOOD-FP on complex topography. Hydrol. Sci. J. 2019, 64, 1769–1782. [Google Scholar] [CrossRef]
  64. Agabekov, O.; Sakenov, S.; Sakenov, S.; Yesserkepova, I.; Kryukova, V.; Tonkobayeva, A.; Vassilyev, S.; Ayashev, K. Seventh national Communication and Third Biennial Report of the Republic of Kazakhstan to the Framework Convention on Climate Change; Ministry of Energy of the Republic of Kazakhstan, United Nations Development Programme in Kazakhstan, Global Environment Facility: Nur-Sultan, Kazakhstan, 2017; p. 25, 148, 280. [Google Scholar]
  65. Dottori, F.; Todini, E. Testing a simple 2D hydraulic model in an urban flood experiment. Hydrol. Process. 2013, 27, 1301–1320. [Google Scholar] [CrossRef]
  66. Costabile, P.; Costanzo, C.; Macchione, F. Performances and limitations of the diffusive approximation of the 2-d shallow water equations for flood simulation in urban and rural areas. Appl. Numer. Math. 2017, 116, 141–156. [Google Scholar] [CrossRef]
  67. LLC “Weather Schedule”. Weather Archive in Nur-Sultan. Available online: Weather archive in Nur-Sultan (rp5.kz) (accessed on 20 March 2022).
  68. Mehta, D.J.; Yadav, S.M.; Mangukiya, N.K.; Lukhi, Z. Hydrodynamic Simulation and Dam-Break Analysis Using HEC-RAS 5, In A System Engineering Approach to Disaster Resilience, Lecture Notes in Civil Engineering; Ghosh, C., Kolathayar, S., Eds.; Springer Nature: Singapore, 2022; pp. 405–415. [Google Scholar] [CrossRef]
Figure 1. Location of the study area in the interfluve of Yesil and Nura Rivers.
Computation 11 00027 g001
Figure 2. Methodological workflow for flood hazard estimation used in this study.
Computation 11 00027 g002
Figure 3. Hourly water release data from Preobrazhenskiy waterwork in spring 2019.
Computation 11 00027 g003
Figure 4. Land cover map.
Computation 11 00027 g004
Figure 5. The main hydraulic structures in the interfluve of Nura and Yesil Rivers: Alva irrigation system (gate numbers 1–48), Preobrazhenskiy waterwork (top), photos of Alva irrigation system gates (bottom).
Computation 11 00027 g005
Figure 6. Areas covered with different elevation data sources used for generation of refined DEM used for modelling.
Computation 11 00027 g006
Figure 7. Refined DEM used for modeling (upper part), comparison of refined DEM and original DEM from Sentinel (lower part).
Computation 11 00027 g007
Figure 8. The actual area of flooding of the study area according to digitization of the PlanetScope satellite image from 10 April 2019.
Computation 11 00027 g008
Figure 9. Comparative analysis of the flooding areas from a satellite image model (a), on a digital elevation model (b).
Computation 11 00027 g009
Figure 10. Flood inundation area during spring floods of different exceedance probability: 1% (a,b), 10% (c,d), 25% (e,f), 50% (g,h) with closed gates and with operating gates.
Computation 11 00027 g010aComputation 11 00027 g010b
Figure 11. Maximum depth distribution during 100–year (a,b) and 10–year (c,d) return period hydrographs with closed gates and controlled gates, depth in meters.
Computation 11 00027 g011
Figure 12. Distribution of flood duration during 10% exceedance probability flood hydrograph with closed gates (a) and operating gates (b).
Computation 11 00027 g012
Figure 13. Inundation areas during simulation of different hydrographs using the modified DEM: (a) 1%, (b) 10%, (c) 25%, (d) 50%.
Computation 11 00027 g013aComputation 11 00027 g013b
Figure 14. Maximum flood depth map of the 2019 flood hydrograph simulated on modified DEM.
Computation 11 00027 g014
Figure 15. Flood duration map of the 2019 flood hydrograph simulated on DEM with changes (project scenario).
Computation 11 00027 g015
Figure 16. The course of the hydrograph of the spring flood in 2019 along the site of the Preobrazhenskiy waterwork; the course of maximum and average daily air temperatures at the weather station in Astana from 30 March to 19 April 2019.
Computation 11 00027 g016
Table 1. Land cover classes and calibrated roughness coefficients.
Land Cover ClassManning’s CoefficientArea (km2)% of Total
settlements0.0819.963.35
water body0.059.631.62
wetland0.0440.066.73
forest0.18.971.51
arable land0.0343.437.29
fallow0.0452.950.50
pasture0.035237.7239.91
hayfield0.035232.8739.10
total 595.60100.00
Table 2. Flood inundation areas at different scenarios.
Modeling ConditionsFlooded Area at Different Exceedance Probability Hydrographs (sq. km)
1%10%25%50%
Closed gates312.0218.0177.0123.9
Operating gates313.0234.0201.0131.5
Area difference1.016.024.07.5
Table 3. Distribution of areas according to flood depths during different flood hydrographs, sq. km.
Modeling ConditionsDepth, m1%10%25%50%
Closed gates0–0.551 (16.3%)44.7 (20.5%)38.5 (21.7%)37.7 (30.4%)
0.5–1.5117.7 (37.7%)90.2 (41.4%)81.1 (45.7%)56.6 (45.7%)
1.5–3115.6 (37%)67.6 (31%)48.3 (27.2%)23.8 (19.2%)
3–524.4 (7.8%)13.6 (6.2%)8.0 (4.5%)4.8 (3.9%)
5–153.8 (1.2%)2.1 (1%)1.7 (0.9%)1.1 (0.9%)
Total312.4218.2177.5124
Operating gates0–0.551.7 (16.5%)51.3 (21.9%)51.3 (25.5%)43.0 (32.7%)
0.5–1.5118.1 (37.7%)98.7 (42.2%)91.5 (45.4%)58.4 (44.4%)
1.5–3115.3 (36.8%)68.2 (29.2%)49 (24.3%)24.1 (18.3%)
3–524.2 (7.7%)13.7 (5.9%)7.9 (3.9%)4.9 (3.7%)
5–153.7 (7.7%)2.2 (5.9%)1.7 (0.9%)1.1 (0.8%)
Total313234201.5131.5
Table 4. Flooded areas with different inundation duration, sq. km.
Modeling ConditionsDays (h)1%10%25%50%
Closed gates0–7 (0–168)22.716.913.998.1
7–14 (168–336)166.6140.8119.979.9
14–20 (336–480)121.959.542.935.4
Controlled gates0–7 (0–168)22.517.124.414.1
7–14 (168–336)165.1156.0133.281.3
14–20 (336–480)124.259.842.935.4
Table 5. Flooded areas according to design data at discharges of different probability.
Modeling ConditionsAreas of Flooding at Hydrographs of Various Probability (sq. km)
1%10%25%50%
Closed gate320.7222.9162.8117.8
Controlled gate321.7229.5174.4131.7
Area difference0.996.611.613.9
Table 6. Areas covered by different maximum flood depths at different scenarios modelled on modified DEM.
Modeling ConditionsDepth, m1%10%25%50%
Closed gate0–0.550.5 (15.7%)44.4 (19.9%)39.0 (24%)26.2 (22.3%)
0.5–1.5115.7 (35.9%)81.0 (36.3%)56.5 (34.7%)60.9 (51.7%)
1.5–3101.1 (31.4%)63.1 (28.3%)37.5 (23%)23.5 (20%)
3–550.9 (15.8%)32.0 (14.4%)27.9 (17.2%)5.8 (1.1%)
5–154 (1.2%)2.4 (1.1%)1.9 (1.2%)1.2 (1.1%)
Controlled gate0–0.551.2 (16%)46.2 (20.3%)31.9 (18.5%)37.1 (28.4%)
0.5–1.5116.1 (36.4%)83.1 (36.6%)71.6 (41.5%)63.2 (48.5%)
1.5–3101.1 (31.7%)65.7 (29.9%)40.7 (23.6%)24 (18.4%)
3–550.8 (15.9%)32.1 (14.1%)28.4 (16.4%)6.1 (4.7%)
5–154 (1.3%)2.4 (1.1%)1.9 (1.1%)1.2 (0.9%)
Table 7. Flood duration of different scenarios simulated on modified DEM.
Modeling ConditionsDays (h)1%10%25%50%
Closed gate0–7 (0–168)24.13621.93114.7587.112
7–14 (168–336)187.061141.914105.87075.994
14–20 (336–480)109.91158.10541.46934.076
Controlled gate0–7 (0–168)23.98624.88815.29816.766
7–14 (168–336)184.680145.015116.93280.220
14–20 (336–480)113.40858.58041.49434.076
Disclaimer/Publisher’s Note: The statements, opinions and data contained in all publications are solely those of the individual author(s) and contributor(s) and not of MDPI and/or the editor(s). MDPI and/or the editor(s) disclaim responsibility for any injury to people or property resulting from any ideas, methods, instructions or products referred to in the content.

