

Dendrograms for Clustering in Multivariate Analysis: Applications for COVID-19 Vaccination Infodemic Data in Brazil

 , , and
Abstract
1. Introduction
2. Related Work
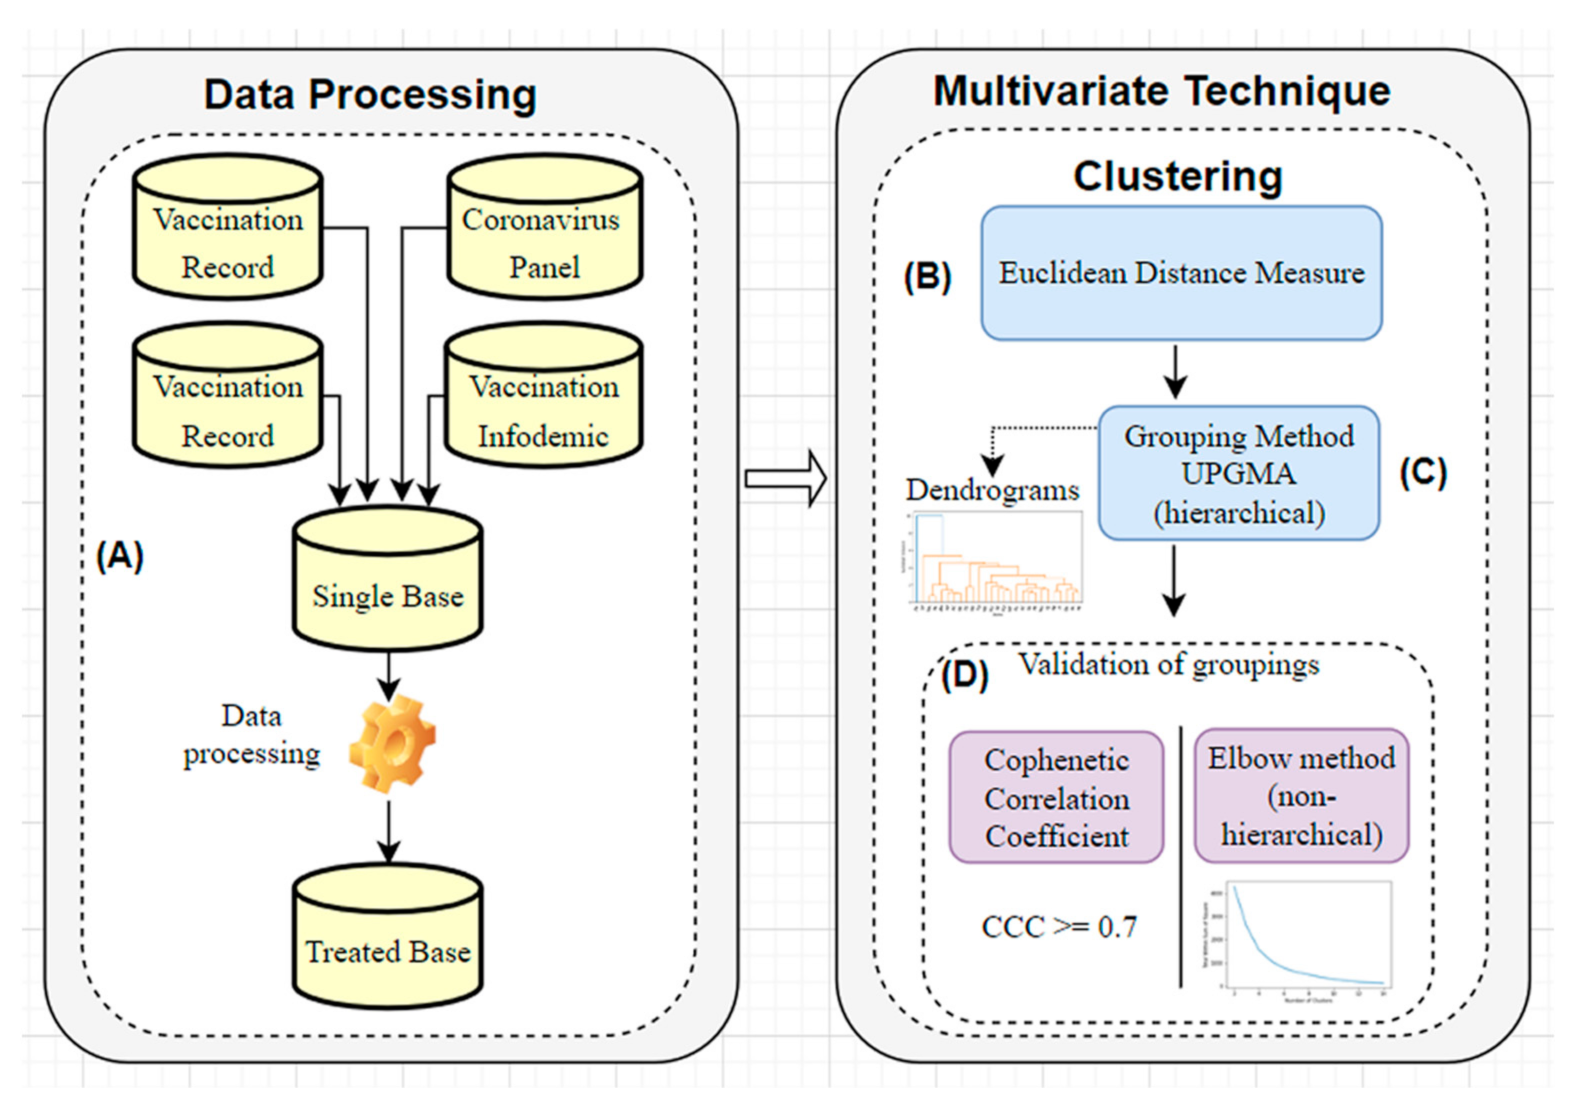
3. Methodology
3.1. Selection and Treatment of Variables for the Database (A)
- COVID-19 vaccination records [29]
- 2.
- Coronavirus Panel [30]
- 3.
- Internet access density [31]
- 4.
- Vaccination Infodemic [32]
3.2. Selection of the Measure of Distance or Similarity between Each Pair of Objects (B)
3.3. Selection of the Clustering Algorithm: Hierarchical Method (C)
3.4. Validation of the Clusters (D)
4. Computational Results
4.1. Analysis with All Age Ranges of Vaccination
4.2. Analysis with Vaccination of the Elderly 64 Years or Older
- vaccination of the elderly was the first in the vaccination calendar (and continued throughout the year 2021) and had no results on the efficacy of vaccines, leading to mistrust [52];
- vaccination campaigns were starting without many disclosures and some calendars did not contain information on dates for each group and where to receive the doses. Each state had the autonomy to prepare the calendar and dissemination;
- vaccines were missing in many states and started applications through the capitals (sometimes not arriving in the interiors). According to [53], there were three errors that led to the lack of vaccines: the government did not anticipate and buy vaccines in 2020, there was a lack of definition on who should be vaccinated first, and a lack of training caused a waste of doses;
- vaccination infodemics were well-exposed and circulated on social media and the Internet, generating fear and vaccine hesitation. People began to discredit science, believe in fake news, and act against science [52].
- in addition, the elderly were identified as the most vulnerable in the dissemination of fake news [54], and they are seven times more likely to spread false news compared to people under 29 years [55]. This generated a pertinent concern because the presence of the elderly as internet users has been growing and this has been shown to be the largest proportional increase among the age groups [55].
5. Conclusions
Author Contributions
Funding
Institutional Review Board Statement
Informed Consent Statement
Data Availability Statement
Conflicts of Interest
Abbreviations
| AC | Acre |
| AL | Alagoas |
| AM | Amazonas |
| AP | Amapá |
| BA | Bahia |
| CCC | Cophenetic Correlation Coefficient |
| CE | Ceará |
| DF | Distrito Federal |
| ES | Espírito Santo |
| GO | Goiás |
| GT | Google Trends |
| MA | Maranhão |
| MG | Minas Gerais |
| MS | Mato Grosso do Sul |
| MT | Mato Grosso |
| PA | Pará |
| PB | Paraiba |
| PE | Pernambuco |
| PI | Piauí |
| PR | Paraná |
| RJ | Rio de Janeiro |
| RN | Rio Grande do Norte |
| RO | Rondônia |
| RR | Roraima |
| RS | Rio Grande do Sul |
| SC | Santa Catarina |
| SD | Standard Deviation |
| SE | Sergipe |
| SP | São Paulo |
| TO | Tocantins |
| UPGMA | Unweighted Pair Group Method with Arithmetic Mean |
| WHO | World Health Organization |
References
- Guo, Y.; Cao, Q.; Hong, Z.; Tan, Y.; Chen, S.; Jin, H.; Tan, K.; Wang, D.; Yan, Y. The origin, transmission and clinical therapies on coronavirus disease 2019 (COVID-19) outbreak—An update on the status. Mil. Med. Res. 2020, 7, 11. [Google Scholar] [CrossRef] [PubMed]
- Lu, R.; Zhao, X.; Li, J.; Niu, P.; Yang, P.; Wu, H.; Wang, W.; Song, H.; Huang, B.; Zhu, N.; et al. Genomic characterisation and epidemiology of 2019 novel coronavirus: Implications for virus origins and receptor binding. Lancet 2020, 395, 565–574. [Google Scholar] [CrossRef]
- World Health Organization. Coronavirus Disease (COVID-19-2019) Situation Reports—51. Available online: https://www.who.int/docs/default-source/coronaviruse/situation-reports/20200311-sitrep-51-covid-19.pdf?sfvrsn=1ba62e57_10 (accessed on 3 April 2022).
- World Health Organization. Coronavirus Disease (COVID-19) Dashboard. Available online: https://covid19.who.int (accessed on 6 June 2022).
- Kouzy, R.; Jaoude, J.A.; Kraitem, A.; Alam, M.B.E.; Karam, B.; Adib, E.; Zarka, J.; Traboulsi, C.; Akl, E.W.; Baddour, K. Coronavirus Goes Viral: Quantifying the COVID-19 Misinformation Epidemic on Twitter. Cureus 2020, 12, 3. [Google Scholar] [CrossRef] [PubMed]
- Ghebreyesus, T.A. In Proceedings of the Munich Security Conference. Munich, Germany, 15 February 2022; Available online: https://www.who.int/director-general/speeches/detail/munich-security-conference (accessed on 15 March 2022).
- Department of Global Communications. UN Tackles “Infodemic” of Misinformation and Cybercrime in COVID-19 Crisis. Available online: https://www.un.org/en/un-coronavirus-communications-team/un-tackling-%E2%80%98infodemic%E2%80%99-misinformation-and-cybercrime-COVID-19 (accessed on 15 March 2022).
- Leem, M.; You, M. Direct and Indirect Associations of Media Use with COVID-19 Vaccine Hesitancy in South Korea: Cross-sectional Web-Based Survey. J. Med. Internet Res. 2022, 24, e32329. [Google Scholar] [CrossRef]
- Batista, S.R.; de Souza, A.S.S.; Nogueira, J.; de Andrade, F.B.; Thumé, E.; Teixeira, D.S.d.C.; Lima-Costa, M.F.; Facchini, L.A.; Nunes, B.P. Comportamentos de proteção contra COVID-19 entre adultos e idosos brasileiros que vivem com multimorbidade: Iniciativa ELSI-COVID-19. Cad. Saúde Pública 2020, 36, e00196120. [Google Scholar] [CrossRef]
- Organização Pan-Americana de Saúde. Dez Ameaças à Saúde Global em 2019. Available online: https://www.paho.org/pt/noticias/17-1-2019-dez-ameacas-saude-que-oms-combatera-em-2019 (accessed on 20 March 2022).
- Sociedade Brasileira de Imunização. Especialistas se Reúnem para Debater o Fenômeno da Hesitação Vacinal no Brasil. Available online: https://sbim.org.br/noticias/1619-especialistas-se-reunem-para-debater-o-fenomeno-da-hesitacao-vacinal-no-brasil (accessed on 25 March 2022).
- Google Noticias. Coronavírus (COVID_19). Available online: https://news.google.com/covid19/map?hl=pt-BR&gl=BR&ceid=BR%3Apt-419 (accessed on 5 June 2022).
- Johns Hopking. Vaccination Progress across the World. Available online: https://coronavirus.jhu.edu/vaccines/international (accessed on 25 June 2022).
- Nexo Jornal. Como Bolsonaro Atacou e Atrasou a Vacinação na Pandemia. Available online: https://www.nexojornal.com.br/expresso/2021/03/21/Como-Bolsonaro-atacou-e-atrasou-a-vacina%C3%A7%C3%A3o-na-pandemia (accessed on 10 June 2022).
- Unicamp. Negacionismo na Pandemia: A Virulência da Ignorância. Available online: https://www.unicamp.br/unicamp/noticias/2021/04/14/negacionismo-na-pandemia-virulencia-da-ignorancia (accessed on 10 June 2022).
- Wilson, K.; Brownstein, J.S. Early detection of disease outbreaks using the Internet. Can. Méd. Assoc. J. 2009, 180, 829–831. [Google Scholar] [CrossRef]
- Arora, V.S.; Mckee, M.; Stuckler, D. Google Trends: Opportunities and limitations in health and health policy research. Health Policy 2019, 123, 338–341. [Google Scholar] [CrossRef]
- Mangono, T.; Smittenaar, P.; Caplan, Y.; Huang, V.H.; Sutermaster, S.; Kemp, H.; Sgaier, S.H. Information-Seeking Patterns During the COVID-19 Pandemic Across the United States: Longitudinal Analysis of Google Trends Data. J. Med. Internet Res. 2021, 23, e22933. [Google Scholar] [CrossRef]
- Rovetta, A.; Bhagavathula, A.S. COVID-19-Related Web search behaviors and infodemic attitudes in Italy: Infodemiological Study. JMIR Public Health Surveill 2020, 6, e19374. [Google Scholar] [CrossRef]
- Ceron, W.; Sanseverino, G.G.; Santos, M.L.; Quiles, M.G. COVID-19 fake news diffusion across Latin America. Soc. Netw. Anal. Min. 2021, 11, 47. [Google Scholar] [CrossRef]
- Custodio, M.; Peñaloza, R.; Alvarado, J.; Chanamé, F.; Maldonado, E. Surface Water Quality in the Mantaro River Watershed Assessed after the Cessation of Anthropogenic Activities Due to the COVID-19 Pandemic. Pol. J. Environ. Stud. 2021, 30, 3005–3018. [Google Scholar] [CrossRef]
- Silva, R.M.; Mendes, C.F.; Manchein, C. Scrutinizing the heterogeneous spreading of COVID-19 outbreak in Brazilian territory. Phys. Biol. 2021, 18, 025002. [Google Scholar] [CrossRef]
- Shafiq, A.; Çolak, A.B.; Sindhu, T.N.; Lone, S.A.; Alsubie, A.; Jarad, F. Comparative study of artificial neural network versus parametric method in COVID-19 data analysis. Results Phys. 2022, 38, 105613. [Google Scholar] [CrossRef]
- Shafiq, A.; Sindhu, T.N.; Alotaibi, N. A novel extended model with versatile shaped failure rate: Statistical inference with F-19 applications. Results Phys. 2022, 36, 105398. [Google Scholar] [CrossRef]
- James, N.; Menzies, M.; Bondell, H. Comparing the dynamics of COVID-19 infection and mortality in the United States, India, and Brazil. Phys. D Nonlinear Phenom. 2022, 432, 133158. [Google Scholar] [CrossRef]
- James, N.; Menzies, M. COVID-19 in the United States: Trajectories and second surge behavior. Chaos Interdiscip. J. Nonlinear Sci. 2020, 30, 091102. [Google Scholar] [CrossRef]
- Harb, M.A.; Silva, L.; Vijaykumar, N.L.; Silva, M.S.; Francês, C.R. An Analysis of the Deleterious Impact of the Infodemic during the COVID-19 Pandemic in Brazil: A Case Study Considering Possible Correlations with Socioeconomic Aspects of Brazilian Demography. Int. J. Environ. Res. Public Health 2022, 19, 3208. [Google Scholar] [CrossRef]
- Braz, A.M.; Oliveira, I.J.; Cavalcanti, L.C.; Almeida, A.C.; Chávez, E.S. Cluster Analysis for Landscape Typology. Mercator 2020, 19, e19011. [Google Scholar] [CrossRef]
- OpenDataSUS. Registros de Vacinação COVID19. Available online: https://opendatasus.saude.gov.br/dataset/covid-19-vacinacao/resource/5093679f-12c3-4d6b-b7bd-07694de54173 (accessed on 15 March 2022).
- Painel Coronavírus. Dados COVID-19. Available online: https://covid.saude.gov.br/ (accessed on 16 March 2022).
- Painéis de Dados ANATEL. Banda Larga Fixa. Available online: https://informacoes.anatel.gov.br/paineis/acessos/bandalarga-fixa (accessed on 15 March 2022).
- Trends. Veja o Que o Mundo está pesquisando. Available online: https://trends.google.com.br/trends/?geo=BR (accessed on 22 March 2022).
- Rovetta, A.; Bhagavathula, A.S. Global Infodemiology of COVID-19: Analysis of Google Web searches and instagram hashtags. J. Med. Internet Res. 2020, 22, e20673. [Google Scholar] [CrossRef]
- Agência da Hora. Top 5 Fake News Mais Absurdas Sobre a Vacina. Available online: https://www.ufsm.br/midias/experimental/agencia-da-hora/2021/11/11/top-5-fake-news-mais-absurdas-sobre-a-vacina/ (accessed on 1 March 2022).
- Diaz, L.C. The Lies That Are Told against Vaccines for COVID-19. Available online: https://www.revistaquestaodeciencia.com.br/artigo/2022/01/13/mentiras-que-se-contam-contra-vacinas-para-covid-19 (accessed on 4 March 2022).
- Brasil de Fato. Você não vai se Transformar em Jacaré: 10 Mentiras Sobre Vacinas que Circulam por aí. Available online: https://www.brasildefato.com.br/2020/12/19/voce-nao-vai-se-transformar-em-jacare-10-mentiras-sobre-vacinas-que-circulam-por-ai (accessed on 2 March 2022).
- Silva, R. De “Jacaré” a “Vacina do Doria”: Relembre Frases de Bolsonaro Sobre Vacinação. Available online: https://www.agazeta.com.br/es/politica/de-jacare-a-vacina-do-doria-relembre-frases-de-bolsonaro-sobre-vacinacao-0121 (accessed on 5 April 2021).
- Patel, V.R.; Mehta, R.G. Impact of Outlier Removal and Normalization Approach in Modified k-Means Clustering Algorithm. Int. J. Comput. Sci. Issues 2011, 8, 331. Available online: https://www.ijcsi.org/articles/Impact-of-outlier-removal-and-normalization-approach-in-modified-kmeans-clustering-algorithm.php (accessed on 7 April 2022).
- De Barros Vilela, G., Jr. Estatística: Teste Z (ou Escore Padronizado). Available online: http://www.cpaqv.org/estatistica/teste_z.pdf (accessed on 1 May 2022).
- Fávero, L.L.; Belfiore, P.P.; Silva, F.L.; Chan, B.L. Análise de Dados: Modelagem MULTIVARIADA para Tomada de Decisões; Elsevier: Amsterdam, The Netherlands, 2009; ISBN 8535230467. [Google Scholar]
- Metz, J. Interpretação de Clusters Gerados por Algoritmos de Clustering Hierárquico. Master’s Thesis, Instituto de Ciências Matemáticas e de Computação, Universidade de São Paulo (USP), São Carlos, Brazil, 2006. [Google Scholar] [CrossRef]
- Machado, R.L. Desenvolvimento de um Algoritmo Imunológico para Agrupamento de Dados. Bachelor’s Thesis, Universidade de Caxias do Sul, Caxias do Sul, Brazil, 2011. Available online: https://repositorio.ucs.br/handle/11338/1486 (accessed on 20 April 2022).
- Berkhin, P. Survey of Clustering Data Mining Techniques; Accruel Software: San Jose, CA, USA, 2006; Available online: https://faculty.cc.gatech.edu/~isbell/classes/reading/papers/berkhin02survey.pdf (accessed on 1 May 2022).
- Vicini, L. Análise Multivariada da Teoria à Prática. Available online: http://w3.ufsm.br/adriano/livro/Caderno%20dedatico%20multivariada%20-%20LIVRO%20FINAL%201.pdf (accessed on 20 April 2022).
- Rohlf, F.J. Adaptative hierarquical clustering schemes. Syst. Zool. 1970, 19, 58–82. [Google Scholar] [CrossRef]
- Kodinariya, T.M.; Makwana, P.R. Review on Determining Number of Cluster in K-Means Clustering. Int. J. Adv. Res. Comput. Sci. Manag. Stud. 2013, 1, 2321–7782. [Google Scholar]
- Syakur, M.A.; Khotimah, B.K.; Rochman, E.M.; Satoto, B.D. Integration K-Means clustering method and elbow method for identification of the best customer profile cluster. Conf. Ser. Mater. Sci. Eng. 2018, 336, 012017. Available online: https://iopscience.iop.org/article/10.1088/1757-899X/336/1/012017 (accessed on 20 April 2022). [CrossRef]
- IBGE Educa. Uso de Internet, Televisão e Celular no Brasil. Available online: https://educa.ibge.gov.br/jovens/materias-especiais/20787-uso-de-internet-televisao-e-celular-no-brasil.html (accessed on 10 April 2022).
- Fundação Oswaldo Cruz. COVID-19: Balanço de dois anos da Pandemia Aponta Vacinação como Prioridade. Available online: https://portal.fiocruz.br/noticia/covid-19-balanco-de-dois-anos-da-pandemia-aponta-vacinacao-como-prioridade (accessed on 11 April 2022).
- Souto, E.P.; Kabad, J. Hesitação vacinal e os desafios para enfrentamento da pandemia de COVID-19 em idosos no Brasil. Rev. Bras. Geriatr. Gerontol. 2020, 23, e210032. [Google Scholar] [CrossRef]
- IBGE População. Projeção da População do Brasil e das Unidades da Federação. Available online: https://www.ibge.gov.br/apps/populacao/projecao/index.html (accessed on 6 June 2022).
- Agência da Hora. Por que a Vacinação Contra COVID-19 no Brasil não Segue o Ritmo de Campanhas Anteriores? Available online: https://www.ufsm.br/midias/experimental/agencia-da-hora/2021/05/10/por-que-a-vacinacao-contra-covid-19-no-brasil-nao-segue-o-ritmo-de-campanhas-anteriores/ (accessed on 6 June 2022).
- BBC News. 3 Erros que Levaram à Falta de Vacinas Contra COVID-19 no Brasil. Available online: https://www.bbc.com/portuguese/brasil-56160026 (accessed on 6 June 2022).
- Estabel, L.B.; Luce, B.F.; Santini, L.A. Idosos, fake news e letramento informacional. Rev. Bras. Bibliotecon. Doc. 2020, 16, 1–15. Available online: https://rbbd.febab.org.br/rbbd/article/view/1348/1206 (accessed on 2 June 2022).
- Yabrude, A.Z.; Souza, A.M.; Campos, C.W.; Bohn, L.; Tiboni, M. Desafios das Fake News com Idosos durante Infodemia sobre COVID-19: Experiência de Estudantes de Medicina. Rev. Bras. Educ. Med. 2020, 44, e0140. [Google Scholar] [CrossRef]


| Name Variable | Type | Value |
|---|---|---|
| state | text | Brazilian State |
| number12_17 | number | Age range 12 to 17 1 |
| number18_64 | number | Age range 18 to 64 1 |
| number65_69 | number | Age range 65 to 69 1 |
| number70_74 | number | Age range 70 to 74 1 |
| number75_79 | number | Age range 75 to 79 1 |
| number80_ | number | Age over 80 |
| medCasosNovos | number | New COVID-19 cases, on average, per day |
| medObitosNovos | number | COVID-19 deaths, on average, per day |
| densblf | number | Density of fixed broadband 2 |
| denstm | number | Density of mobile phone 3 |
| infodemia | number | Relative volume of research for infodemic terms |
| Methods | CCC | Cluster Number | Cut Dendrogram |
|---|---|---|---|
| Average | 0.887 | 6 | 3.1 |
| Centroid | 0.884 | 6 | 2.5 |
| Complete | 0.734 | 7 | 3.6 |
| Single | 0.808 | 7 | 1.6 |
| Ward | 0.647 | 6 | 5.0 |
Publisher’s Note: MDPI stays neutral with regard to jurisdictional claims in published maps and institutional affiliations. |
© 2022 by the authors. Licensee MDPI, Basel, Switzerland. This article is an open access article distributed under the terms and conditions of the Creative Commons Attribution (CC BY) license (https://creativecommons.org/licenses/by/4.0/).
Share and Cite
Harb, M.d.P.; Silva, L.; Ayass, T.; Vijaykumar, N.; Silva, M.; Francês, C.R. Dendrograms for Clustering in Multivariate Analysis: Applications for COVID-19 Vaccination Infodemic Data in Brazil. Computation 2022, 10, 166. https://doi.org/10.3390/computation10090166
Harb MdP, Silva L, Ayass T, Vijaykumar N, Silva M, Francês CR. Dendrograms for Clustering in Multivariate Analysis: Applications for COVID-19 Vaccination Infodemic Data in Brazil. Computation. 2022; 10(9):166. https://doi.org/10.3390/computation10090166
Chicago/Turabian StyleHarb, Maria da Penha, Lena Silva, Thalita Ayass, Nandamudi Vijaykumar, Marcelino Silva, and Carlos Renato Francês. 2022. "Dendrograms for Clustering in Multivariate Analysis: Applications for COVID-19 Vaccination Infodemic Data in Brazil" Computation 10, no. 9: 166. https://doi.org/10.3390/computation10090166
APA StyleHarb, M. d. P., Silva, L., Ayass, T., Vijaykumar, N., Silva, M., & Francês, C. R. (2022). Dendrograms for Clustering in Multivariate Analysis: Applications for COVID-19 Vaccination Infodemic Data in Brazil. Computation, 10(9), 166. https://doi.org/10.3390/computation10090166