
Secure Medical Image Transmission Scheme Using Lorenz’s Attractor Applied in Computer Aided Diagnosis for the Detection of Eye Melanoma


Abstract
:1. Introduction
2. Proposed Diagnosis and Encryption System
Diagnostic Using Deep Convolutional Neural Network
3. Security Techniques
Encryption Process
4. Results
4.1. Sensibility in the Key
4.2. Metrics
5. Discussion
6. Conclusions
Author Contributions
Funding
Institutional Review Board Statement
Informed Consent Statement
Data Availability Statement
Acknowledgments
Conflicts of Interest
References
- Wang, L.; Wang, X.L.; Yuan, K.H. Design and implementation of remote medical image reading and diagnosis system based on cloud services. In Proceedings of the 2013 IEEE International Conference on Medical Imaging Physics and Engineering, Shenyang, China, 19–20 October 2013; pp. 341–347. [Google Scholar] [CrossRef]
- Coatrieux, G.; Puentes, J.; Roux, C.; Lamard, M.; Daccache, W. A Low Distorsion and Reversible Watermark: Application to Angiographic Images of the Retina. In Proceedings of the 2005 IEEE Engineering in Medicine and Biology 27th Annual Conference, Shanghai, China, 17–18 January 2005; pp. 2224–2227. [Google Scholar] [CrossRef]
- Coatrieux, G.; Le Guillou, C.; Cauvin, J.M.; Roux, C. Reversible Watermarking for Knowledge Digest Embedding and Reliability Control in Medical Images. IEEE Trans. Inf. Technol. Biomed. 2009, 13, 158–165. [Google Scholar] [CrossRef] [PubMed]
- Ahmad, A. Evaluation of Modified Categorical Data Fuzzy Clustering Algorithm on the Wisconsin Breast Cancer Dataset. Scientifica 2016, 2016, 4273813. [Google Scholar] [CrossRef] [PubMed]
- Amin, J.; Sharif, M.; Yasmin, M. A Review on Recent Developments for Detection of Diabetic Retinopathy. Scientifica 2016, 2016, 6838976. [Google Scholar] [CrossRef]
- Lu, X. A Cooperative Telemedicine Environment for Stomatological Medical Diagnosis. In Proceedings of the 2006 IEEE International Conference on Mechatronics and Automation, Luoyang, China, 25–28 June 2006. [Google Scholar]
- Ouyang, H.B.; Liu, S.; You, L.; Huang, W.H.; Zhong, S.Z. Study on the new design of computer-aided diagnosis system. In Proceedings of the 2009 IEEE International Symposium on IT in Medicine Education, Jinan, China, 14–16 August 2009; Volume 1, pp. 50–55. [Google Scholar] [CrossRef]
- Abadi, M.; Agarwal, A.; Barham, P.; Brevdo, E.; Chen, Z.; Citro, C.; Corrado, G.; Davis, A.; Dean, J.; Devin, M.; et al. TensorFlow: Large-Scale Machine Learning on Heterogeneous Distributed Systems. arXiv 2015, arXiv:1603.04467. [Google Scholar]
- Ciprian, C.; Masychev, K.; Ravan, M.; Manimaran, A.; Deshmukh, A. Diagnosing Schizophrenia Using Effective Connectivity of Resting-State EEG Data. Algorithms 2021, 14, 139. [Google Scholar] [CrossRef]
- Alorf, A. The Practicality of Deep Learning Algorithms in COVID-19 Detection: Application to Chest X-ray Images. Algorithms 2021, 14, 183. [Google Scholar] [CrossRef]
- Villavicencio, C.N.; Macrohon, J.J.E.; Inbaraj, X.A.; Jeng, J.H.; Hsieh, J.G. COVID-19 Prediction Applying Supervised Machine Learning Algorithms with Comparative Analysis Using WEKA. Algorithms 2021, 14, 201. [Google Scholar] [CrossRef]
- Böcking, A.; Friedrich, D.; Schramm, M.; Palcic, B.; Erbeznik, G. DNA Karyometry for Automated Detection of Cancer Cells. Cancers 2022, 14, 4210. [Google Scholar] [CrossRef]
- Akande, O.N.; Abikoye, O.C.; Kayode, A.A.; Lamari, Y. Implementation of a Framework for Healthy and Diabetic Retinopathy Retinal Image Recognition. Scientifica 2020, 2020, 4972527. [Google Scholar] [CrossRef]
- Garde, G.; Larumbe-Bergera, A.; Bossavit, B.; Porta, S.; Cabeza, R.; Villanueva, A. Low-Cost Eye Tracking Calibration: A Knowledge-Based Study. Sensors 2021, 21, 5109. [Google Scholar] [CrossRef]
- Avilés-Rodríguez, G.J.; Nieto-Hipólito, J.I.; Cosío-León, M.d.l.A.; Romo-Cárdenas, G.S.; Sánchez-López, J.d.D.; Radilla-Chávez, P.; Vázquez-Briseño, M. Topological Data Analysis for Eye Fundus Image Quality Assessment. Diagnostics 2021, 11, 1322. [Google Scholar] [CrossRef] [PubMed]
- Aziz, T.; Ilesanmi, A.E.; Charoenlarpnopparut, C. Efficient and Accurate Hemorrhages Detection in Retinal Fundus Images Using Smart Window Features. Appl. Sci. 2021, 11, 6391. [Google Scholar] [CrossRef]
- Rahman, Z.A.S.A.; Jasim, B.H.; Al-Yasir, Y.I.A.; Abd-Alhameed, R.A. High-Security Image Encryption Based on a Novel Simple Fractional-Order Memristive Chaotic System with a Single Unstable Equilibrium Point. Electronics 2021, 10, 3130. [Google Scholar] [CrossRef]
- Almatroud, O.A.; Tamba, V.K.; Grassi, G.; Pham, V.T. An Oscillator without Linear Terms: Infinite Equilibria, Chaos, Realization, and Application. Mathematics 2021, 9, 3315. [Google Scholar] [CrossRef]
- El-Latif, A.A.A.; Ramadoss, J.; Abd-El-Atty, B.; Khalifa, H.S.; Nazarimehr, F. A Novel Chaos-Based Cryptography Algorithm and Its Performance Analysis. Mathematics 2022, 10, 2434. [Google Scholar] [CrossRef]
- Rahman, Z.A.S.A.; Jasim, B.H.; Al-Yasir, Y.I.A.; Abd-Alhameed, R.A. Efficient Colour Image Encryption Algorithm Using a New Fractional-Order Memcapacitive Hyperchaotic System. Electronics 2022, 11, 1505. [Google Scholar] [CrossRef]
- Liu, Z.; Li, J.; Di, X. A New Hyperchaotic 4D-FDHNN System with Four Positive Lyapunov Exponents and Its Application in Image Encryption. Entropy 2022, 24, 900. [Google Scholar] [CrossRef]
- Li, L.; Abd El-Latif, A.A.; Jafari, S.; Rajagopal, K.; Nazarimehr, F.; Abd-El-Atty, B. Multimedia Cryptosystem for IoT Applications Based on a Novel Chaotic System around a Predefined Manifold. Sensors 2022, 22, 334. [Google Scholar] [CrossRef]
- Santos, D.F.; Barrera Amaya, I.; Suárez Parra, C.A. Encryption algorithm for color Images based on chaotic systems. Ingeniería 2020, 25, 144–161. [Google Scholar] [CrossRef]
- Santos, D.F. Chaos-based Digital Image Encryption Using Unique Iris Features. Int. J. Appl. Eng. Res. 2020, 15, 358–363. [Google Scholar] [CrossRef]
- Santos, D.F.; Espitia, H.E. Detection of Uveal Melanoma using fuzzy and neural networks classifiers. Telkomnika 2020, 18, 2213–2223. [Google Scholar] [CrossRef]
- Santos, D.F.; Espitia, H.E. Proposal for a Neuro-Fuzzy System for Uveal Melanoma Detection. J. Eng. Appl. Sci. 2021, 16, 523–531. [Google Scholar]
- Sodhi, B.; Agrawal, A.; Prabhakar, T.V. Appification of web applications: Architectural aspects. In Proceedings of the 2012 1st IEEE International Conference on Communications in China Workshops (ICCC), Beijing, China, 15–17 August 2012; pp. 1–7. [Google Scholar] [CrossRef]
- New York Eye Cancer Center. Iris Tumors. Available online: https://eyecancer.com/eye-cancer/image-galleries/iris-tumors/ (accessed on 1 February 2021).
- Daniel-Fernando, S.B.; Binh-Minh, N.; Helbert-Eduardo, E. Towards automated eye cancer classification via VGG and ResNet networks using transfer learning. Eng. Sci. Technol. Int. J. 2022, in press. [Google Scholar] [CrossRef]
- Goceri, E. Analysis of Deep Networks with Residual Blocks and Different Activation Functions: Classification of Skin Diseases. In Proceedings of the 2019 Ninth International Conference on Image Processing Theory, Tools and Applications (IPTA), Istanbul, Turkey, 6–9 November 2019. [Google Scholar] [CrossRef]
- He, K.; Zhang, X.; Ren, S.; Sun, J. Deep Residual Learning for Image Recognition. In Proceedings of the 2016 IEEE Conference on Computer Vision and Pattern Recognition (CVPR), Las Vegas, NV, USA, 27–30 June 2016; pp. 770–778. [Google Scholar] [CrossRef]
- Umamageswari, A.; Suresh, G. Security in medical image communication with arnold’s cat map method and reversible watermarking. In Proceedings of the 2013 International Conference on Circuits, Power and Computing Technologies (ICCPCT), Nagercoil, India, 20–21 March 2013; pp. 1116–1121. [Google Scholar] [CrossRef]
- Fu, C.; Tang, J.; Zhou, W.; Liu, W.; Wang, D. A symmetric color image encryption scheme based on chaotic maps. In Proceedings of the 2013 15th IEEE International Conference on Communication Technology, Guilin, China, 17–19 November 2013; pp. 712–716. [Google Scholar] [CrossRef]
- Peng, J.; Jin, S.; Liu, Y. Design and Analysis of an Image Encryption Scheme Based on Chaotic Maps. In Proceedings of the 2010 International Conference on Intelligent Computation Technology and Automation, Changsha, China, 11–12 May 2010. [Google Scholar] [CrossRef]
- Chen, D. A Feasible Chaotic Encryption Scheme for Image. In Proceedings of the 2009 International Workshop on Chaos-Fractals Theories and Applications, Shenyang, China, 6–8 November 2009. [Google Scholar] [CrossRef]
- Mehta, G.; Dutta, M.K.; SooKim, P. Biometric data encryption using 3-D chaotic system. In Proceedings of the 2016 2nd International Conference on Communication Control and Intelligent Systems (CCIS), Mathura, India, 18–20 November 2016. [Google Scholar] [CrossRef]
- Zou, C.; Zhang, Q.; Wei, X.; Liu, C. Image Encryption Based on Improved Lorenz System. IEEE Access 2020, 8, 75728–75740. [Google Scholar] [CrossRef]
- Celİk, K.; Kurt, E. A new image encryption algorithm based on lorenz system. In Proceedings of the 2016 8th International Conference on Electronics, Computers and Artificial Intelligence (ECAI), Ploiesti, Romania, 30 June–2 July 2016; pp. 1–6. [Google Scholar] [CrossRef]
- Abd-El-Hafiz, S.K.; AbdElHaleem, S.H.; Radwan, A.G. Permutation techniques based on discrete chaos and their utilization in image encryption. In Proceedings of the 2016 13th International Conference on Electrical Engineering/Electronics, Computer, Telecommunications and Information Technology (ECTI-CON), Chiang Mai, Thailand, 28 June–1 July 2016. [Google Scholar] [CrossRef]
- Fei, H.; Daheng, G. Two kinds of correlation analysis method attack on implementations of Advanced Encryption Standard software running inside STC89C52 microprocessor. In Proceedings of the 2016 2nd IEEE International Conference on Computer and Communications (ICCC), Chengdu, China, 14–17 October 2016; pp. 1265–1269. [Google Scholar] [CrossRef]
- Patidar, V.; Pareek, N.; Purohit, G.; Sud, K. A robust and secure chaotic standard map based pseudorandom permutation-substitution scheme for image encryption. Opt. Commun. 2011, 284, 4331–4339. [Google Scholar] [CrossRef]
- Ye, R.; Guo, W. An Image Encryption Scheme Based on Chaotic Systems with Changeable Parameters. Int. J. Comput. Netw. Inf. Secur. 2014, 6, 37–45. [Google Scholar] [CrossRef]
- Guo, W.; Wang, X.; He, D.; Cao, Y. Cryptanalysis on a parallel keyed hash function based on chaotic maps. Phys. Lett. A 2009, 373, 3201–3206. [Google Scholar] [CrossRef]
- Oğraş, H.; Türk, M. A Robust Chaos-Based Image Cryptosystem with an Improved Key Generator and Plain Image Sensitivity Mechanism. J. Inf. Secur. 2017, 8, 23–41. [Google Scholar] [CrossRef] [Green Version]
- Özkaynak, F. Role of NPCR and UACI tests in security problems of chaos based image encryption algorithms and possible solution proposals. In Proceedings of the 2017 International Conference on Computer Science and Engineering (UBMK), Antalya, Turkey, 5–8 October 2017; pp. 621–624. [Google Scholar] [CrossRef]
- Shah, D.; Haq, T.U.; Shah, T. Image Encryption Based on Action of Projective General Linear Group on a Galois Field GF(28). In Proceedings of the 2018 International Conference on Applied and Engineering Mathematics (ICAEM), London, UK, 4–6 July 2018; pp. 38–41. [Google Scholar] [CrossRef]
- Elkamchouchi, H.M.; Shawky, M.A.; Takieldeen, A.E.; Fouda, I.; Khalil, M.; Elkomy, A.; AbdElrasol, A. A New Image Encryption Algorithm Combining the Meaning of Location with Output Feedback Mode. In Proceedings of the 2018 10th International Conference on Communication Software and Networks (ICCSN), Chengdu, China, 6–9 July 2018; pp. 521–525. [Google Scholar] [CrossRef]
- CASIA. Iris Database. Available online: http://forensics.idealtest.org (accessed on 1 February 2021).


| Operation | Description |
|---|---|
| Grayscale transformation | Conversion of the color image to grayscale to reduce noise and improve the performance of the following stages. The conversion of a color image to a grayscale image consists of converting RGB values (24 bits) to gray-scale values (8 bits). |
| Apply median filter | This process is performed to apply smoothing, which is achieved by sliding a window over the image, thus suppressing the higher frequencies. It can be seen as a change of the brightness of the input image. |
| Apply thresholding | For the present project, this utilizes mean adaptive thresholding and Gaussian adaptive thresholding to clearly define the borders. The main objective of this step is to provide better definition of the edges. |
| Dilate the image | By applying a morphological operation to reduce noise, dilation allows objects to be expanded, thus potentially filling small holes, in this case reducing pepper noise. |
| Rotation | The image is rotated at a predefined or random angle. In the case of the iris, 360 different rotations can be performed. |
| Zooming | This technique creates new versions of an image with different zoom views, in many cases focusing on the region of interest. The resulting images are enlarged or reduced according to a predefined range. |
| Image | Red | Green | Blue |
|---|---|---|---|
| Figure 5 (Image without ciphering) | 0.996 | 0.996 | 0.995 |
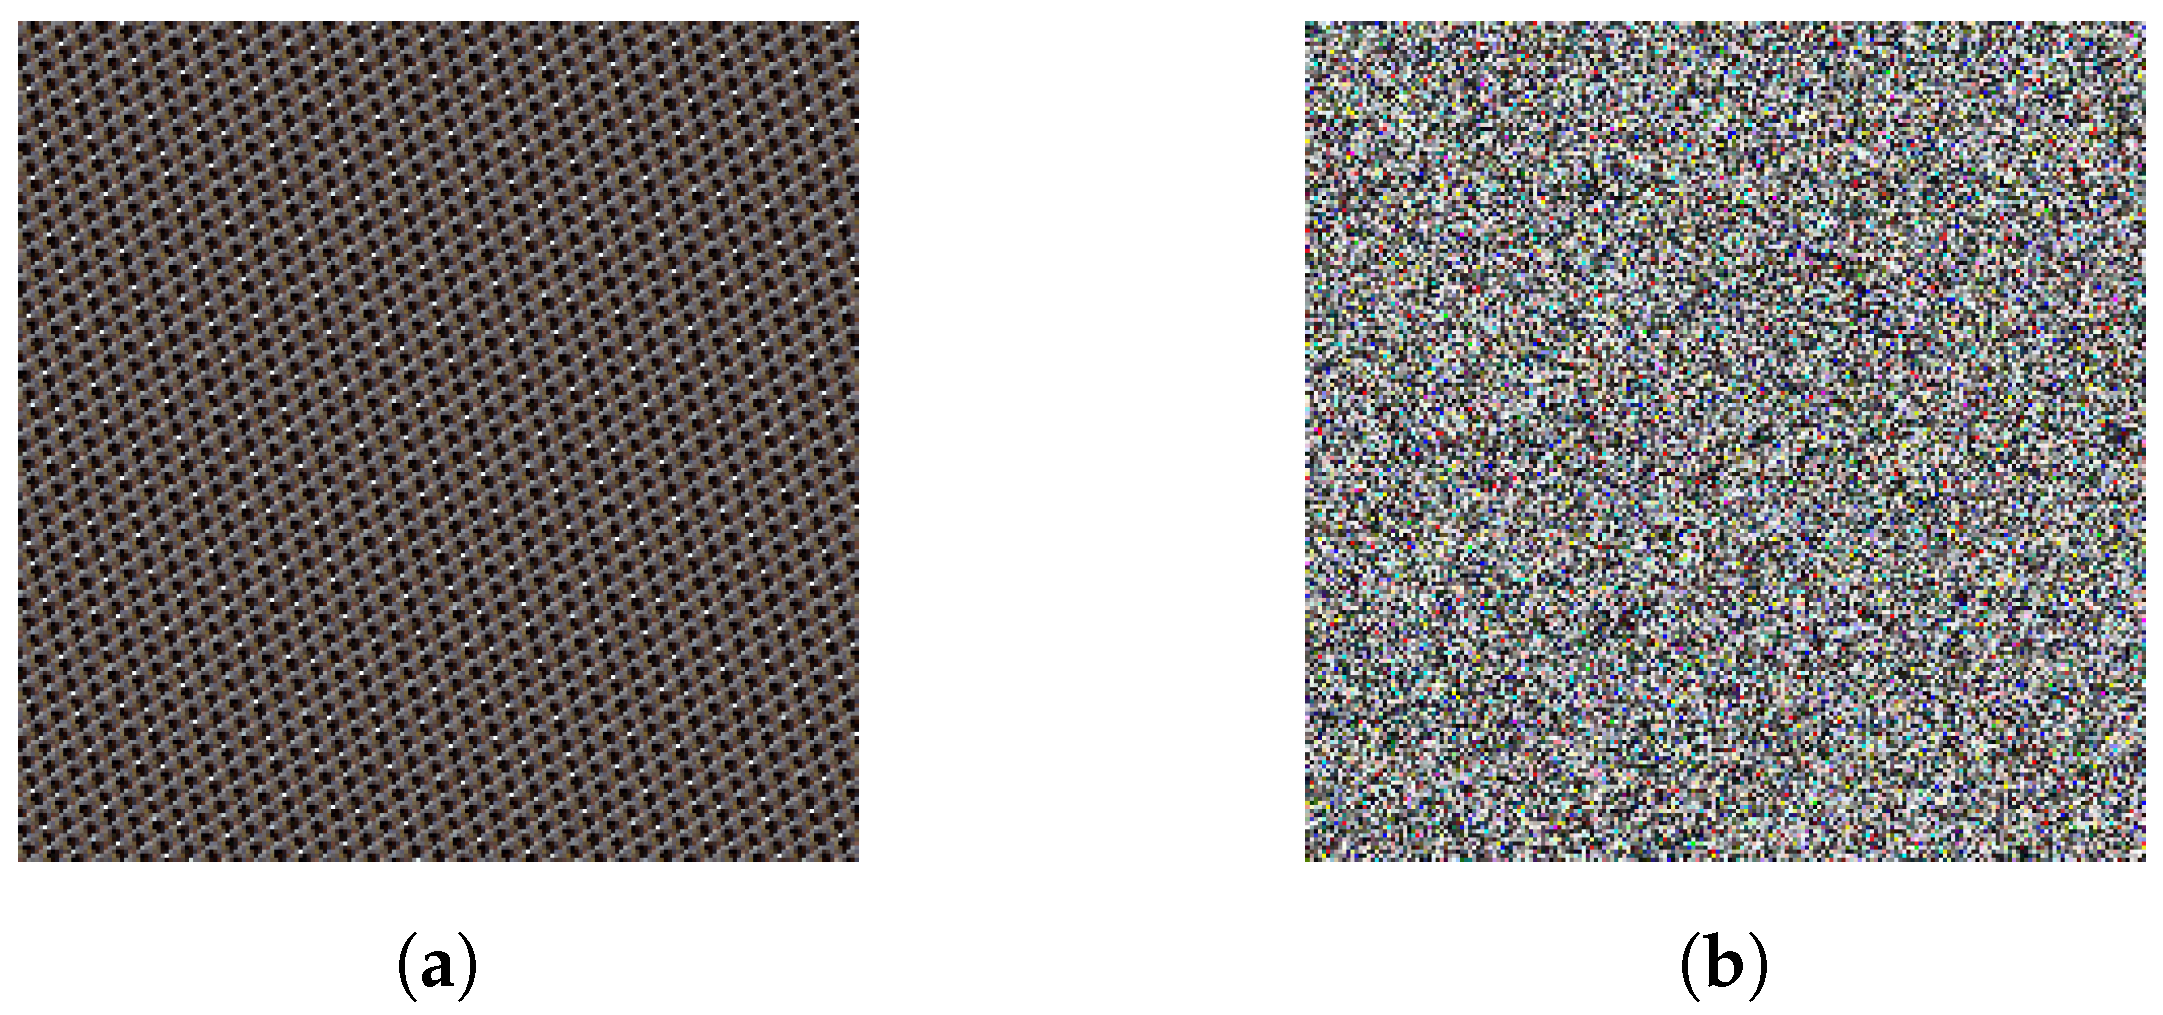
| Figure 11a (Image after Arnold’s map) | 0.314 | 0.276 | 0.274 |
| Figure 11b (Image after Arnold’s map and Lorenz’ attractor) | 0.002 | 0.001 | 0.002 |
| Measure | Red | Green | Blue |
|---|---|---|---|
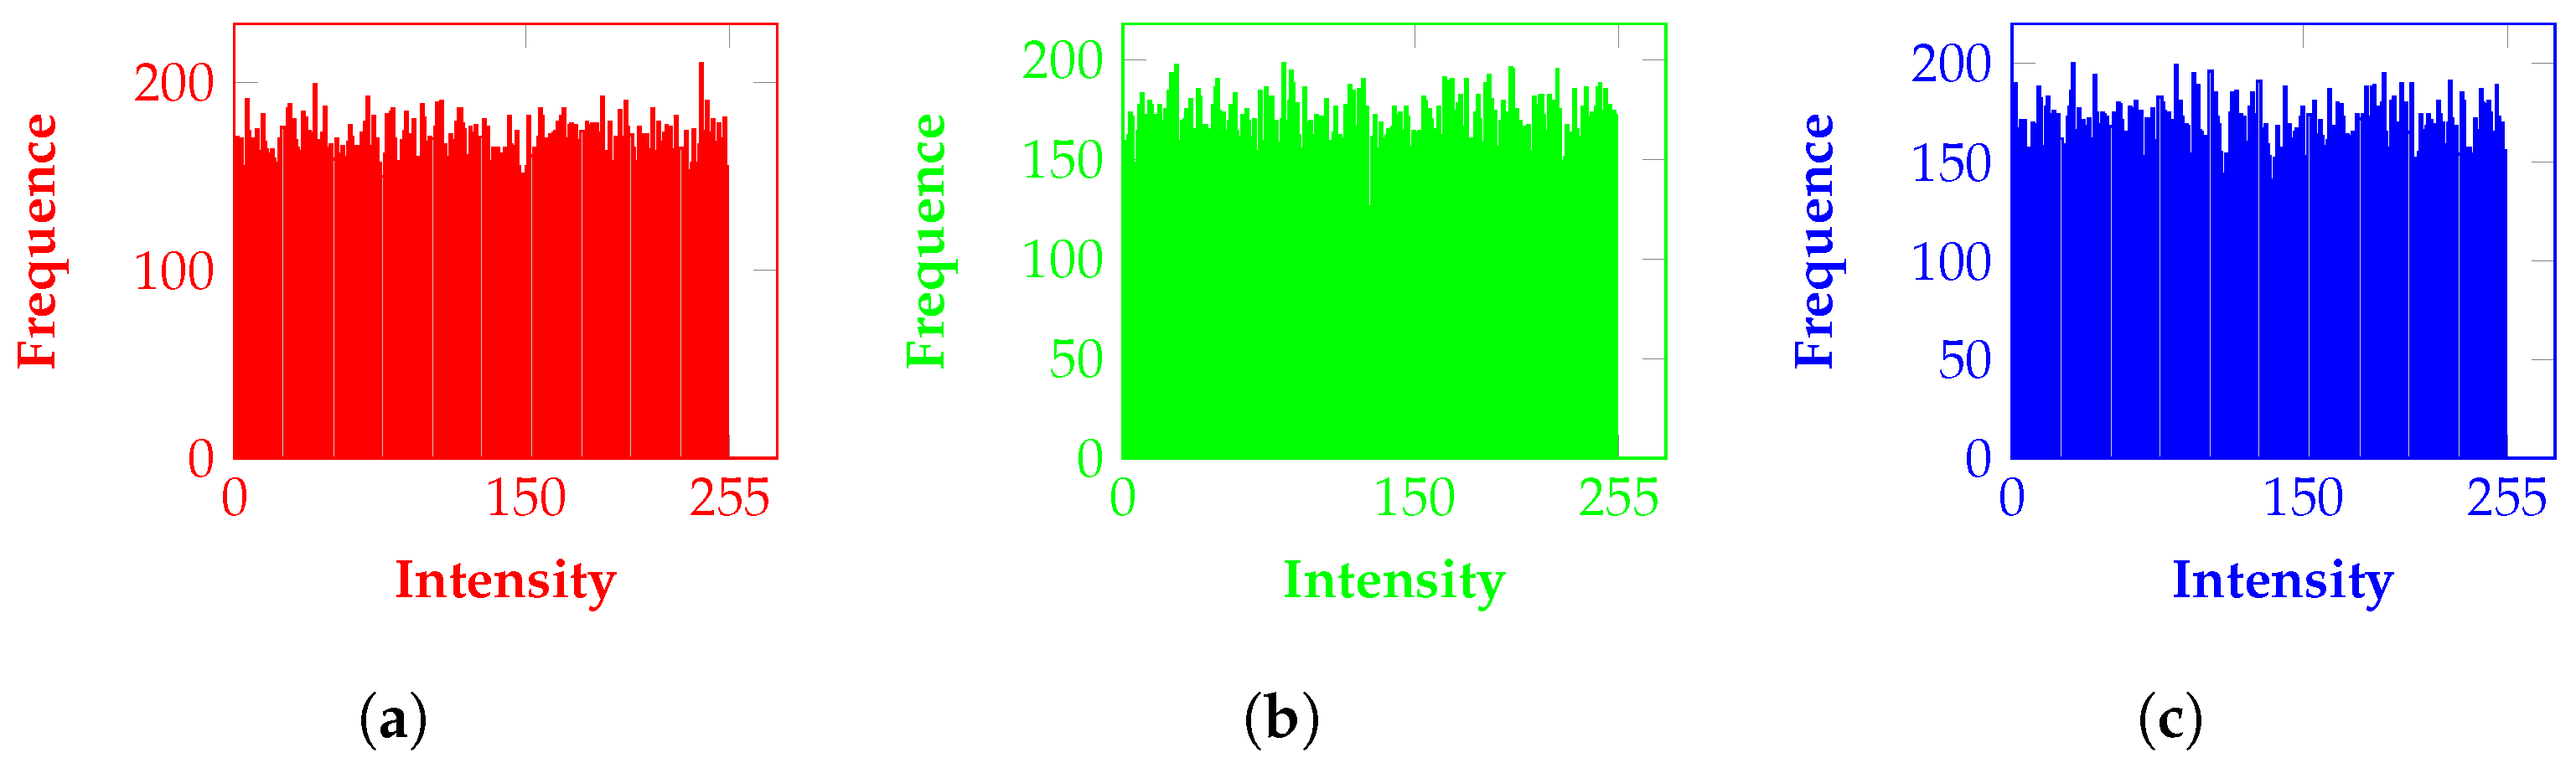
| NPCR | 0.996 | 0.996 | 0.996 |
| UACI | 0.310 | 0.328 | 0.334 |
| Entropy | 7.996 | 7.996 | 7.995 |
| Measure | Median | Standard Deviation | Min | Max |
|---|---|---|---|---|
| NPCR | 0.996 | 0.0004 | 0.994 | 0.997 |
| UACI | 0.296 | 0.0196 | 0.266 | 0.357 |
| Entropy | 7.954 | 0.0022 | 7.949 | 7.961 |
| Research | Images Used | NPCR | UACI | Entropy |
|---|---|---|---|---|
| This work | 145 | 0.9960 | 0.2960 | 7.9540 |
| Reference [17] | 1 | 0.9987 | 0.4996 | 7.9951 |
| Reference [18] | 3 | - | - | 7.9957 |
| Reference [19] | 4 | 0.9961 | 0.3347 | 7.9027–7.9999 |
| Reference [20] | 1 | 0.9981 | 0.3362 | 7.9996 |
| Reference [21] | 3–10 | 0.9961 | 0.3344 | 7.9983 |
| Reference [22] | 4 | 0.9962 | 0.3345 | 7.9993 |
Publisher’s Note: MDPI stays neutral with regard to jurisdictional claims in published maps and institutional affiliations. |
© 2022 by the authors. Licensee MDPI, Basel, Switzerland. This article is an open access article distributed under the terms and conditions of the Creative Commons Attribution (CC BY) license (https://creativecommons.org/licenses/by/4.0/).
Share and Cite
Santos, D.F.; Espitia, H.E. Secure Medical Image Transmission Scheme Using Lorenz’s Attractor Applied in Computer Aided Diagnosis for the Detection of Eye Melanoma. Computation 2022, 10, 158. https://doi.org/10.3390/computation10090158
Santos DF, Espitia HE. Secure Medical Image Transmission Scheme Using Lorenz’s Attractor Applied in Computer Aided Diagnosis for the Detection of Eye Melanoma. Computation. 2022; 10(9):158. https://doi.org/10.3390/computation10090158
Chicago/Turabian StyleSantos, Daniel Fernando, and Helbert Eduardo Espitia. 2022. "Secure Medical Image Transmission Scheme Using Lorenz’s Attractor Applied in Computer Aided Diagnosis for the Detection of Eye Melanoma" Computation 10, no. 9: 158. https://doi.org/10.3390/computation10090158
APA StyleSantos, D. F., & Espitia, H. E. (2022). Secure Medical Image Transmission Scheme Using Lorenz’s Attractor Applied in Computer Aided Diagnosis for the Detection of Eye Melanoma. Computation, 10(9), 158. https://doi.org/10.3390/computation10090158