Article

Evaluation of the Effectiveness of Community Activities Restriction in Containing the Spread of COVID-19 in West Java, Indonesia Using Time-Series Clustering

1
Master’s Program of Mathematics, Faculty of Mathematics and Natural Sciences, Universitas Padjadjaran, Sumedang, Jatinangor 45363, West Java, Indonesia
2
Department of Mathematics, Faculty of Mathematics and Natural Sciences, Universitas Padjadjaran, Sumedang, Jatinangor 45363, West Java, Indonesia
*
Author to whom correspondence should be addressed.
Computation 2022, 10(9), 153; https://doi.org/10.3390/computation10090153
Submission received: 14 August 2022 / Revised: 31 August 2022 / Accepted: 1 September 2022 / Published: 4 September 2022
(This article belongs to the Special Issue Computation to Fight SARS-CoV-2 (CoVid-19))

Abstract

:
The purpose of this research is to classify time-series data on the number of daily COVID-19 cases based on the dynamics. This research aims to evaluate the effectiveness of community activity restrictions in suppressing the number of new cases of COVID-19 in cities and regencies in West Java. We performed time-series clustering on daily positive case data for COVID-19 in 27 cities and regencies in West Java Province, Indonesia for this study. The k-medoids clustering algorithm was used for clustering, with shape-based lock step measures, specifically, the cross correlation-based distance. We used daily new infected cases data for COVID-19 in 27 cities and regencies in West Java Province during the worst situation. We used data from 1 July 2021 to 31 September 2021 and from 1 January 2022 to 31 May 2022, during the Emergency Community Activity Restriction period (PPKM). According to our findings, the optimal number of clusters that could be formed from the data we had was 4 clusters for the first period and 2 clusters for the second period, with silhouette value of 0.2633 and 0.6363, respectively. For the first period, we discovered that PPKM was successful in clusters 1 and 2, namely in 25 cities/districts in West Java, except for Bogor and Depok, while for the second period, we found PPKM to be effective in reducing the number of COVID-19 cases throughout cities and regencies in West Java. This shows there is an improvement from the implementation of PPKM in the first period. We also found that the cluster that was formed was not only influenced by the effectiveness of the PPKM, but also by geography. The closer a city is to a hotspot region for the spread of COVID-19, the earlier the increase in the number of new COVID-19 cases will occur.

1. Introduction

COVID-19 was verified to have been first seen on 2 March 2020, in Indonesia. At the time, two persons had been exposed to COVID-19 through interaction with Japanese residents. This was discovered when a Japanese citizen was diagnosed with the coronavirus after leaving Indonesia and landing in West Java [1]. Since the virus’s first appearance, the number of COVID-19 cases in Indonesia has steadily increased, with 6,054,973 persons affected as of 31 May 2021 [2]. According to the Worldometer, Indonesia is ranked 14th in the world and 4th in Asia for COVID-19 positive cases [3]. West Java is one of Indonesia’s provinces. According to the 2020 population census, West Java has the greatest population in Indonesia, totaling 48,274,162 persons [4]. West Java, being the province with the highest population, is one of the provinces that provide a significant portion of the total number of COVID-19 cases in Indonesia. West Java reported that there have been 1,107,911 confirmed cases of COVID-19 as of 31 October 2021 [5], with a total of 216 active cases.
Figure 1 shows the dynamic of the COVID-19 daily new case in West Java from March 2020 to May 2022. According to Figure 1, the worst of the COVID-19 outbreak in West Java happened between February and March of 2022. At the time, the number of daily COVID-19 cases in West Java Province reached 16,251 cases per day, on 17 February 2022; this kind of significant increase in daily COVID-19 cases happened twice in West Java. Previously, it happened between July and August of 2021. At the time, the number of daily COVID-19 cases in West Java Province reached 11,101 cases per day on 13 July 2021. The government introduced emergency PPKM on 3–25 July 2021, followed by PPKM 4 levels on 26 July–2 August 2021 [6], to reduce the number of daily instances of COVID-19, which climbed rapidly in the period July–August 2021. However, assessing the success of this intervention would be difficult without an analysis that describes how the COVID-19 pandemic will behave. The COVID-19 pandemic has wreaked havoc on infrastructure, the economy, and, most crucially, human lives. Furthermore, the impact of policies implemented may differ in each city and district in West Java Province, depending on how the community views it, the number of first instances when the intervention is implemented, and so on. As a result, it is crucial to conduct a study of the impact of policies enacted by West Java’s cities and regencies. This may be accomplished by grouping cities and regencies with comparable dynamics of daily COVID-19 instances. Cluster analysis can be used to do this.
Cluster analysis is a technique for identifying groups in a data collection in order to gather data in one group that is relatively similar to other groups while having apparent distinctions. Cluster analysis may be applied to time series data, which has somewhat different grouping techniques and algorithms than cross-sectional data. Clustering on time-series data is commonly used to uncover intriguing patterns in a collection of time-series data [7,8]. The clustering of time-series data is classified into two categories: The first group is used to detect patterns that emerge often in the dataset [9]. The second group is a strategy for detecting patterns that appear unexpectedly in a data collection, or patterns that are significantly different from other data in the same dataset [10]. There have been several studies regarding cluster analysis on COVID-19 data.
In 2020, Zarikas et al. [11] conducted time-series clustering on data on COVID-19 cases with country data. Hierarchical analysis was used with the Euclidean distance measure. The variables used are active cases, active cases per population, and active cases per population and per area. Zarikas et al. found that the surface area of each country is a parameter influencing the criticality of the situation, i.e., geography matters. Later in the same year in 2020, Alvarez et al. [12] proposed a clustering method for identifying groups of countries with a similar spread of the coronavirus. The variable of interest is the number of daily infections per country. The method used is a non-parametric method, namely Hierarchical Trees (HT) and the Minimum Spanning Trees (MST). Alvarez et al. found that there were groups of countries with differentiated contagion dynamics, both in the number of contagions and at the time of the greatest transmission of the disease. It is concluded that the actions taken by the countries, the speed at which they were taken, and the number of tests carried out may explain part of the differences in the dynamics of contagion. Abdullah et al. [13] in 2021 conducted a study on time series clustering on Indonesian COVID-19 case data. He used confirmed, death, and recovered cases data of COVID-19 provinces in Indonesia, with the method utilized being K-means clustering. Abdullah et al. found that there were three provincial clusters in Indonesia based on the spread of COVID-19 that occurred. Elsi et al. [14] in 2020 conducted a mapping of Indonesia’s national food security during the COVID-19 pandemic. The method used was K-medoids clustering with the variable of interest, monthly per capita expenditure in urban and rural areas by province, and groups of goods consisting of 33 data records (2011–2018). Elsi et al. found that 42% of Indonesia still has low food security as evidenced by the fulfillment of higher food needs than non-food.
Based on our literature review, we did not find any time-series clustering that specifically discusses the effectiveness of policies taken in an area. Generally, research on time-series clustering in COVID-19 only pays attention to location and compares the dynamics of cases between regions. To evaluate the containment policy for the spread of COVID-19, containment policy needs to be carried out simultaneously between regions, and the type of containment policy used in each area is relatively similar. Moreover, this requires special attention to the type of distance measures used in the clustering process.
In this study, we propose a method to evaluate the effectiveness of COVID-19 containment policies applied to an area. We propose a clustering method using shape-based lock-step distance measures, namely cross-correlation. Cross-correlation is a measure of distance that shows the similarity between datasets. This makes the similarity between time-series data in one cluster maximum and minimizes the similarity between different clusters. In addition, the nature of cross-correlation-based distance, which is a lock-step distance measure, makes the clustering carried out to compare the raw values of the data at the same time frame. The novelty of this research is the usage of shape-based lock-step distance measures in the clustering process. In the context of evaluating policies on handling COVID-19, our proposed method provides a series of clusters that are generated from data on COVID-19 new cases, on the exact date of the case of the same incident across different places. Thus, the resulting cluster can be more accurate in describing the development of COVID-19 cases in each formed cluster because the comparisons were made on the same date for each region.
This study aims to evaluate the effectiveness of implementing community activity restrictions (PPKM) in suppressing the spread of COVID-19 in 27 cities and regencies in West Java. As a result, in this study, we used a cluster analysis with lock step distance measures to determine the impact of the government’s policies on the cities and regencies in West Java. This is a strategic thing to do, because we will be able to create numerous clusters based on the peculiarities of the dynamics of COVID-19. The results of this study can be used by the government to evaluate the effectiveness of containment policies taken in each region and identify structural similarities in the dynamics of COVID-19 that occur in each region. Thus, we hoped that the government will be able to evaluate the effectiveness of the policies taken more objectively and able to formulate better policies in dealing with the spread of COVID-19 with this information.

2. Overview

2.1. Coronavirus Disease 2019 (COVID-19)

SARS-CoV-2 is a virus that infects the respiratory tract and produces the infectious illness COVID-19. The World Health Organization (WHO) initially learned about this new virus on 31 December 2019, in Wuhan, China [15]. Coronavirus is a virus that spreads from animal to animal and can infect people. This virus’s native hosts are bats, although numerous other animal species have been discovered as potential contributors. MERS-CoV can be transferred to humans through camels, but SARS-CoV-1 can be transmitted through civets [16]. A person who tests positive for COVID-19 might experience a wide range of symptoms, from minor aches and pains to major sickness. Symptoms might emerge anywhere between 2 and 14 days after being exposed to the virus. The most common symptoms of COVID-19 infection are fever and cough, however, there are other signs and symptoms to consider [17]. On 11 March 2020, WHO declared COVID-19 a pandemic [15]. According to statistics from China at the time [18], adults, particularly those with congenital defects, have a higher risk of getting infected by severe COVID-19 cases and a higher fatality rate than younger persons. According to data from the European Economic Area/European Union (for countries where data are available), roughly 20–30% of confirmed COVID-19 patients are hospitalized and 2% have severe disease. People with more severe symptoms, on the other hand, are more likely than those with less severe symptoms to get tested. As a result, the real proportion of persons who need to be hospitalized as a percentage of the overall number of infected people is lower than the figures reflect. Those aged 60 and up, as well as those with a congenital illness, are more likely to be hospitalized [19].

2.2. Time-Series Clustering

Clustering is a technique for identifying groups in a data collection to obtain data that are relatively similar in one group and have distinct distinctions between them [20,21]. Time-series clustering is a unique sort of clustering. A temporal sequence is made up of a series of nominal symbols from a certain alphabet, while a time series is made up of a continuous series of real value elements [22]. Because the feature values of time-series data vary with time, they are categorized as dynamic data. This implies that the value of each time-series point is one or more observations made chronologically. Time-series data are a sort of temporal data that contain a lot of dimensions and a lot of spaces [23,24]. Clustering on time-series data is commonly used to uncover intriguing patterns in a collection of time-series data [7,8]. The clustering of time-series data is classified into two categories: The first group is used to detect patterns that emerge often in the dataset [9]. The second group is a strategy for detecting patterns that appear unexpectedly in a data collection, or patterns that are significantly different from other data in the same dataset [10].
In brief, locating clusters of time-series data may help solve real-world issues in a variety of domains, such as identifying dynamic changes in time series and detecting connections across time series [25]. It may be used to locate firms with comparable stock price movements in a financial database, for example. Predictions and recommendations: a hybrid method that combines clustering and per-cluster function approximation can assist users in making predictions and making suggestions [26,27,28]. For example, in scientific databases, this can address difficulties such as predicting today’s patterns by locating the solar magnetic wind. Pattern discovery: searching the database for intriguing patterns. Different daily sales trends of particular items at a store, for example, can be identified in a marketing database. In the phenomenon of COVID-19, time-series clustering has been carried out for creating the home dwell time clusters [29], estimation of the dynamics of COVID-19 in states [30], and also for the COVID-19 pandemic evolution [31]. This study utilizes time-series clustering to locate cities and regencies with comparable dynamics of daily positive COVID-19 instances, as well as how the daily case patterns are with the introduction of community activity restrictions (PPKM).

3. Materials and Methods

3.1. Materials

The study’s research object is daily COVID-19 infected case data from 27 cities and regencies in West Java Province. The data were collected from 1 July 2021 to 31 September 2021 and from 1 January 2022 to 31 May 2022, during the Emergency Community Activity Restriction period (PPKM). Pikobar-West Java COVID-19 Information and Coordination Center [32] was the source of the data used in this study. For data management and visualization, we used R software version 4.1.2 [33]. R is a programming language for statistical computing and graphics created by statisticians Ross Ihaka and Robert Gentleman. Currently, R is supported by the R Core Team and the R Foundation for Statistical Computing based in Vienna, Austria. For data visualization and transformation, we use ggplot2 [34] and reshape [35] packages. As for the time-series clustering process, we use TSdist [36], factoextra [37], and NbClust packages [38].

3.2. Methods

3.2.1. Clustering Daily Positive Case Data Using K-Medoids with Cross-Correlation Based Distance

K-medoids is comparable to clustering or partitioning around medoids (PAM). The k-medoids approach is based on identifying k representative items among the data set’s objects. A representative object, known as a centroid, is used in clustering. The representative object in k-Medoids is also known as the group medoid. K-medoid can be used on objects with very big values that vary from the data distribution to address the difficulty of utilizing k-means. This approach is preferable to most non-hierarchical clustering algorithms based on the minimal value of the sum of the squared estimate of error because it is more resilient (SSE) [39].

3.2.2. Calculating Cross-Correlation Based Distance

Calculating the distance metric utilized in k-medoids is the first step. We employ a distance measure with shape-based lock step distance features in this study. We use this metric to create clusters from raw data values and compare them with the same latency. We employ a distance metric called time-series distance that is based on the cross-correlation between two numerical time series. The distance between two numerical time series based on cross-correlation is determined as follows [40],
d i , j = 1 ρ i , j , 0 2 k = 1 m a x ρ i , j , k 2     ,
where ρ i , j , k 2 shows the cross-correlation between the two-time series xi and yj at lag k   and m a x is the maximum lag.

3.2.3. Determining the Number of Optimal Clusters with Elbow Methods

The elbow method was then used to calculate the number of clusters in this investigation. This approach is useful for calculating the number of clusters that should be used. The user searches for changes in slope to discover the ideal number of clusters using the elbow technique, in which the number of squares in each number of clusters is computed and graphed, and the user looks for changes in slope to determine the optimal number of clusters. The following formula is used to determine the SSE of the elbow method,
S S E = k = 1 k x i S k | | x i c k | | 2   ,
where k   is the number of groups in the algorithm used, x i is the number of data, and c k is the number of cluster members in the k -th cluster. The elbow method examines the proportion of variance expressed as a function of the number of clusters [41]. The basic concept is to pick a point when the increased cost is no longer worth the declining return [42]. This is a visual method, starting with k = 2 , and growing at each step by 1 step, while calculating the clusters and the costs associated with increasing the number of clusters. At some values for   k , the cost drops drastically, and after that it starts to slope, and this is the optimal value of k. The reason is that after the k, when the value of k is increased or the number of clusters is increased, the new clusters that are formed no longer have a significant difference with those that have been created previously, or the new clusters created will be very similar to some of the existing clusters [43].

3.2.4. Clustering Daily Positive Case Data Using K-Medoids

The last step is clustering using k-medoids. The steps for clustering using the k-medoids method are as follows:
(a)
Calculate the distance of each object using cross correlation-based distance with Equation (1).
(b)
Calculate v j for each object j with d i = j = 1 n d i j
v j = i = 1 n d i j d i ,   j = 1 , , n ,
where
                            d i j     : Cross correlation distance matrix elements
                            v j : Standardize the number of rows for each column   j
(c)
Sort v j from smallest to largest. Choose k clusters that have the first smallest v j as the center (medoid).
(d)
Allocate non-medoid objects to the nearest medoid based on the cross correlation-based distance.
(e)
Calculate the total distance from the non-medoid cluster to the center.
(f)
Define a new medoid for each cluster which is an object that minimizes the total distance to other objects in the cluster. Update the existing medoid in each cluster by replacing it with a new medoid obtained from the existing cluster.
(g)
Allocate non-medoid objects to the nearest medoid based on the cross correlation-based distance.
(h)
Calculate the total distance from the non-medoid cluster to the center.
(i)
If the number of new centers differs from the total distance of the cluster centers in the first iteration, change the center (medoid). Otherwise, the iteration is stopped and the result becomes the final cluster.
The number of groups (k) in k-medoids is selected based on the elbow method.

3.3. Cluster Internal Validation

The intrinsic information in the data is utilized to assess the quality of the clustering that has been done in the internal validation of the dataset, which uses the cluster partition as input. The size of the cluster division that represents its compactness, connectivity, and separation is chosen for internal validation [44]. Connectivity is a metric that represents closeness [45]. Separation quantifies the distance between cluster centroids, whereas compactness examines the homogeneity of the clusters produced by looking at intra-cluster variation. Compactness and separation have a trend that shows the opposite trend, so the method that is widely used is to combine the two sizes into one integrated size.
The homogeneity of the clusters created was measured using silhouette width in this study. Silhouette width is a metric that takes into account both compactness and non-linear separation [46]. The average silhouette width for each observation is the average of silhouette value S ( i ) for every i objects that belong to a certain cluster. The silhouette value indicates the amount of confidence in the dataset’s placement in a cluster of specific observations, with a value near to 1 indicating a good cluster and a value close to −1 indicating a bad cluster, with the i-th observation, defined as
S ( i ) = b i a i   max ( b i , a i )   ,
where ai is the average distance between i and all other observations in the same cluster, and b i is the average distance between i and observations in the nearest neighboring cluster, i.e.,
a i = 1 n ( C ( i ) ) j C ( i ) d i s t ( i , j )   ,
b i = m i n C k C \ C ( i ) j C ( i ) d i s t ( i , j ) n ( C k )   ,
where C ( i ) is a cluster containing observations i, d i s t ( I ,   j ) is a measure of the distance used between observations i and j, and n ( C ) is the cardinality of cluster C. After the cluster is validated, then the cluster formed will be investigated and interpreted in accordance with the phenomenon of the implementation of restrictions on community activities (PPKM) that occurred in West Java. The data and syntax used in this research can be accessed at https://github.com/DhikaSuryaP/COVID-19-Clustering-in-West-Java (accessed on 15 July 2022).

4. Results

The k-medoids clustering approach was employed in the cluster analysis of daily positive COVID-19 cases in 27 cities and regencies in West Java, with the distance measure utilized being cross-correlation-based distance. Clustering was carried out in two PPKM periods with the worst COVID-19 case dynamics in West Java.
  • The first clustering period is 1 July 2021–30 September 2021.
  • The second clustering period is 1 January 2022–31 May 2022.

4.1. Optimal Cluster Number Selection

This study used daily COVID-19 positive case data from 27 cities and regencies in West Java Province. The ideal number of clusters for daily positive case data for COVID-19 in 27 cities and regencies in West Java province was determined using the elbow method. Figure 2 depicts the ideal number of clusters for daily COVID-19 positive cases in West Java cities and regencies.
Figure 2 shows that the ideal number of clusters to generate in this study is four clusters for the first clustering period and two clusters for the second clustering period. This is proven by the total change within the sum of the square that occurs begin to dampen, implying that the difference between the total within the sum of the square in the cluster is no longer significant, or that the cluster that is formed no longer has a significant difference after the numbers of clusters are enlarged by more than the ideal number. As a result, the number of clusters produced in this study will be four for the first clustering period and two for the second clustering period.

4.2. Clusters Internal Validation

Table 1 depicts clusters of daily positive COVID-19 cases in 27 West Java cities and regencies.
After getting the temporary cluster in Table 1, we iterated the process three times. The cluster’s outcome did not change until the third iteration. After data on the number of daily COVID-19 cases in 27 cities and regencies in West Java were clustered, the clusters were internally validated. This is done by looking at the silhouette width value to guarantee that the produced cluster is homogeneous. Table 2 displays the silhouette width values together with the number of clusters that have attempted to form.
The highest silhouette width value achieved by the first-period cluster was 0.2633 and the second-period cluster was 0.6363, according to Table 2. This demonstrates that the development of four clusters for the first period and two clusters for the second period in this study was suitable since it demonstrated that the highest degree of confidence in cluster member placement was attained, as in the graph given in Figure 3.
From Figure 3, it can be seen that the highest silhouette value was achieved when the number of clusters formed was four clusters for the first period and two clusters for the second period. After three iterations and internal validation, it was found that Table 1 shows the final cluster for the number of active COVID-19 cases in 27 cities and regencies in West Java, meaning that for clusters that have been formed, further analysis can be done.

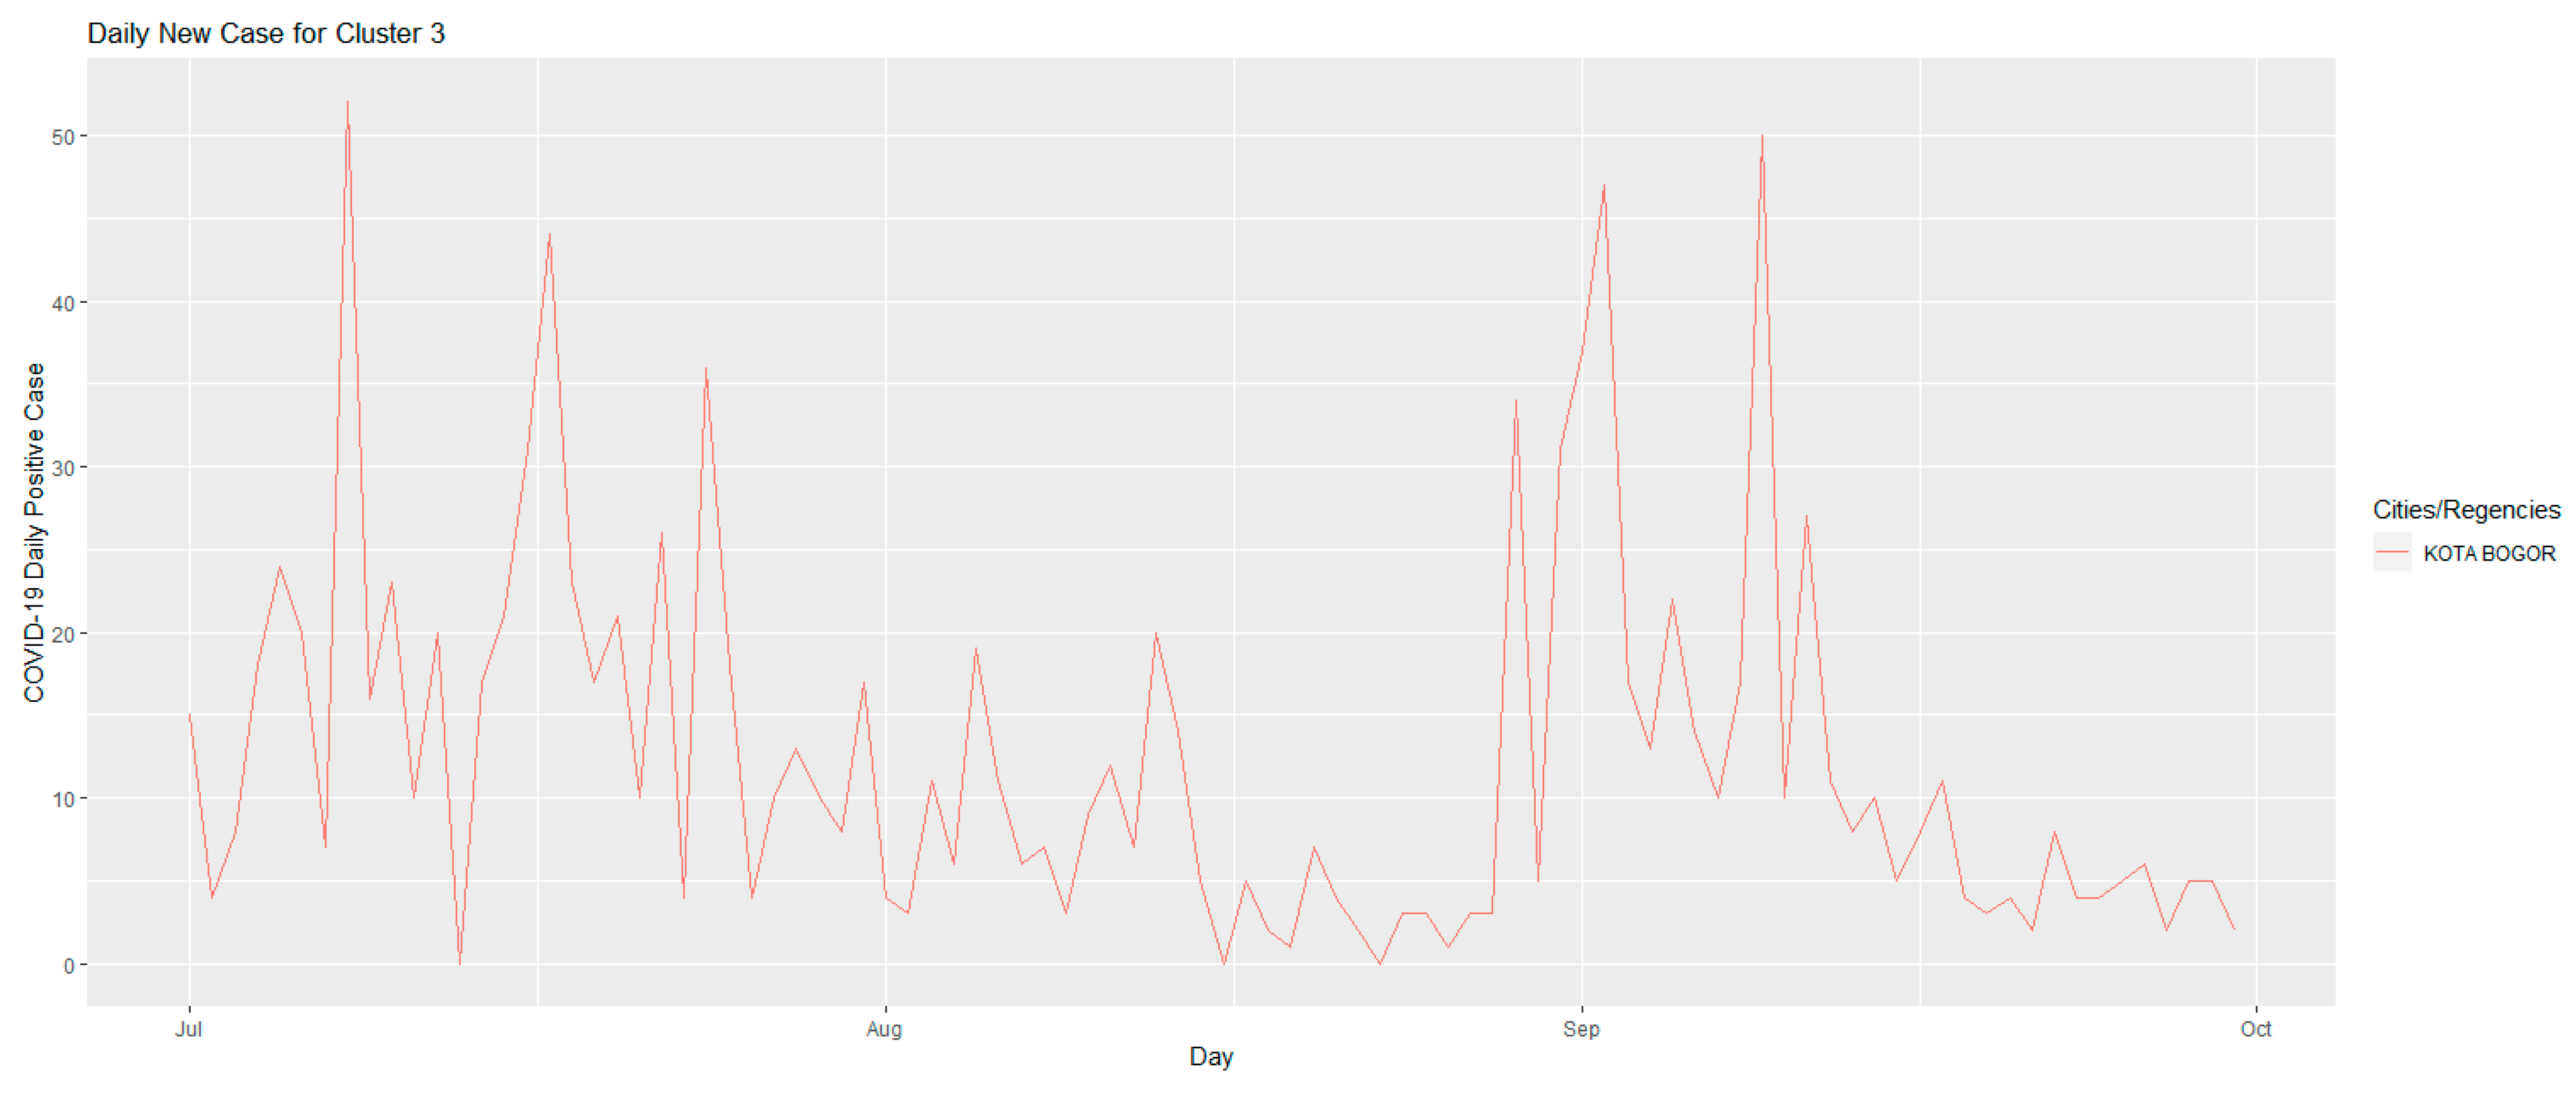
4.3. First Period (1 July 2021–30 September 2021) Clustering Results

Figure 4 shows the development of the number of daily positive cases of COVID-19 in Cluster 1 for the first period.
Figure 4 shows the development of the number of daily positive cases of COVID-19 in Cluster 1 in the period 1 July 2021–30 September 2021. This cluster is the cluster with the most members, namely 14 cities/regencies. Characteristics that can be observed through the graph in this cluster: it can be seen that this cluster is a cluster in which, when the emergency PPKM was implemented, namely on 3 July 2021, the number of daily positive cases of COVID-19 that occurred was increasing. Then, 14 days after the first time the emergency PPKM was carried out, namely on 17 July 2021, in this cluster there were signs of a decrease in daily positive cases of COVID-19. When PPKM 4 Level was implemented, namely 26 July 2021–2 August 2021, in this cluster, almost all cluster members began to experience a significant decrease in cases when compared to the worst conditions that had been experienced before. The last characteristic of this cluster is the steady decline in cases, which continued until 30 September 2021.
Figure 5 shows the development of daily positive cases of COVID-19 in Cluster 2. This cluster consists of 11 cities/regencies for the period 1 July 2021–30 September 2021. Characteristics that can be observed through the graph in this cluster: it can be seen that this cluster is a cluster that, when PPKM starting to be implemented, namely on 3 July 2021, was not experiencing an increase in daily positive cases, different from Cluster 1. This cluster began to experience an increase which began on 13 July 2021, and this lasted until 25 July 2021, then began to experience a steady decline after the Level 4 PPKM began to be implemented, namely on 26 July 2021. In the period August 2021–September 2021, cities and towns and cities districts that are members of Cluster 2 no longer experienced a significant increase in cases, and were steadily decreasing. This indicates that the policies taken were appropriate to reduce the number of daily positive cases of COVID-19 that occurred in Cluster 2, given in Figure 6.
Figure 6 shows the development of daily positive cases of COVID-19 in cluster 3. This cluster is unique because it only consists of one city, namely Bogor City. The unique characteristic that can be observed through the graph in this cluster is that it experienced two peaks, namely when the emergency PPKM was implemented, on 3 July 2021 and in the period 26 August 2021–16 September 2021. This cluster experienced a decrease when the Level 4 PPKM was implemented, namely on 26 July 2021, and continued to decline until 23 August 2021, but what distinguishes this cluster from other clusters is that in this cluster, there was an increase again on 26 August 2021–11 September 2021; then, they again experienced a decrease in cases that continued to occur until 30 September 2021. This cluster is a cluster that experienced a second wave since the emergency PPKM and Level 4 PPKM were implemented. This indicates an ineffective implementation of PPKM in this city, as a given in Figure 6.
Figure 7 shows the development of daily positive cases of COVID-19 in Cluster 4. This cluster is unique because it only consists of one city, the same as Cluster 3, namely Depok City. The unique characteristic that can be observed through the graph in this cluster is that it can be seen that this cluster experiences a peak or worst-case scenario in different periods when compared to other clusters. This cluster peaked on 21 August 2021–26 August 2021, and this happened suddenly. In contrast to other clusters, which in the same period actually decreased, when the emergency PPKM and Level 4 PPKM were implemented, this cluster experienced a fluctuating number of daily positive cases of COVID-19. This cluster experienced a significant decline on 27 August 2021. At that time, the number of daily cases that occurred was 110 cases, very different from the previous day where the number of daily positive cases was 3341 cases. Furthermore, during 28 August 2021–30 September 2021, this cluster experienced a steady decline. This cluster is unique with peaks that occurred at different periods than other clusters, and it occurred very suddenly, which indicates an ineffective implementation of PPKM in this city.

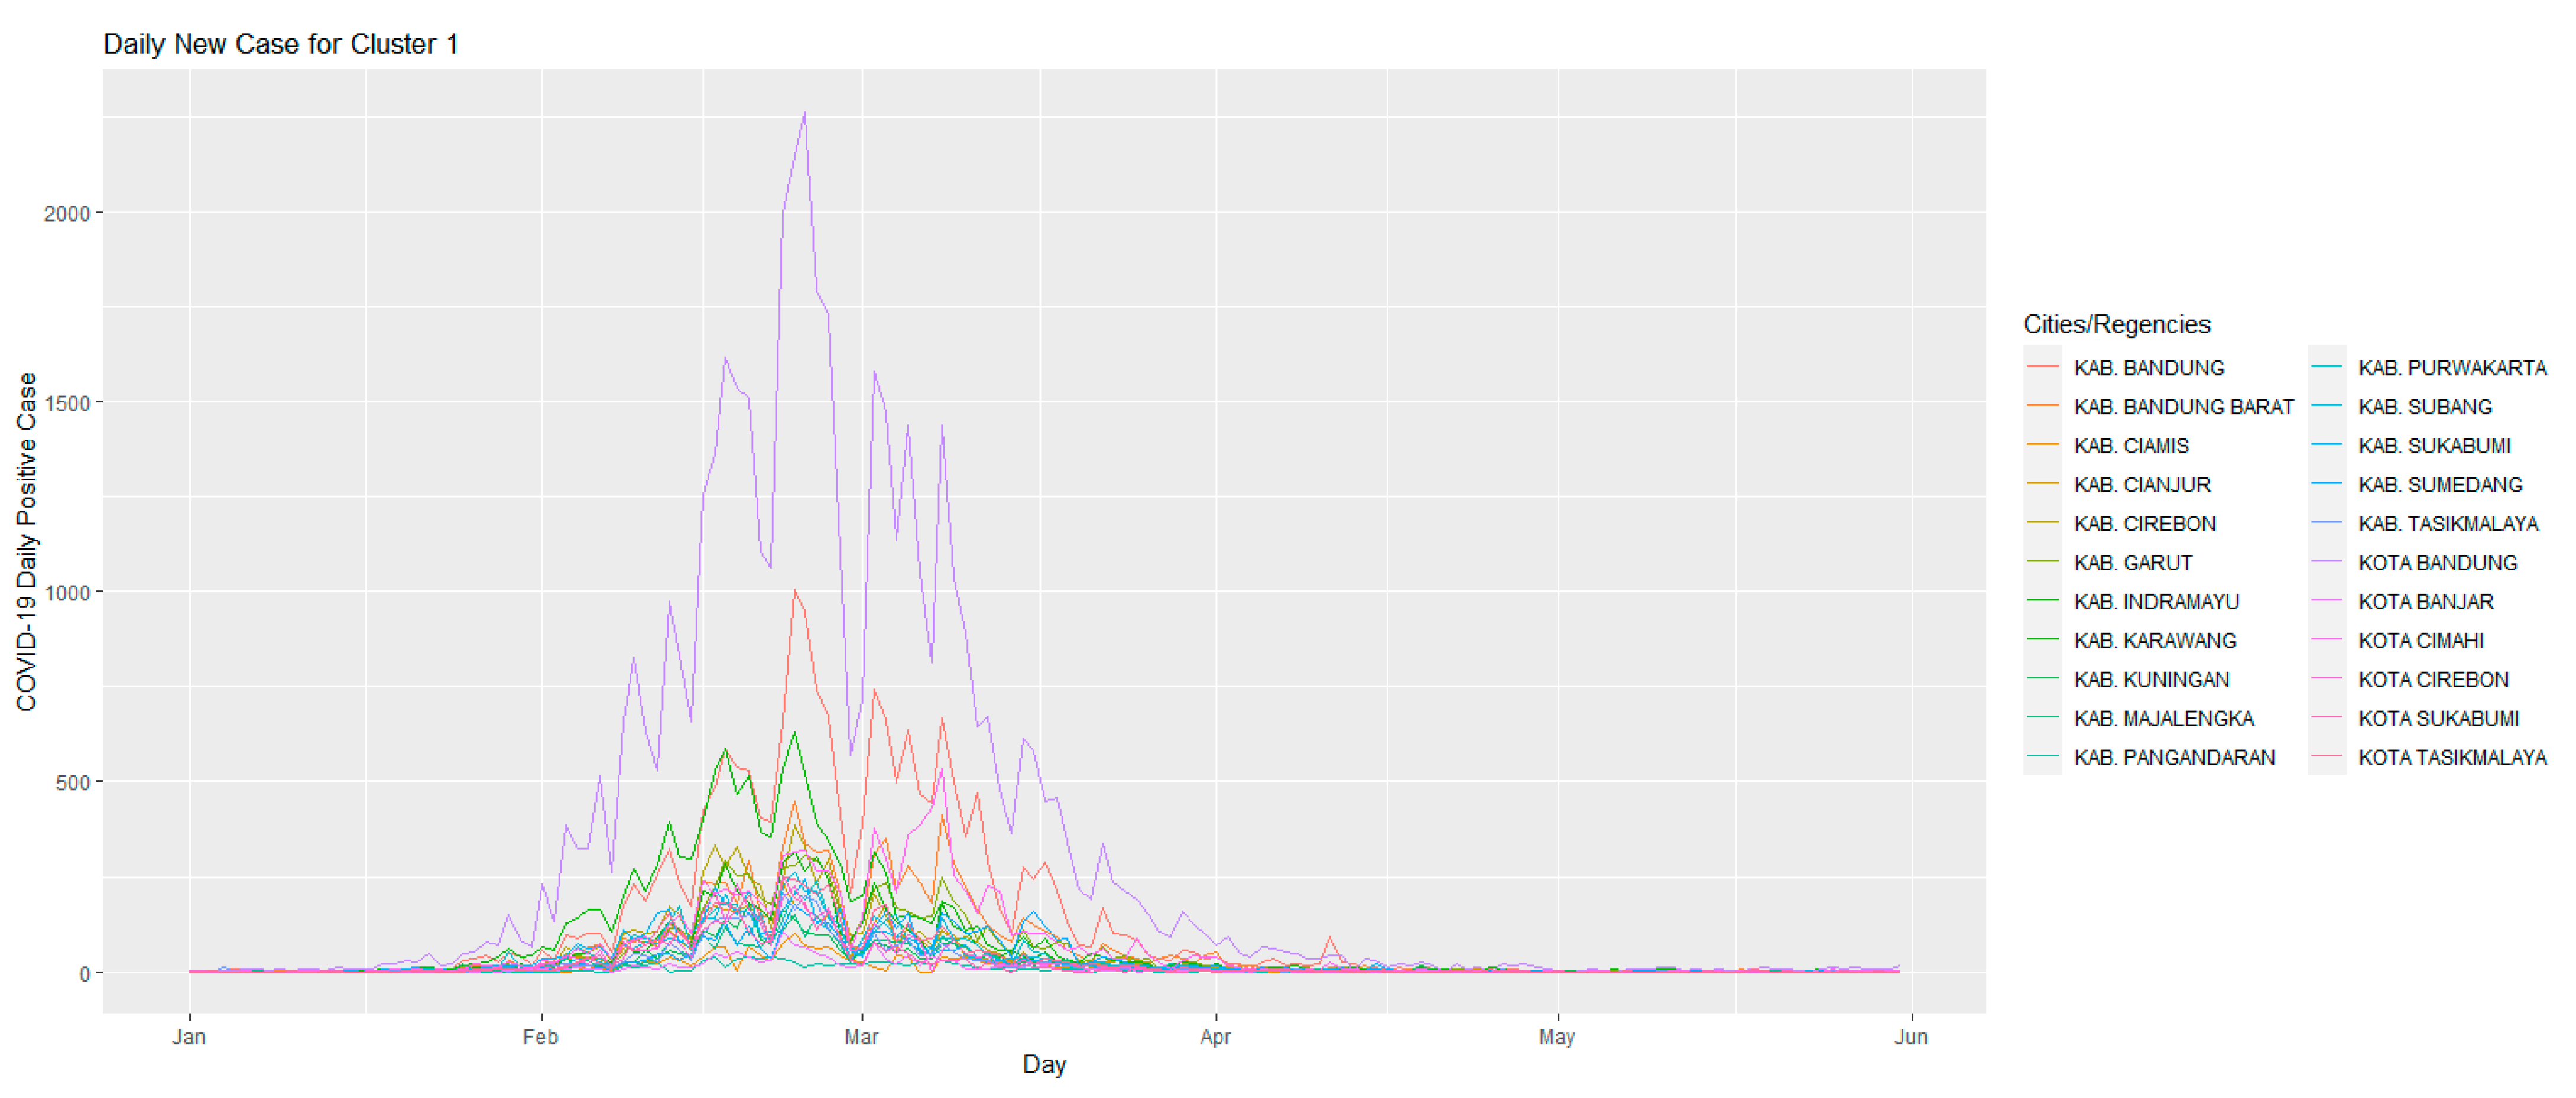
4.4. Second Period (1 January 2022–31 May 2022) Clustering Results

In the second period, the number of clusters formed was less than in the previous period. During this period, two clusters were formed based on the daily number of new COVID-19 cases in West Java. Figure 8 shows the development of the number of daily positive cases of COVID-19 in Cluster 1 for the second period.
Figure 8 shows the development of the number of daily positive cases of COVID-19 in Cluster 1 in the period 1 January 2022–31 May 2022. In the clustering conducted in Period 2, this cluster is the cluster with the most members, namely 22 cities/regencies. In this cluster, PPKM began to be implemented on 4 January 2022. When PPKM was first implemented, the number of cases that occurred was still relatively low. This is different from Period 1 where PPKM began to be implemented when COVID-19 cases began to experience a significant increase. In this cluster, the increase in the number of COVID-19 cases began to occur at the end of January 2022, and the peak occurred at the end of February 2022. The daily number of COVID-19 cases began to decline in early March 2022, until finally on 4 April 2022, PPKM was relieved by the government. Since then, the number of daily COVID-19 cases has continued to decline until May 2022.
Figure 9 shows the development of the daily number of positive COVID-19 cases in Cluster 2 for the period 1 July 2021–30 September 2021. In the clustering conducted in Period 2, this cluster only consists of five cities and regencies. In this cluster, the start time of PPKM is still the same as the previous cluster, namely on 4 January 2022. However, this cluster has differences from the previous Cluster 1; namely, in this cluster, it can be seen that the increase in the number of daily cases of COVID-19 started earlier, that is, from mid-January. In addition, in this cluster, the peak that occurred was earlier than Cluster 1, which occurred in mid-February. The decrease in the number of daily cases in this cluster occurred at the end of February and continued until 31 May 2022.
The clusters formed in this study have unique characteristics and features and can be used as an initial evaluation of the effectiveness of PPKM. This is indicated by the differences that can be extracted from the clusters that were formed. Further discussion of clustering results and their implications for the effectiveness of PPKM implementation is included in the next section.

5. Discussion

In this study, we succeeded in forming clusters for daily COVID-19 cases in 27 cities and regencies in West Java Province. We formed them based on the results of the elbow method and validated the clustering results using silhouette width. The validation results show that for the first and second period, the formation of four and two clusters provides the highest level of confidence, respectively. Based on the cluster, it was found that the use of time-series clustering was effective in extracting insight from data on the number of COVID-19 cases that occurred during PPKM.
For the first period clustering (1 July 2021–30 September 2021). We found some insights that could be useful for immediate use or further study. Based on the four clusters that we formed, we found that the implementation of the emergency community activity restriction (PPKM), and the Level 4 PPKM had succeeded in reducing the number of cases. daily COVID-19 in 25 cities and regencies in West Java. This is reflected in Figure 4 and Figure 5, namely the graphs for Clusters 1 and 2. The two graphs show that there has been a decline in cases since 2 August 2021. In these two clusters, almost all cluster members began to experience a significant decrease in cases when compared to the worst conditions that had been experienced previously. Another characteristic of this cluster is the steady decline in cases, which continued until 31 October 2021. We also found that two cities had different daily developments of COVID-19 positive cases compared to other cities and regencies in West Java Province during the period implementation of restrictions on community activities (PPKM). The cities of Bogor and Depok had different developments in the number of daily COVID-19 cases compared to other cities and regencies in West Java during PPKM. Bogor City experienced two significant spikes in cases, namely when PPKM was implemented and Level 4 PPKM was implemented, while Depok City faced its worst situation 19 days after PPKM was implemented. This means that the cities of Bogor and Depok have different daily COVID-19 case dynamics compared to other cities and regencies, which indicates the need for different treatment for the two cities. In the city of Bogor, it was found that the peak of cases occurred twice, namely during PPKM and after PPKM. This indicates that the implementation of PPKM is not effective in that city, so that a more stringent PPKM execution accompanied by an extension of its duration is an option that can be considered for the City of Bogor. As for the City of Depok, the highest number of cases actually occurred after the PPKM period, and during the PPKM period, the number of COVID-19 cases in this city tended to be less. This indicates that the implementation of PPKM in this city is inconsistent, especially in the mid-to-late PPKM period. This means that supervision on the implementation of PPKM in this city need to be tightened, especially during the period leading up to the end of PPKM when the number of daily cases tends to decrease.
For the second period (1 January 2022–31 May 2022), based on the two clusters formed, we found that there was a delay between the two clusters. In the first cluster, the increase in COVID cases began at the end of January, while in the second cluster, the increase in the number of cases occurred earlier, namely in mid-January. This difference turns out to have an impact on when the peak number of cases occurs. This is shown in Cluster 1, where the peak of new cases occurred at the end of February, while in Cluster 2 the peak occurred in mid-February. There is a gap of one month between the start of the increase in cases and the peak of cases that occur. One of the reasons for the difference in the start of improvement between these two clusters is location. Members of Cluster 2 are cities and regencies that are part of the JABODETABEK (Jakarta–Bogor–Depok–Tangerang–Bekasi) area. At that time, Jakarta was the first location to experience an increase in the number of COVID-19 cases in Indonesia. This is a logical reason for an earlier increase in the number of cases in Cluster 2. This also confirms the findings of Zarikas et al. [11] which stated that geography had an effect on the dynamics of COVID-19 cases. For the effectiveness of the implementation of PPKM in Period 2, there was no significant difference between Clusters 1 and 2. This is because the time since the peak occurred until the number of new cases was relatively low, more or less the same for these two clusters, which was about one month and there was no significant increase in cases until May 2022. In Cluster 1, new cases began to stabilize at a low level in mid-April, while in Cluster 2, new cases began to stabilize at a low level in early April. This shows that in this second period, all cities and districts in West Java implemented PPKM effectively, and showed an improvement from the implementation of PPKM in the first period.
After discussing the clusters in the first and second periods, we know that in each of these periods, the number of clusters was different. In the first period, four clusters were formed, while in the second period, two clusters were formed. Why does this happen? If we try to observe the dynamics of new cases of COVID-19 that occur, in the first period, the City of Depok and the City of Bogor had such unique dynamics that the two cities formed their own respective clusters. The ineffective implementation of PPKM in these two cities led to the formation of these new clusters. However, in the second period, the implementation of PPKM in both cities improved. Thus, in the second period, the dynamics of cases that occurred in the cities of Depok and Bogor were more or less the same as other cities and regencies that were members of Cluster 2. This shows that the variability of the effectiveness of containment policies affects the number of clusters formed. In the first period, the implementation of PPKM in Clusters 1 and 2 proved effective in reducing the number of new cases of COVID-19, while in Clusters 3 and 4, the implementation of PPKM was not effective, and the two clusters had very different case dynamics compared to other cities. In the second period, the effectiveness of the implementation of PPKM was more or less the same, or PPKM is effectively applied to all cities and districts in West Java. This resulted in fewer clusters being formed in the second period than in the first period, which was only two clusters. The thing that distinguishes Clusters 1 and 2 in this second period is only geography. The results of this study indicate that the proposed clustering method is successful in classifying cities and regencies based on the dynamics of new COVID-19 cases that occur. The proposed method is sensitive to the effectiveness of containment policies and also to the geography of each city and regency.
In this study, a method was proposed to evaluate the COVID-19 spread containment policy. The proposed time-series method succeeded in providing an insightful cluster for evaluating the effectiveness of the policy. However, it should be noted that to apply this method to new data, there are two conditions that need to be met: (1) The policies applied, whether the types of policies applied are relatively similar between regions, and (2) the policies need to implemented simultaneously across regions. The proposed method is suitable for use in the same policy conditions and carried out simultaneously in various regions. This is evident from the proposed classification method which succeeded in capturing features of the effectiveness of implementing PPKM in 27 cities and regencies in West Java Province. If the two conditions mentioned above are not met, the clustering method proposed in this study is not suitable for use.

6. Conclusions

In this study, we clustered the time-series data of daily COVID-19 cases in 27 cities and regencies in West Java Province. We did clustering during PPKM implementation with the worst number of new COVID-19 cases, namely 1 July 2021–30 September 2021, and 1 January 2022–31 May 2022. The distance measure that we used for time-series clustering in this study was a type of shape-based lock-step distance measures, namely cross-correlation distance and to determine the optimal number of clusters, we used the elbow method. After the cluster was formed, we did internal validation for the cluster using the silhouette width. The results of our study found that the optimal number of clusters that could be formed from the data we had was four clusters for the first period and two clusters for the second period. For the first period, we found that from the 27 cities and regencies that we studied, there were 25 cities/districts that belong to Cluster 1 and 2, and they showed that the implementation of the emergency PPKM and the Level 4 PPKM was effective for the number of daily positive cases of COVID-19. This indicates that for the majority of cities and regencies in West Java, PPKM is the right policy to implement. In addition, there are two cities that have unique patterns when compared to other cities and regencies, namely the cities of Bogor and Depok. The City of Depok showed an increasing trend in the number of new COVID-19 cases during PPKM, while the City of Bogor experienced an increasing trend after PPKM was implemented. This shows that the implementation of PPKM did not succeed in reducing the number of daily new cases of COVID-19 in the two cities. For the effectiveness of the implementation of PPKM in Period 2, there was no significant difference between Clusters 1 and 2. This is because the time from the peak occurred until the number of new cases was relatively low for these two clusters, about one month, and there was no significant increase in cases until May 2022. In Cluster 1, new cases began to stabilize at a low level in mid-April, while in Cluster 2 new cases began to stabilize at a low level in early April. This shows that in this second period, all cities and districts in West Java implemented PPKM well and showed an improvement from the implementation of PPKM in the first period.
We recommend that the government pay more attention to areas that are close to the hotspot regions for the spread of COVID-19. In this case, the most common is the state capital or provincial capital. If the effectiveness of the PPKM determines when the spread starts to stabilize at a low level, then the geographic location of the city and district determines when the spread begins to accelerate. This means that if it is identified that an area is starting to experience an acceleration in the spread of COVID-19, then other adjacent areas need to be the first areas to implement a containment policy. This is an effort that can be made by the government to contain the rate of COVID-19 so that the spread does not reach a dangerous level. We hope that the government can continue to control the spread of COVID-19 at a safe level with this information.
The clusters show that time-series clustering can be used to evaluate policies in different areas within the same time frame. Using the right distance measures can provide insightful clusters for COVID-19 policy and management. While it is certainly useful, the clusters produced in this study only differentiate between regions that have successfully implemented PPKM and those that have not. In fact, information about the success rate of each region can be different, and this information is strategic information to obtain because this can be a reference for the government for the ideal implementation of PPKM. Thus, in future research, it is very good to consider the hierarchy of the success rates of PPKM in each region in the cluster.

Author Contributions

Conceptualization, D.S.P. and S.; methodology, N.A.; software, D.S.P.; validation, D.S.P., S. and N.A.; formal analysis, S.; investigation, N.A.; resources, N.A.; data curation, D.S.P.; writing—original draft preparation, D.S.P.; writing—review and editing, S. and N.A.; visualization, D.S.P.; supervision, N.A.; project administration, S.; funding acquisition, S. All authors have read and agreed to the published version of the manuscript.

Funding

This research was funded by the Padjadjaran Postgraduate Excellence Scholarship (BUPP) grant number 1595/UN.3.1/PT.00/2021.

Data Availability Statement

Publicly available datasets were analyzed in this study. This data can be found here: https://github.com/DhikaSuryaP/COVID-19-Clustering-in-West-Java, accessed on 13 August 2022.

Acknowledgments

The authors would like to thank the Dean of the Faculty of Mathematics and Natural Sciences, Universitas Padjadjaran, and the Directorate of Research and Community Service (DRPM), who has given a grant: Pendidikan Magister Menuju Doktor Bagi Sarjana Unggul (PMDSU/BUPP).

Conflicts of Interest

The authors declare no conflict of interest.

References

  1. Nuraini, T.N. Kronologi Munculnya Covid-19 Di Indonesia Hingga Terbit Keppres Darurat Kesehatan. Available online: https://www.merdeka.com/trending/kronologi-munculnya-covid-19-di-indonesia-hingga-terbit-keppres-darurat-kesehatan-kln.html (accessed on 15 July 2022).
  2. COVID-19 Response Acceleration Task Force; Peta Sebaran. 2022. Available online: https://covid19.go.id/peta-sebaran (accessed on 15 July 2022).
  3. Worldometer; COVID-19 Cases by Country. 2022. Available online: https://www.worldometers.info/coronavirus/ (accessed on 15 July 2022).
  4. West Java Central Agency on Statistics (BPS). Hasil Sensus Penduduk 2020 Di Provinsi Jawa Barat; West Java Central Agency on Statistics (BPS): Bandung, Indonesia, 2020.
  5. Regional Government of West Java Province West Java Province COVID-19 Case Statistics Dashboard. Available online: https://dashboard.jabarprov.go.id/id/dashboard-pikobar/trace/statistik (accessed on 15 July 2022).
  6. Kompas Kebijakan Covid-19 Dari PSBB Hingga PPKM Empat Level. Kompaspedia 2021. Available online: https://kompaspedia.kompas.id/baca/infografik/kronologi/kebijakan-covid-19-dari-psbb-hingga-ppkm-empat-level (accessed on 15 July 2022).
  7. Wang, H.; Wang, W.; Yang, J.; Yu, P.S. Clustering by Pattern Similarity in Large Data Sets. Proc. ACM SIGMOD Int. Conf. Manag. Data 2002, 2, 394–405. [Google Scholar] [CrossRef]
  8. Das, G.; Lin, K.-I.; Mannila, H.; Renganathan, G.; Smyth, P. Rule Discovery from Time Series. KDD 1998, 1, 16–22. [Google Scholar]
  9. Fu, T.C.; Chung, F.L.; Ng, V.; Luk, R. Pattern Discovery from Stock Time Series Using Self-Organizing Maps. Work. Notes KDD2001 Work. Temporal Data Min. 2001, 1, 26–29. [Google Scholar]
  10. Keogh, E.; Lonardi, S.; Chiu, B.Y.C. Finding Surprising Patterns in a Time Series Database in Linear Time and Space. Proc. ACM SIGKDD Int. Conf. Knowl. Discov. Data Min. 2002, 550–556. [Google Scholar] [CrossRef]
  11. Zarikas, V.; Poulopoulos, S.G.; Gareiou, Z.; Zervas, E. Clustering Analysis of Countries Using the COVID-19 Cases Dataset. Data Br. 2020, 31, 105787. [Google Scholar] [CrossRef] [PubMed]
  12. Alvarez, E.; Brida, J.G.; Limas, E. Comparisons of COVID-19 Dynamics in the Different Countries of the World Using Time-Series Clustering. medRxiv 2020. [Google Scholar] [CrossRef]
  13. Abdullah, D.; Susilo, S.; Ahmar, A.S.; Rusli, R.; Hidayat, R. The Application of K-Means Clustering for Province Clustering in Indonesia of the Risk of the COVID-19 Pandemic Based on COVID-19 Data. Qual. Quant. 2022, 56, 1283–1291. [Google Scholar] [CrossRef] [PubMed]
  14. Elsi, Z.R.S.; Pratiwi, H.; Efendi, Y.; Rusdina, R.; Alfah, R.; Windarto, A.P.; Wiza, F. Utilization of Data Mining Techniques in National Food Security during the Covid-19 Pandemic in Indonesia. J. Phys. Conf. Ser. 2020, 1594, 012007. [Google Scholar] [CrossRef]
  15. World Health Organization. Coronavirus disease 2019 (COVID-19): Situation Report, 51. 2020. Available online: https://apps.who.int/iris/handle/10665/331475 (accessed on 14 June 2022).
  16. ECDC COVID-19 Situation Update for the EU/EEA and the UK. Available online: www.ecdc.europa.eu (accessed on 26 June 2022).
  17. CDC CDC FAQ on COVID-19. Available online: https://www.cdc.gov/coronavirus/2019ncov/faq.html#fSymptoms-&-Emergency-Warning-Signs (accessed on 14 June 2022).
  18. World Health Organization. Coronavirus Disease 2019 (COVID-19): Situation Report, 57. 2020. Available online: https://cdn.who.int/media/docs/default-source/searo/indonesia/covid19/external-situation-report-57_2-june-2021.pdf?sfvrsn=cb275259_5 (accessed on 14 June 2022).
  19. ECDC Q & A on COVID-19: Basic Facts. Available online: www.ecdc.europa.eu (accessed on 15 July 2022).
  20. Kaufman, L.; Rousseeuw, P.J. Finding Groups in Data: An Introduction to Cluster Analysis; John Wiley: New York, NY, USA, 1990. [Google Scholar]
  21. Omran, M.G.H.; Engelbrecht, A.P.; Salman, A. An Overview of Clustering Methods. Intell. Data Anal. 2007, 11, 583–605. [Google Scholar] [CrossRef]
  22. Shahnawaz, M.; Ranjan, A.; Danish, M. Temporal Data Mining: An Overview. Int. J. Eng. Adv. Technol. IJEAT Oct. 2011, 1, 2249–8958. [Google Scholar]
  23. Warren Liao, T. Clustering of Time Series Data—A Survey. Pattern Recognit. 2005, 38, 1857–1874. [Google Scholar] [CrossRef]
  24. Lin, J.; Vlachos, M.; Keogh, E.; Gunopulos, D. Ierative Incremental Clustering of Time Series. Lect. Notes Comput. Sci. 2004, 2992, 106–122. [Google Scholar] [CrossRef]
  25. He, W.; Feng, G.; Wu, Q.; He, T.; Wan, S.; Chou, J. A New Method for Abrupt Dynamic Change Detection of Correlated Time Series. Int. J. Climatol. 2012, 32, 1604–1614. [Google Scholar] [CrossRef]
  26. Pavlidis, N.G.; Plagianakos, V.P.; Tasoulis, D.K.; Vrahatis, M.N. Financial Forecasting through Unsupervised Clustering and Neural Networks. Oper. Res. 2006, 6, 103–127. [Google Scholar] [CrossRef]
  27. Sfetsos, A.; Siriopoulos, C. Time Series Forecasting with a Hybrid Clustering Scheme and Pattern Recognition. IEEE Trans. Syst. Man Cybern. Part A Syst. Hum. 2004, 34, 399–405. [Google Scholar] [CrossRef]
  28. Mirri, S.; Delnevo, G.; Roccetti, M. Is a COVID-19 second wave possible in Emilia-Romagna (Italy)? Fore-casting a future outbreak with particulate pollution and machine learning. Computation 2020, 8, 74. [Google Scholar] [CrossRef]
  29. Huang, X.; Li, Z.; Lu, J.; Wang, S.; Wei, H.; Chen, B. Time-Series Clustering for Home Dwell Time during COVID-19: What Can We Learn from It? ISPRS Int. J. Geo-Inf. 2020, 9, 675. [Google Scholar] [CrossRef]
  30. Rojas-Valenzuela, I.; Valenzuela, O.; Delgado-Marquez, E.; Rojas, F. Estimation of COVID-19 Dynamics in the Different States of the United States during the First Months of the Pandemic. Eng. Proc. 2021, 3, 53. [Google Scholar] [CrossRef]
  31. Brida, J.G.; Alvarez, E.; Limas, E. Clustering of Time Series for the Analysis of the COVID-19 Pandemic Evolution. Econ. Bull. 2021, 41, 1082–1096. [Google Scholar]
  32. Pikobar Statistik Kasus COVID-19 Provinsi Jawa Barat. Available online: https://dashboard.jabarprov.go.id/id/dashboard-pikobar/trace/statistik (accessed on 16 June 2022).
  33. R Core Team. R: A Language and Environment for Statistical Computing; R Foundation for Statistical Computing: Vienna, Austria, 2021. [Google Scholar]
  34. Wickham, H. Ggplot2: Elegant Graphics for Data Analysis; Springer: New York, NY, USA, 2016; ISBN 978-3-319-24277-4. [Google Scholar]
  35. Wickham, H. Package ’Reshape’. 2015. Available online: https://cran.rproject.org/web/packages/reshape2/reshape2.pdf (accessed on 15 July 2022).
  36. Mori, U.; Mendiburu, A.; Lozano, J.A. Distance Measures for Time Series in r: The TSdist Package. R J. 2016, 8, 455–463. [Google Scholar] [CrossRef]
  37. Kassambara, A.; Mundt, F. Factoextra: Extract and Visualize the Results of Multivariate Data Analyses. 2020. Available online: https://CRAN.R-project.org/package=factoextra (accessed on 15 July 2022).
  38. Charrad, M.; Ghazzali, N.; Boiteau, V.; Niknafs, A. NbClust: An R Package for Determining the Relevant Number of Clusters in a Data Set. J. Stat. Softw. 2014, 61, 1–36. [Google Scholar] [CrossRef]
  39. Park, H.S.; Jun, C.H. A simple and fast algorithm for K-medoids clustering. Expert Syst. Appl. 2009, 36, 3336–3341. [Google Scholar] [CrossRef]
  40. Davis, R.A.; Matsui, M.; Mikosch, T.; Wan, P. Applications of distance correlation to time series. Bernoulli 2018, 24, 3087–3116. [Google Scholar] [CrossRef]
  41. Bholowalia, P.; Kumar, A. EBK-Means: A Clustering Technique Based on Elbow Method and K-Means in WSN. Int. J. Comput. Appl. 2014, 105, 975–8887. [Google Scholar]
  42. Thorndike, R.L. Who Belongs in the Family? Psychometrika 1953, 18, 267–276. [Google Scholar] [CrossRef]
  43. Kodinariya, T.M.; Makwana, P.R. Review on Determining of Cluster in K-Means. Int. J. Adv. Res. Comput. Sci. Manag. Stud. 2013, 1, 90–95. [Google Scholar]
  44. Brock, G.; Pihur, V.; Datta, S.; Datta, S. ClValid: An R Package for Cluster Validation. Solid State Commun. 2008, 25, 1–22. [Google Scholar] [CrossRef]
  45. Handl, J.; Knowles, J.; Kell, D.B. Computational Cluster Validation in Post-Genomic Data Analysis. Bioinformatics 2005, 21, 3201–3212. [Google Scholar] [CrossRef]
  46. Rousseeuw, P.J. Silhouettes: A Graphical Aid to the Interpretation and Validation of Cluster Analysis. J. Comput. Appl. Math. 1987, 20, 53–65. [Google Scholar] [CrossRef] [Green Version]
Figure 1. Daily positive cases of COVID-19 in West Java.
Computation 10 00153 g001
Figure 2. The optimal number of clusters based on the elbow method: (a) Clustering period 1 July 2021–30 September 2021, (b) clustering period 1 January 2022–31 May 2022.
Computation 10 00153 g002
Figure 3. Silhouette width plot for each number clusters: (a) Clustering period 1 July 2021–30 September 2021, (b) clustering period 1 January 2022–31 May 2022.
Computation 10 00153 g003
Figure 4. Daily positive cases of COVID-19 in cluster 1 for the first period.
Computation 10 00153 g004
Figure 5. Daily positive cases of COVID-19 in Cluster 2 for the first period.
Computation 10 00153 g005
Figure 6. Daily positive cases of COVID-19 in Cluster 3 for the first period.
Computation 10 00153 g006
Figure 7. Daily positive cases of COVID-19 in Cluster 4 for the first period.
Computation 10 00153 g007
Figure 8. Daily positive cases of COVID-19 in Cluster 1 for the second period.
Computation 10 00153 g008
Figure 9. Daily positive cases of COVID-19 in Cluster 2 for the second period.
Computation 10 00153 g009
Table 1. Clusters of daily COVID-19 cases in cities and districts in West Java.
ClusterPeriodsCities/Districts
1First
Period
KAB. BANDUNG, KAB. BANDUNG BARAT, KAB. CIAMIS, KAB. CIANJUR, KAB. INDRAMAYU, KAB. KARAWANG, KAB. PANGANDARAN, KAB. SUBANG, KAB. SUKABUMI, KAB. TASIKMALAYA, KOTA BANDUNG, KOTA BANJAR, KOTA SUKABUMI, KOTA TASIKMALAYA
2KAB. BEKASI, KAB. BOGOR, KAB. CIREBON, KAB. GARUT, KAB. KUNINGAN, KAB. MAJALENGKA, KAB. PURWAKARTA, KAB. SUMEDANG, KOTA BEKASI, KOTA CIMAHI, KOTA CIREBON
3KOTA BOGOR
4KOTA DEPOK
1Second PeriodKAB. BANDUNG, KAB. BANDUNG BARAT, KAB. CIAMIS, KAB. CIANJUR, KAB. CIREBON, KAB. GARUT, KAB. INDRAMAYU, KAB. KARAWANG, KAB. KUNINGAN, KAB. MAJALENGKA, KAB. PANGANDARAN, KAB. PURWAKARTA, KAB. SUBANG, KAB. SUKABUMI, KAB. SUMEDANG, KAB. TASIKMALAYA, KOTA BANDUNG, KOTA BANJAR, KOTA CIMAHI, KOTA CIREBON, KOTA SUKABUMI, KOTA TASIKMALAYA
2KAB. BEKASI, KAB. BOGOR, KOTA BEKASI, KOTA BOGOR, KOTA DEPOK
Table 2. Silhouette width values in the clusters tested in this study.
Number of Clusters2345678910
First
Period
0.25140.26050.26330.19520.19150.17200.17650.12470.1027
Second
Period
0.63630.30560.32580.33390.30730.31540.32810.30160.2992
Publisher’s Note: MDPI stays neutral with regard to jurisdictional claims in published maps and institutional affiliations.

