Article

Active Pharmaceutical Ingredients Transportation and Release from Aerogel Particles Processes Modeling

The Department of Chemical and Pharmaceutical Engineering, Mendeleev University of Chemical Technology of Russia, Moscow 125047, Russia
*
Author to whom correspondence should be addressed.
Computation 2022, 10(8), 139; https://doi.org/10.3390/computation10080139
Submission received: 20 July 2022 / Revised: 6 August 2022 / Accepted: 8 August 2022 / Published: 12 August 2022

Abstract

:
In this work, active pharmaceutical ingredients release from aerogel particles and active pharmaceutical ingredients transportation processes were investigated. Experimental studies were carried out on the release of various types of active pharmaceutical ingredients from various types of aerogel particles. Release curves were obtained. A hybrid model using the lattice Boltzmann method and a cellular automata approach to simulate the release of active pharmaceutical ingredients from aerogel particles and active pharmaceutical ingredients transport processes is proposed. The proposed model can be used in new drug development, which allows partially replacing full-scale experiments with computational ones, therefore reducing the experimental studies cost.

1. Introduction

Aerogel-based materials are now widely used in many areas of science and industry. They are applied as hemostatic preparations and materials for wound healing in tissue engineering [1,2], drug delivery systems, peptides and compositions of substances delivery systems [3], biosensors [4], and antifungal and antimicrobial drugs.
The high surface area and high porosity allows the use of aerogels as matrices for the impregnation of different active substances. For example, substances such as ibuprofen, diclofenac, triflusal, vitamin E, vitamin K3, vitamin D3, dexamethasone, and indomethacin can be impregnated into polysaccharide-based aerogels [5]. The impregnation of medicinal substances into the aerogel pores makes it possible to obtain an amorphous structure of the active substance, which improves the release rate from the aerogel matrix [6,7]. In [7], it was shown that when active substances are impregnated into the aerogel matrix, the release rate of loratadine and nimesulide from the aerogel increases by 2.2 and 6.6 times, respectively, compared with their crystalline form dissolution rate. Therefore, it is possible to increase the solubility of poorly soluble substances and create drug delivery systems with the release of controlled active pharmaceutical ingredients (APIs) from aerogel pores.
The most accessible and common way to introduce drugs is orally. This method is simple and easy to use. When administered orally, the drugs are absorbed in the gastric mucosa [8]. This method has its disadvantages. The drug substance release rate depends on its amount in the carrier matrix, its solubility, release kinetics, and the strength of the form (for solid dosage forms), and partial drug inactivation under the action of liver enzymes is also possible. The disadvantages also include the slow onset of the effect, low bioavailability, and the inability to use for vomiting, nausea, and coma, and there are also individual differences in the speed and completeness of absorption [9]. For drugs that do not penetrate well through the mucosa of the gastrointestinal tract (GIT) or are destroyed in the GIT, it is possible to use the parenteral route of administration. However, this method involves injections that can only be performed by trained personnel [8].
The nasal drug administration is an alternative route for systemic drug availability that is limited by other routes of administration. In recent years, nasal drug delivery has become widely studied [10], including as a method for treating of allergic inflammatory diseases [11] and vaccine delivery [12].
In [8], the two routes of drug delivery that are possible with nasal delivery are described. According to the first route, the substance after contact with the mucous membrane can be absorbed into the submucosal blood vessels and lymphatic vessels. In the second route, the substance can be absorbed into the cerebrospinal fluid through the olfactory and ternary nerves and enter directly into the brain [8,13]. Due to the large surface area, high total blood flow, lack of first pass metabolism, and easy access, drugs are rapidly cleared from the nasal cavity after nasal administration, resulting in rapid systemic drug absorption.
The advantages of the nasal delivery method include the rapid action of the drug and the first pass metabolism absence [13]. These advantages allow nasal delivery of substances that have restrictions for oral use and reduce the amount of drug, which leads to a decrease in side effects from the drug [14]. In [15], it has been shown that with nasal administration directly to the site of the lesion, lower doses of the drug than with its systemic use are required, which allows faster recovery and using a lower amount of drug.
The nasal mucosa is an ideal site for mucoadhesive drug delivery systems. It was shown in [9] that mucoadhesive drug delivery systems have numerous advantages. In particular, they ensure the retention of the drug at the desired site of action, which increases its therapeutic effect. One of the promising materials for API carrier matrices is chitosan. The chitosan molecule contains many free amino groups. This allows it to bind with hydrogen ions and acquire an excessive positive charge, which allows it to provide a mucoadhesive effect due to interaction with the negatively charged surface of the nasal mucosa [9,10].
However, a significant problem in the development of new drugs is that a large number of experimental studies should be carried out to understand processes of API release and transport in a specific environment and using a specific carrier matrix.
The development of computer models that will make it possible to predict the processes of transportation and release of a drug will significantly reduce the costs in the development of new drugs by partially replacing full-scale experiments with computational ones.
In this work, we propose a model of the processes of API release and its flow during the aerogel particles with impregnated API deposition into the human nasal cavity.

2. Materials and Methods

2.1. Chitosan-Based Aerogel Particles Obtaining

In this work, the process of obtaining chitosan-based aerogel particles by spraying through a nozzle was studied [16]. To prepare the initial solution, chitosan with a molecular weight of 111 kJ (Sigma-Aldrich, St. Louis, MI, USA), soluble in acids, was used. The acid used was pure acetic acid (Sigma-Aldrich). The chitosan solution was left for 24 h on a magnetic stirrer to completely dissolve the chitosan. The crosslinking agent was pure sodium hydroxide (Sigma-Aldrich). To form gel particles, the chitosan solution was sprayed into the crosslinking agent solution with constant stirring. The resulting gel particles were left in the crosslinking agent solution for 24 h to complete all chemical reactions. The preparatory step before supercritical drying is a stepwise replacement of the solvent (30, 50, 70, 90, 100, 100 and 100 wt %). Isopropyl alcohol (Sigma-Aldrich) was used as a solvent. The scheme of a high-pressure reactor for carrying out the supercritical drying process is presented in Figure 1.
Chitosan-based aerogel particles were obtained using the supercritical drying process. The process conditions were temperature of 40 °C, pressure of 120–140 atm, and flow rate of 100 NL/h, for 6 h in the high-pressure reactor described in [2]. The results of analytical studies are as follows: specific surface area SBET = 250 m2/g, total mesopore volume Vpore = 1.49 cm3/g, average pore diameter Dpore = 24 nm, bulk ρbulk = 2.050 and skeletal ρskeletal = 0.017 particle density, g/cm3, porosity = 99%.
These particles were further used to impregnate the API.

2.2. Aerogel–API Pharmaceutical Composition Obtaining

Aerogel particles impregnated with API were obtained by impregnation of API into aerogel pores at the stage of the solvent replacement method, similarly to [17]. Melatonin was used as the API. Figure 2 shows the process of obtaining chitosan-based aerogel particles impregnated with melatonin.
A weighed portion of melatonin was dissolved in isopropyl alcohol, then it was added to chitosan gel particles. To reach equilibrium in the system, the sample was left under stirring for 24 h. Next, the sample was dried under supercritical conditions to obtain a pharmaceutical composition of chitosan-based aerogel–melatonin. The mass loading of melatonin was determined by high-performance liquid chromatography HPLC and was 21.90 wt %.

2.3. Experimental Studies of the API Release from Aerogel Particles

Experimental studies of the kinetics of API release from aerogel particles were carried out. The amount of adsorbed API was determined by high-performance liquid chromatography (HPLC) using an Agilent 1200 Compact LC chromatograph. The HPLC system had a C-18 column (4.5 × 12 mm) and grain size of 5 µm. Sample input was carried out using an autosampler.
Detection conditions for the melatonin [18]:
  • Mobile phase—phosphate buffer: methanol: acetonitrile;
  • Volumetric flow rate of the mobile phase—1 mL/min;
  • Wavelength—278 nm; and
  • Sample volume—20 µL.
A mobile phase was used to carry out an experiment on the dissolution of melatonin from aerogel particles. The volume of liquid for dissolution was 10 mL and the temperature was 25 °C. Rotation speed of the laboratory shaker (ELMI S-3) was 10 rpm. Sampling time was every 1.5 min after the start of the test. The sample volume was 10 μL.
Table 1 presents the experimental data on the release of melatonin from chitosan-based aerogel particles.
Experiments in Table 1 was carried out for different amounts of aerogel particles in the system.
The proportion of released model substance is calculated by the formula:
u = c i c m a x × 100 % ,
where c i —concentration of the model substance for a given time of the experiment; g/mL, c m a x —the maximum concentration of the model substance; c m a x = 48 × 10−5 g/mL (release in 24 h).
Table 1 shows that more than 50% of the drug is released in the first minute and a half.
The obtained experimental data on the release were used to evaluate the performance of the model of the processes of API release and its flow during the aerogel particles with impregnated API deposition into the human nasal cavity.

3. Theory

During the deposition of aerogel particles in the nasal cavity, two processes occur: the release of API from the particle porous structure into the nasal mucus and the subsequent flow of API in the nasal cavity. Therefore, a separate model was developed for each of the processes—hydrodynamics of API and nasal mucus model and API release model.

3.1. Hydrodynamics Modeling

The hydrodynamics of most systems in practice can be described with the Navier–Stokes equations, especially the flow in single-phase Newtonian fluids [19]. The Navier–Stokes equations describe every time-dependent flow in an incompressible fluid. However, a significant disadvantage of this approach is its high computational complexity. The Navier–Stokes equations are a system of non-linear partial differential equations, so for many cases, it is currently impossible to prove the existence of a solution [20]. Additionally, there are difficulties for multiphase and multicomponent flows modeling [19], which is a significant disadvantage, because the system studied in this work contains two components—API and a solvent (nasal mucus). One of the alternative methods for modeling hydrodynamics is the lattice Boltzmann method (LBM).
A feature of the lattice Boltzmann method is that it does not use the Navier–Stokes equations, but models the flow of a Newtonian fluid with a discrete lattice Boltzmann equation (LBE).
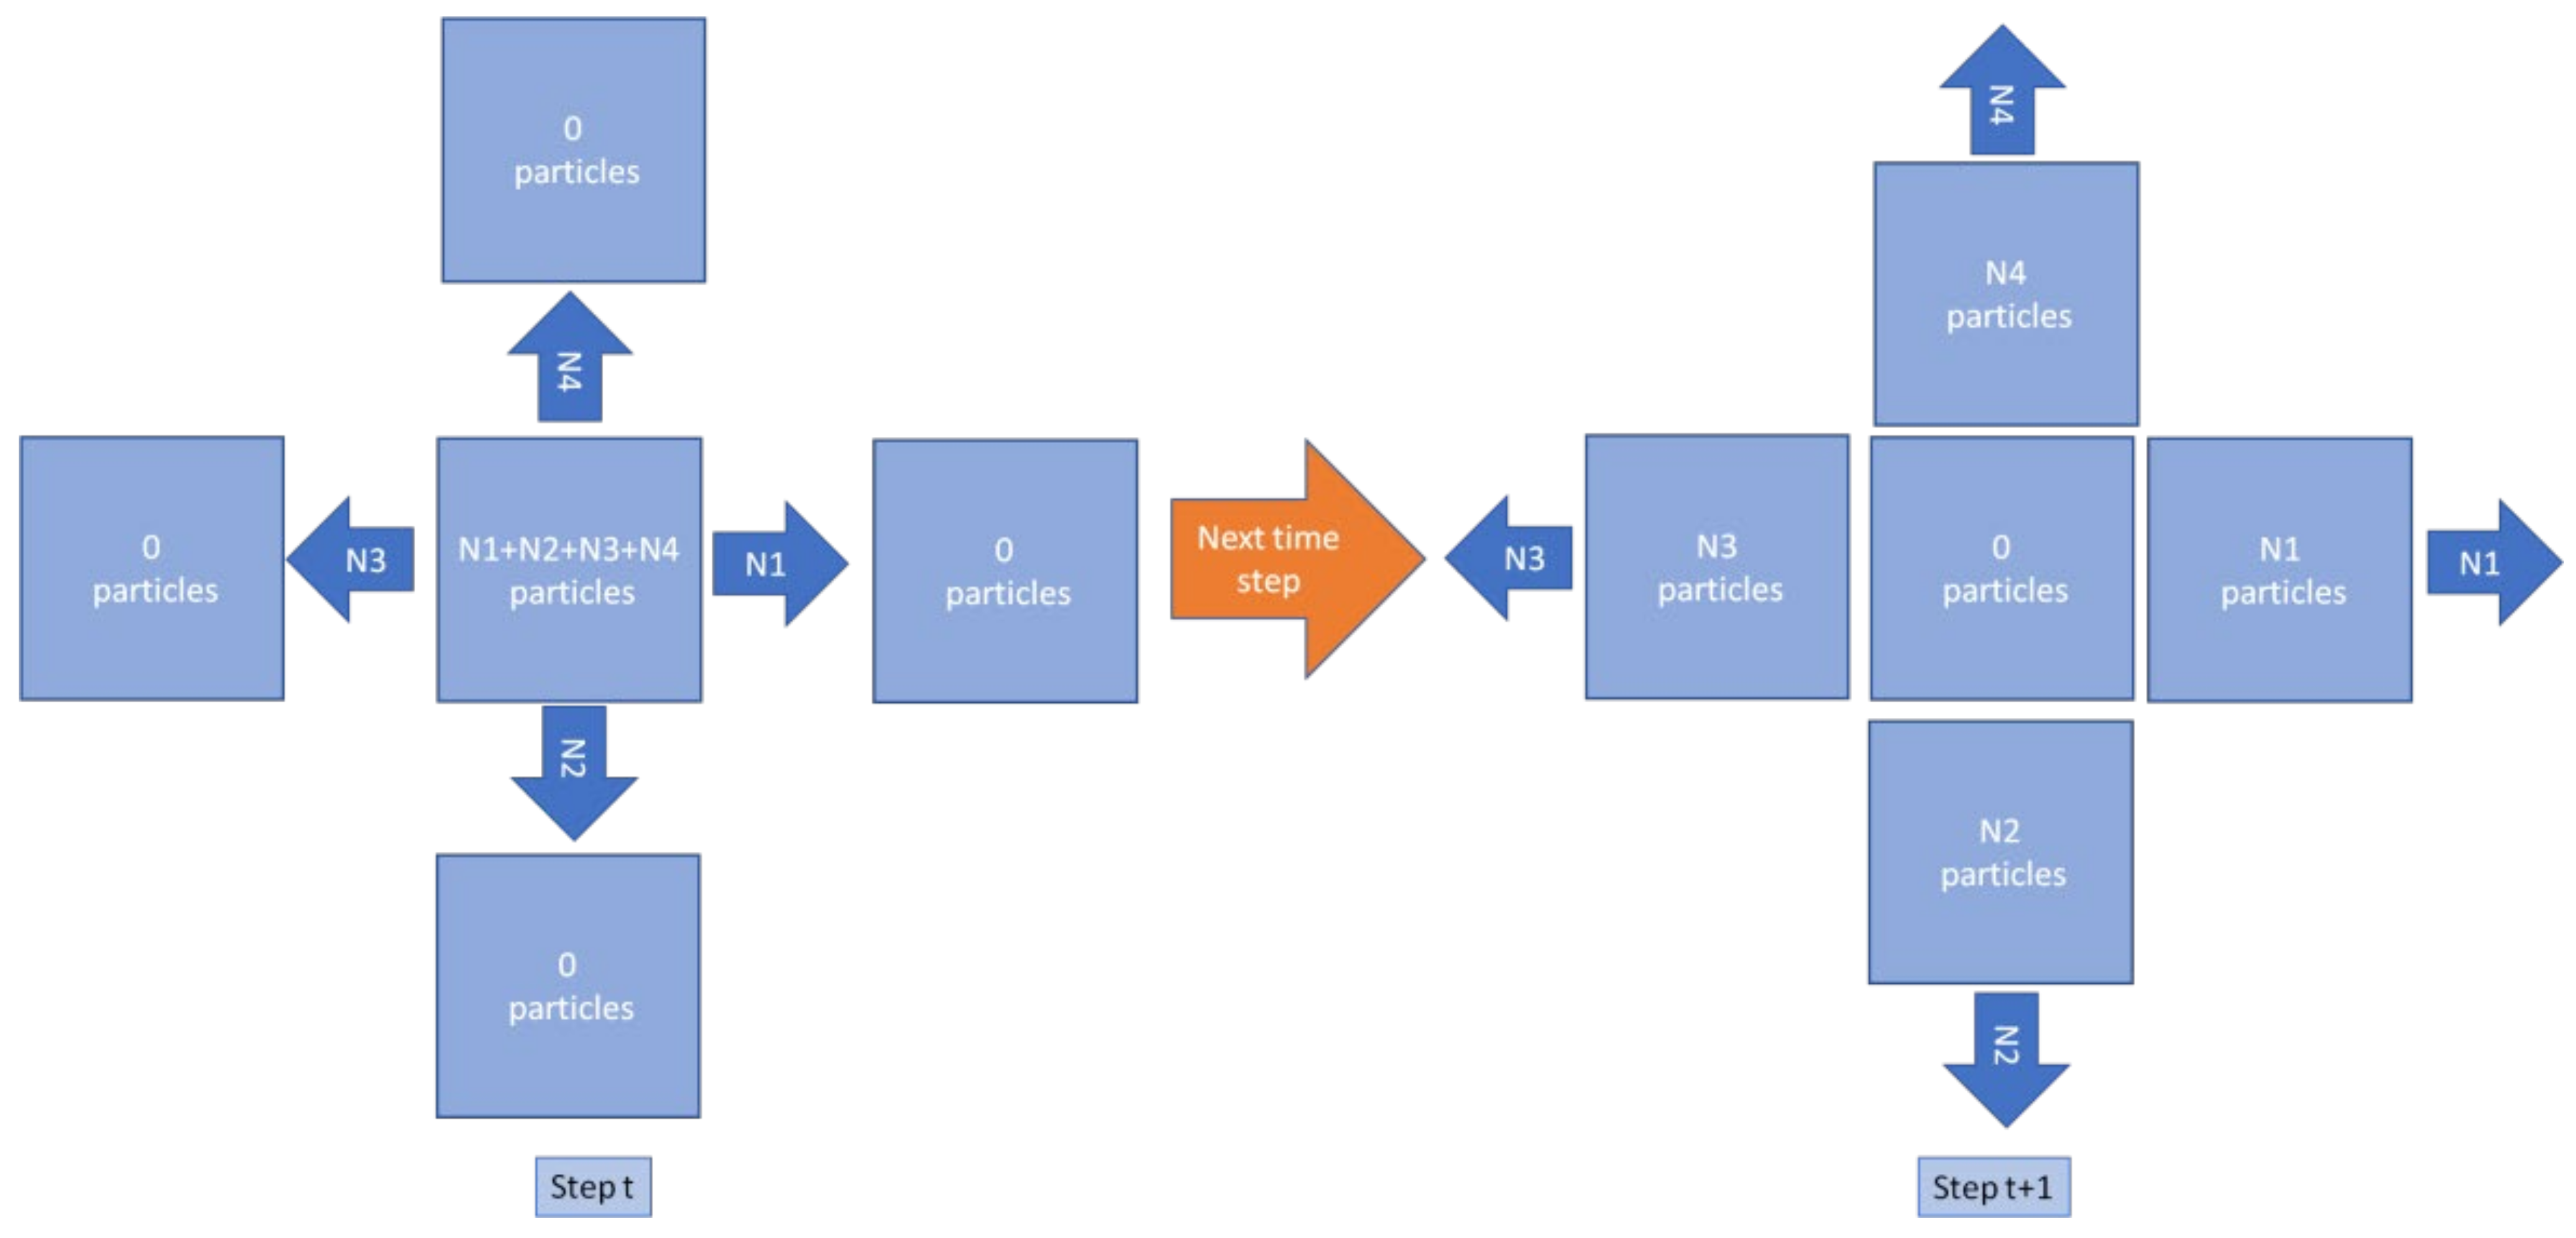
The main idea of the LBM is that the system is divided into equal cells. Each cell represents the volume of the simulated liquid containing fluid particles. Fluid particles can only move between cells, and in one time step, a particle can only move to an adjacent cell. For each particle, it is strictly defined in which direction it will move in the next time step. Figure 3 shows the movement of fluid particles between cells in one time step.
In Figure 3, fluid particles can move in four possible directions. At time step t, the central cell has N1, N2, N3, and N4 particles, which will move to the right, bottom, left, and top cell, respectively. At the next time step, t + 1, these particles move to the neighboring cells from the central one.
The number of particles’ possible motion directions depends on the number of system dimensions (two-dimensional or three-dimensional lattice), the required accuracy and computing power. The lattice model is denoted as DpQn, where p is the number of lattice dimensions and n is the number of possible directions. The most common lattice model for solving two-dimensional systems is the nine-velocity D2Q9 model. For three-dimensional systems, lattices D3Q19 and D3Q26 are used. This classification scheme for lattice models was proposed in [21] and is now widely used. Figure 4 shows the D2Q9 lattice model.
In Figure 4, vectors e 1 e 4 have length equal to one, and vectors e 5 e 8 have length equal to 2 . The vector e 0 is zero and characterizes particles that do not move.
An important feature of the lattice Boltzmann method follows from the requirement that a particle can move only to a neighboring cell in a time step—the model uses its own system of units, which is not directly related to the SI system. The lattice cell size always has a unit length and the time step is always equal to 1. Therefore, particles that move in e 1 e 4 directions in one time step pass a distance of 1, and in e 5 e 8 directions, they pass a distance of 2 . The process of converting physical quantities from the SI system to the model parameters and vice versa is a separate task.
To calculate the particles’ motion, the Boltzmann equation is used in a discrete form:
f i r + e i t * , t + t * = f i r , t Ω i ,
where t * —discrete time step; i —motion direction index; f i —number of particles moving in direction i ; Ω i —collision operator in direction i ; r —cell radius vector.
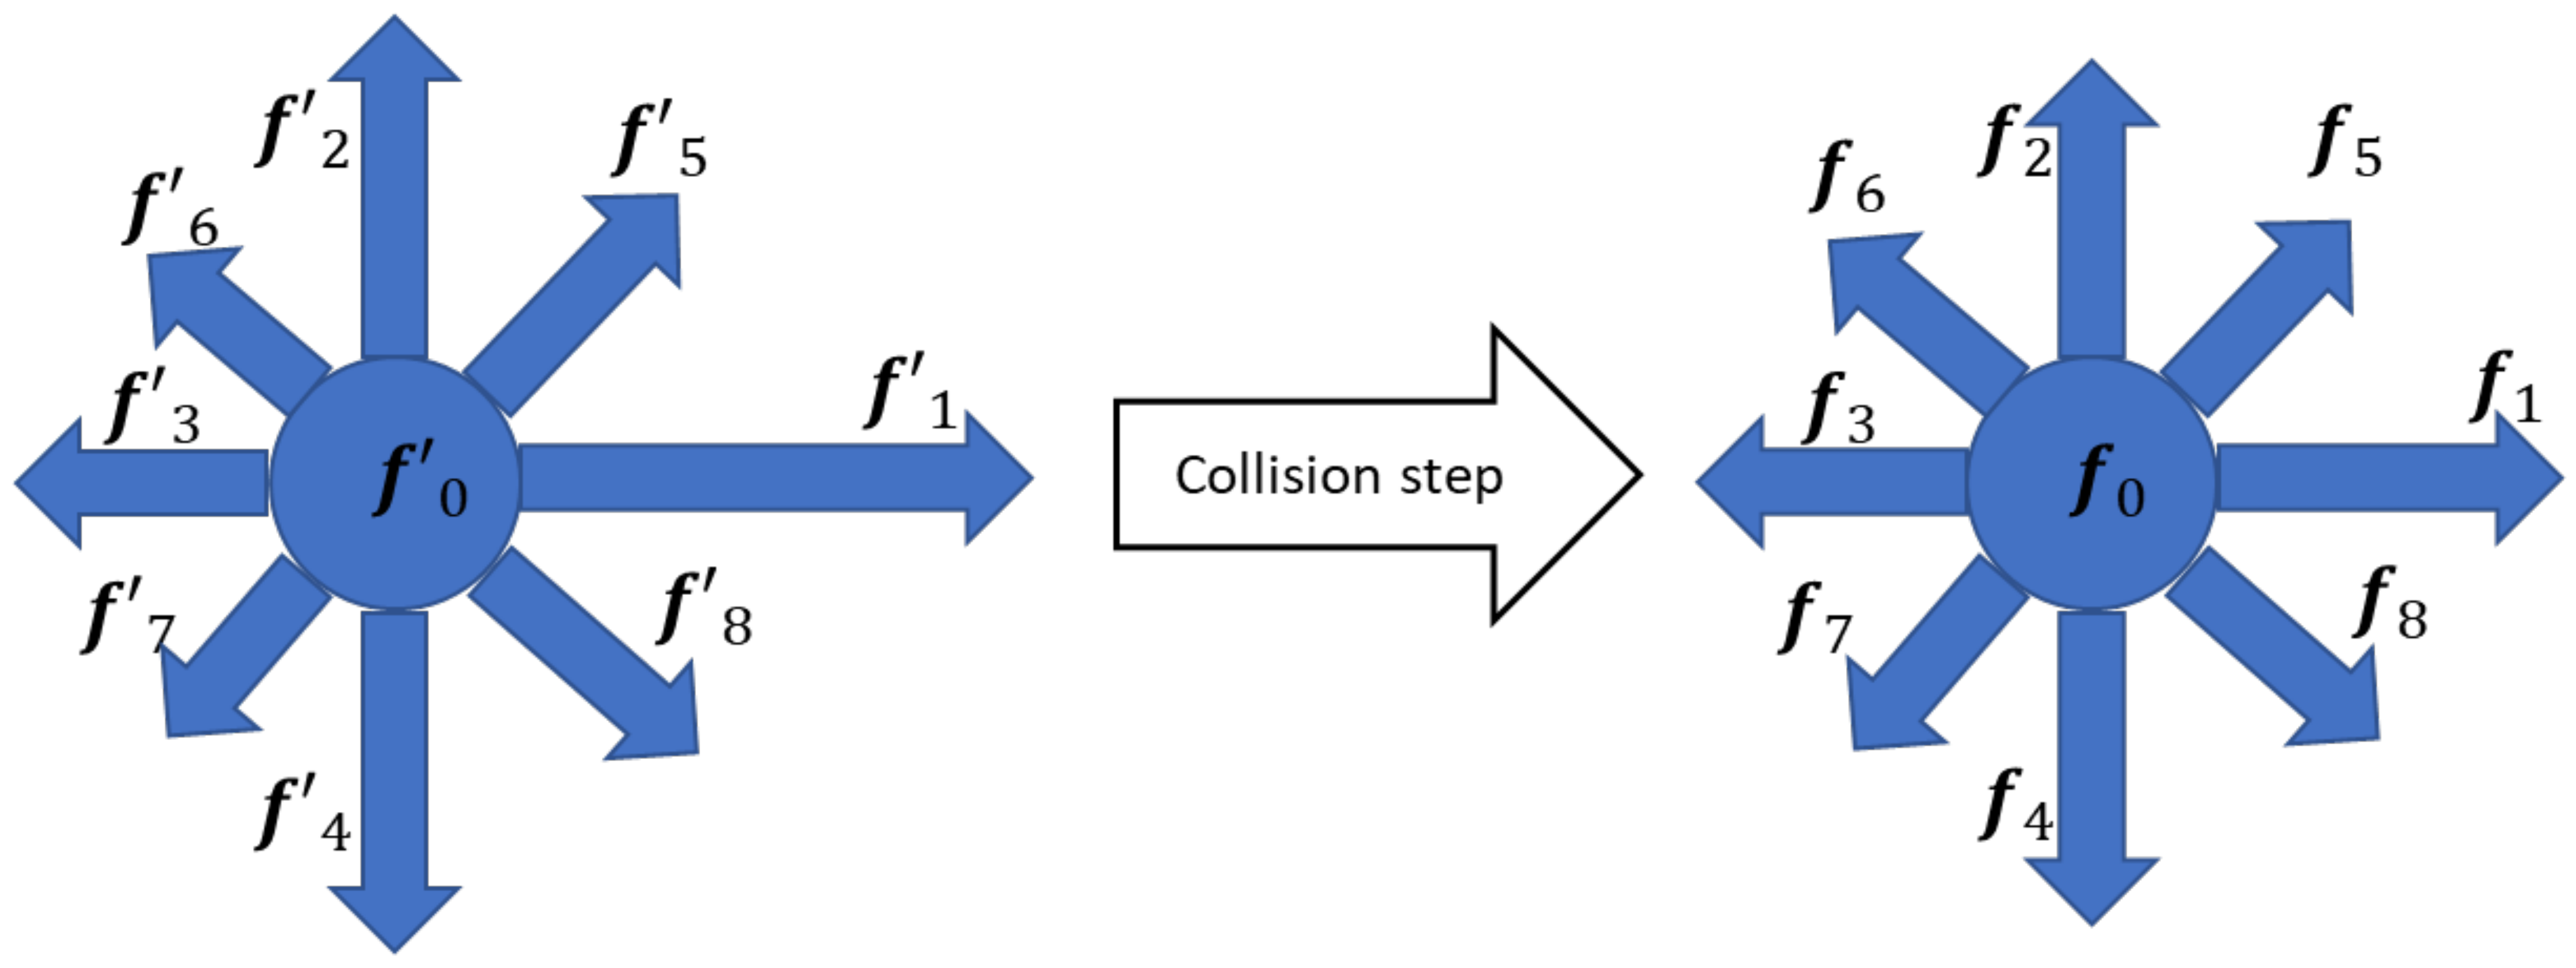
Each time step calculation is carried out in two steps—the streaming step and the collision step. During the first step, particles move from one cell to another in accordance with their directions, and during the second phase, a new distribution of particles in directions is calculated because of their collisions with each other inside each cell. The Boltzmann equation in the discrete form can be divided into two parts:
f i r + e i t * , t + t * = f i r , t ,
f i r + e i t * , t + t * = f i r + e i t * , t + t * Ω i ,
Equation (3) is used to calculate the streaming step and characterizes the motion of particles between cells, where f i corresponds to the distribution of particles in directions after the streaming but before their collision in the cell, and Equation (4) is used to calculate the collision (relaxation) step and characterizes the direction distribution of particles after their collision inside the cell.
During the streaming step, particles move from the current cell to neighboring cells in accordance with their motion vectors. Figure 5 shows a diagram of the movement of particles from the cell. Particles’ motion is calculated for all lattice cells. Figure 4 shows the motion of particles from the central cell to neighboring ones.
After the streaming phase, the collision phase follows. The main parameter for this phase is the collision function, which determines the particles’ distribution in directions inside the cell at the next time step. The collision operator of the original Boltzmann equation considers all possible pairwise collisions and has a complex mathematical form. This collision operator can be used only for gas modeling because it considers only collisions between two particles. However, due to the much higher density of liquids than gases, the particles in liquid can be affected by more complex interactions involving three or more particles. In practice, for hydrodynamics, various approximations instead of original operators are used. The most common approximation is the Bhatnagar–Gross–Krook (BGK) approximation:
Ω i = f i r , t f i e q r , t τ ,
where f i e q r , t —equilibrium distribution function; τ —relaxation parameter [22].
The equilibrium distribution function in this case has the following form:
f i e q r , t = d i ρ * 1 + e i · u R T + e i · u 2 2 R T 2 u 2 2 R T ,
where d i —lattice direction weights; ρ * —discrete liquid density in cell; R —Boltzmann constant; T —temperature; u —macroscopic velocity in cell.
As mentioned above, in the LBM model, parameters do not correspond to the values of physical quantities in the SI system and are associated with discrete parameters of distance, velocity, and time; therefore, in calculations, the product RT is dimensionless and equals 1/3. Thus, the equation is reduced to the following form:
f i e q r , t = d i ρ * 1 + 3 e i · u + 9 e i · u 2 2 3 u 2 2 ,
The discrete density ρ * characterizes the total number of particles in a cell. Therefore, the discrete density of the liquid in the cell and the macroscopic velocity in the cell are calculated according to the following:
ρ * = i = 0 N f i r , t ,
ρ * u = i = 0 N e i f i r , t ,
where N —the number of possible motion directions.
Lattice direction weights d i are calculated for each particular lattice type.
The relaxation parameter τ is dimensionless and related to the kinematic viscosity, and its values lie in the following range:
0.5 < τ < 2 ,
As the value of τ approaches the 0.5 or 2, the system becomes unstable, so the model parameters should be chosen so that the τ lies close to 1.
After calculating the streaming step for each cell, the macroscopic parameters are calculated—density and velocity, according to (8) and (9). After that, a new particle velocity distribution is calculated according to Equation (2), and the collision function is calculated according to (5)–(7). The scheme of changing the distribution of particles in directions is shown in Figure 6.
Thus, in the lattice Boltzmann method, the particle distribution in the directions of motion in each cell is calculated as follows:
  • Calculation of the density and particle distribution in the cell in accordance with the streaming step.
  • Calculation of the density and particle distribution in the cell in accordance with the collision phase.
Based on the LBM, a computer model of the API flow process in the nasal cavity was developed. The developed model has the following assumptions:
  • The system is divided into square cells of the same size.
  • D2Q9 type was chosen as the lattice model—the system is two-dimensional and each cell has eight neighbors.
  • Each cell has the following properties: discrete solvent (nasal mucus) density ρ 0 * and API discrete density ρ 1 * .
  • In all left boundary cells, the macroscopic discrete velocity has a constant value u * .
  • Boundary conditions along the vertical axis are periodic (toroidal)—liquid and API particles, when they move beyond the top boundary, move to the bottom boundary cells and move to the top boundary cells, and move beyond the lower ones.
The main advantage of the LBM compared with the classical approach of solving the Navier–Stokes equations is the calculation simplicity, which is easy to implement in the computer model. Additionally, the lattice Boltzmann method simplifies, compared to the classical approach, multiphase and multicomponent flows modeling and flows in porous bodies. For these reasons, the LBM was used to develop a model of the API flow process after the aerogel particles’ deposition into the nasal cavity.

3.2. API Release Process Modeling

The API release from aerogel particles after its deposition into the nasal cavity includes API dissolution in the nasal fluid in the pores of the aerogel.
The dissolution process includes the following stages: aerogel surface wetting with a solvent, API solid bond destruction, individual API molecules/ions solvation [23], and the diffusion of dissolved API particles through the solvent boundary layer. Thin “non-stirring” solvent layers surround each API particle.
There is no drug release model that can be applied for all cases. In most studies, Zero Order Model, First Order Model, Higuchi Model, Peppas Model, and Hixon Crowell Model are applied, but in many cases, the development of a specific model may be required [24]. In the current work for modeling release processes from aerogel particles, the cellular automata approach was used.
In [23], an equation for calculating the dissolution rate, known as the Noyes–Whitney equation, was proposed:
d C d t = K C s C t ,
where d C d t —dissolution rate; K—dissolution constant; C s —saturated solution concentration;   C t —solute concentration in moment t .
The main hypothesis of Noyes and Whitney is that diffusion mass transfer through the boundary (“non-mixing”) layer of a liquid is the slowest stage of the dissolution process and therefore determines its rate [23].
In the case of aerogel particles, during API dissolution, the nasal mucus enters the pores and dissolves the API that diffuses from the particle into the nasal mucus. Additionally, the aerogel particles are much smaller than the considered system (nasal cavity). Therefore, in this work, the API hydrodynamics process inside particles is not considered, since this is a different scale task. Only the API release from the aerogel particle and the further flow of API in the nasal mucus after release from the aerogel particle are considered.
The release model will be used with the hydrodynamics model, which is based on the lattice Boltzmann method. In this case, to model the release process, it is reasonable to use the cellular automaton approach. This will allow both models to be used on the same lattice.
The main idea of the cellular automata approach is that the system being studied is divided into elementary volume cells. Cells are equal and at each moment of time, have one of the given set of states. Cells change their state according to local transition rules—their state depends only on the state of neighboring cells. The transition rules can be based on theoretical or statistical dependance.
To model the release process, a cellular automata model based on the model proposed in [25] was developed.
The developed model has the following assumptions:
  • The system is represented as a lattice consisting of square cells.
  • In each cell, only one API and one solvent (nasal mucus) are considered.
  • The cell is described by the discrete density of the solvent (nasal mucus) ρ 0 * and the discrete density of the API ρ 1 * .
  • The cell at each time step can be in one of two states: “Liquid” or “Aerogel with impregnated API.”
  • Each cell has eight neighbors.
  • The internal geometry of the aerogel particle is not considered. The API release from the aerogel particle into the nasal mucus is calculated according to Equation (11).
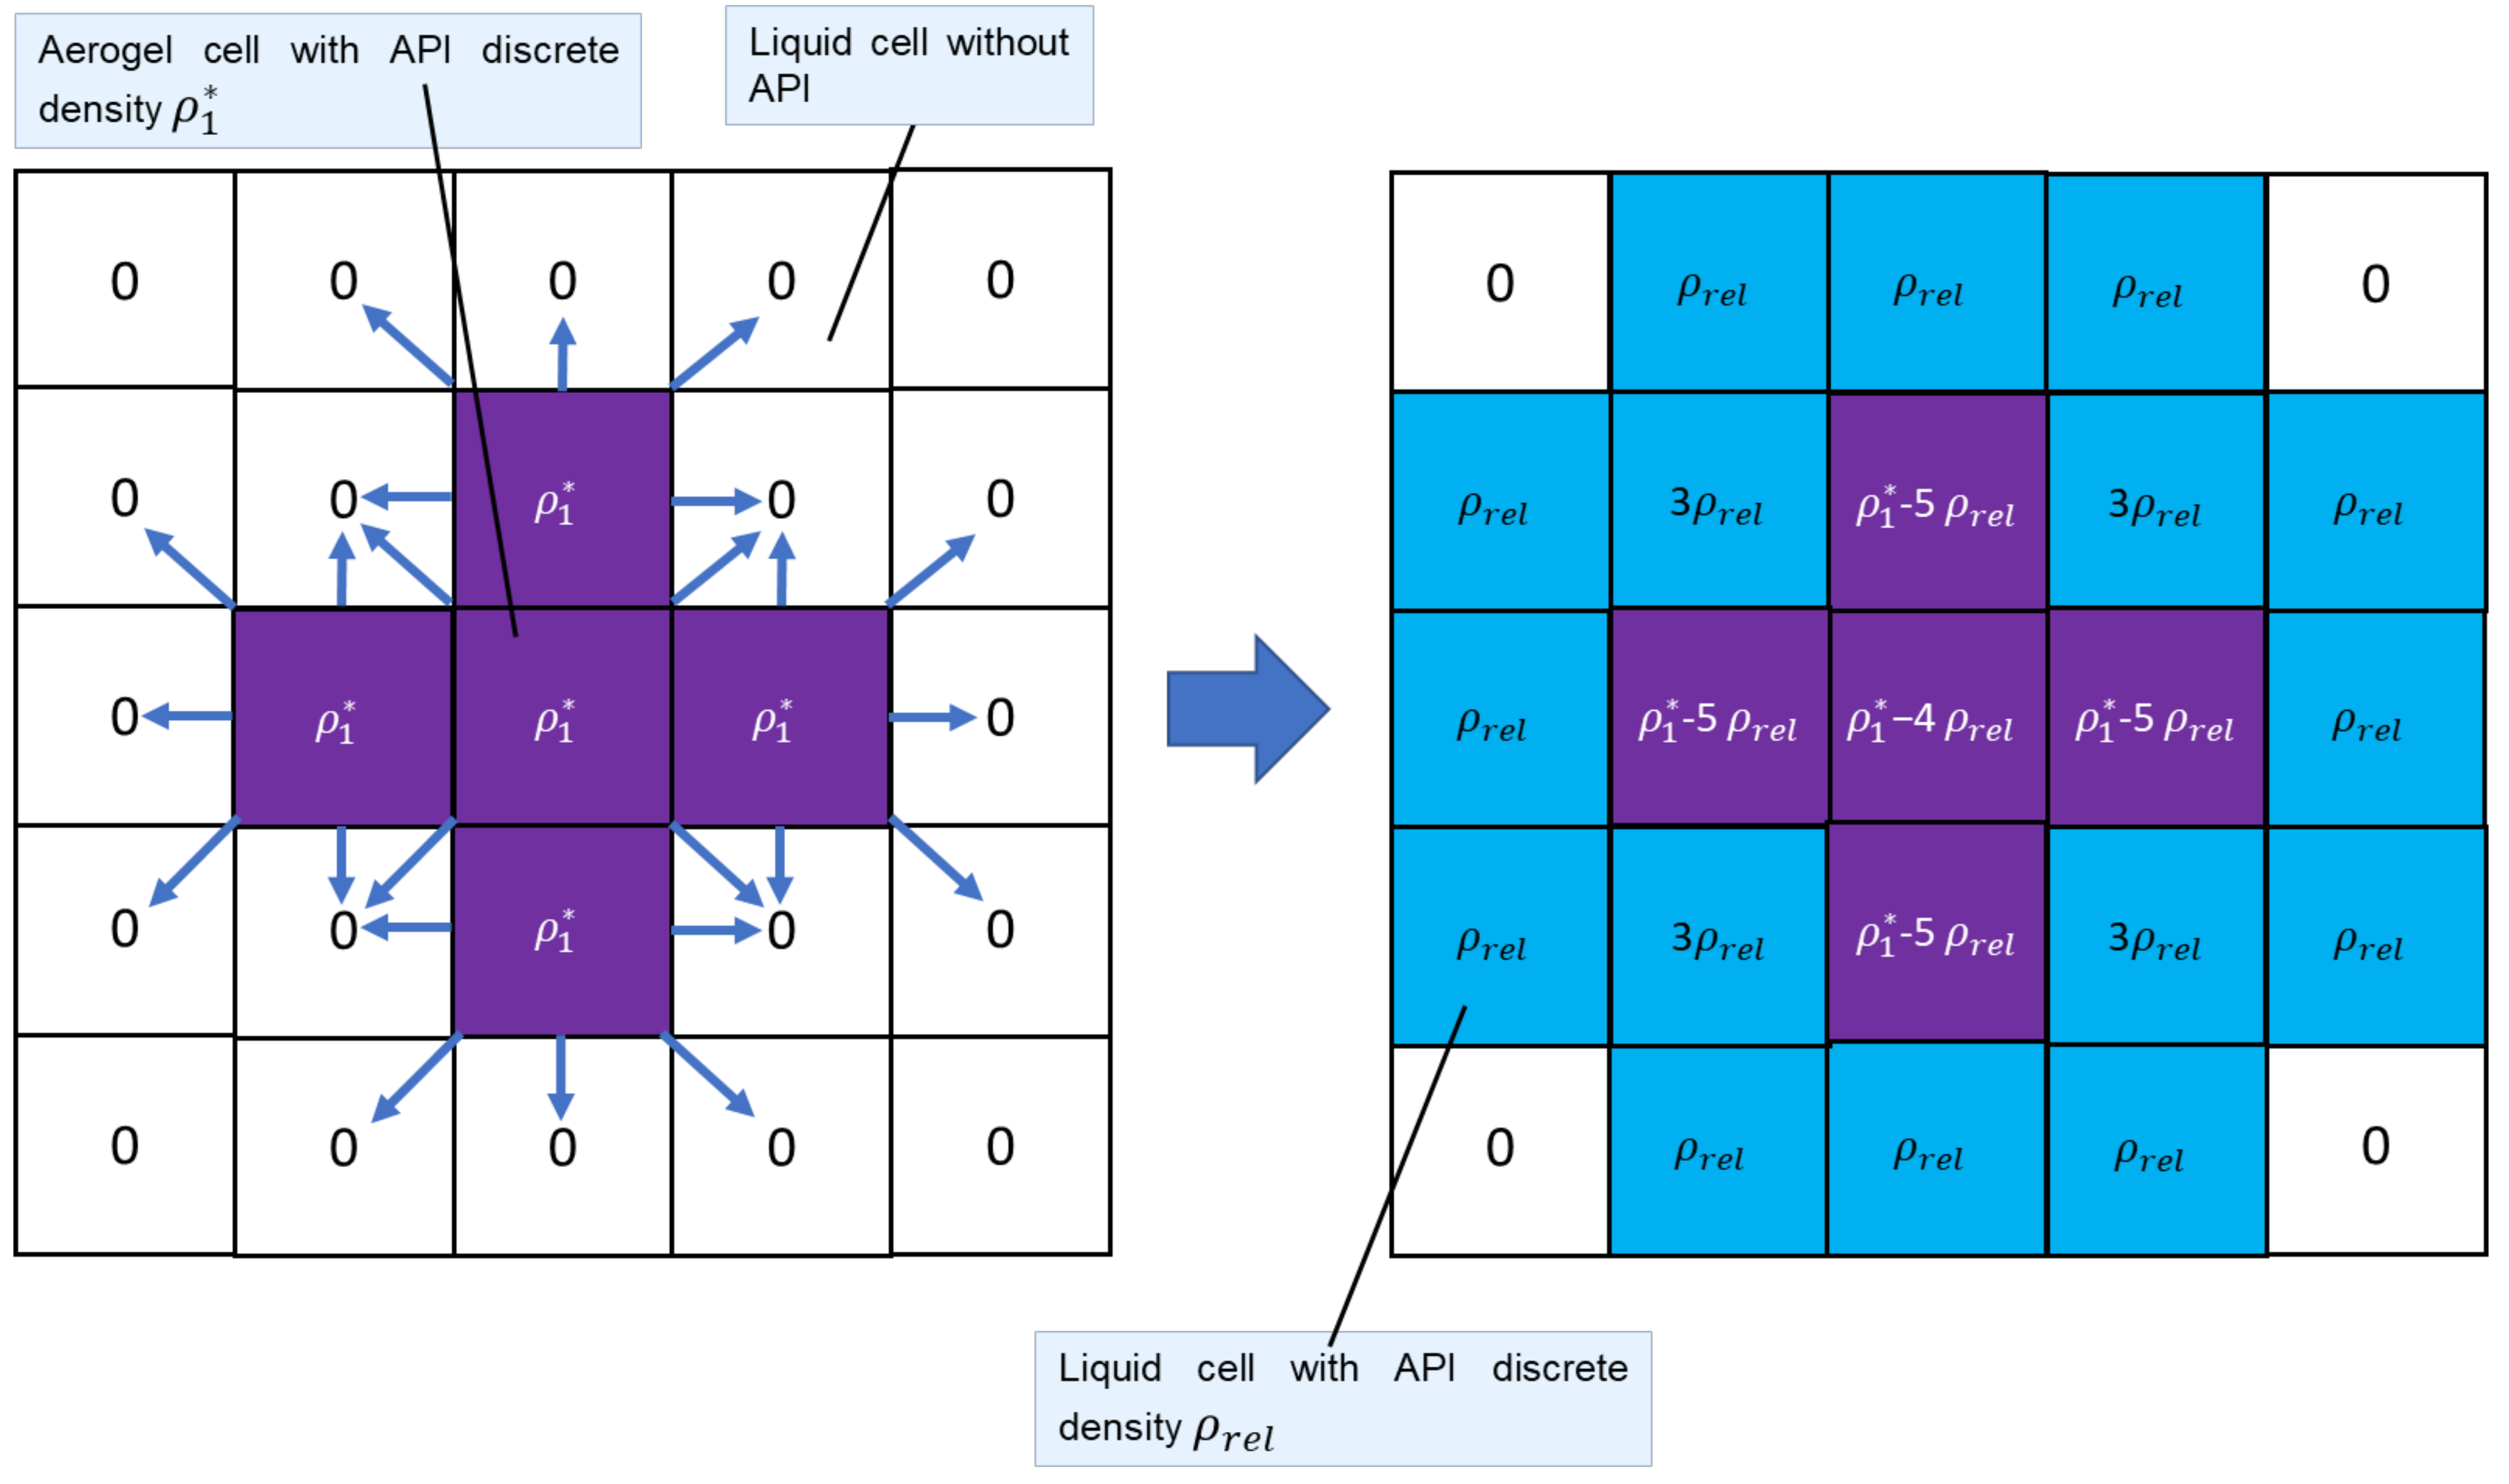
In the model, at each time step, the release of API from cells with the state “Aerogel with impregnated API” into neighboring cells is calculated. This release can be performed only in cells in a “Liquid” state. Additionally, the “Aerogel with impregnated API” has a limited predetermined amount of API in the cell.
The discrete API density ρ r e l , which should be released into the neighboring cell with the “Liquid” state, is calculated from the concentration change obtained from (11).
The discrete cell density changes accordingly:
ρ 1 , c u r * t s t e p + t * = ρ 1 , c u r * t s t e p ρ r e l ,
ρ 1 , n e i g h * t s t e p + t * = ρ 1 , n e i g h * t s t e p + ρ r e l ,
where ρ 1 , c u r * —API discrete density in the current cell; ρ 1 , n e i g h * —API discrete density in a neighboring cell.
Figure 7 shows an illustration of the cellular automata release model.
The API flow between cells with the state “Liquid” is calculated according to the LBM.
The proposed model is combined with the LBM, and the locality of the transition rules allows modeling the complex behavior of the system with relatively simple calculations.

3.3. Hybrid Model of API Release and Its Flow in the Nasal Mucus Processes

A hybrid model of API release and its flow in the nasal mucus processes was developed. The proposed model consists of a transport process model based on the LBM and an API release model based on a cellular automata approach.
The main idea of the model is as follows. At each time step, API is released from cells with the state “Aerogel with impregnated API” into neighboring cells with the “Liquid” state according to the transition rules of the cellular automata described in Section 3.2. Then, the API and the solvent (nasal mucus) flows between the cells with the “Liquid” state are calculated according to the LBM. An illustration of the model work is shown in Figure 8.
The model input parameters are the length L and width H of the system in meters, the size of the cell Δ x in meters, the time step Δ t in seconds, the kinematic viscosity υ in m2/s, the speed of sound in the liquid c in m/s, the number of time steps T, the maximum API concentration Cs in solution in g/mL, and initial field configuration. The initial field configuration contains all the initial properties of all cells.
These parameters depend on each other, so after setting some of them (for example, lattice length and width, time, viscosity, and density), the remaining parameters should be calculated. The relaxation parameter τ is related to the model parameters by the following [22]:
υ = c s * 2 τ 1 2 Δ x 2 Δ t ,
where c s * —discrete speed of sound, which equals 1/3.
In this case, by setting the lattice length and width and the time step, since the fluid viscosity is known, the relaxation parameter τ is calculated.
Simultaneously, to maintain system stability and sufficient simulation accuracy, the parameters must lie within certain ranges: the cell size must not exceed the size scale of liquid molecules, the relaxation parameter must lie in the range from 0.5 to 2, and the maximum discrete velocity u m a x * * must not exceed 0.2–0.4 [22].
D2Q9 type was chosen as the lattice model. Initial conditions and the initial field configuration should be set before beginning. After that, the relaxation parameter τ is calculated. Each time step is divided into three parts: the release step, the streaming step, and the collision step.
At the beginning of the release step, the total number of particles of the already released API in the entire system C is calculated. Then, for each cell that has the “Aerogel with impregnated API” state and has API, its neighboring cells are checked. If a neighboring cell is in the “Aerogel with impregnated API” state, no API is released into that cell. If the neighboring cell is in the “Liquid” state, ρ r e l   API is released from the current cell to the neighboring one. ρ r e l is calculated with (11).
The streaming step is calculated as follows. The particles of each cell move to the neighboring ones in accordance with their motion direction. During this phase, there are no flows through cells with the state “Aerogel with impregnated API”.
During the collision step, a new particle distribution in directions is calculated for each cell. First, a discrete macroscopic velocity vector u * is calculated for the cell. If the cell lies on the left boundary, then u * is set in accordance with the given boundary conditions; otherwise, it is calculated by (9), where the discrete density of the cell ρ * is the sum of the discrete densities of the API and the solvent ρ 0 * + ρ 1 * . Then, the equilibrium distribution function is calculated for each k direction for the solvent f k , 0 e q and for the API f k , 1 e q :
f k , 0 e q = d k ρ 0 * 1 + 3 e k · u + 9 e k · u 2 2 3 u 2 2 ,
f k , 1 e q = d k ρ 1 * 1 + 3 e k · u + 9 e k · u 2 2 3 u 2 2 ,
where ρ 0 * —discrete density of the solvent in the cell; ρ 1 * —discrete density of API the cell; d k —direction weight.
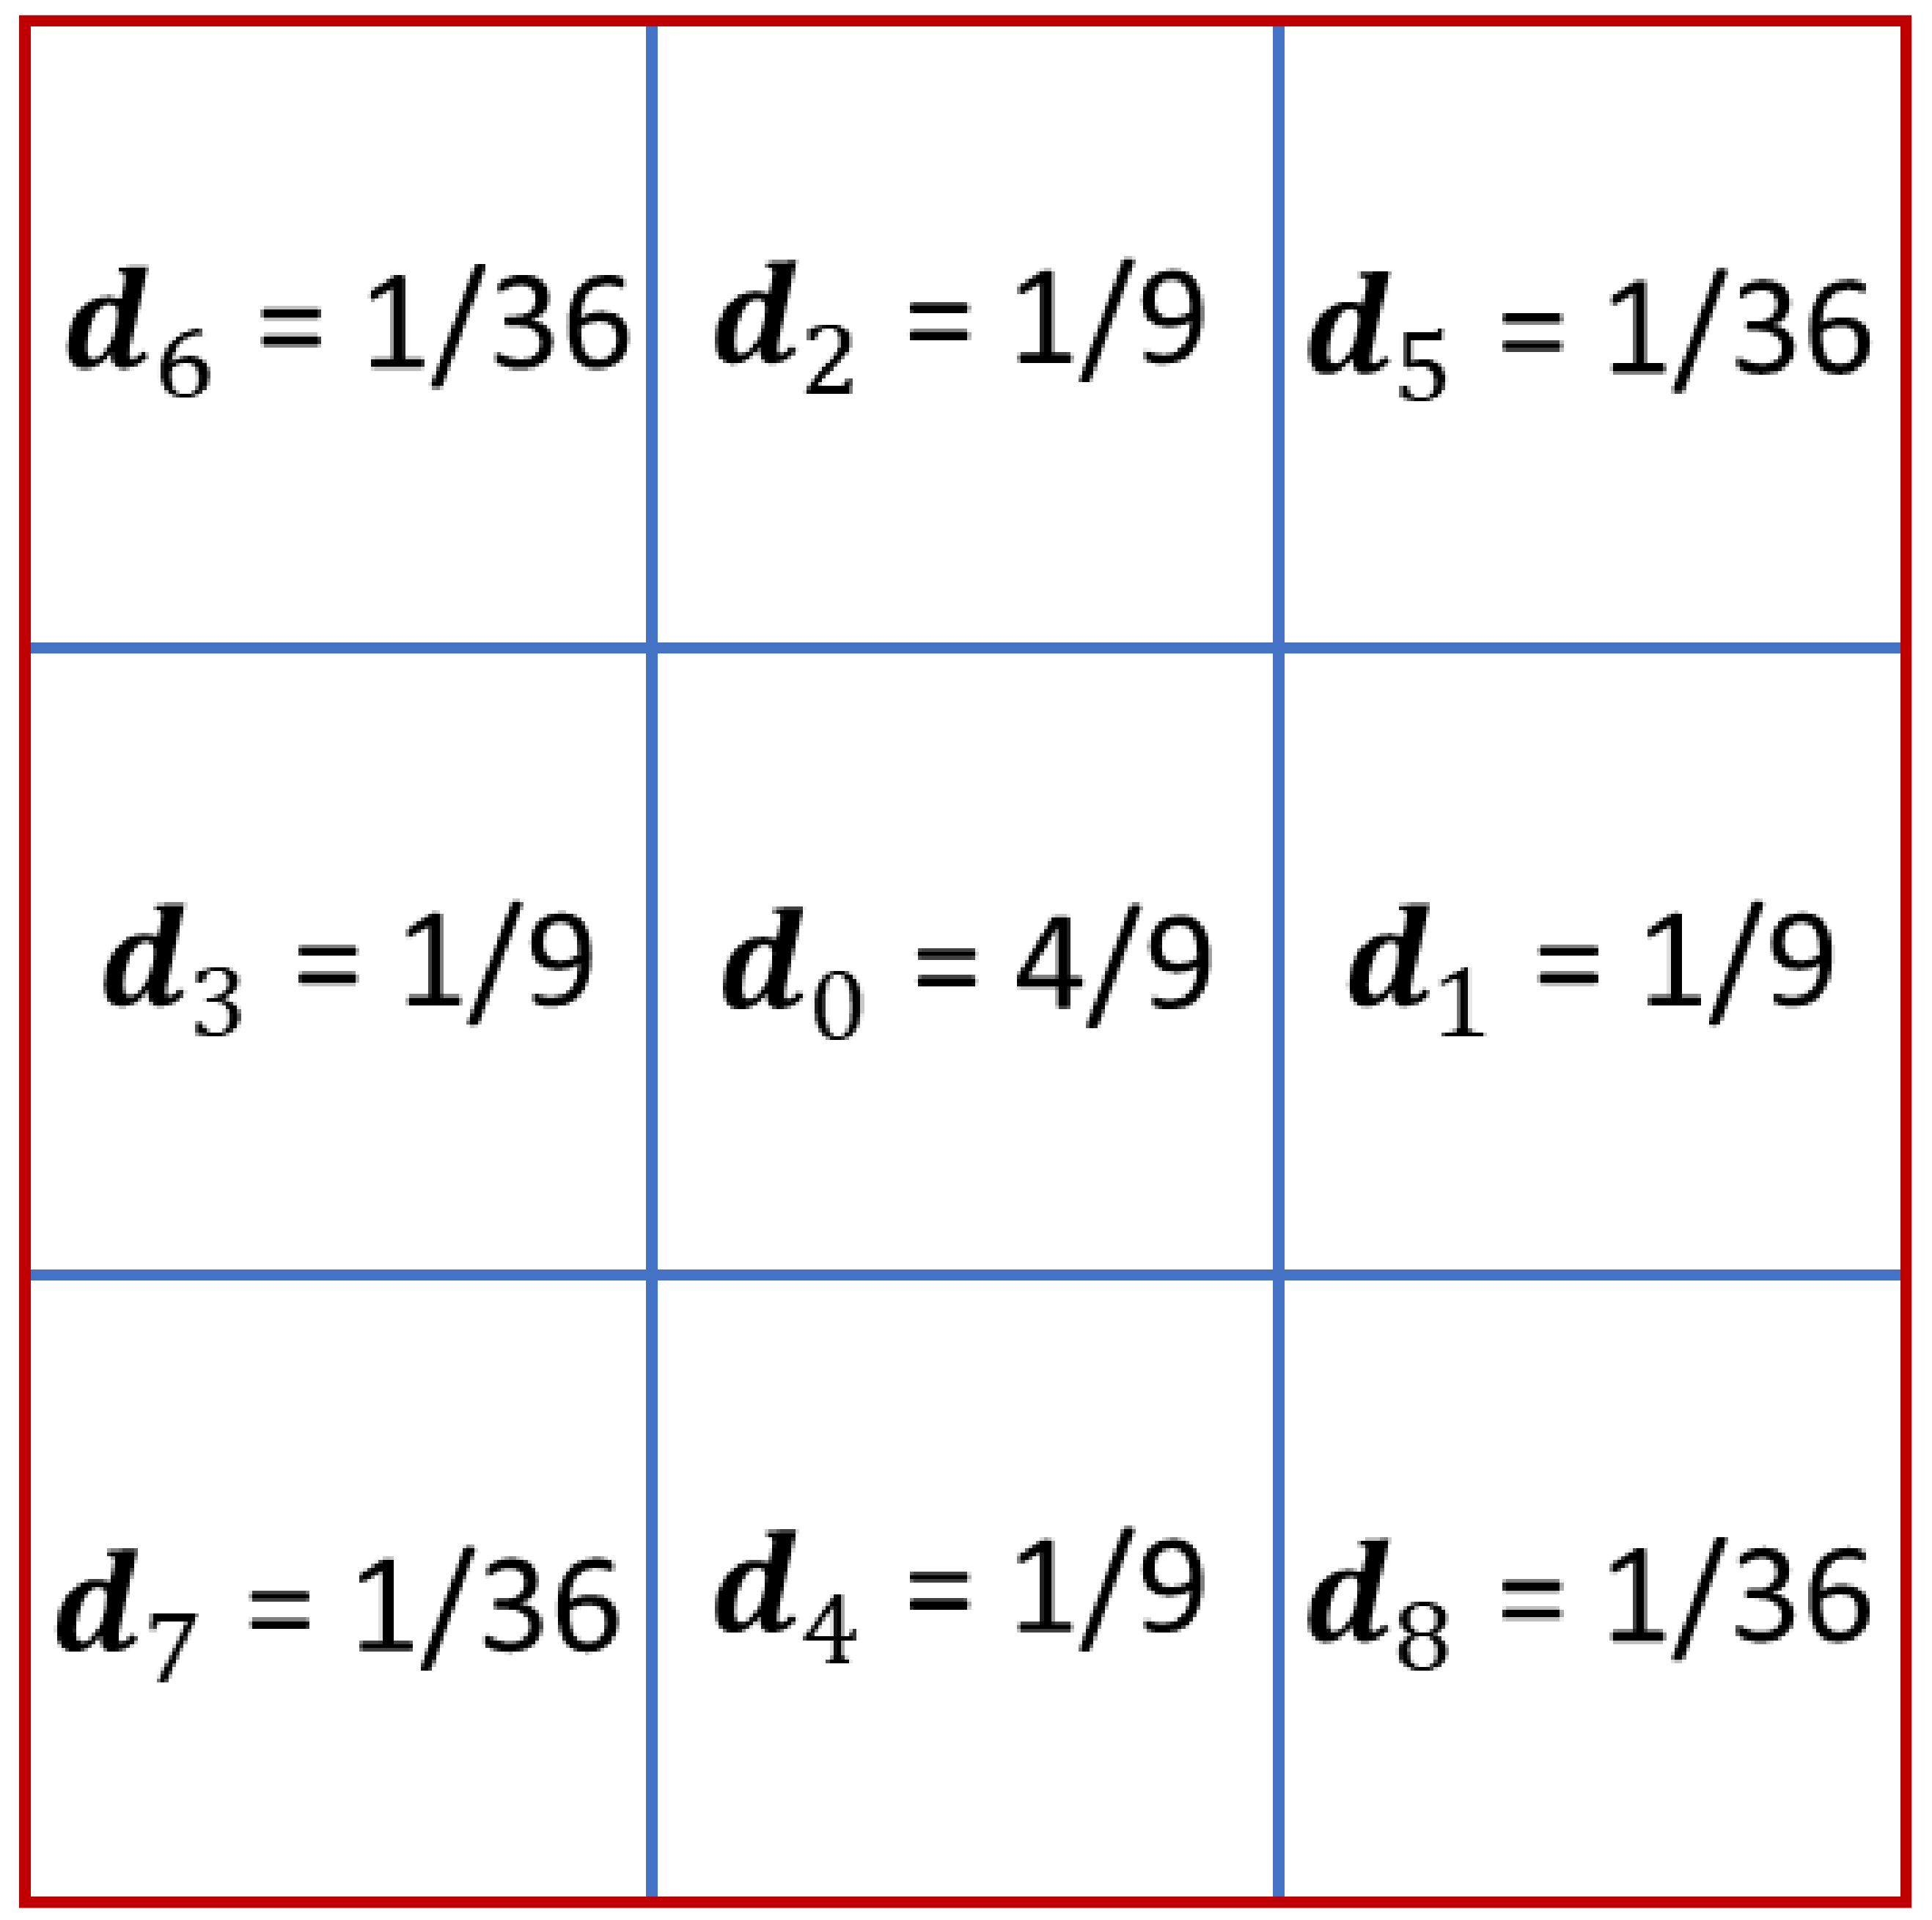
The direction weights are different for different lattice models. In the case of the lattice D2Q9, they take the following values:
d k = 4 9   when   k = 0 1 9   when   k 1 ; 4 1 36   when   k 5 ; 8
where k = 0 corresponds to the zero direction vector characterizing the particles, which do not move; k 1 ; 4 corresponds to directions that lead to cells that have a common side with the current; k 5 ; 8 corresponds to directions that lead to the cells located diagonally from the current (Figure 9).
Then, the final distribution values of solvent f k , 0 and API f k , 1 are calculated:
f k , 0 i , t s t e p + t * = f k , 0 i , t s t e p f k , 0 i , t s t e p f k , 0 e q τ ,
f k , 1 i , t s t e p + t * = f k , 1 i , t s t e p f k , 1 i , t s t e p f k , 1 e q τ ,
where t s t e p —current time step; t * —single time step value ( t * = 1 ) ; i —current cell number.
Figure 10 shows an example of the cell states in the system after several steps of the algorithm.
The model continues the calculation until the number of time steps T has passed. The final result is a field configuration with the calculated discrete density of each component at each time step. These data allow calculating the total concentration of each component at each point in time and plot the dependence of API concentration on time.
The developed model was used to calculate the processes of API release and its flow after the deposition of aerogel particles in the human nasal cavity.

4. Results

To model the processes of API release and its flow during the deposition of aerogel particles in the nasal cavity, a model nasal cavity was created.
The flow patterns in all nasal cavities have similar features. The air flow spreads mainly along the common nasal passage and along the adjacent areas of the lower and middle lateral passages. The maximum longitudinal velocity is observed in the region of the nasal valve, except in cases of exceptional structure of the nasal cavity with a large deviation from the horizontal position [23]. The biochemical composition of nasal mucus is water 95%, proteins and glycoproteins 2–3%, lipids 1%, minerals 1%, and DNA 0.02%. Glycoproteins make up 80% of the dry weight of mucus. Mucins are high-molecular-weight polydisperse glycoproteins, consisting of approximately 80% carbohydrates with molecular weights from several hundred thousand to more than 1 million Daltons [26]. A viscosity range close to 15 Pa s is considered optimal for mucociliary clearance.
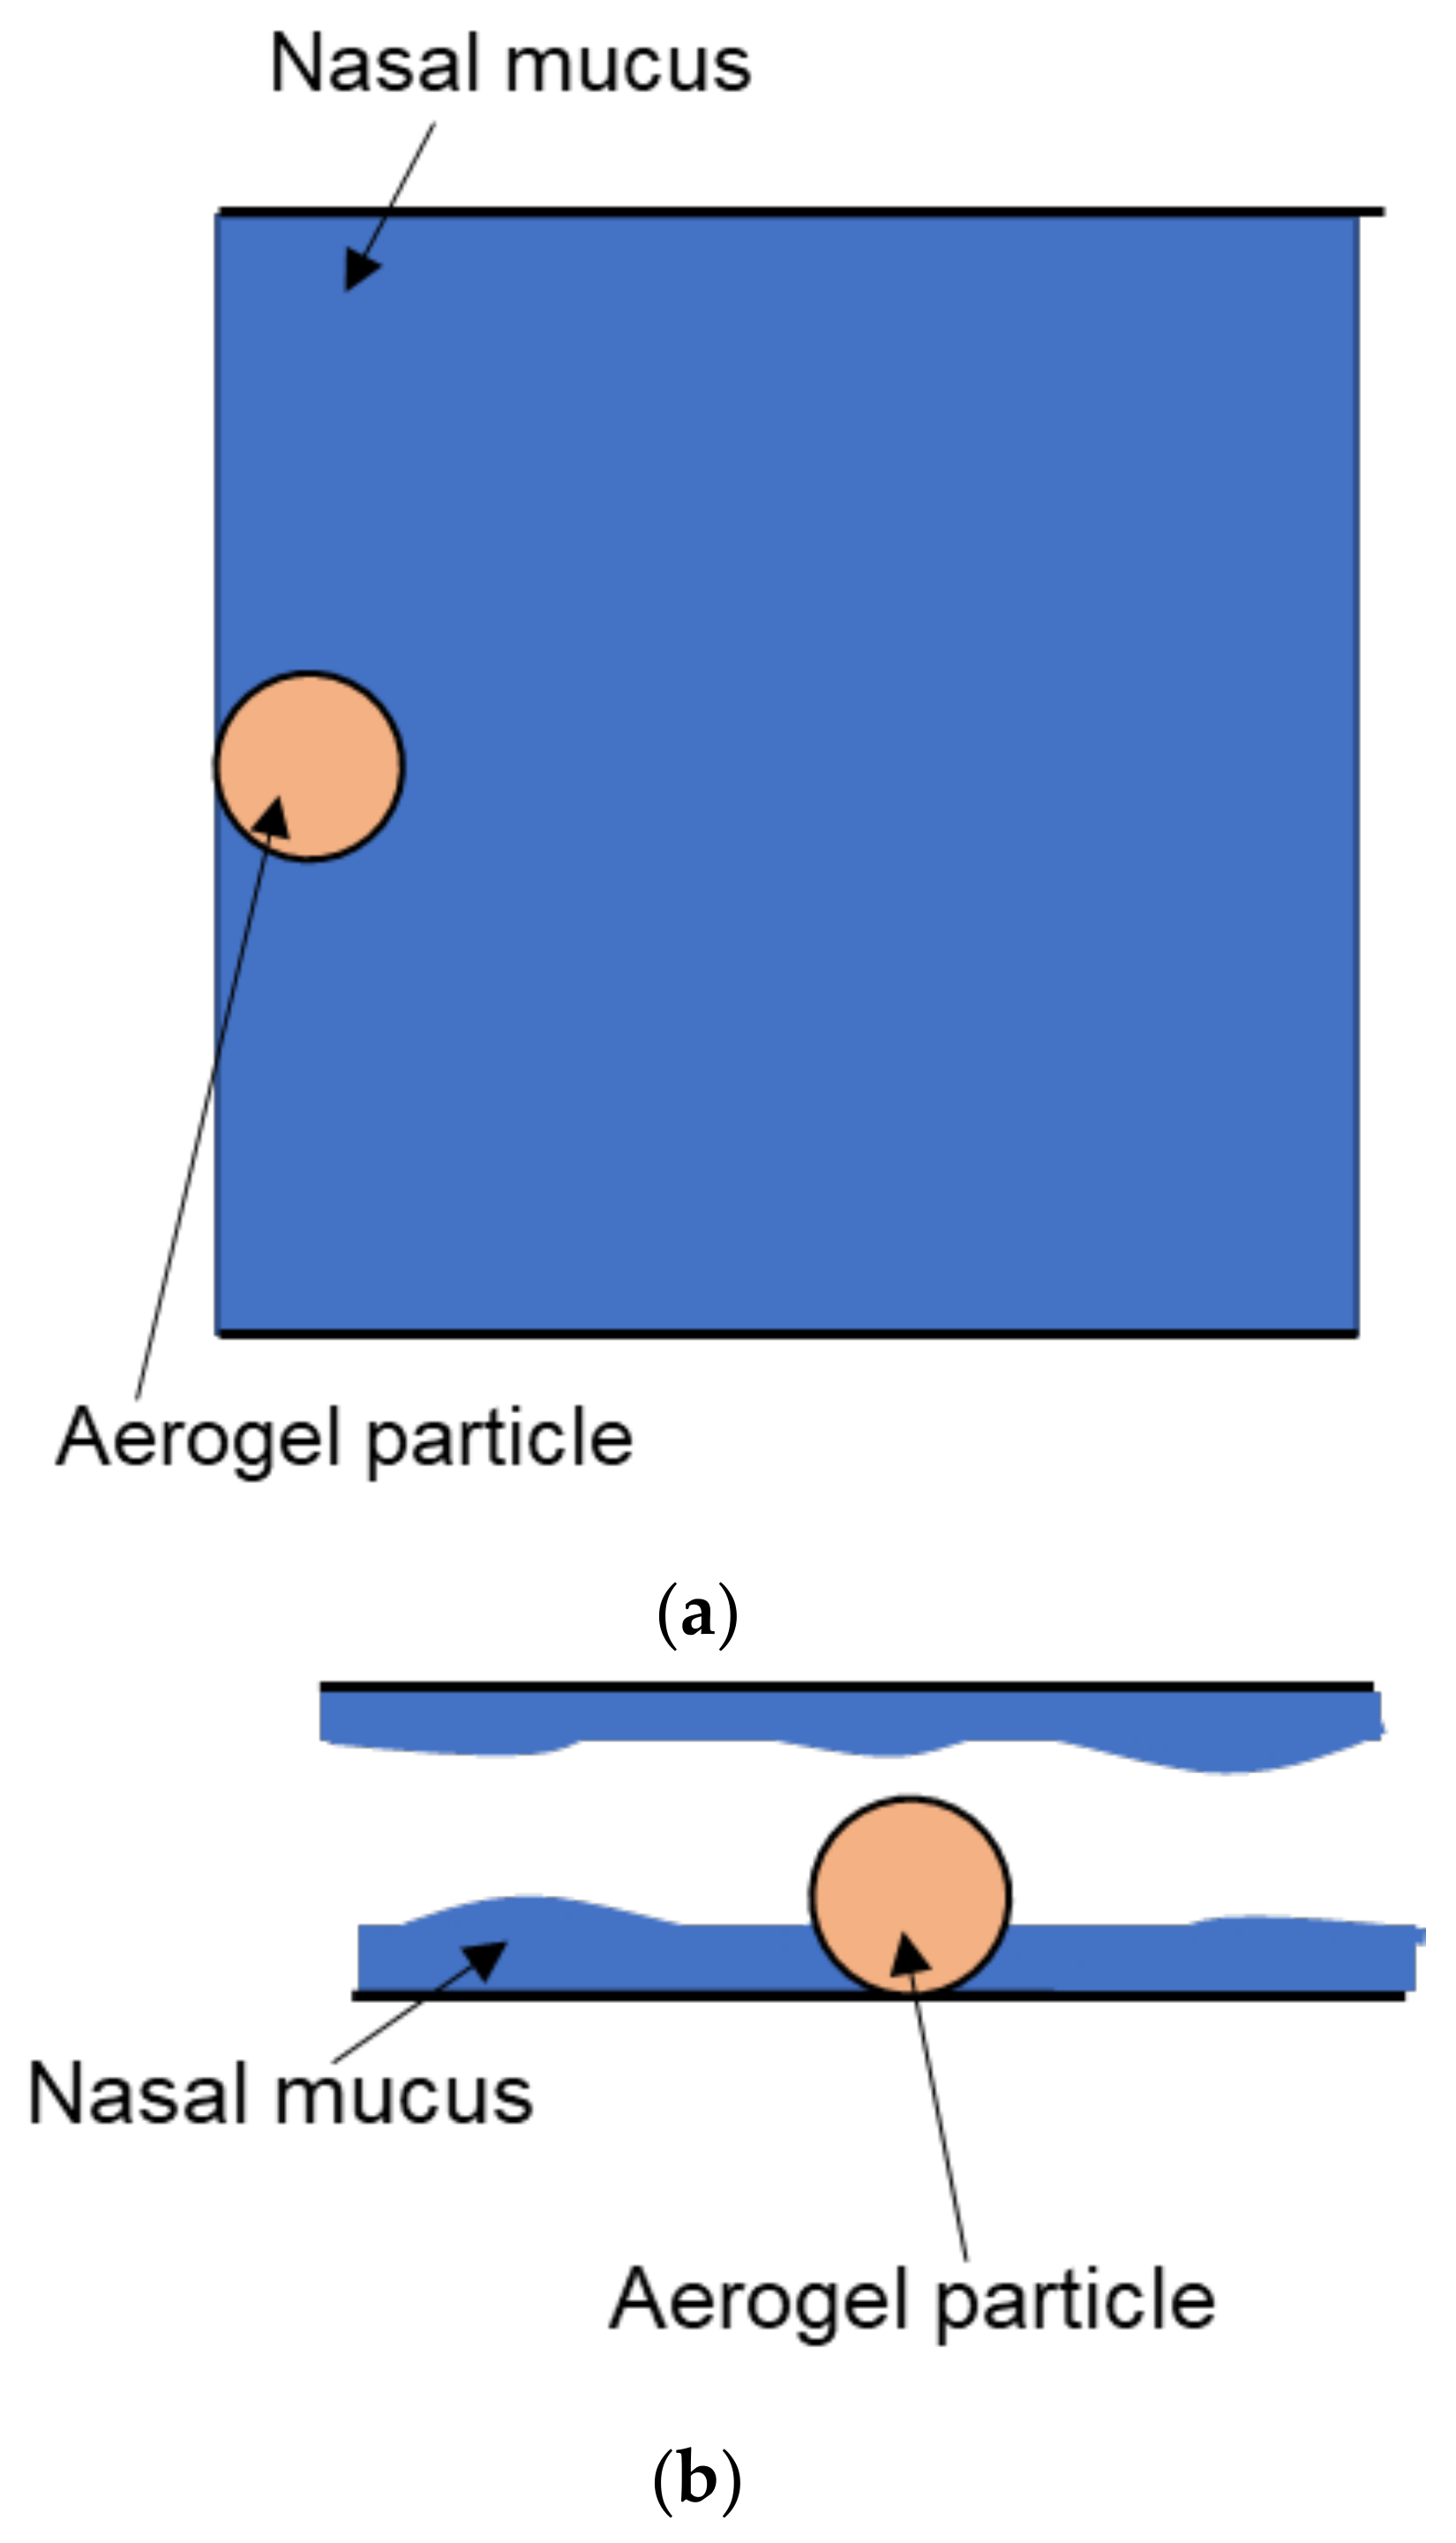
In this work, the deposition of aerogel particles in the upper posterior region of the nasal cavity was considered. This area covers an area of approximately 2.5 cm2. The model of the nasal cavity is a projection of the real cavity on the OXY plane (“top view”); thus, the model will consider the length and width, but not the depth. Figure 11 shows a model nasal cavity with a deposited particle in the OXY (“top view”, a) and OXZ (“profile view”, b) planes.
In the model, the following parameters of physical quantities and assumptions for the nasal cavity were adopted:
  • Length L = 2.2 cm, width H = 1.1 cm.
  • The flow velocity inside the cavity u m a x = 3 mm/min = 5 × 10⁻⁵ m/s, directed from left to right.
  • Nasal mucus is considered as a Newtonian fluid, so it has a constant viscosity during the calculation time.
  • Nasal mucus is homogeneous.
  • The density of nasal mucus ρmucus = 1000 kg/m3.
  • The value of dynamic viscosity is the same during the calculation time and is equal to η = 15 Pa∙s. Therefore, the value of kinematic viscosity is υ = η/ρmucus = 15 [N∙s/m2]/1000 [kg/m3] = 15 [kg s∙m/s2∙m2]/1000 [kg/m3] = 0.015 m2/s.
  • The speed of sound in the nasal mucus cs is 1500 m/s.
The model nasal cavity has 2.2 cm length and 1.1 cm width with a single cell size of 100 µm. Thus, the model lattice has a size of 220 × 110 cells. A D2Q9-type lattice was used as a lattice; therefore, fluid particles could move in eight directions or not move. The time step Δ t is 0.6 s, and the relaxation parameter τ is 0.8.
In the model nasal cavity, computational experiments were carried out to model the processes of API release from aerogel particles and API flow in the nasal cavity.
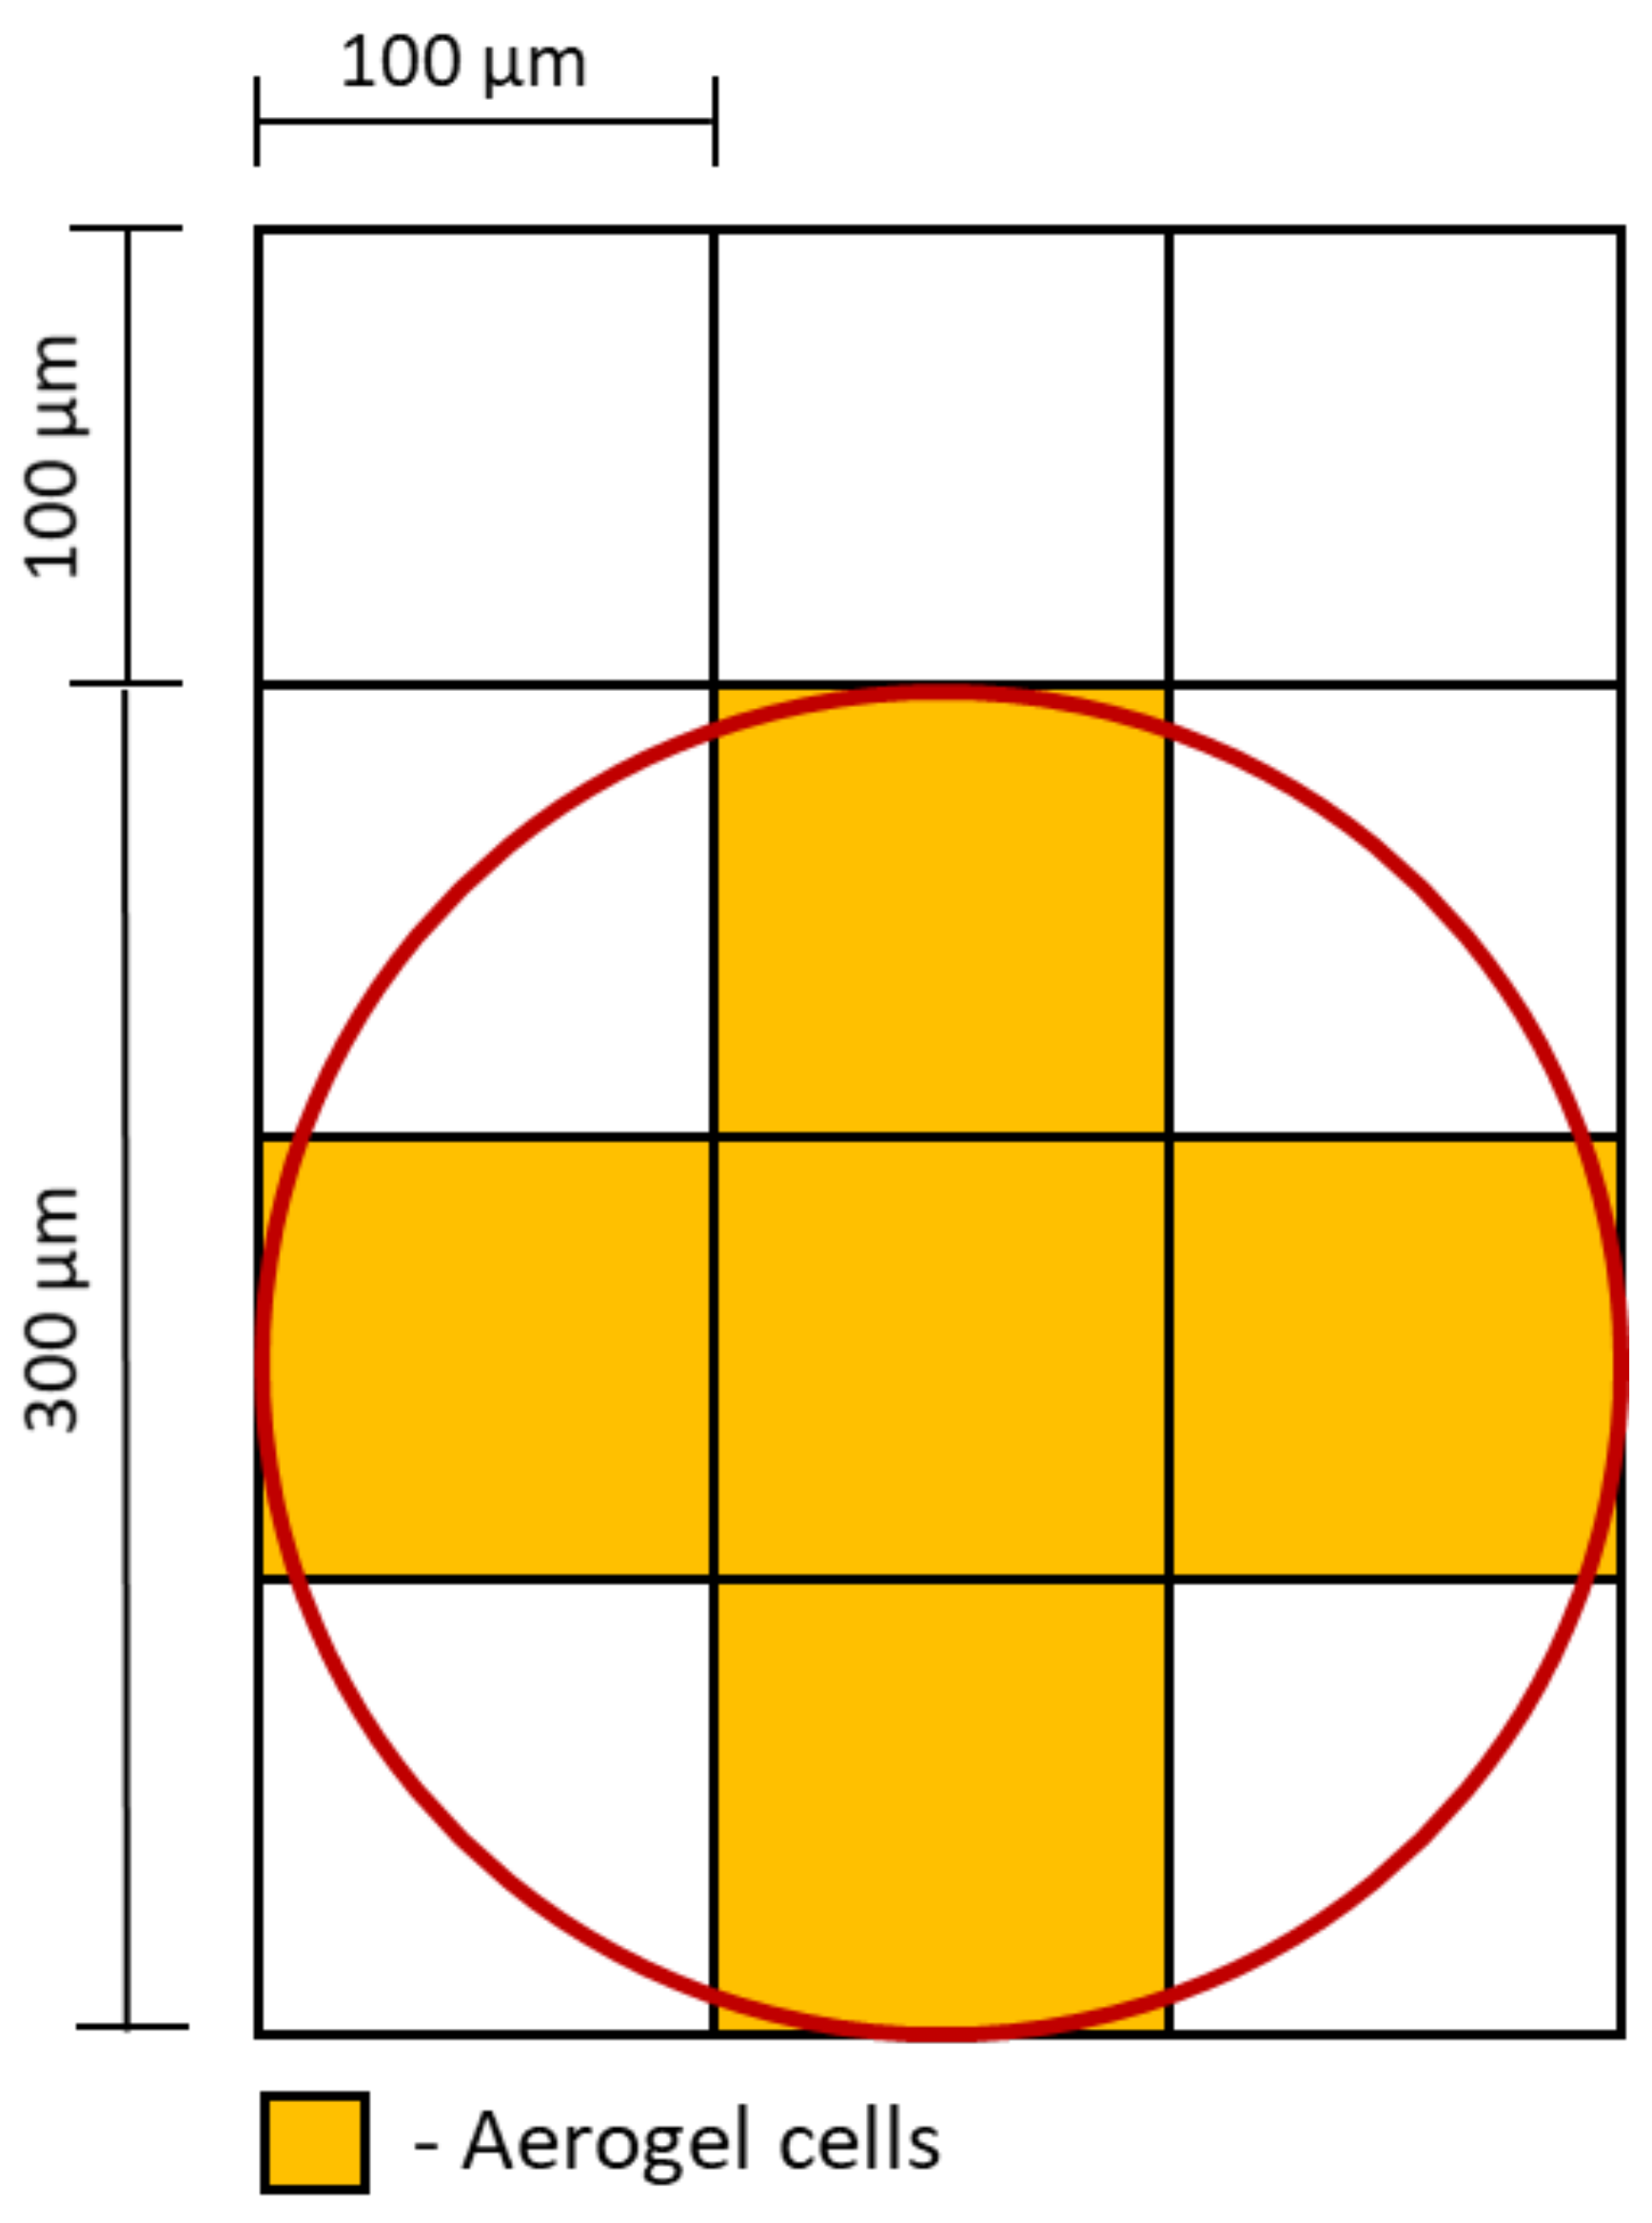
The experimental particles diameter ranges from 200 to 300 µm. A diameter of 300 µm was chosen as the working diameter in the model. Figure 12 shows a digital copy of an aerogel particle in the form of a set of cells, considering the lattice scale.
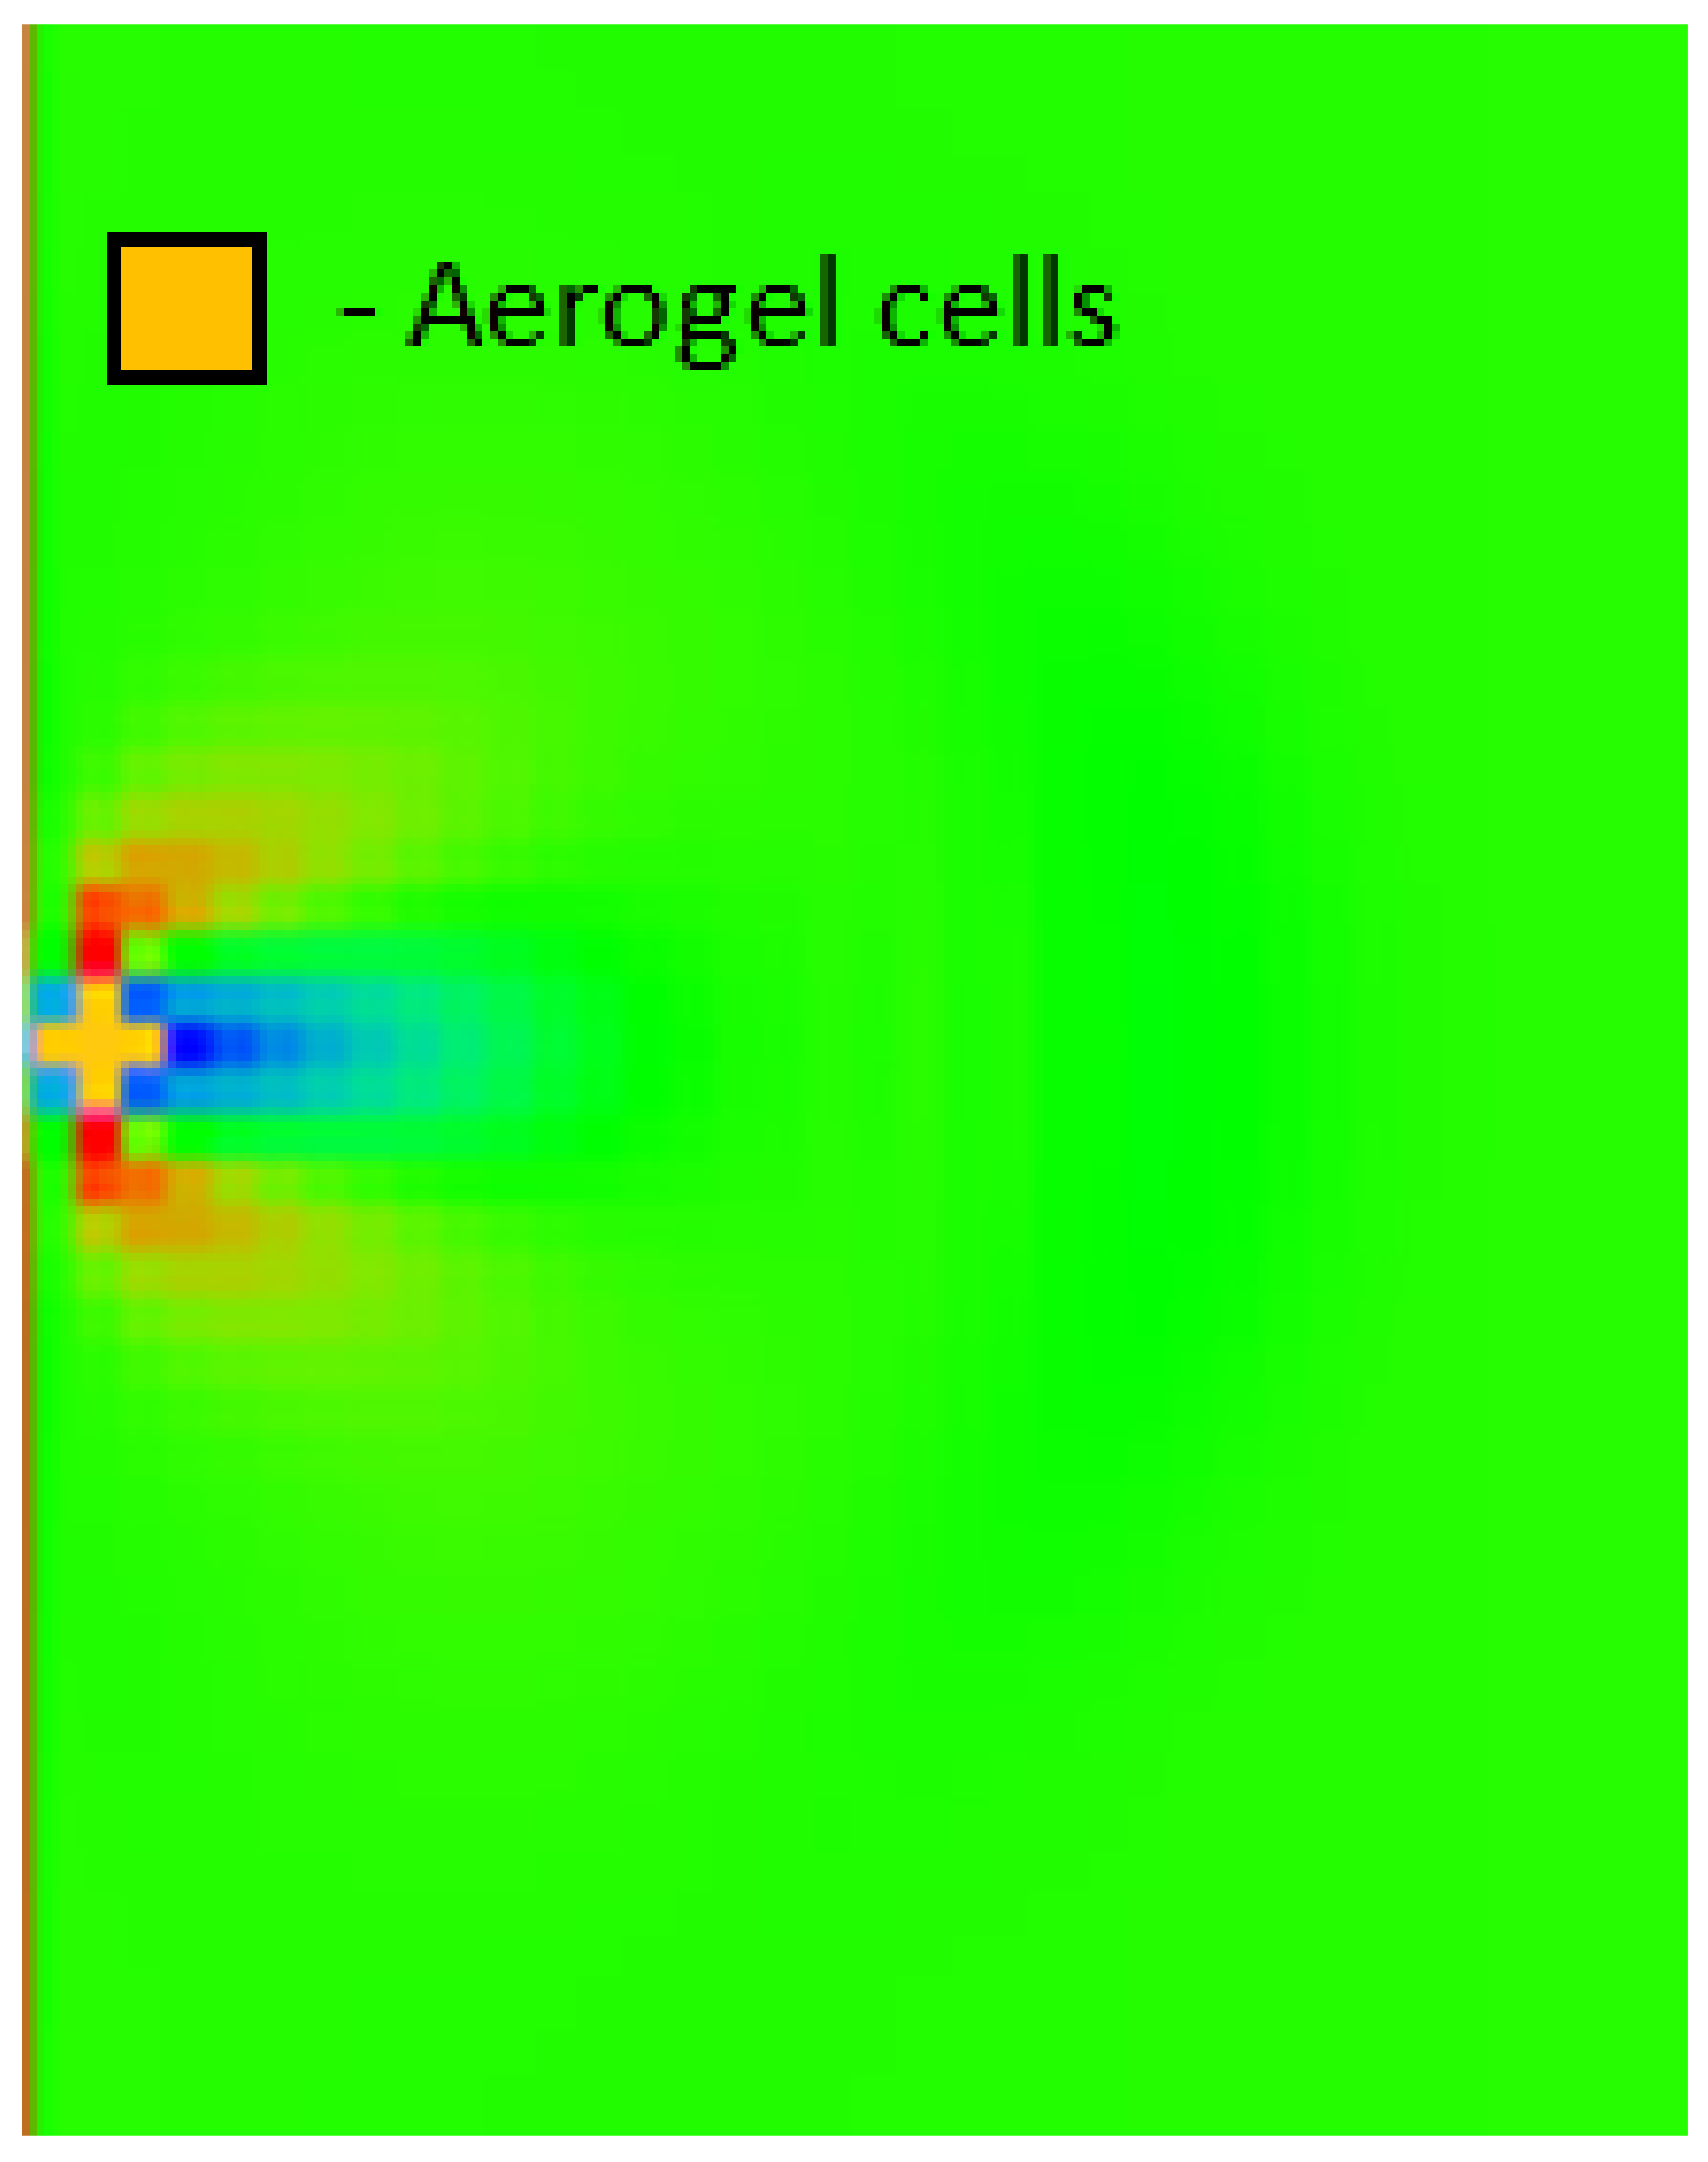
Figure 13 shows the visualization of flows with a deposited particle.
In each cell with the “Aerogel with impregnated API” state, the discrete densities for both components in the system, solvent ρ 0 * and API ρ 1 * , were established. ρ 0 * value was 107. The value of ρ 1 * was calculated from the known concentration of the API introduced into the particle.
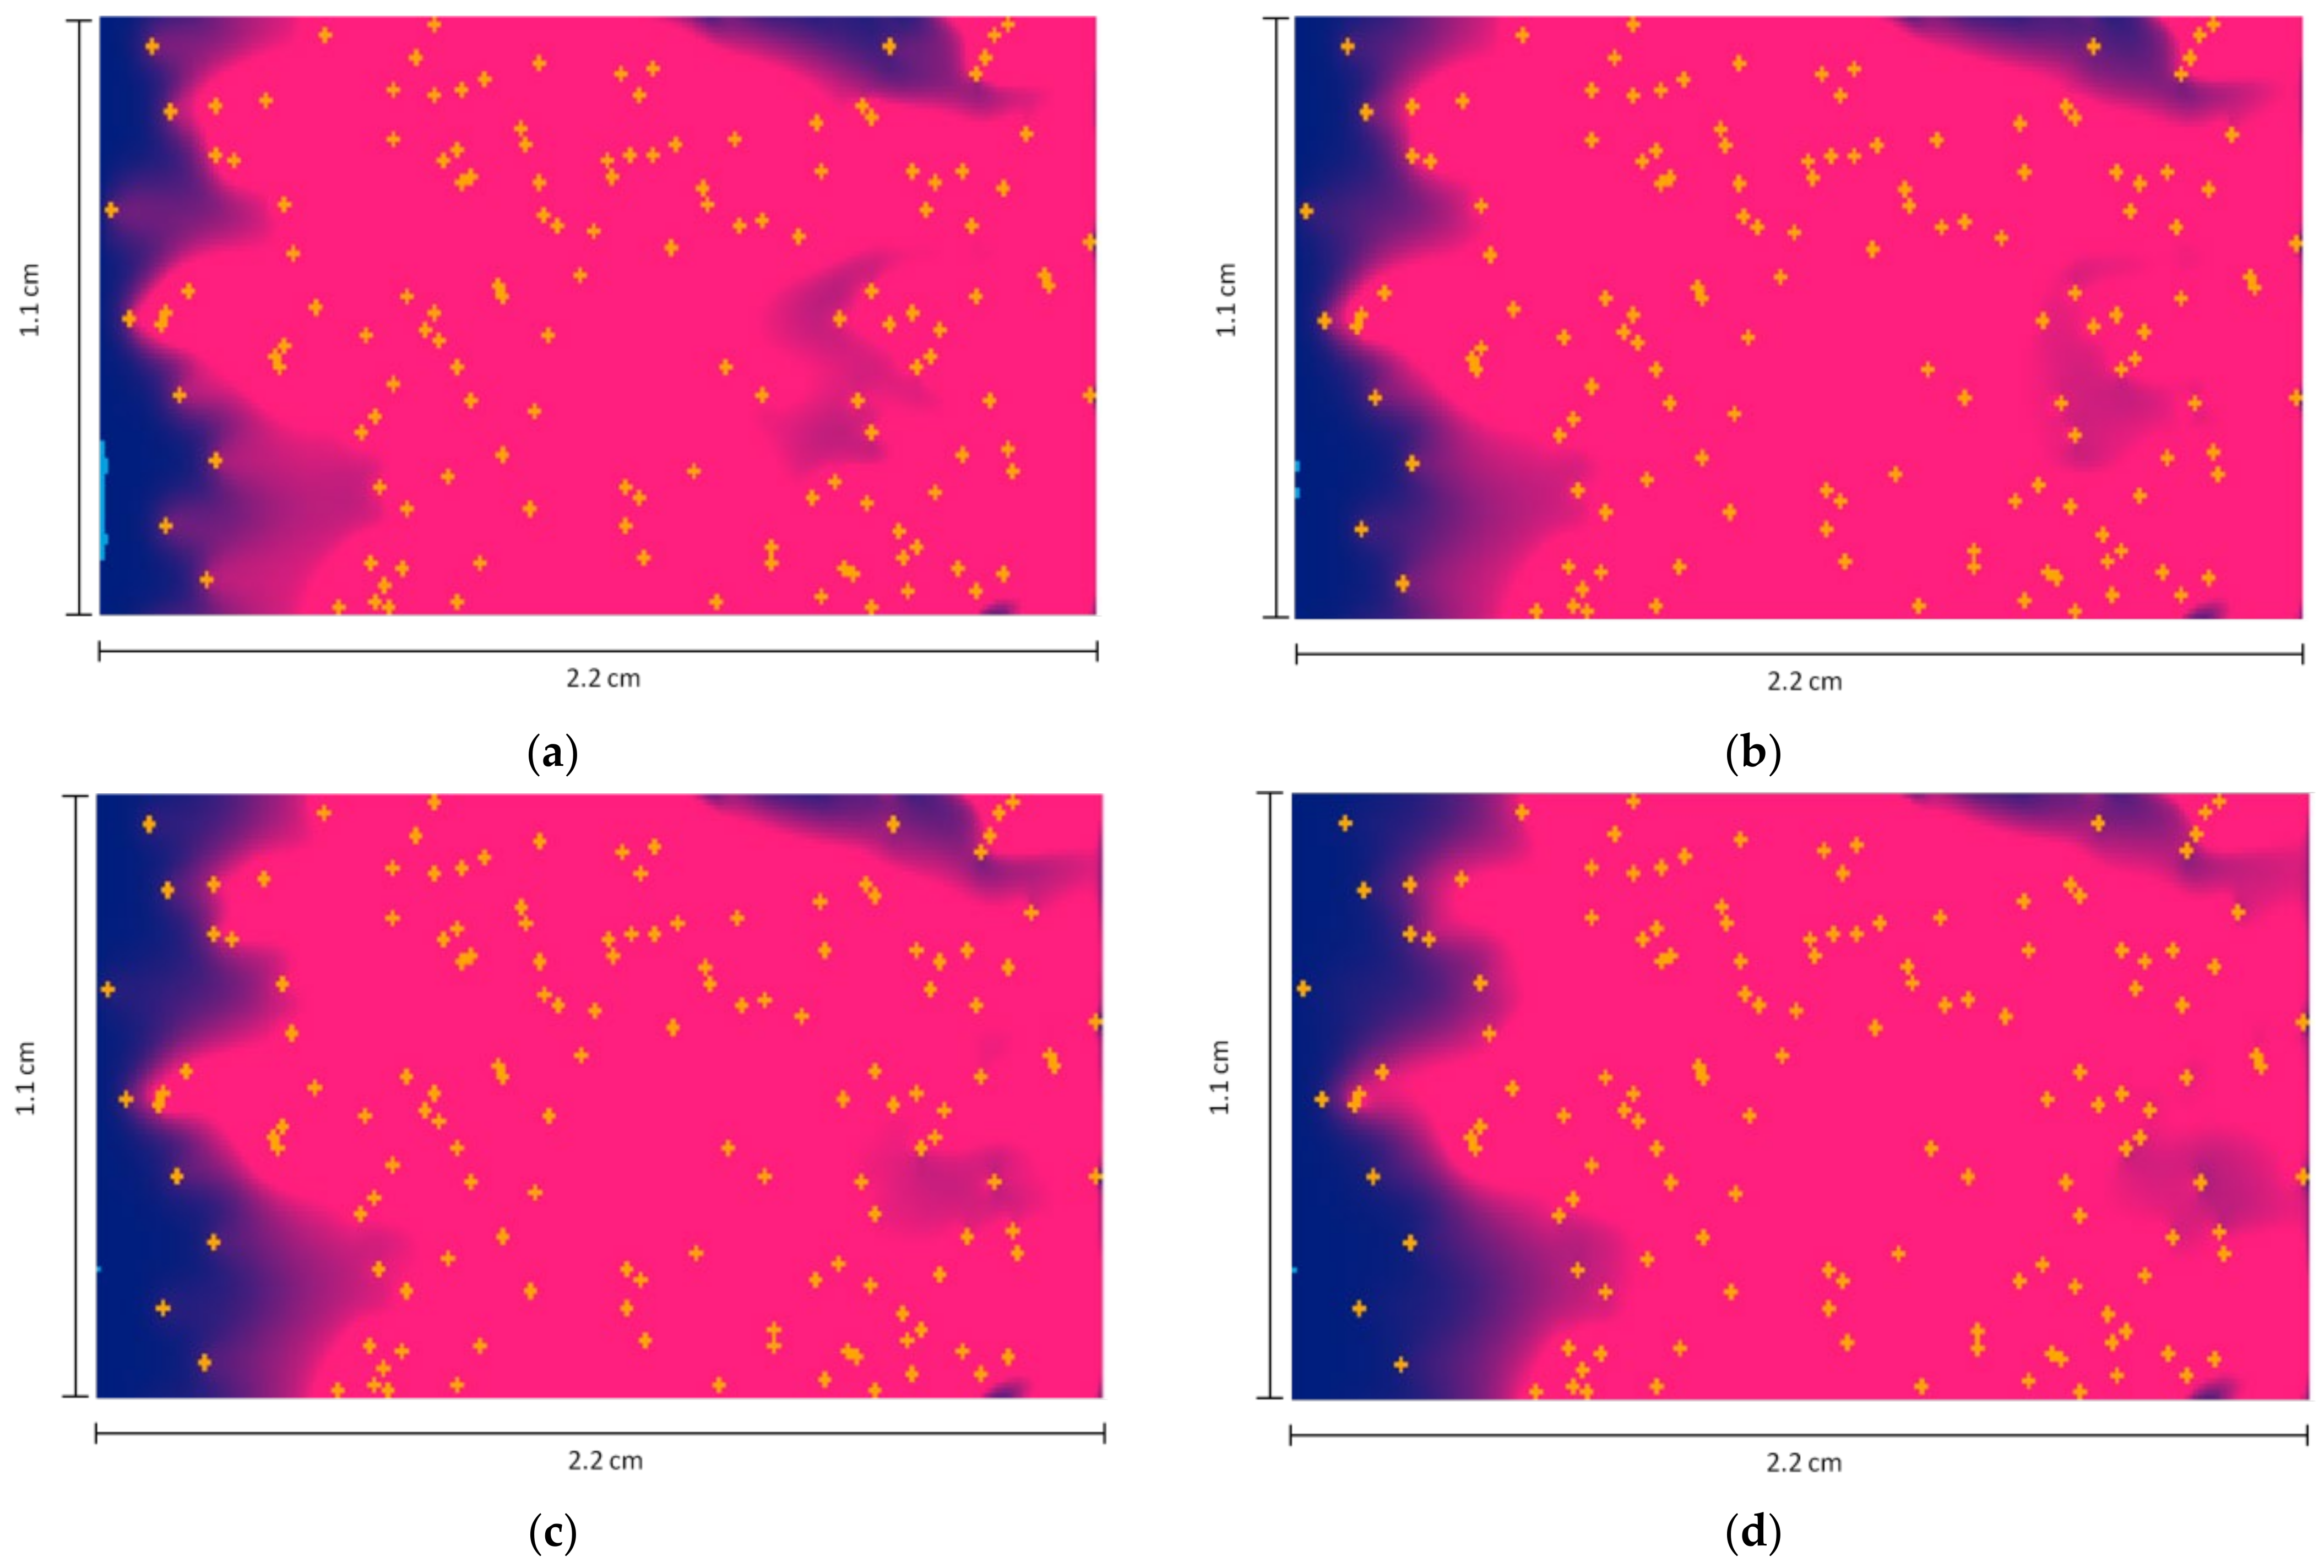
Computational experiments were carried out to model the release of API and API flow in the nasal cavity for four API–aerogel configurations: melatonin–chitosan, melatonin–protein, DSIP–chitosan, and DSIP–protein. Below are the results of computational experiments on modeling the processes of melatonin release from chitosan-based aerogel particles and its flow in the nasal cavity. The results for the other of the configurations are similar.
For a chitosan-based aerogel particle, the following model parameters were established:
  • The number of deposited particles is 141.
  • The discrete density of API (melatonin) in each cell is ρ 1 *   = 7.
  • Dissolution constant K = 2 × 10⁻⁶.
  • Maximum concentration of melatonin C s = 48 × 10−5 g/mL.
Figure 14 shows experimental and calculated curves of release values at different time points. Experiments 1–3 correspond to the experiments in Table 1.
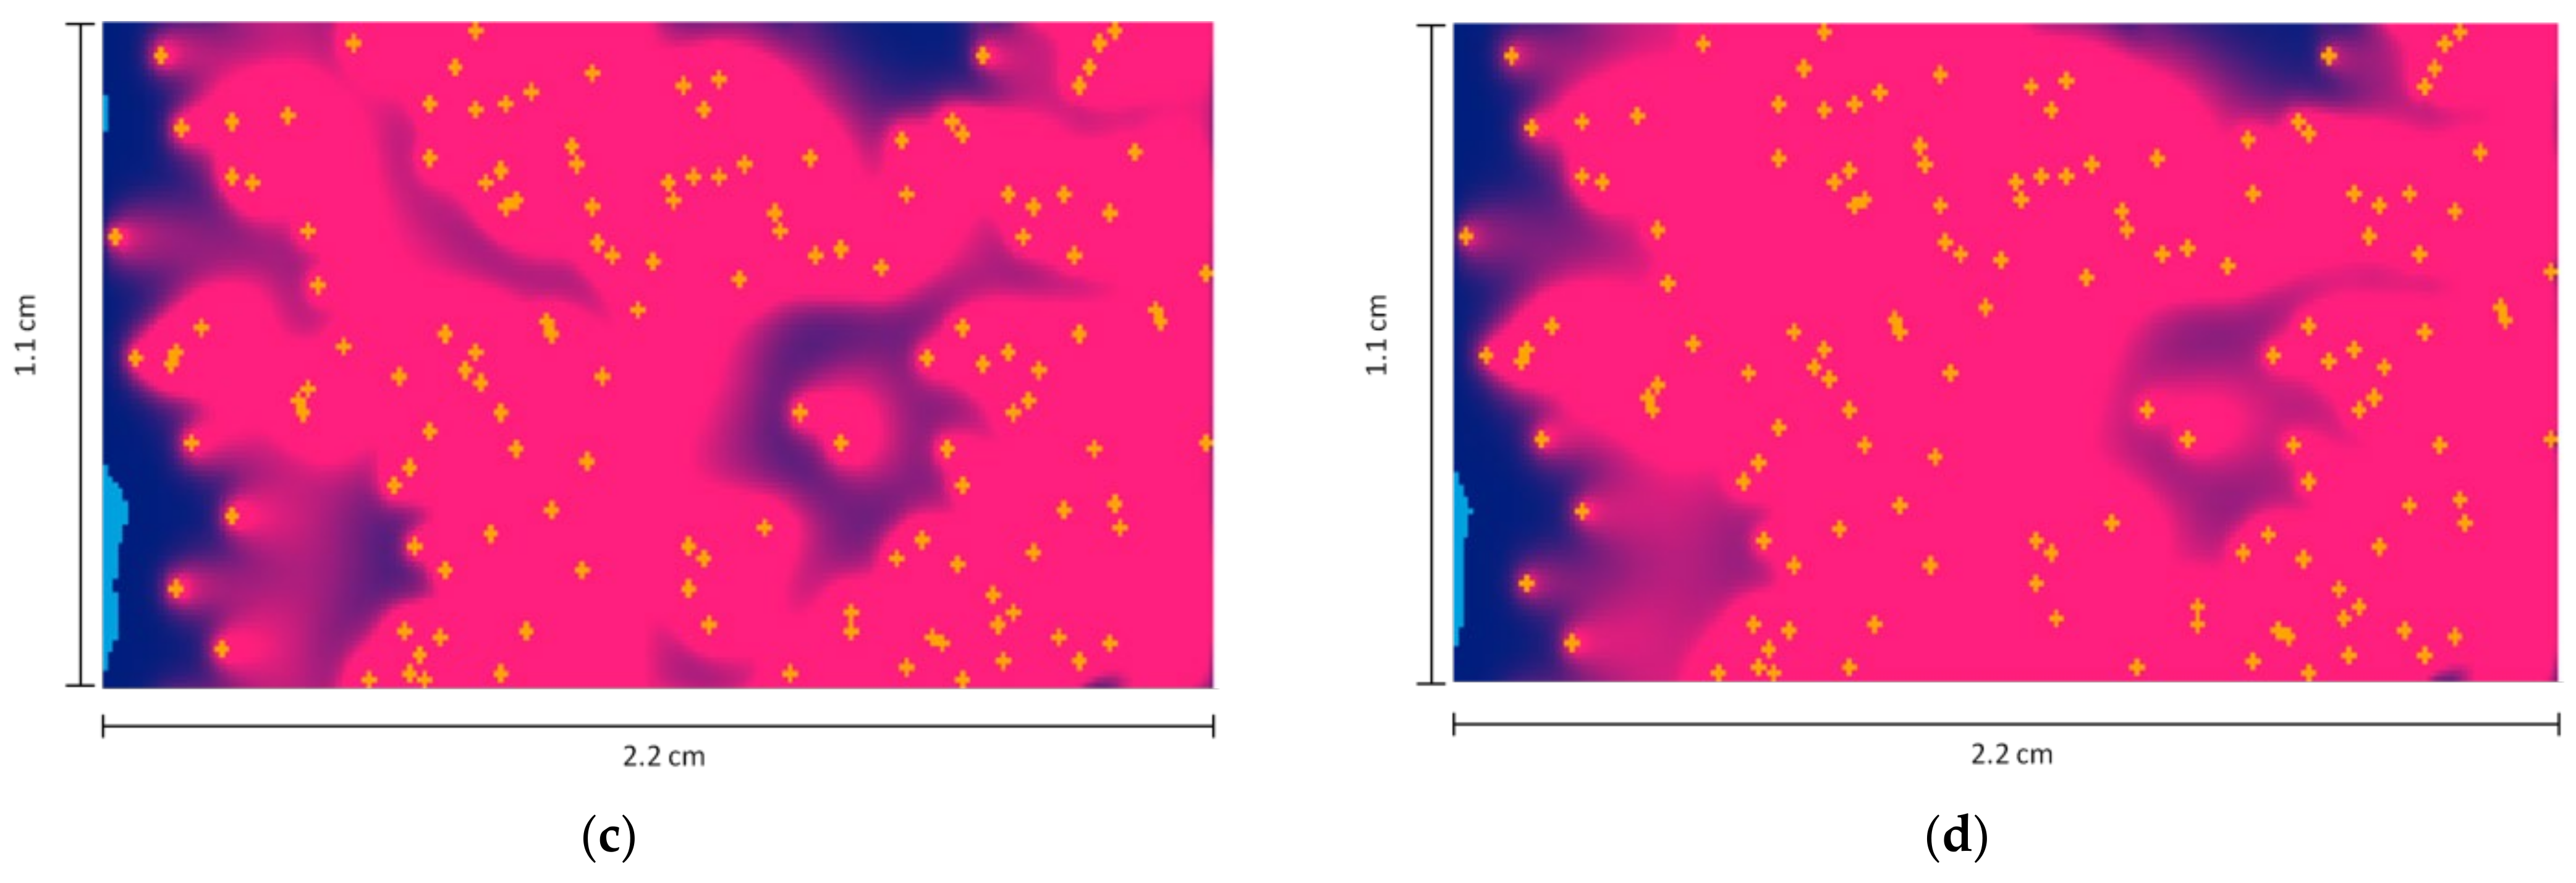
Figure 15 and Figure 16 show the visualization of the API concentration in the model nasal cavity at different time points for Experiment 1 (Table 2).
Table 2 compares the experimental and calculated values of released melatonin.
In Table 2, the deviation of the calculated values from the experimental values does not exceed 8.82%. The maximum deviation among all the computational experiments did not exceed 12.27%. Therefore, it can be concluded that the model works correctly.

5. Discussion

In this work, a hybrid model that combines the lattice Boltzmann method and the cellular automata approach was developed. The proposed model allows for predicting the processes of API release from aerogel particles and its flow in various media.
Experimental studies were carried out on the release of four API–aerogel combinations: melatonin–chitosan, melatonin–protein, DSIP–chitosan, and DSIP–protein.
Computational experiments were carried out to calculate the release from chitosan and protein aerogel particles’ corresponding API and their flow in the nasal cavity. The maximum deviation of the calculated values of the API concentration at different time points from the experimental ones does not exceed 12.27%, from which we can conclude that the model works correctly.
The proposed model can be used in modeling the processes of API release and transportation and in other two-component system modeling. The model is discrete, and the cells of the developed model change parameters and state independently from each other. So, the model can be implemented using high-performance parallel computing, which will significantly increase the speed of the simulations. The computer speed of the simulation significantly depends on the number of cells and possible motion directions. The system considered in this work consists of 24,200 cells with nine possible directions. The average calculation time for this case using parallel computing was 5 min. Models based on the lattice Boltzmann method have shorter computational times compared to finite volume techniques [27].
The proposed model will significantly reduce the number of necessary full-scale experiments by partially replacing them with computational ones and, accordingly, reduce the costs and time of developing new drugs based on aerogel particles with impregnated active pharmaceutical ingredients (APIs).

Author Contributions

Conceptualization, N.M.; Data curation, M.M.; Formal analysis, A.U. and M.M.; Investigation, A.U. and M.M.; Methodology, I.L. and N.M.; Project administration, N.M.; Software, I.L.; Validation, I.L. and A.U.; Visualization, I.L. and M.M.; Writing—original draft, I.L.; Writing—review and editing, N.M. and A.U. All authors have read and agreed to the published version of the manuscript.

Funding

The research was supported by the Ministry of Science and Higher Education of the Russian Federation, no. 075-15-2020-792 (unique identifier RF–190220X0031).

Data Availability Statement

Data is contained within the article.

Conflicts of Interest

The authors declare no conflict of interest.

References

  1. Batista, M.; Gonçalves, V.S.; Gaspar, F.; Nogueira, I.; Matias, A.A.; Gurikov, P. Novel alginate-chitosan aerogel fibres for potential wound healing applications. Int. J. Biol. Macromol. 2020, 156, 773–782. [Google Scholar] [CrossRef] [PubMed]
  2. Lovskaya, D.; Menshutina, N.; Mochalova, M.; Nosov, A.; Grebenyuk, A. Chitosan-based aerogel particles as highly effective local hemostatic agents. production process and in vivo evaluations. Polymers 2020, 12, 2055. [Google Scholar] [CrossRef] [PubMed]
  3. Prasher, P.; Sharma, M.; Mehta, M.; Satija, S.; Aljabali, A.A.; Tambuwala, M.M.; Anand, K.; Sharma, N.; Dureja, H.; Jha, N.K. Current-status and applications of polysaccharides in drug delivery systems. Colloid Interface Sci. Commun. 2021, 42, 100418. [Google Scholar] [CrossRef]
  4. Khan, A.; Alamry, K.A. Recent advances of emerging green chitosan-based biomaterials with potential biomedical applications: A review. Carbohydr. Res. 2021, 506, 108368. [Google Scholar] [CrossRef]
  5. García-González, C.A.; Sosnik, A.; Kalmár, J.; De Marco, I.; Erkey, C.; Concheiro, A.; Alvarez-Lorenzo, C. Aerogels in drug delivery: From design to application. J. Control. Release 2021, 332, 40–63. [Google Scholar] [CrossRef]
  6. Gurikov, P.; Smirnova, I. Amorphization of drugs by adsorptive precipitation from supercritical solutions: A review. J. Supercrit. Fluids 2018, 132, 105–125. [Google Scholar] [CrossRef]
  7. Lovskaya, D.; Menshutina, N. Alginate-based aerogel particles as drug delivery systems: Investigation of the supercritical adsorption and in vitro evaluations. Materials 2020, 13, 329. [Google Scholar] [CrossRef]
  8. Djupesland, P.G.; Messina, J.C.; Mahmoud, R.A. The nasal approach to delivering treatment for brain diseases: An anatomic, physiologic, and delivery technology overview. Ther. Deliv. 2014, 5, 709–733. [Google Scholar] [CrossRef]
  9. Hussein, N.; Omer, H.; Elhissi, A.; Ahmed, W. Advances in nasal drug delivery systems. In Advances in Medical and Surgical Engineering; Ahmed, W., Phoenix, D., Jackson, M., Charalambous, C., Eds.; Elsevier: Amsterdam, The Netherlands, 2020; pp. 279–311. [Google Scholar]
  10. Laffleur, F.; Bauer, B. Progress in nasal drug delivery systems. Int. J. Pharm. 2021, 607, 120994. [Google Scholar] [CrossRef]
  11. Sun, M.; Yu, X.; Wang, T.; Bi, S.; Liu, Y.; Chen, X. Nasal adaptive chitosan-based nano-vehicles for anti-allergic drug delivery. Int. J. Biol. Macromol. 2019, 135, 1182–1192. [Google Scholar] [CrossRef]
  12. Mato, Y.L. Nasal route for vaccine and drug delivery: Features and current opportunities. Int. J. Pharm. 2019, 572, 118813. [Google Scholar] [CrossRef]
  13. Lochhead, J.J.; Thorne, R.G. Intranasal delivery of biologics to the central nervous system. Adv. Drug Deliv. Rev. 2012, 64, 614–628. [Google Scholar] [CrossRef] [PubMed]
  14. Chapman, C.D.; Frey, W.H., 2nd; Craft, S.; Danielyan, L.; Hallschmid, M.; Schiöth, H.B.; Benedict, C. Intranasal treatment of central nervous system dysfunction in humans. Pharm. Res. 2012, 30, 2475–2484. [Google Scholar] [CrossRef]
  15. Harshad, P.; Anand, B.; Dushyant, S. Recent techniques in nasal drug delivery: A review. Int. J. Drug Dev. Res 2010, 2, 565–572. [Google Scholar]
  16. Ganesan, K.; Budtova, T.; Ratke, L.; Gurikov, P.; Baudron, V.; Preibisch, I.; Niemeyer, P.; Smirnova, I.; Milow, B. Review on the Production of Polysaccharide Aerogel Particles. Materials 2018, 11, 2144. [Google Scholar] [CrossRef]
  17. Falahati, M.; Ghoreishi, S. Preparation of Balangu (Lallemantia royleana) seed mucilage aerogels loaded with paracetamol: Evaluation of drug loading via response surface methodology. J. Supercrit. Fluids 2019, 150, 1–10. [Google Scholar] [CrossRef]
  18. Filali, S.; Bergamelli, C.; Tall, M.L.; Salmon, D.; Laleye, D.; Dhelens, C.; Diouf, E.; Pivot, C.; Pirot, F. Formulation, stability testing, and analytical characterization of melatonin-based preparation for clinical trial. J. Pharm. Anal. 2017, 7, 237–243. [Google Scholar] [CrossRef] [PubMed]
  19. Shan, X.; Yuan, X.-F.; Chen, H. Kinetic theory representation of hydrodynamics: A way beyond the Navier–Stokes equation. J. Fluid Mech. 2006, 550, 413–441. [Google Scholar] [CrossRef]
  20. McDonough, J.M. Lectures in elementary fluid dynamics: Physics, mathematics and applications. In Engineering Textbook Gallery; University of Kentucky: Lexington, KY, USA, 2009; p. 164. [Google Scholar]
  21. Qian, Y.-H.; d’Humières, D.; Lallemand, P. Lattice BGK models for Navier-Stokes equation. EPL 1992, 17, 479. [Google Scholar] [CrossRef]
  22. Timm, K.; Kusumaatmaja, H.; Kuzmin, A.; Shardt, O.; Silva, G.; Viggen, E. The lattice Boltzmann method: Principles and practice. Springer Int. Publ. AG Switz. ISSN 2016, 1868–4521. [Google Scholar] [CrossRef]
  23. Sangoi, M.S.; Todeschini, V.; Steppe, M. Monolithic LC method applied to fesoterodine fumarate low dose extended-release tablets: Dissolution and release kinetics. J. Pharm. Anal. 2015, 5, 137–141. [Google Scholar] [CrossRef] [PubMed]
  24. Elmas, A.; Akyüz, G.; Bergal, A.; Andaç, M.; Andac, O. Mathematical modelling of drug release. Res. Eng. Struct. Mater. 2020, 6, 327–350. [Google Scholar] [CrossRef]
  25. Ivanov, S.I.; Tiptsova, I.A.; Menshutina, N.V. Modeling dissolution of solids based on cellular automata with changing sizes of cells. Comput. Aided Chem. Eng. 2015, 37, 605–610. [Google Scholar]
  26. Ganimedov, V.; Muchnaya, M.; Sadovskij, A. The flow of air in the human nasal cavity. Results of mathematical modeling. Russ. J. Biomech. 2015, 37–51. [Google Scholar] [CrossRef]
  27. Van den Akker, H.E.A. Lattice Boltzmann simulations for multi-scale chemical engineering. Curr. Opin. Chem. Eng. 2018, 21, 67–75. [Google Scholar] [CrossRef]
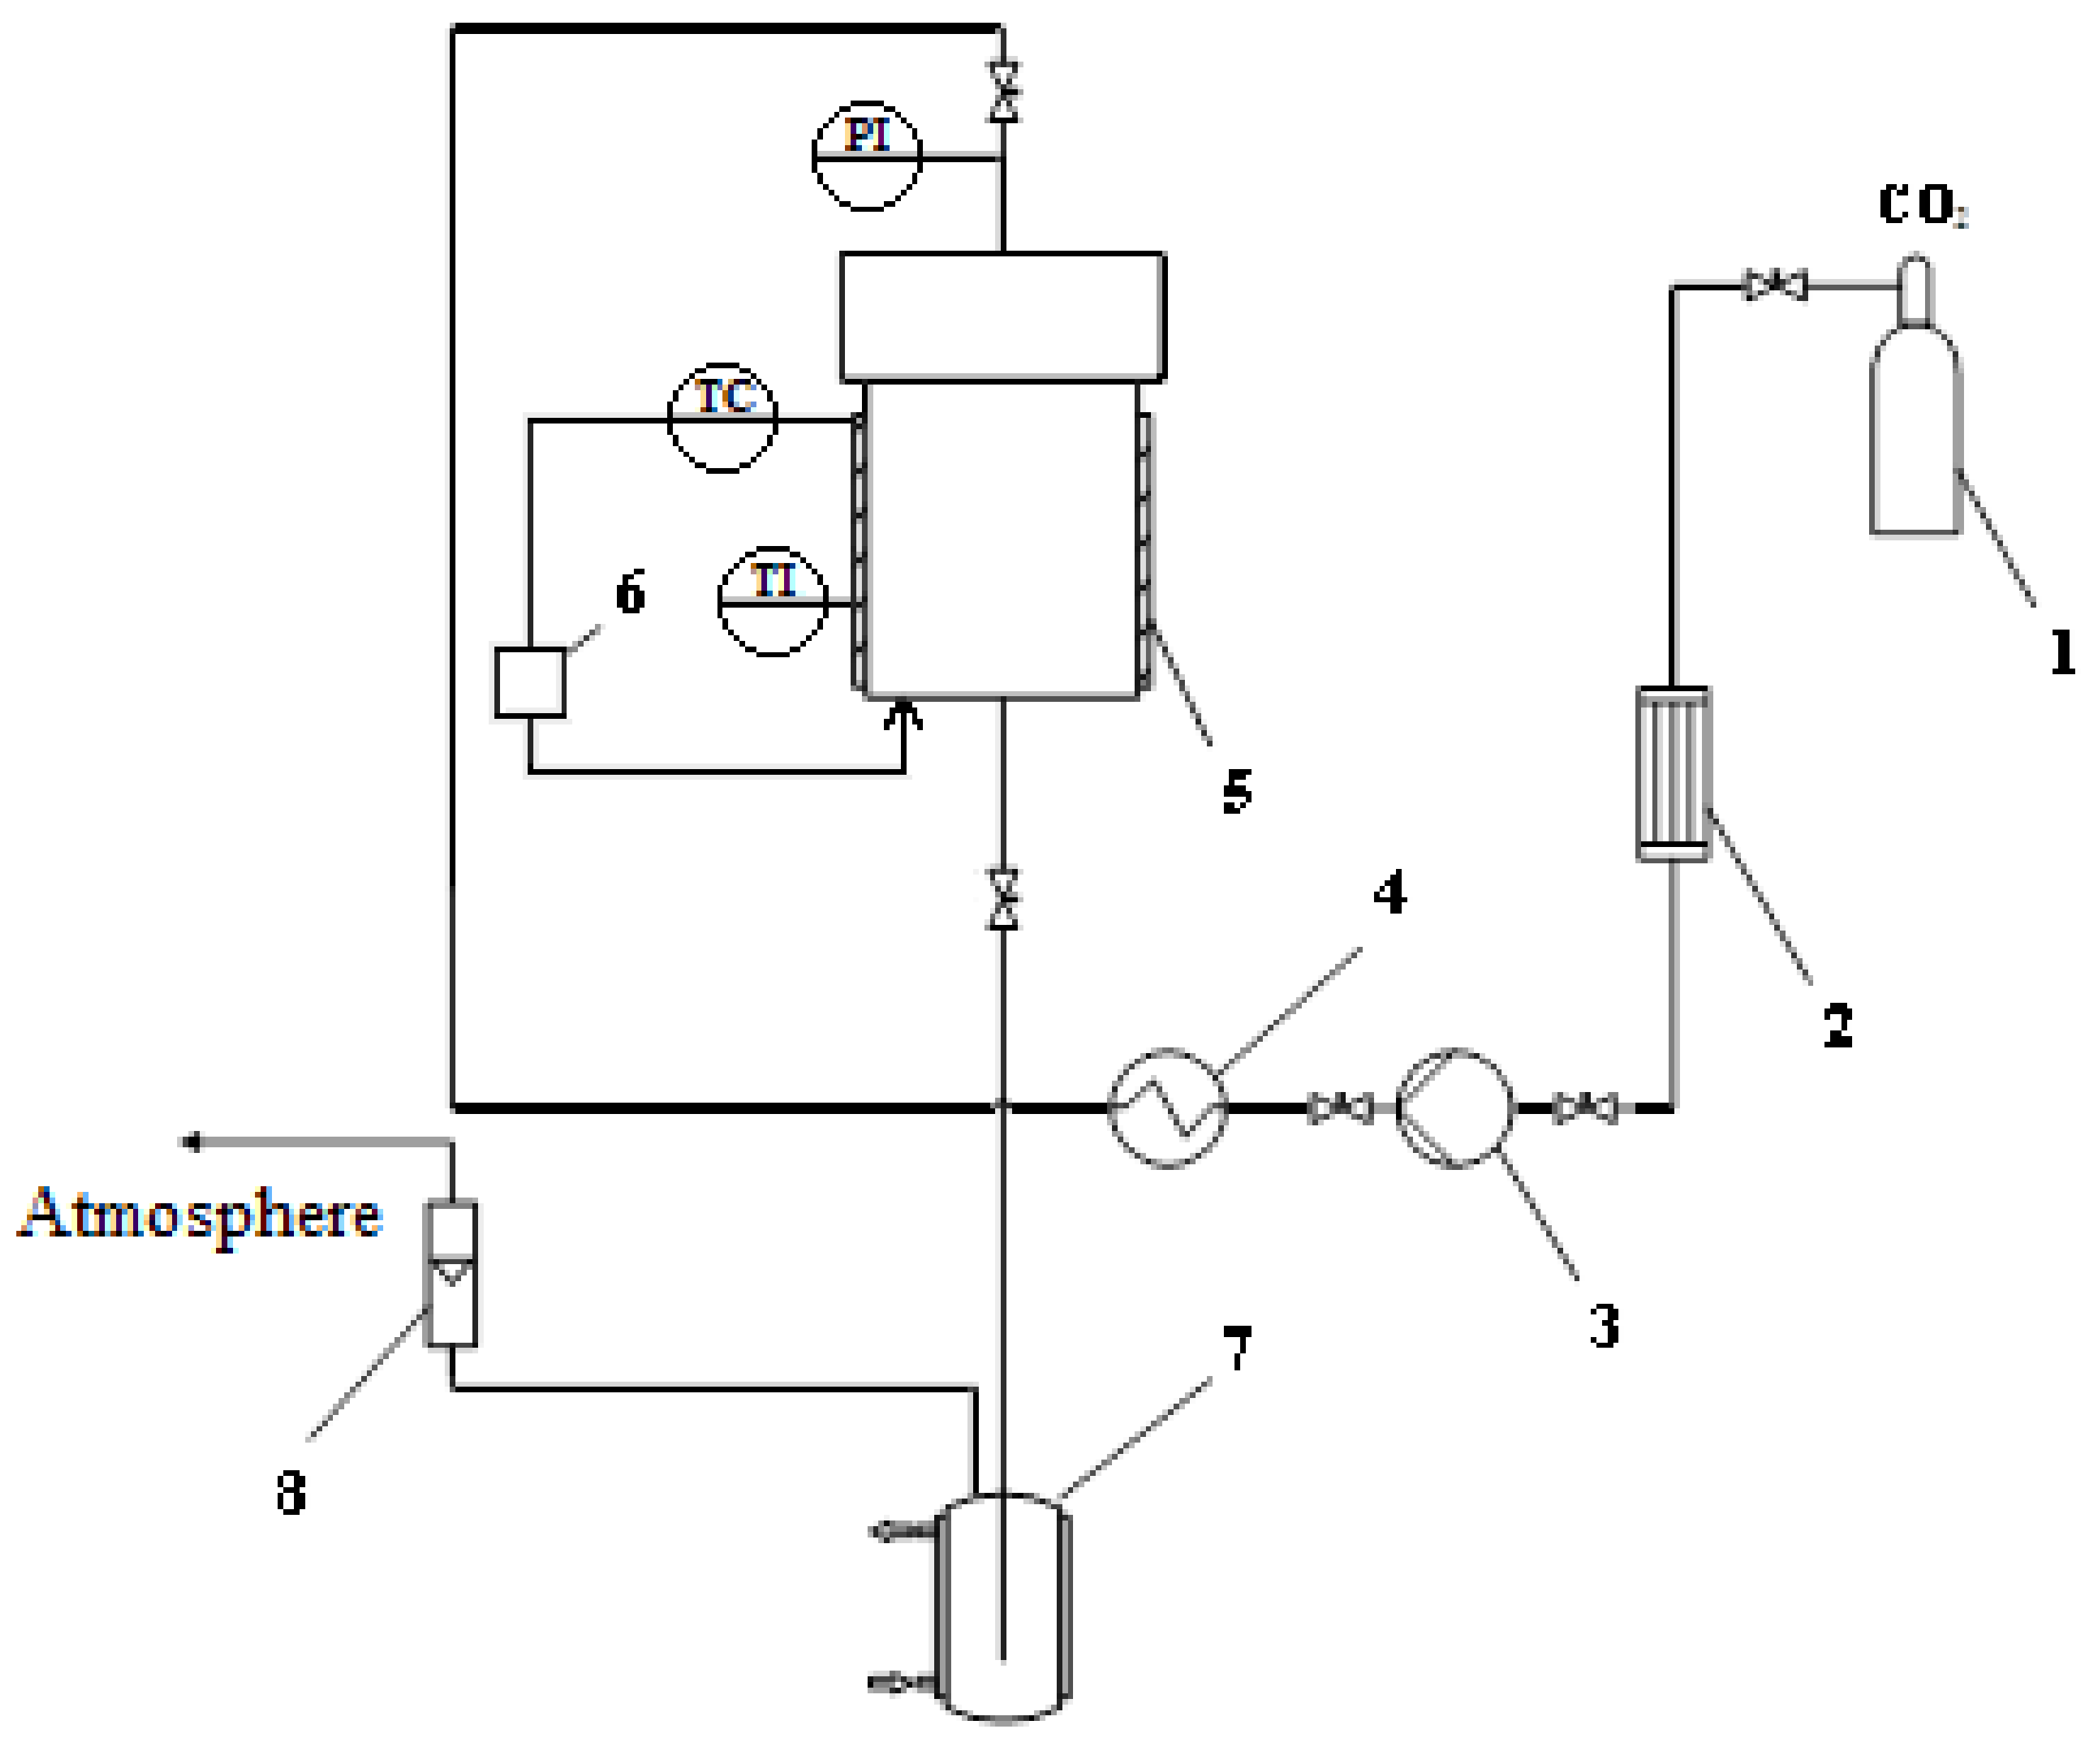
Figure 1. Scheme of a high-pressure reactor for carrying out the supercritical drying process. 1—tank with CO2, 2—condenser, 3—piston pump, 4—heater, 5—high-pressure reactor, 6—thermal control system, 7—separator, 8—rotameter, PI—pressure gauge, TC—temperature sensor, TI—temperature sensor.
Computation 10 00139 g001
Figure 2. Process of obtaining chitosan-based aerogel particles impregnated with melatonin.
Computation 10 00139 g002
Figure 3. Fluid particles’ motion to neighboring cells in accordance with their directions.
Computation 10 00139 g003
Figure 4. D2Q9 type lattice model example. Vectors e 1 e 8 characterize possible particle motion directions.
Computation 10 00139 g004
Figure 5. Particles’ motion from cell where f i is the number of particles moving in direction i .
Computation 10 00139 g005
Figure 6. Change in the particles’ distribution in directions after collision step calculation. f i is the distribution of particles after the streaming step, f i is the distribution of particles after the collision step.
Computation 10 00139 g006
Figure 7. API release from “Aerogel with impregnated API” cells in neighboring “Liquid” cells.
Computation 10 00139 g007
Figure 8. Processes modeling: (a) release; (b) API flow.
Computation 10 00139 g008
Figure 9. The direction weights for D2Q9 lattice.
Computation 10 00139 g009
Figure 10. An example of a system configuration after several time steps.
Computation 10 00139 g010
Figure 11. Model nasal cavity with a deposited particle: (a) “top view”; (b) “profile view”.
Computation 10 00139 g011
Figure 12. Aerogel particle digital copy with a diameter of 300 µm, considering the scale of the model. The red circle corresponds to the shape of real aerogel particle.
Computation 10 00139 g012
Figure 13. Flows visualization in the model nasal cavity during the deposition of an aerogel particle. Color gradient from red to blue through green shows flow velocity in cell from high to low.
Computation 10 00139 g013
Figure 14. Calculated and experimental curves of melatonin release from chitosan-based aerogel particles.
Computation 10 00139 g014
Figure 15. Visualization of the melatonin concentration distribution in the model nasal cavity during the deposition of chitosan-based aerogel particles at different time points: (a) 0.75 min; (b) 1.5 min; (c) 2.25 min; (d) 3 min. Color gradient from purple to blue shows the number of API particles in cell from high to low, respectively.
Computation 10 00139 g015aComputation 10 00139 g015b
Figure 16. Visualization of the melatonin concentration distribution in the model nasal cavity during the deposition of chitosan-based aerogel particles at different time points: (a) 3.75 min; (b) 4.5 min; (c) 5.25 min; (d) 6 min. Color gradient from purple to blue shows the number of API particles in cell from high to low, respectively.
Computation 10 00139 g016
Table 1. Experimental data on the melatonin release from chitosan-based aerogel particles.
Experiment No.Experiment Time,
min
Concentration, g/mL
11.532.320 × 10−5
338.885 × 10⁻⁵
4.541.915 × 10−5
647.975 × 10⁻⁵
21.520.343 × 10−5
332.764 × 10⁻⁵
4.535.893 × 10−5
639.836 × 10⁻⁵
31.513.213 × 10−5
323.692 × 10⁻⁵
4.531.946 × 10−5
637.737 × 10⁻⁵
Table 2. Calculated and experimental values of released melatonin.
Experiment No.Time, min C c a l c ,   g / mL C e x p ,   g / mL Deviation, %
11.530.184 × 10−532.320 × 10−56.61
341.475 × 10−538.885 × 10−56.66
4.545.610 × 10−541.915 × 10−58.82
646.597 × 10−547.975 × 10−50.79
21.520.343 × 10−518.683 × 10−58.46
332.764 × 10−530.210 × 10−57.80
4.535.893 × 10−537.209 × 10−53.67
639.836 × 10−541.445 × 10−54.04
31.513.213 × 10−513.993 × 10−55.90
323.692 × 10−524.016 × 10−51.37
4.531.946 × 10−531.087 × 10−52.69
637.737 × 10−536.073 × 10−54.41
Publisher’s Note: MDPI stays neutral with regard to jurisdictional claims in published maps and institutional affiliations.