
A Pattern-Recognizer Artificial Neural Network for the Prediction of New Crescent Visibility in Iraq


Abstract
:1. Introduction
2. Related Works
3. Methodology
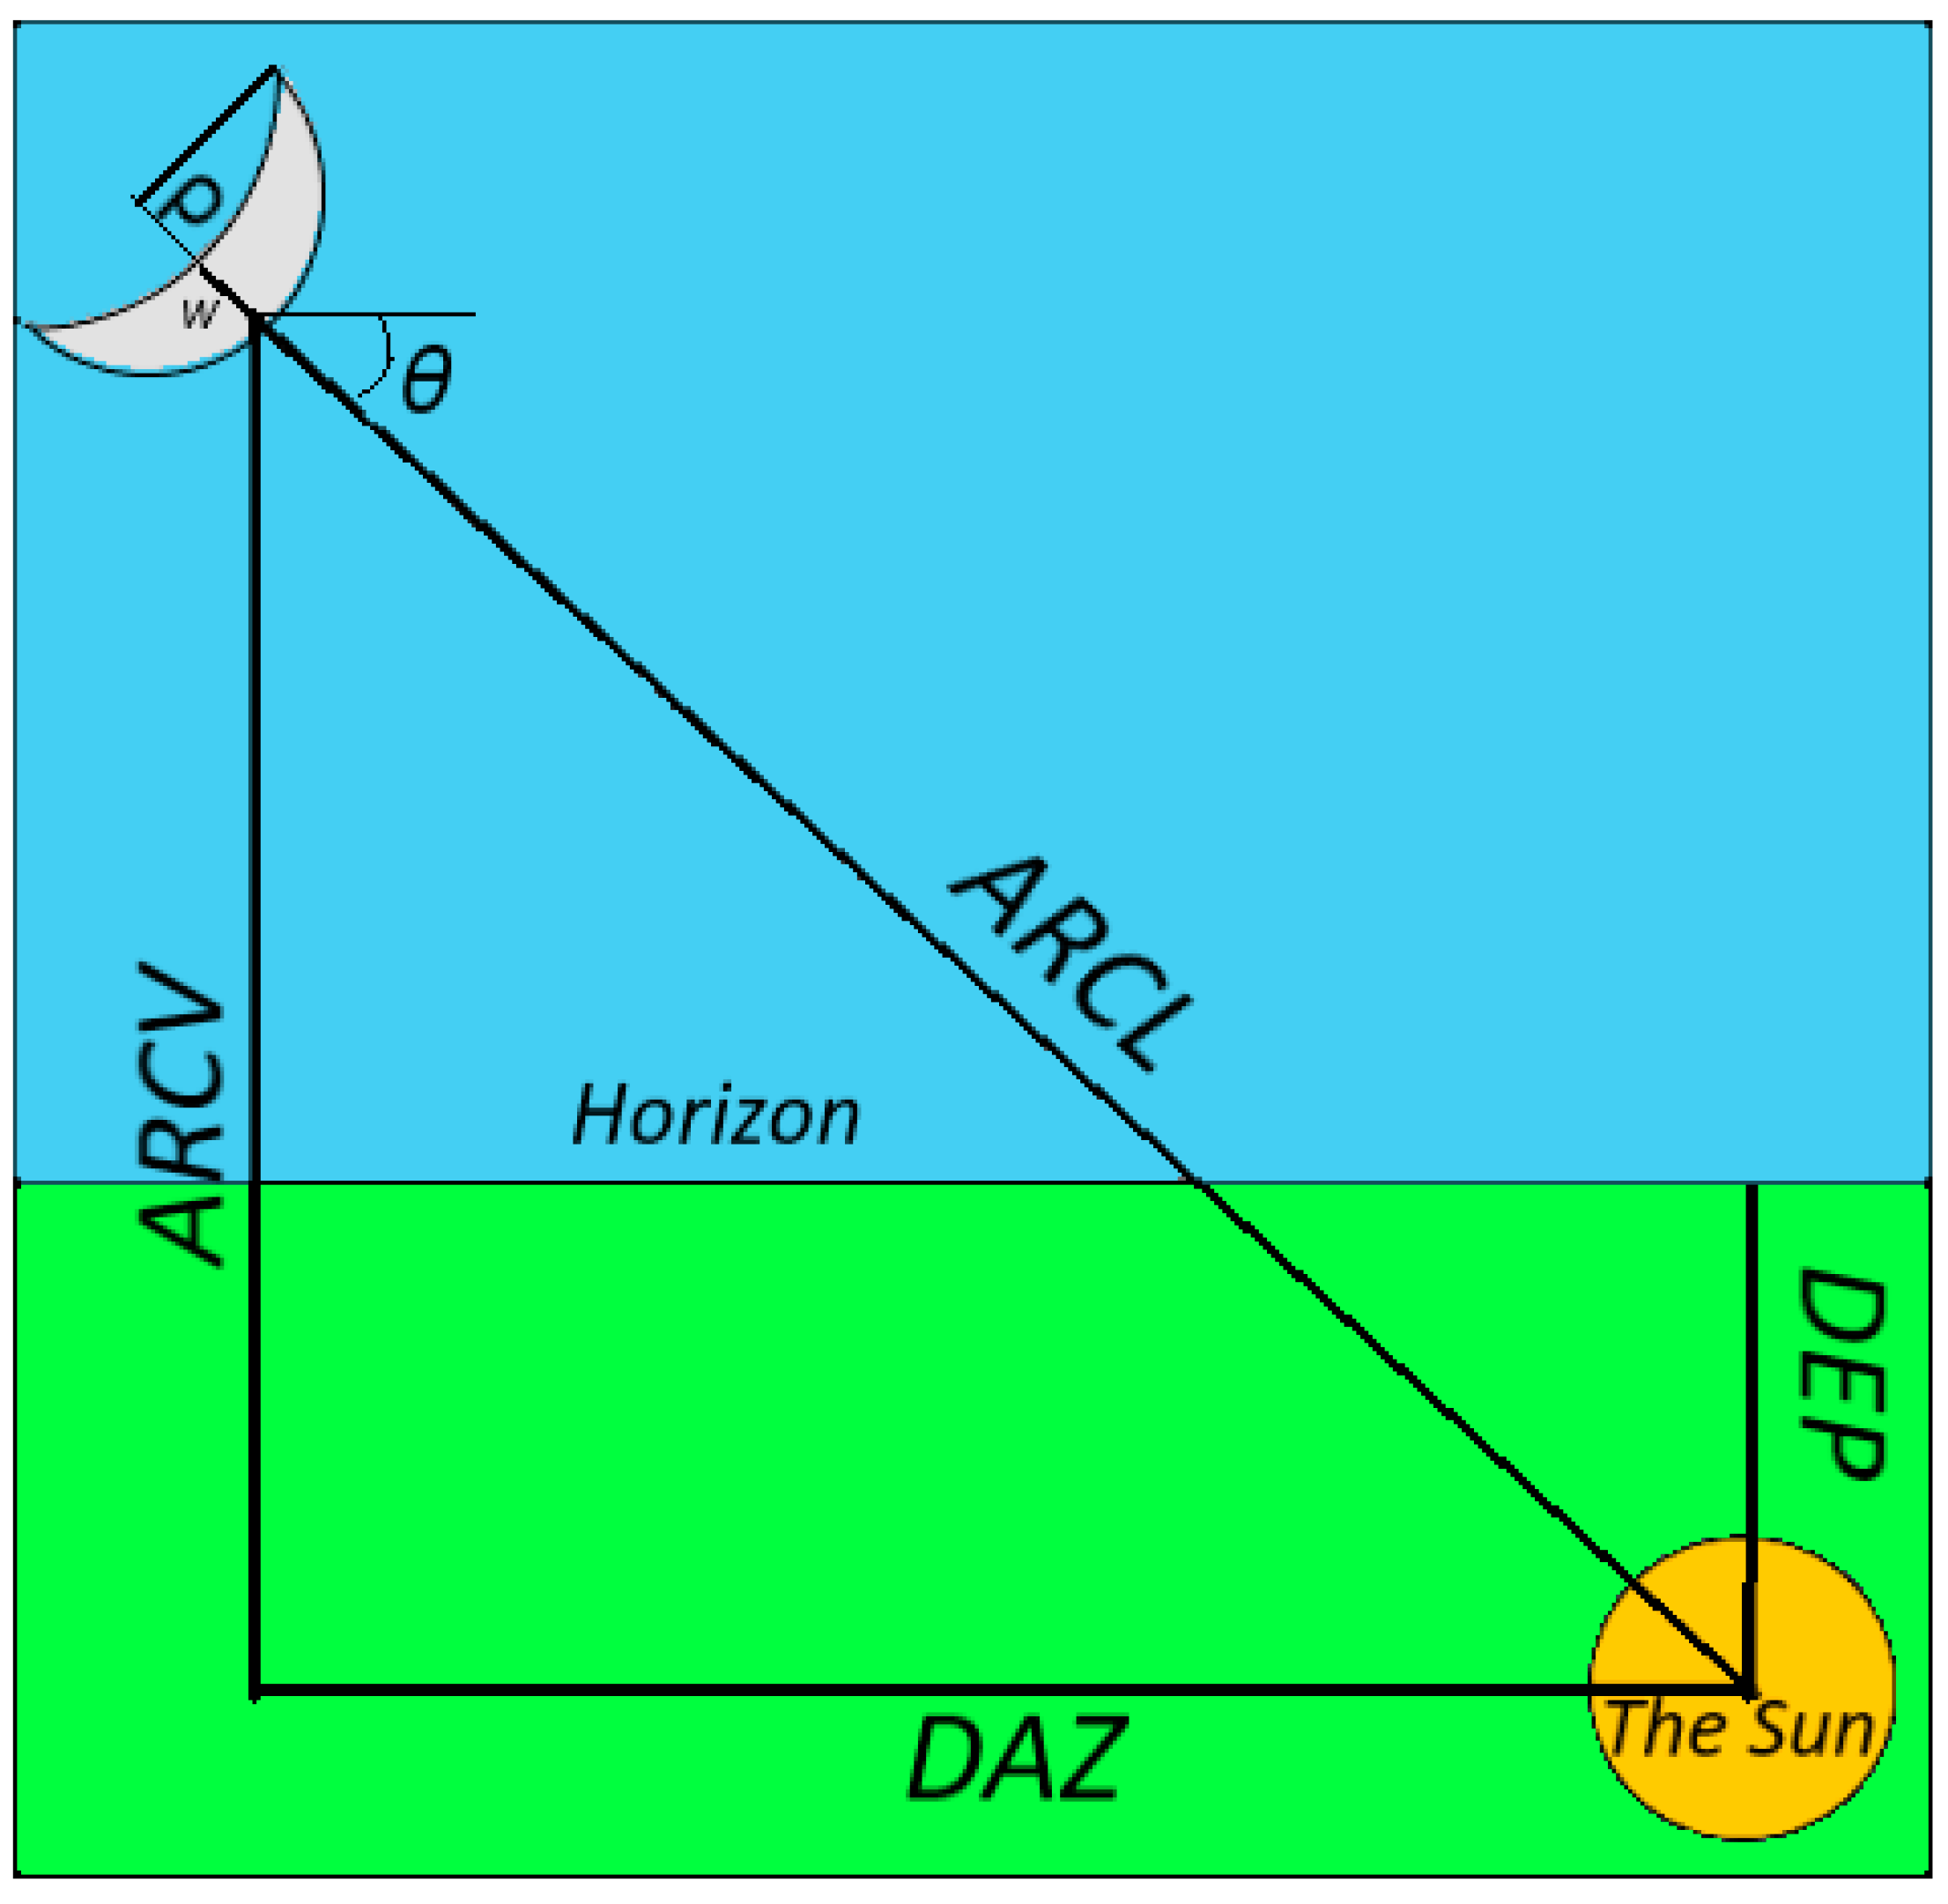
3.1. Moon Sighting Parameters
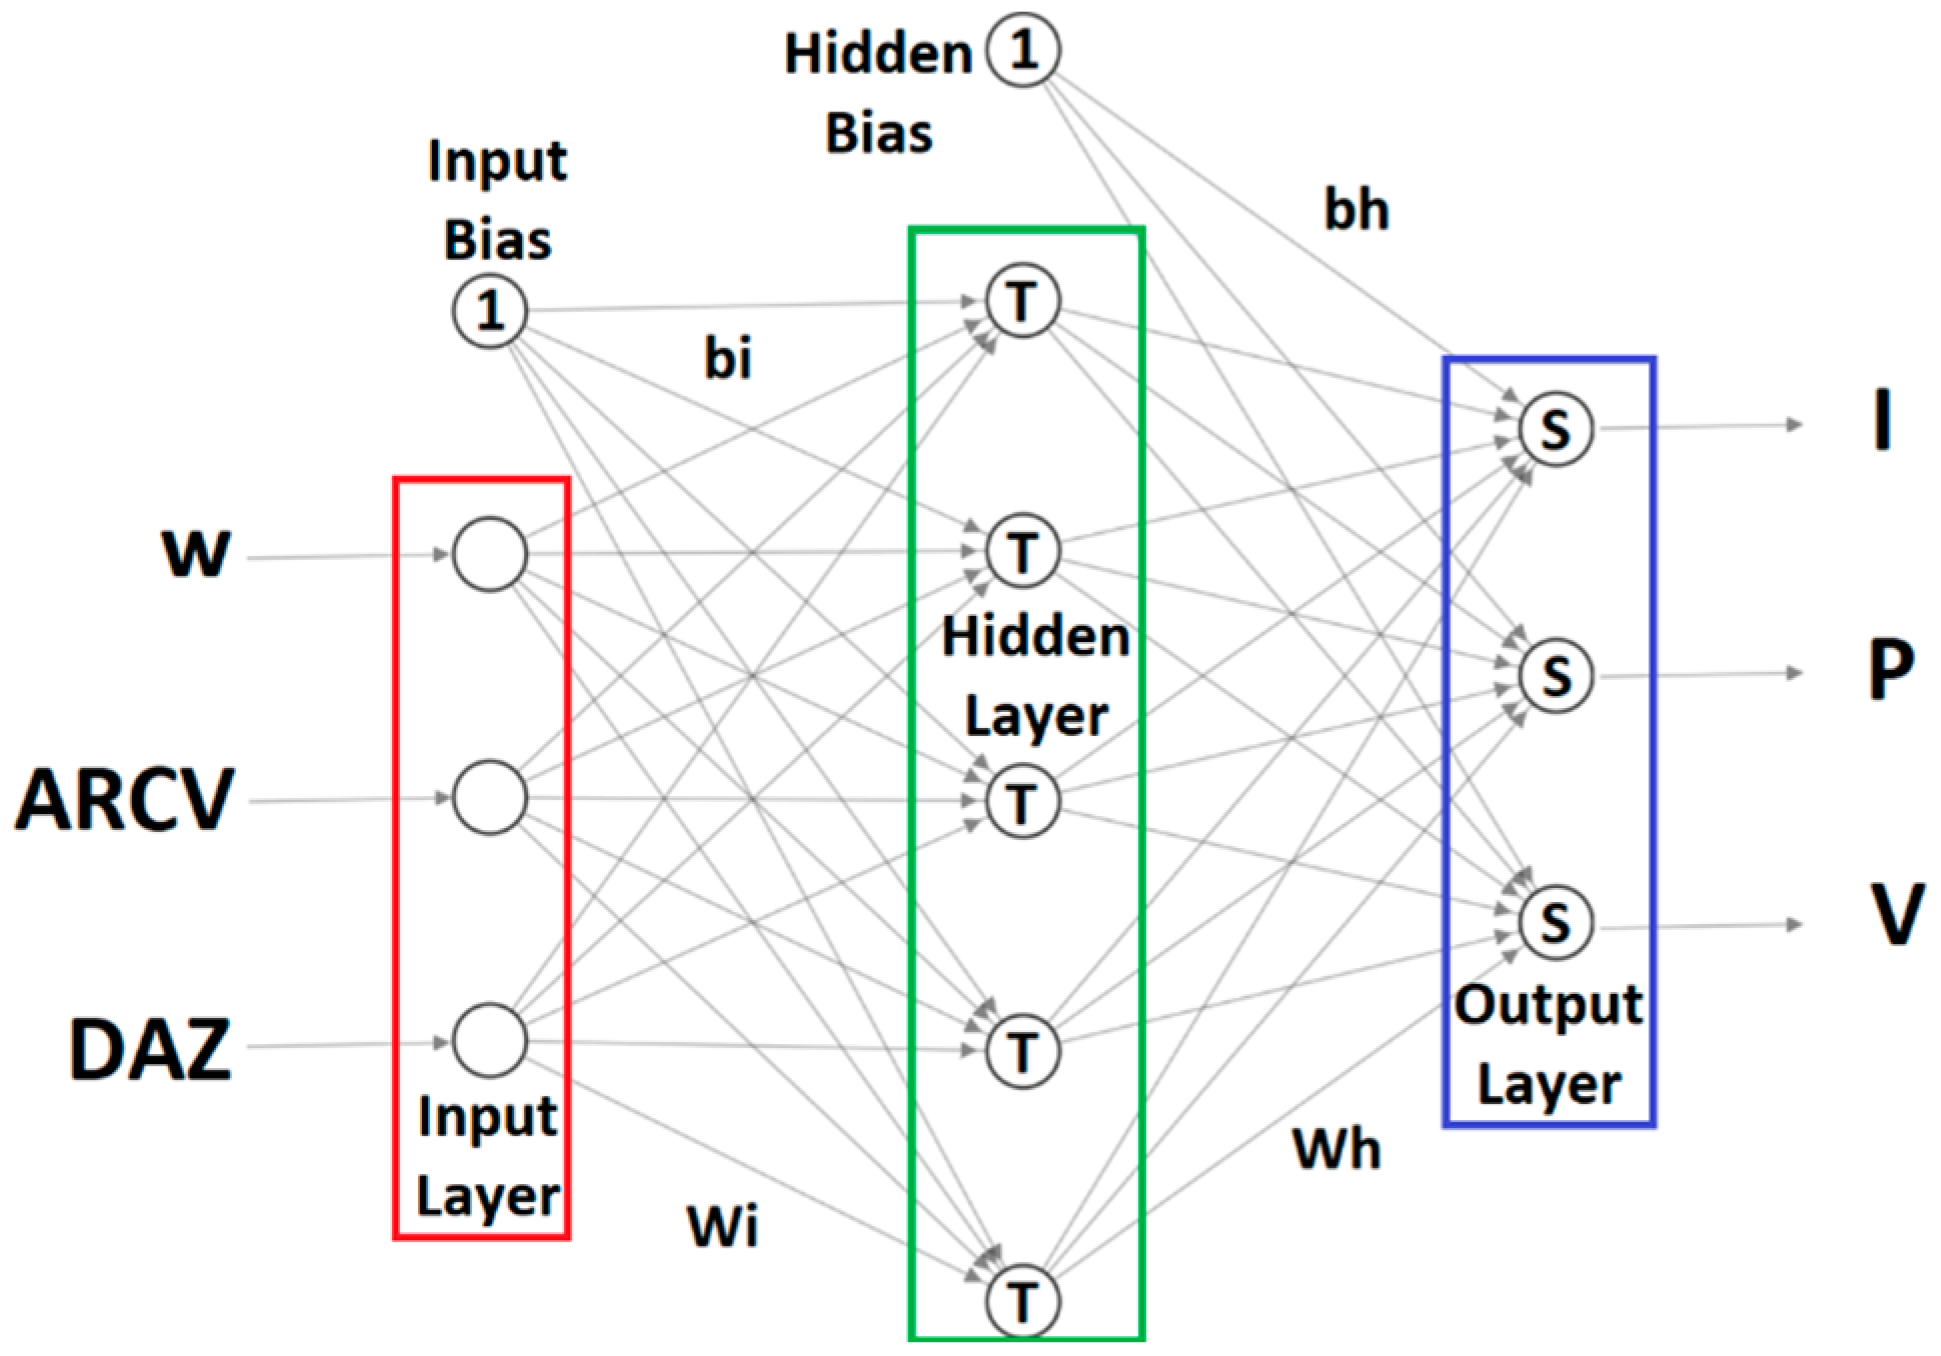
3.2. Pattern Recognizer ANN Architecture
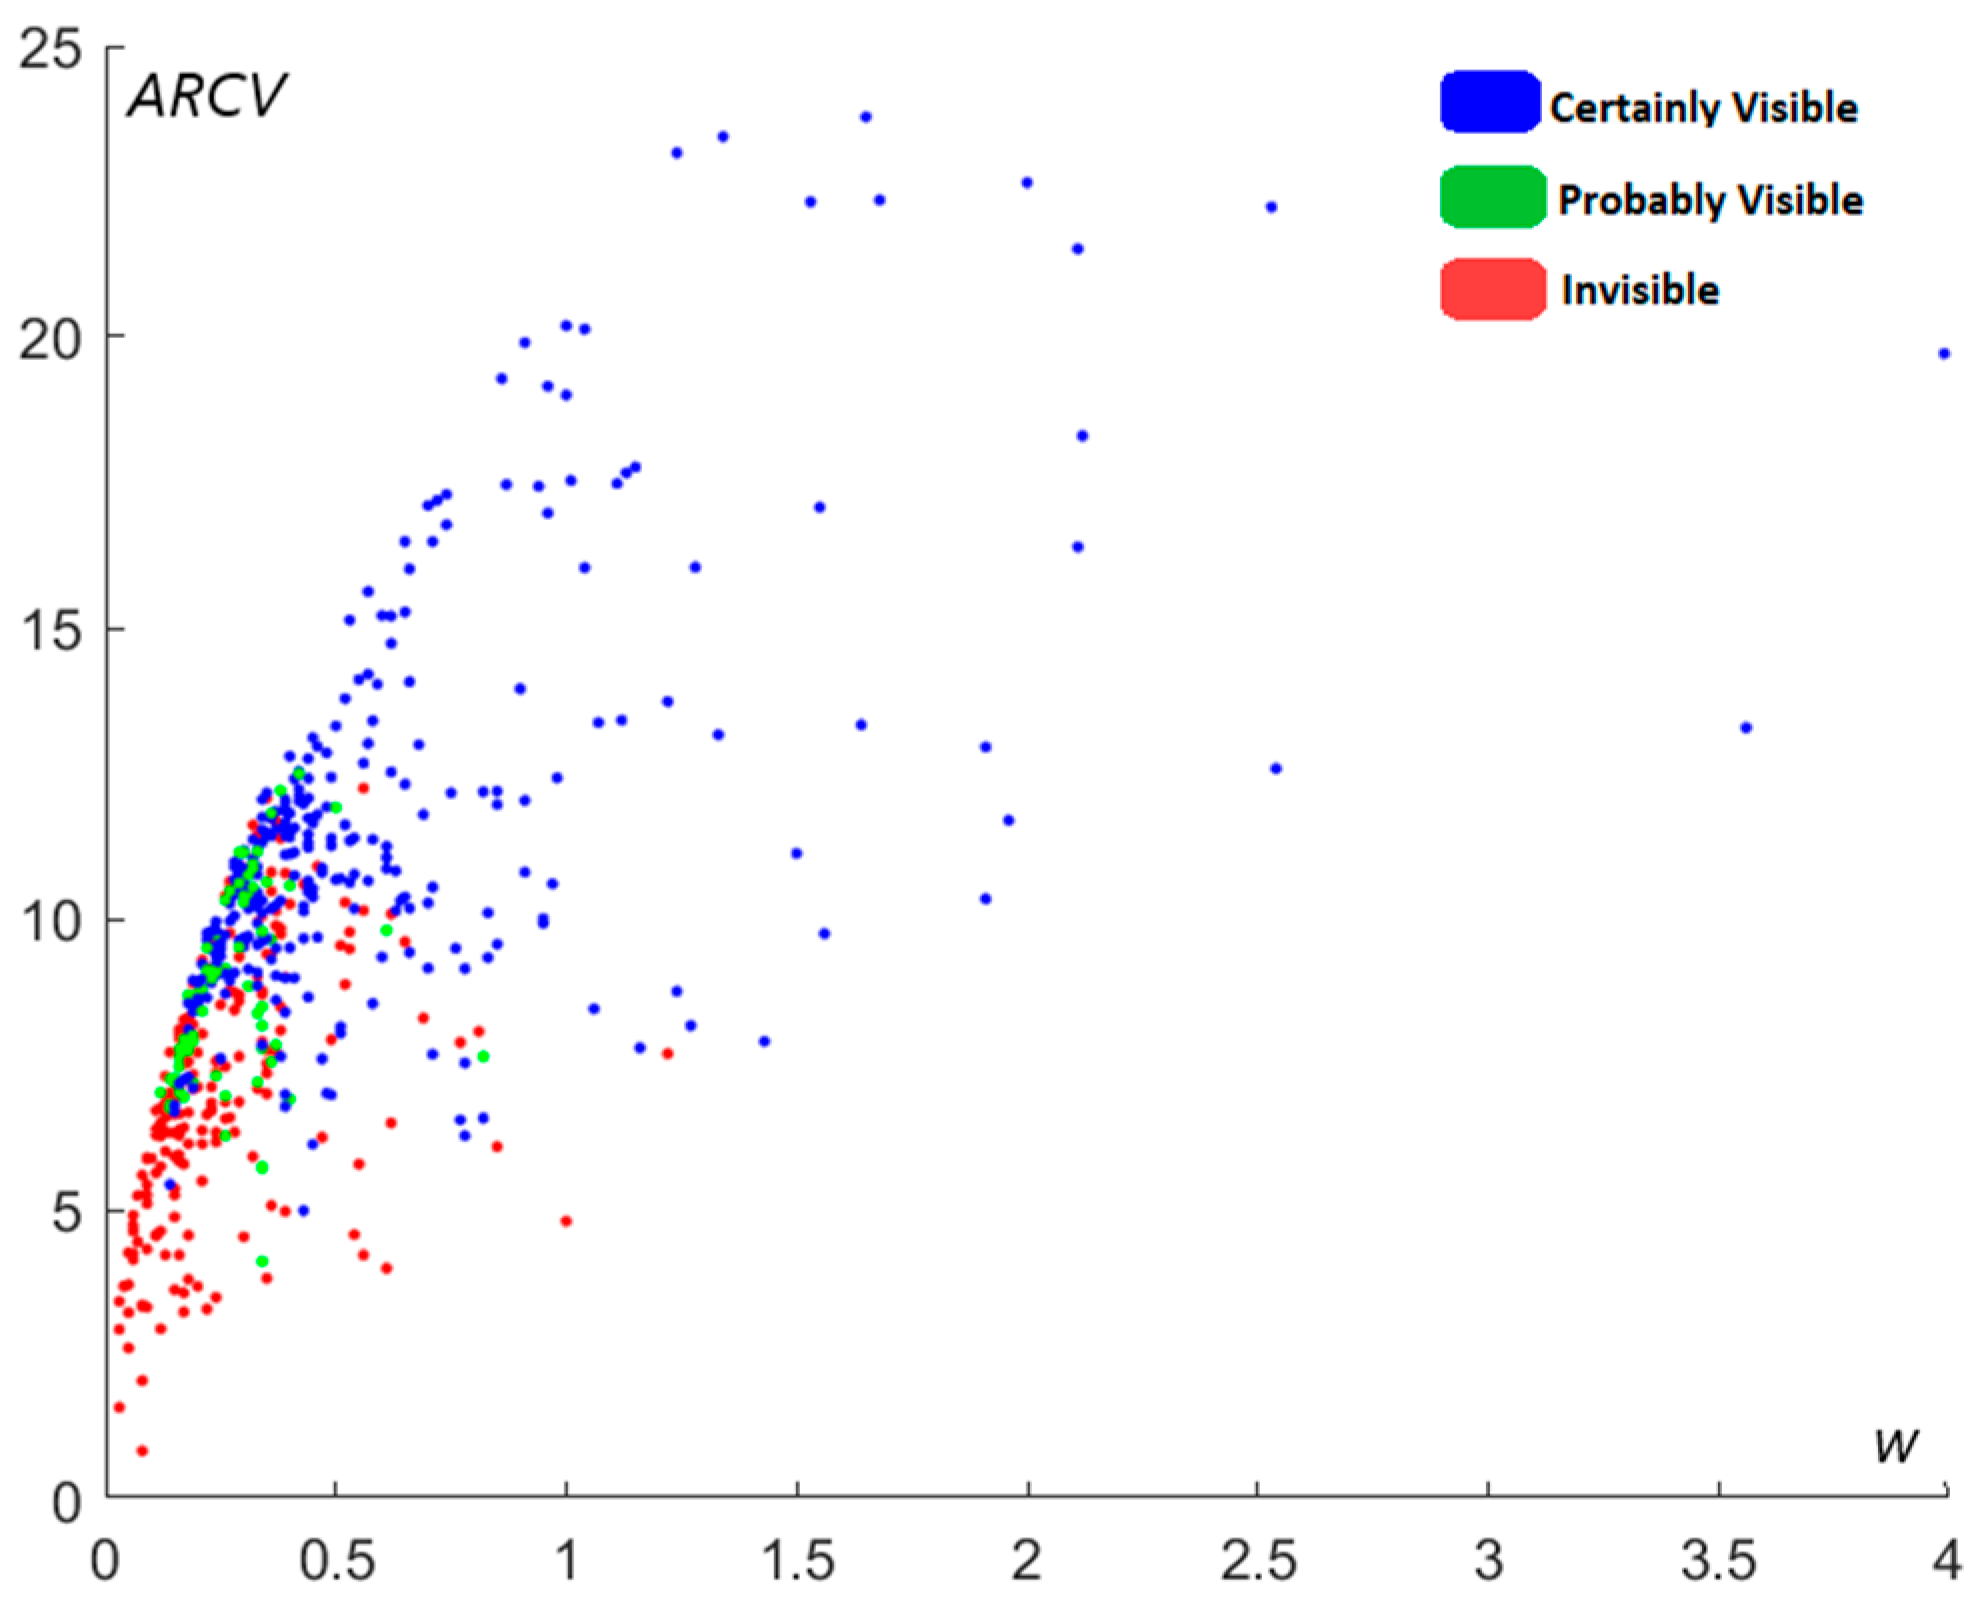
3.3. Training Dataset
4. Results
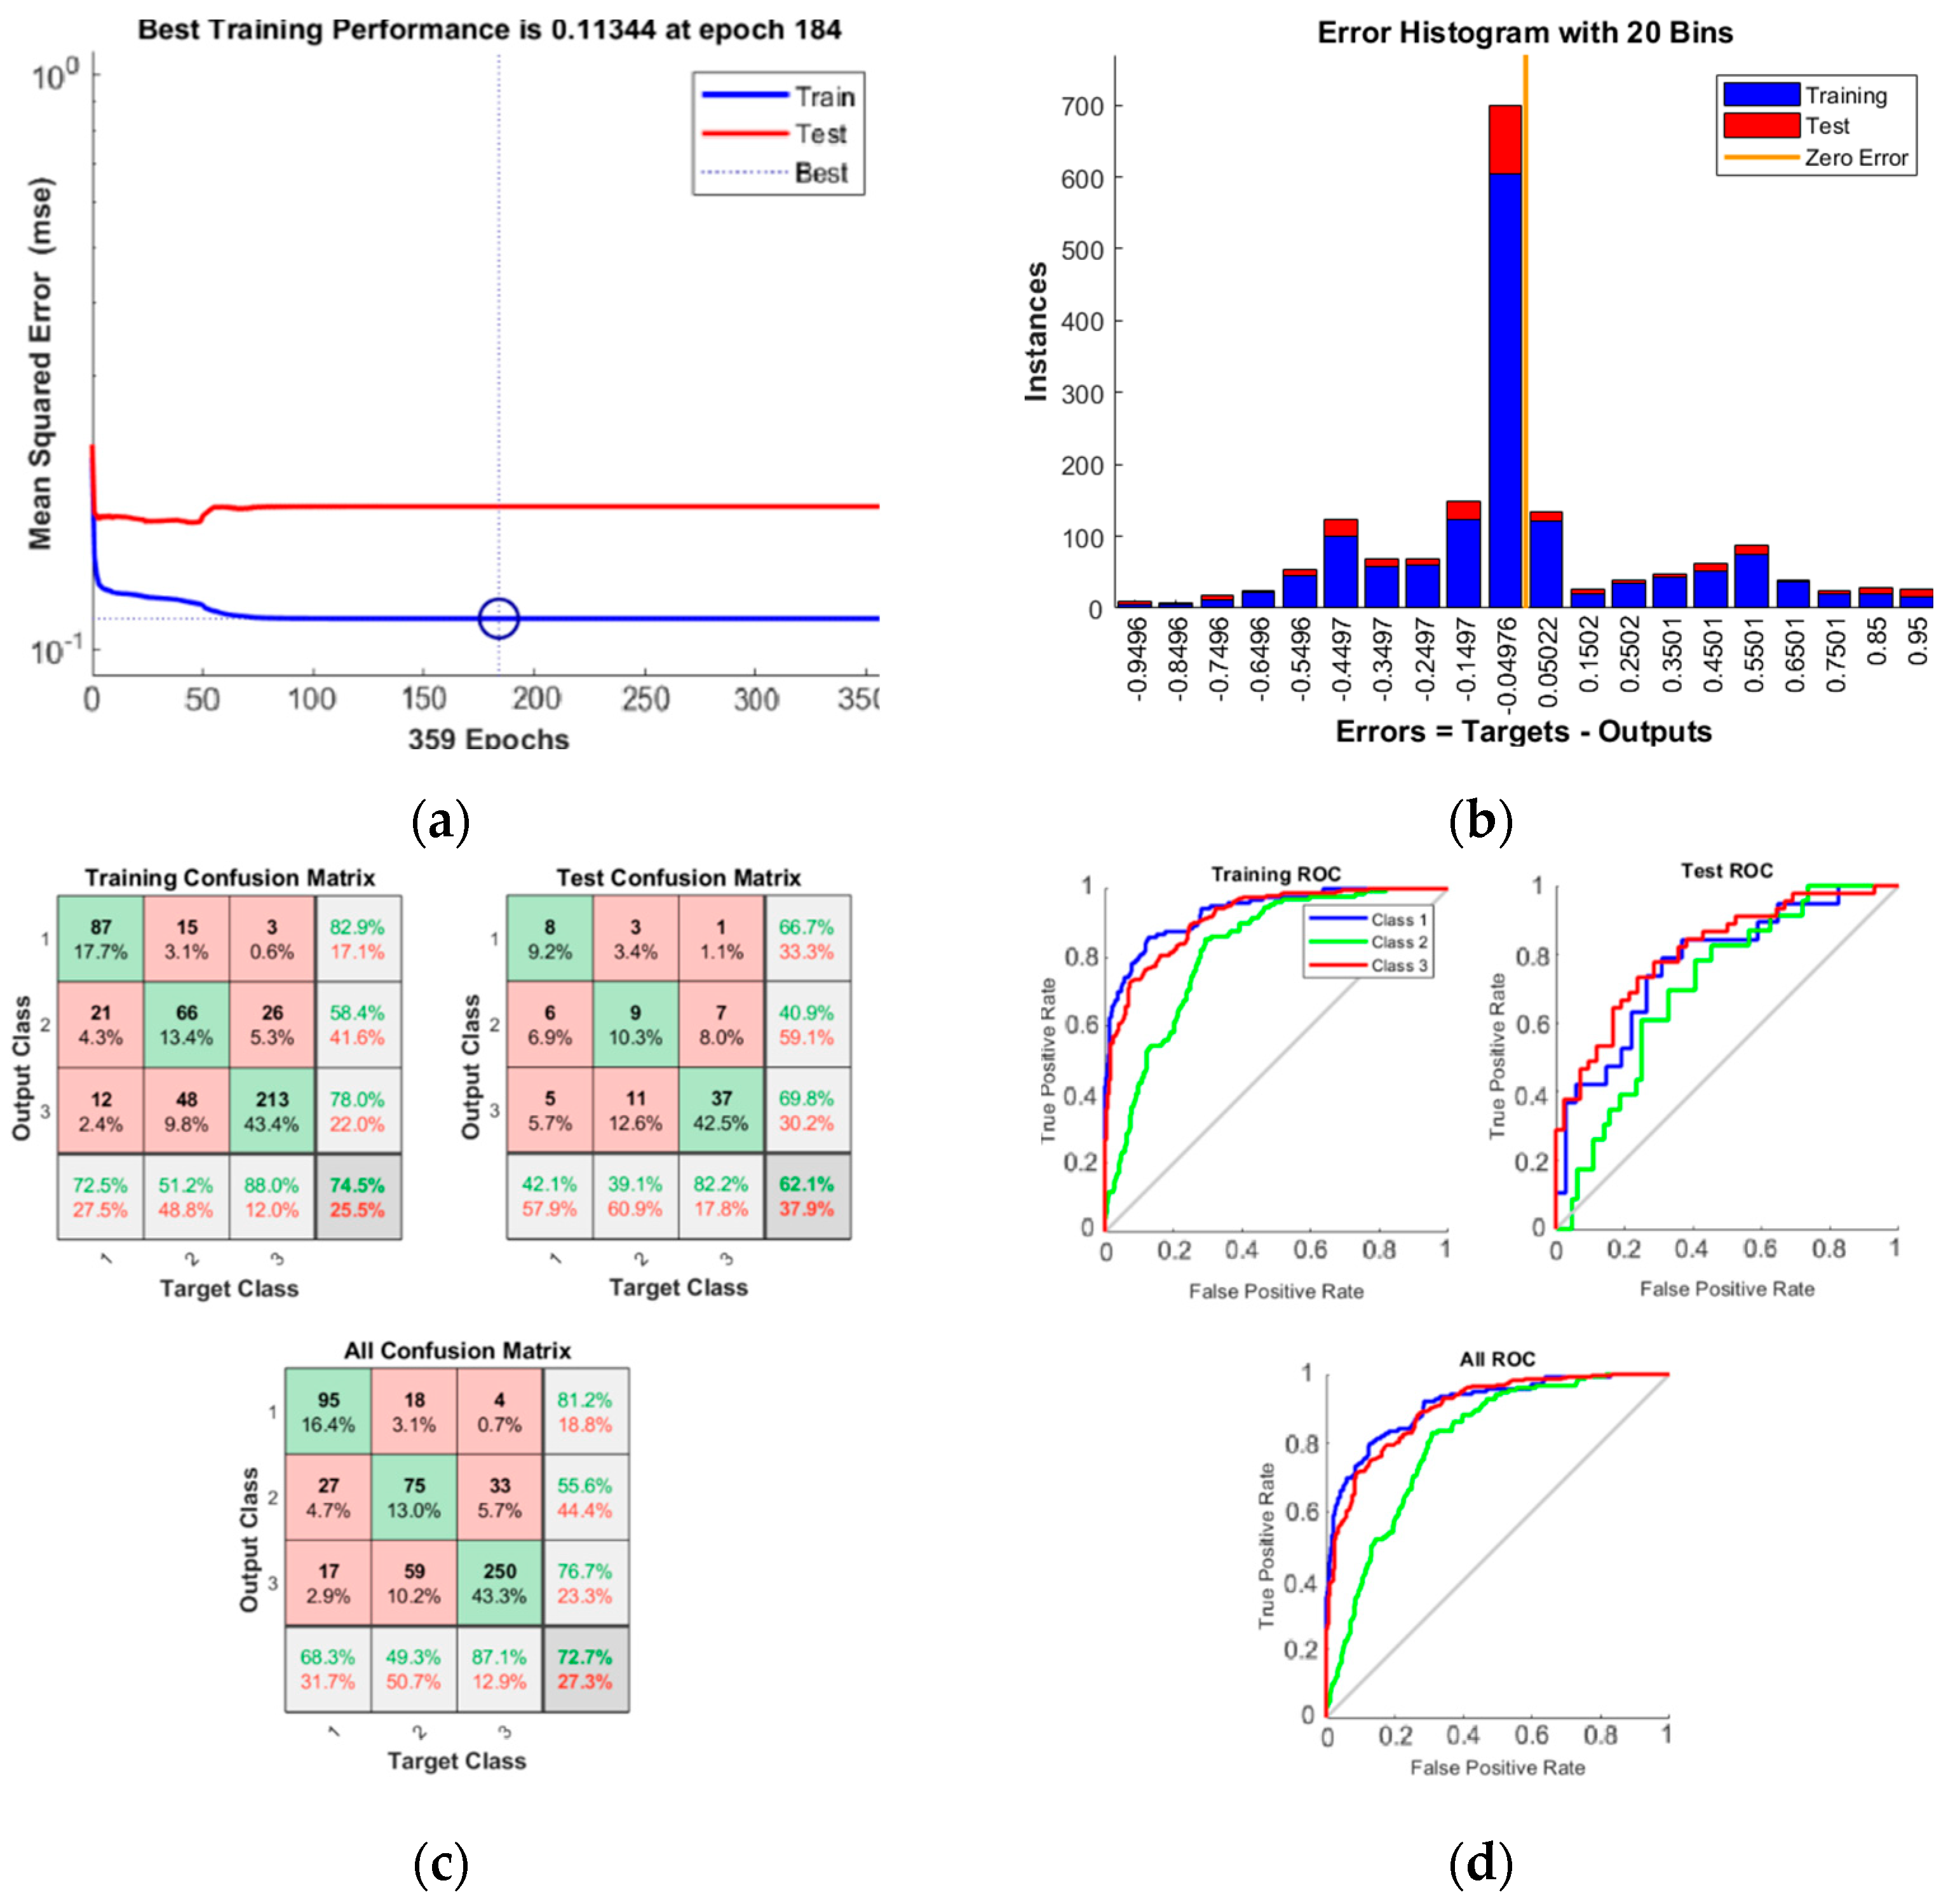
4.1. ANN Training
4.2. Building a Sample Hijri Calendar for Iraq
5. Discussion
6. Conclusions
Supplementary Materials
Funding
Data Availability Statement
Acknowledgments
Conflicts of Interest
References
- Fatoohi, L.J.; Stephenson, F.R.; Al-Dargazelli, S.S. The Danjon Limit of First Visibility of the Lunar Crescent. Observatory 1998, 118, 65–72. [Google Scholar]
- Schaefer, B.E. The length of the Lunar Month. J. Hist. Astron. 1992, 23, 32–42. [Google Scholar] [CrossRef]
- Ilyas, M. Lunar crescent visibility Criterion and Islamic Calendar. Q. J. R. Astr. Soc. 1994, 35, 425–461. [Google Scholar]
- Bruin, F. The First Visibility of the Lunar Crescent. Vistas Astron. 1977, 12, 331–358. [Google Scholar] [CrossRef]
- Schaefer, B.E.; Ahmad, I.A.; Doggett, L.E. Records for Young Moon Sighting. Q. J. R. Astr. Soc. 1993, 37, 53–56. [Google Scholar]
- Lazli, L.; Boukadoum, M. Hidden neural network for complex pattern recognition: A comparison study with Multi-neural network-based approach. Int. J. Life Sci. Med Res. 2013, 3, 234–245. [Google Scholar] [CrossRef]
- Khodaskar, A.A.; Ladhake, S.A. Pattern recognition: Advanced development, techniques and application for image retrieval. In Proceedings of the IEEE 2014 International Conference on Communication and Network Technologies (ICCNT), Sivakasi, India, 18–19 December 2014; pp. 74–78. [Google Scholar]
- Kim, T.H. Pattern recognition using artificial neural network: A review. In Proceedings of the 4th International Conference on Information Security and Assurance (ISA2010), Miyazaki, Japan, 23–25 June 2010; pp. 138–148. [Google Scholar]
- Schmidhuber, J. Deep learning in neural networks: An overview. Neural Netw. 2015, 61, 85–117. [Google Scholar] [CrossRef] [Green Version]
- Fotheringham, J.K. On the Smallest Visible Phase of the Moon. RAS Mon. Notices 1910, 70, 527–532. [Google Scholar] [CrossRef] [Green Version]
- Maunder, E.W. On the Smallest Visible Phase of Moon. JBAA 1911, 21, 355–362. [Google Scholar]
- Danjon, A. Jeunes et Vieilles Lunes. l’Astronomie 1932, 46, 57–66. [Google Scholar]
- McNally, D. The length of the lunar crescent. Q. J. R. Astr. Soc. 1983, 24, 417–429. [Google Scholar]
- Schaefer, B.E. Lunar crescent visibility. Q. J. R. Astr. Soc. 1996, 37, 759–768. [Google Scholar]
- Sultan, A.H. First Visibility of The Lunar Crescent Beyond Danjon’s Limit. Observatory 2007, 127, 53–59. [Google Scholar]
- Yallop, B.D. A Method for Predicting the First Sighting of the New Crescent Moon; RGO NAO Technical Note 69; HM Nautical Almanac Office, Royal Greenwich Observatory: Cambridge, UK, 1997; pp. 1–15. [Google Scholar]
- Odeh, M.S. New Criterion for Lunar Crescent Visibility. Exp. Astron. 2006, 18, 39–64. [Google Scholar] [CrossRef]
- Schaefer, B.E. Length of the lunar crescent. Q. J. R. Astr. Soc. 1991, 32, 265–277. [Google Scholar]
- Ilyas, M. Limiting altitude separation in the new Moon’s first visibility criterion. Astron. Astrophys. 1988, 206, 133–135. [Google Scholar]
- Alrefay, T.; Alsaab, S.; Alshehri, F.; Alghamdi, A.; Hadadi, A.; Alotaibi, M.; Almutari, K.; Mubarki, Y. Analysis of Observations of Earliest Visibility of the Lunar crescent. Observatory 2018, 138, 267–291. [Google Scholar]
- Schaefer, B.E. Visibility of the lunar crescent. Q. J. R. Astr. Soc. 1988, 29, 511–523. [Google Scholar]
- Ilyas, M. Lowest Limit of w in the New Moon’s First Visibility Criterion of Bruin and its Comparison with the Maunder Criterion. Q. J. R. Astr. Soc. 1981, 22, 154–159. [Google Scholar]
- Caldwell, J.A.R.; Laney, C.D. First Visibility of the Lunar Crescent. Mon. Notes Astron. Soc. S. Afr. 1999, 58, 150–163. [Google Scholar]
- Caldwell, J.A.R. Moonset lag with arc of light predicts crescent visibility. MNASSA 2011, 70, 220–235. [Google Scholar]
- Qureshi, M.S. Computational Astronomy and the Earliest Visibility of Lunar Crescent; Institute of Space and Planetary Astrophysics, University of Karachi: Karachi, Pakistan, 2005; pp. 1–15. [Google Scholar]
- McNaughton, D. A Universal Islamic Calendar. Homdard Islamicus 1997, 20, 77–85. [Google Scholar]
- Doggett, L.E.; Schaefer, B.E. Lunar Crescent Visibility. Icarus 1994, 107, 388–403. [Google Scholar] [CrossRef]
- Al-Mostafa, Z. Lunar Calendar the New Saudi Arabian Criterion. Observatory 2005, 125, 25–30. [Google Scholar]
- Meeus, J. Astronomical Algorithms, 2nd ed.; Willmann-Bell Inc: Richmond, VA, USA, 1998. [Google Scholar]
- Bayesian Regularization Backpropagation. Available online: https://www.mathworks.com/help/deeplearning/ref/trainbr.html (accessed on 5 October 2022).
- ICOP Crescent Observation Results. Available online: https://www.astronomycenter.net/res.html (accessed on 1 September 2022).


| Research Author | Minimum Value of Elongation |
|---|---|
| Fotheringham [10] | 12° |
| Maunder [11] | 11° |
| Ilyas [19] | 10.5° |
| Yallop [16] | 10° |
| Fatoohi [1] | 7.5° |
| Danjon [12] and Schaefer [21] | 7° |
| Odeh [17] | 6.4° |
| McNally [13] | 5.5° |
| q Value | Crescent Condition |
|---|---|
| Easily visible | |
| Conditionally visible | |
| May need optical aid | |
| Should need optical aid | |
| Invisible |
| q Value | Crescent Condition |
|---|---|
| Easily visible | |
| Needs optical aid | |
| Invisible |
| q Value | Crescent Condition |
|---|---|
| Easily visible | |
| May need optical aid | |
| Needs optical aid | |
| Invisible |
| C | H. Y. | M. | Sight Date | Best Time (UT) | Lat | Lon | Age | W | ARCL | ARCV | DAZ | SO | A |
|---|---|---|---|---|---|---|---|---|---|---|---|---|---|
| O | 1422 | 12 | 12 February 2002 | 16:30 | 43.9 | 18.4 | 8.8 | 0.08 | 5.58 | 0.85 | 5.51 | I | I |
| S | 1408 | 2 | 23 September 1987 | 23:48 | 37.2 | −84.1 | 20.65 | 0.22 | 9.39 | 3.29 | 8.8 | I | I |
| O | 1423 | 2 | 13 April 2002 | 19:20 | 30.5 | −9.7 | 23.96 | 0.26 | 10.57 | 9.14 | 5.33 | I(T) | P |
| S | 1361 | 12 | 8 December 1942 | 21:48 | 40.7 | −74 | 19.8 | 0.34 | 11.32 | 9.78 | 5.74 | V(F) | P |
| O | 1423 | 6 | 9 August 2002 | 17:55 | 10.3 | 9.8 | 22.65 | 0.41 | 12.57 | 12.4 | 2.04 | V | V |
| S | 1393 | 2 | 5 March 1973 | 23:53 | 40 | −85 | 23.75 | 0.38 | 12.24 | 12.2 | 0.97 | V(V) | V |
| H. Y. | M. | Sight Day | w | ARCV | DAZ | Pred. | First Day (1) | Days | First Day (2) | Days |
|---|---|---|---|---|---|---|---|---|---|---|
| 1440 | 1 | 10 September 2018 | 0.37 | 9.08 | 7.73 | P | 11 September 2018 | 29 | 11 September 2018 | 30 |
| 2 | 9 October 2018 | 0.11 | 6.26 | 2.1 | I | 10 October 2018 | 30 | 11 October 2018 | 29 | |
| 3 | 8 November 2018 | 0.3 | 9.54 | 5.73 | P | 9 November 2018 | 29 | 9 November 2018 | 30 | |
| 4 | 7 December 2018 | 0.03 | 3.43 | 0.27 | I | 8 December 2018 | 30 | 9 December 2018 | 30 | |
| 5 | 6 January 2019 | 0.06 | 4.34 | 2.24 | I | 7 January 2019 | 30 | 8 January 2019 | 30 | |
| 6 | 5 February 2019 | 0.13 | 5.93 | 4.42 | I | 6 February 2019 | 30 | 7 February 2019 | 29 | |
| 7 | 7 March 2019 | 0.26 | 8.58 | 6.19 | P | 8 March 2019 | 29 | 8 March 2019 | 30 | |
| 8 | 5 April 2019 | 0.07 | 1.25 | 5.28 | I | 6 April 2019 | 30 | 7 April 2019 | 30 | |
| 9 | 5 May 2019 | 0.19 | 5.75 | 6.64 | I | 6 May 2019 | 29 | 7 May 2019 | 29 | |
| 10 | 3 June 2019 | 0.04 | 0.5 | 3.83 | I | 4 June 2019 | 30 | 5 June 2019 | 29 | |
| 11 | 3 July 2019 | 0.32 | 7.88 | 7.69 | P | 4 July 2019 | 29 | 4 July 2019 | 30 | |
| 12 | 1 August 2019 | 0.13 | 5.51 | 4.3 | I | 2 August 2019 | 29 | 3 August 2019 | 29 | |
| 1441 | 1 | 30 August 2019 | 0.04 | 3.83 | 0.26 | I | 31 August 2019 | 30 | 1 September 2019 | 29 |
| 2 | 29 September 2019 | 0.38 | 9.71 | 7.22 | P | 30 September 2019 | 29 | 30 September 2019 | 30 | |
| 3 | 28 October 2019 | 0.11 | 5.97 | 2.21 | I | 29 October 2019 | 30 | 30 October 2019 | 29 | |
| 4 | 27 November 2019 | 0.33 | 9 | 7.17 | P | 28 November 2019 | 29 | 28 November 2019 | 30 | |
| 5 | 26 December 2019 | 0.03 | 2.69 | 2.36 | I | 27 December 2019 | 30 | 28 December 2019 | 30 | |
| 6 | 25 January 2020 | 0.14 | 5.5 | 5.38 | I | 26 January 2020 | 30 | 27 January 2020 | 29 | |
| 7 | 24 February 2020 | 0.28 | 8.55 | 6.68 | P | 25 February 2020 | 29 | 25 February 2020 | 30 | |
| 8 | 24 March 2020 | 0.07 | 0.91 | 5.13 | I | 25 March 2020 | 30 | 26 March 2020 | 30 | |
| 9 | 23 April 2020 | 0.1 | 3.86 | 5.23 | I | 24 April 2020 | 30 | 25 April 2020 | 29 | |
| 10 | 23 May 2020 | 0.24 | 7.91 | 5.96 | P | 24 May 2020 | 29 | 24 May 2020 | 30 | |
| 11 | 21 June 2020 | 0.04 | 3.06 | 2.49 | I | 22 June 2020 | 30 | 23 June 2020 | 29 | |
| 12 | 21 July 2020 | 0.35 | 9.49 | 6.91 | P | 22 July 2020 | 29 | 22 July 2020 | 30 | |
| 1442 | 1 | 19 August 2020 | 0.16 | 6.89 | 3.39 | I | 20 August 2020 | 29 | 21 August 2020 | 29 |
| 2 | 17 September 2020 | 0.05 | 4.29 | 0.55 | I | 18 September 2020 | 30 | 19 September 2020 | 29 | |
| 3 | 17 October 2020 | 0.32 | 8.39 | 7 | P | 18 October 2020 | 29 | 18 October 2020 | 30 | |
| 4 | 15 November 2020 | 0.06 | 3.75 | 2.59 | I | 16 November 2020 | 30 | 17 November 2020 | 29 | |
| 5 | 15 December 2020 | 0.34 | 7.78 | 8.46 | P | 16 December 2020 | 29 | 16 December 2020 | 30 | |
| 6 | 13 January 2021 | 0.08 | 2.23 | 4.85 | I | 14 January 2021 | 30 | 15 January 2021 | 29 | |
| 7 | 12 February 2021 | 0.25 | 7.42 | 7 | P | 13 February 2021 | 29 | 13 February 2021 | 30 | |
| 8 | 13 March 2021 | 0.06 | 0.61 | 4.99 | I | 14 March 2021 | 30 | 15 March 2021 | 30 | |
| 9 | 12 April 2021 | 0.09 | 4.09 | 4.54 | I | 13 April 2021 | 30 | 14 April 2021 | 29 | |
| 10 | 12 May 2021 | 0.17 | 7.43 | 4.24 | P | 13 May 2021 | 29 | 13 May 2021 | 30 | |
| 11 | 10 June 2021 | 0.01 | 1.59 | 0.49 | I | 11 June 2021 | 30 | 12 June 2021 | 30 | |
| 12 | 10 July 2021 | 0.12 | 6.56 | 2.61 | I | 11 July 2021 | 29 | 12 July 2021 | 29 | |
| 1443 | 1 | 8 August 2021 | 0.04 | 3.34 | 1.71 | I | 9 August 2021 | 30 | 10 August 2021 | 29 |
| 2 | 7 September 2021 | 0.17 | 7.13 | 3.85 | P | 8 September 2021 | 29 | 8 September 2021 | 30 | |
| 3 | 6 October 2021 | 0.03 | 3.06 | 0.29 | I | 7 October 2021 | 30 | 8 October 2021 | 30 | |
| 4 | 5 November 2021 | 0.22 | 5.76 | 7.07 | I | 6 November 2021 | 30 | 7 November 2021 | 29 | |
| 5 | 4 December 2021 | 0.03 | 0.88 | 3.29 | I | 6 December 2021 | 29 | 6 December 2021 | 29 | |
| 6 | 3 January 2022 | 0.34 | 7.01 | 9.04 | P | 4 January 2022 | 29 | 4 January 2022 | 30 | |
| 7 | 1 February 2022 | 0.11 | 2.37 | 5.97 | I | 2 February 2022 | 30 | 3 February 2022 | 29 | |
| 8 | 3 March 2022 | 0.32 | 9.37 | 6.3 | P | 4 March 2022 | 29 | 4 March 2022 | 30 | |
| 9 | 1 April 2022 | 0.06 | 2.88 | 3.68 | I | 2 April 2022 | 30 | 3 April 2022 | 29 | |
| 10 | 1 May 2022 | 0.16 | 7.58 | 2.94 | P | 2 May 2022 | 30 | 2 May 2022 | 30 | |
| 11 | 30 May 2022 | 0.01 | 1.64 | 0.33 | I | 1 June 2022 | 29 | 1 June 2022 | 30 | |
| 12 | 29 June 2022 | 0.1 | 6.19 | 1.12 | I | 30 June 2022 | 30 | 1 July 2022 | 29 |
Publisher’s Note: MDPI stays neutral with regard to jurisdictional claims in published maps and institutional affiliations. |
© 2022 by the author. Licensee MDPI, Basel, Switzerland. This article is an open access article distributed under the terms and conditions of the Creative Commons Attribution (CC BY) license (https://creativecommons.org/licenses/by/4.0/).
Share and Cite
Allawi, Z.T. A Pattern-Recognizer Artificial Neural Network for the Prediction of New Crescent Visibility in Iraq. Computation 2022, 10, 186. https://doi.org/10.3390/computation10100186
Allawi ZT. A Pattern-Recognizer Artificial Neural Network for the Prediction of New Crescent Visibility in Iraq. Computation. 2022; 10(10):186. https://doi.org/10.3390/computation10100186
Chicago/Turabian StyleAllawi, Ziyad T. 2022. "A Pattern-Recognizer Artificial Neural Network for the Prediction of New Crescent Visibility in Iraq" Computation 10, no. 10: 186. https://doi.org/10.3390/computation10100186
APA StyleAllawi, Z. T. (2022). A Pattern-Recognizer Artificial Neural Network for the Prediction of New Crescent Visibility in Iraq. Computation, 10(10), 186. https://doi.org/10.3390/computation10100186