4.3.1. Experimental Results of Four Real-World Networks
Some related parameters in our experiments were set above; however, there was also an important parameter
that needed to be set. As this tunable parameter plays a crucial role in finding better community partitions in CDDEA, we needed to set a different parameter
according to the studied network. After several tests on four real-world networks, we found a proper parameter
for community detection methods in CDDEA and Meme-Net. In
Table 2, we set
in CDDEA and Meme-net, and the number of iterations was 50; in
Table 3, we set
in CDDEA, while
in Meme-net, and the number of iterations was 100; in
Table 4 , we set
in CDDEA, while
in Meme-net, and the number of iterations was 150; in
Table 5, we set
in CDDEA, while
in Meme-net, and the number of iterations was 100. The greedy factor of CDDEA was equal to 1.8 for these four real-world networks.
Table 2,
Table 3,
Table 4 and
Table 5 show the computational results using different detection methods on four real-world networks. The DECD and GA are modularity maximization methods based on evolutionary algorithms. The GA-Net finds community partitions by maximizing a fitness function named the community score. The Meme-Net is a community detection method which tries to optimize the network modularity density by employing a memetic algorithm. Our proposed algorithm is also a modularity density maximization method in the form of differential evolution. The other two algorithms, fast unfolding and Leon Danon, listed in
Table 2,
Table 3,
Table 4 and
Table 5 for comparison, are extensions of the fast Newman algorithm proposed by Newman et al. [
14].
From
Table 2,
Table 3,
Table 4 and
Table 5, we can see that CDDEA shows a better performance in community detection on the four real-world networks. In
Table 2, the results obtained by CDDEA show that it can converge to the global optimal NMI value with a value of 1. In other words, the detected communities by CDDEA are the same as the real ones. Of course, the Meme-net also presents better performance for Zachary’s karate club network, and finds the optimal value of NMI. However, other algorithms do not detect the true partitions.
Table 3 shows that the CDDEA method finds the optimal value of NMI with 0.9772 on the bottlenose dolphins network, while Meme-net obtains the best value of NMI with 0.9742. In the course of executing CDDEA and Meme-net, we recorded values of NMI for each method running 30 times. In CDDEA, we got the best value of
27 times,
once, and 0.7563 the remaining two times. In Meme-net, we obtained the optimal value of
29 times, and
once. According to this, we can see that methods based on the evolutionary algorithm plunge into local optimal values of NMI, and cannot escape easily. However, compared to other algorithms listed in
Table 3, the higher average values of NMI obtained using CDDEA and Meme-net illustrate their better performance on the bottlenose dolphins network. In
Table 4, most results obtained by the listed methods were very close to each other. We sorted their performance according to their average NMI values from large to small: CDDEA (0.9129), Meme-Net (0.9129), fast unfolding (0.8872), GA-Net (0.8091), DECD (0.7912), Leon Danon (0.7517), fast Newman (0.7398), and GA (0.7306). In
Table 5, these methods could not find real partitions on the American political books network.
As far as the number of detected communities is concerned, the result will change according to the tunable parameter
in
. As can be seen in
Table 6, for the proper
set above, CDDEA can always find two real communities on Zachary’s karate club network, and can detect two real communities on the bottlenose dolphins network under most conditions, while 12 or 13 communities were detected on the American college football network, and two to four communities were detected on the American political books network. Moreover,
Table 6 shows that the parameter
has an influence on the number of detected communities on these four real-world networks. For each network, we ran our algorithm 10 times, and recorded the average value, the maximum value, the standard deviation, and the number of detected communities. The range of parameter
used in each real-world network was 0.25 to 0.90, with an interval of 0.05.
Figure 4 shows the box plots over 10 runs of CDDEA on four real-world networks, which records the distribution of NMI values with the change in values of
. On each box, the median is represented as a red line, and the edges of the box are the upper quartile and lower quartile. Meanwhile, the whiskers extend to the most extreme data point which is no more than 1.5 times the length of the box away from the box, and the outliers are plotted with red crosses. It can be seen from
Figure 4a that, when
, the statistic values of NMI on Zachary’s karate club network are all equal to 1, and there were no outliers, which means that the detected communities were the same as the real ones. In
Figure 4b, when
and
, the distribution values of NMI on the bottlenose dolphins network were very close to each other, and the main difference was the number of outliers between them. When
, a better distribution of values of NMI was acquired. Then, the values of NMI began decreasing with an increase in
. Therefore, parameter
should be set to 0.4 in order to find ideal community partitions. Similarly, in
Figure 4c, when
, better community partitions concerning the American college football network were detected compared to other values of
. In
Figure 4d, we can also detect better communities on the American political books network if
.
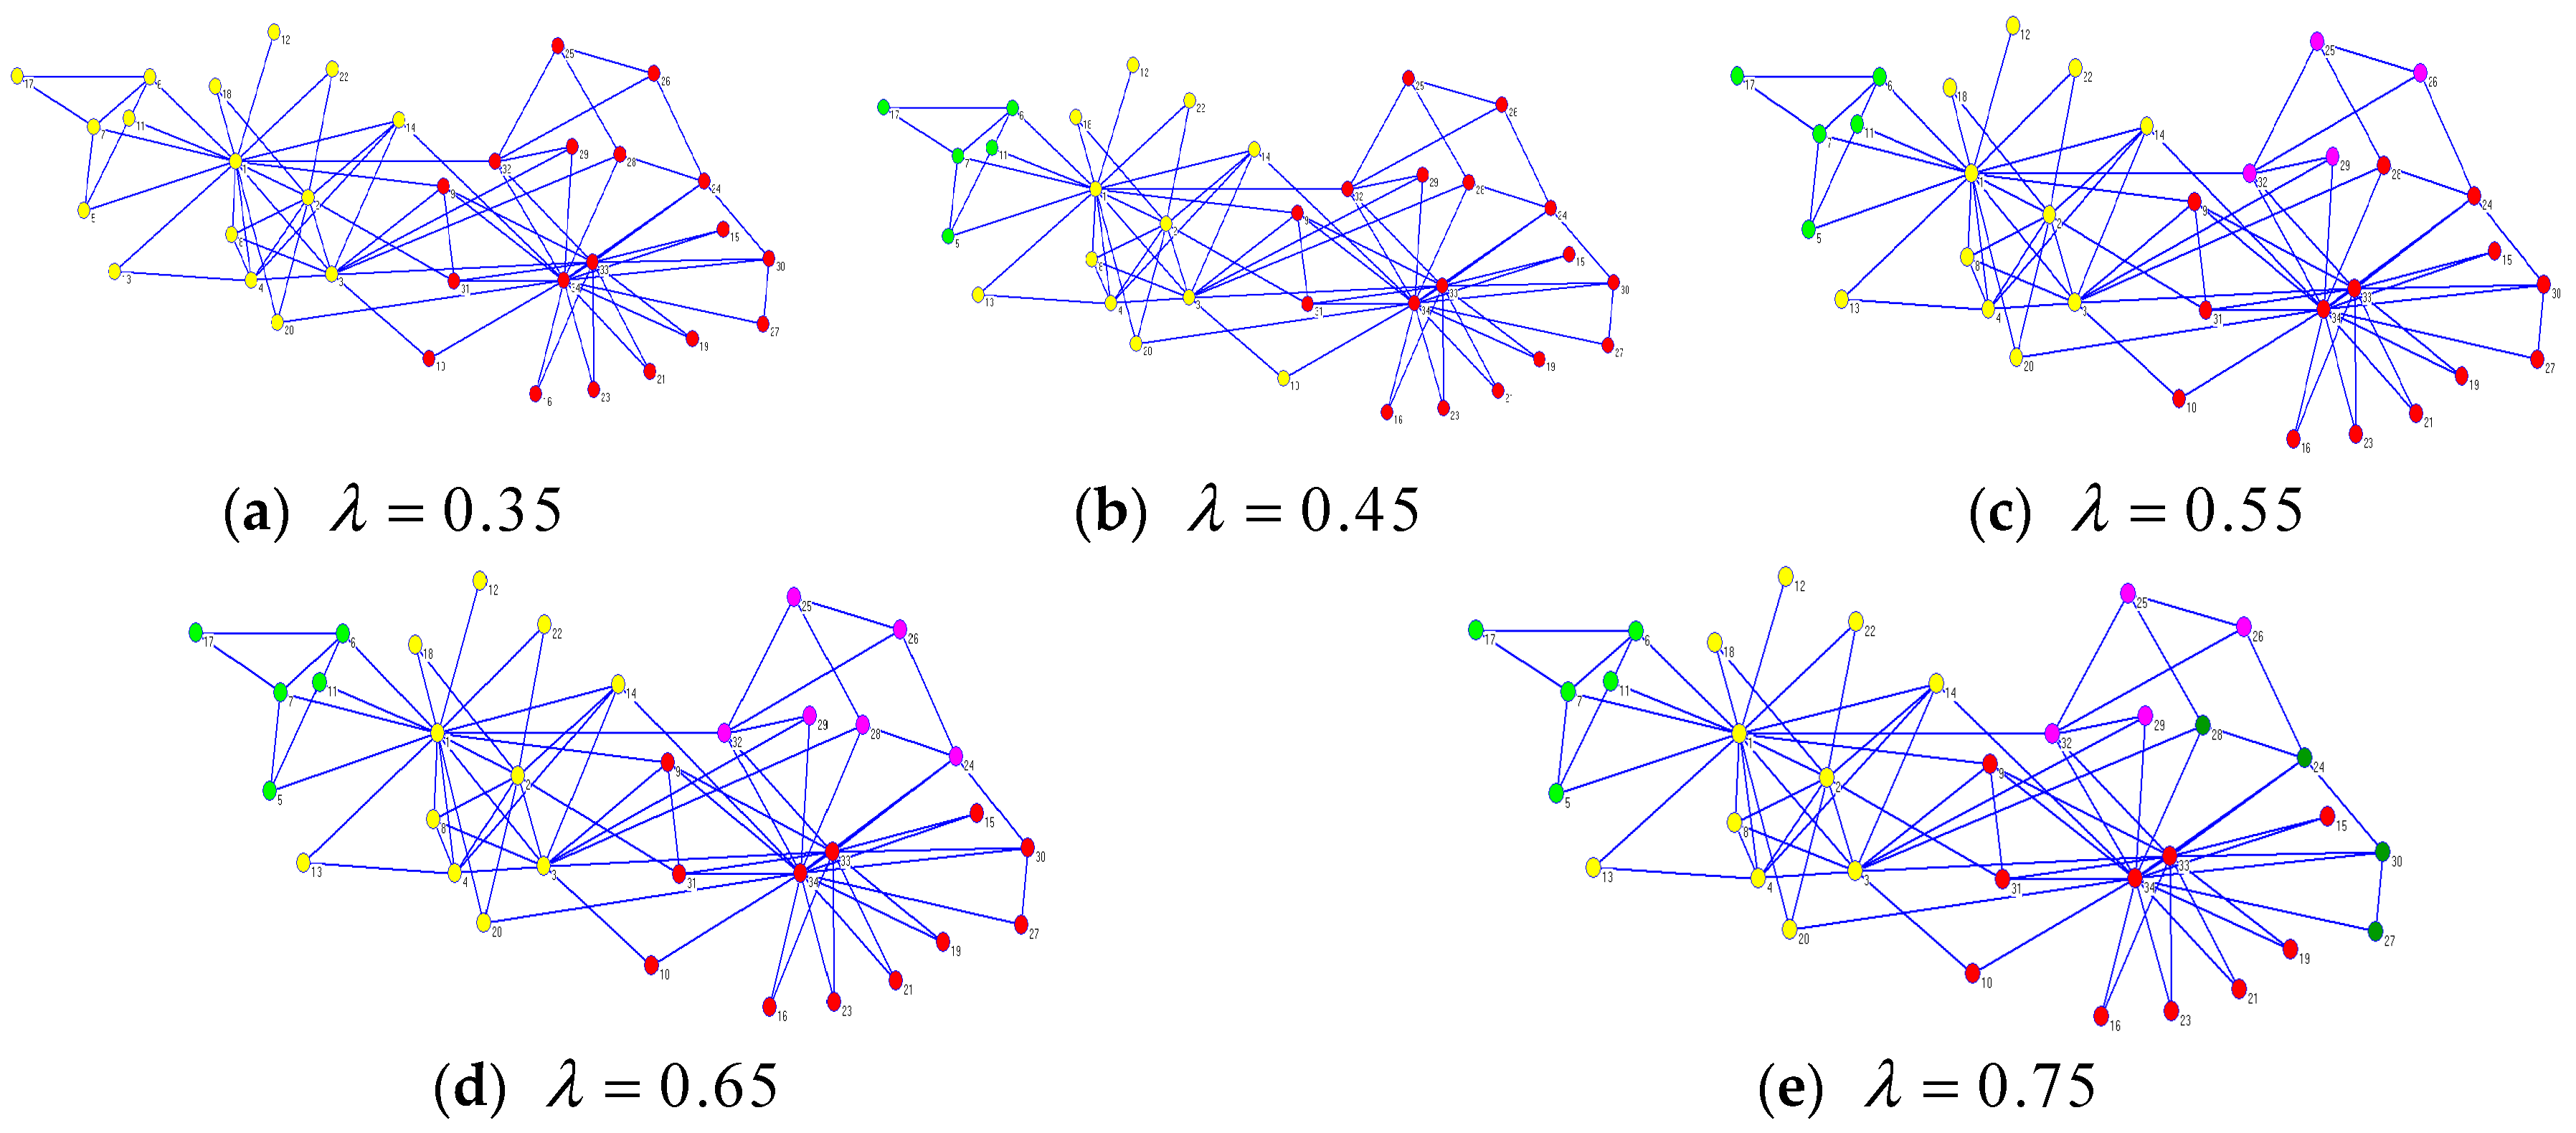
Figure 5 illustrates that CDDEA can find different ideal community partitions with the change in parameter
on Zachary’s karate club network. When
, the CDDEA found two partitions, which were the same as the real ones. For
, three partitions were found. The yellow partition in
Figure 5a was separated into two small partitions, such as
Figure 5b, and node 10, originally belonging to the yellow partition, was allotted to the red partition. When
, this original red partition in
Figure 5b was separated into two other small ones, and there were four detected communities on Zachary’s karate club network. For
, we can see from
Figure 5d that nodes 24 and 28 were removed out from the red partition and added to the pink partition found in
Figure 5c. When
, nodes 24, 27, 28, and 30 constituted a new partition compared to
Figure 5d, as seen in
Figure 5e. From
Figure 5a–e, we can see that the number of detected communities increased with
increasing. However, not all detected communities were meaningful due to the fact that, when
reached an idea value for a particular network, the NMI also approached the perfect value 1, and if
continued increasing, the NMI decreased. As far as Zachary’s Karate Club network is concerned, CDDEA could find meaningful communities when
exceeded the ideal value of 0.35. Of course, when
exceeded 0.75, CDDEA found worse partitions which consisted of only two or three nodes. Therefore, it is crucial to set a proper value of
according to the different network being studied with CDDEA.
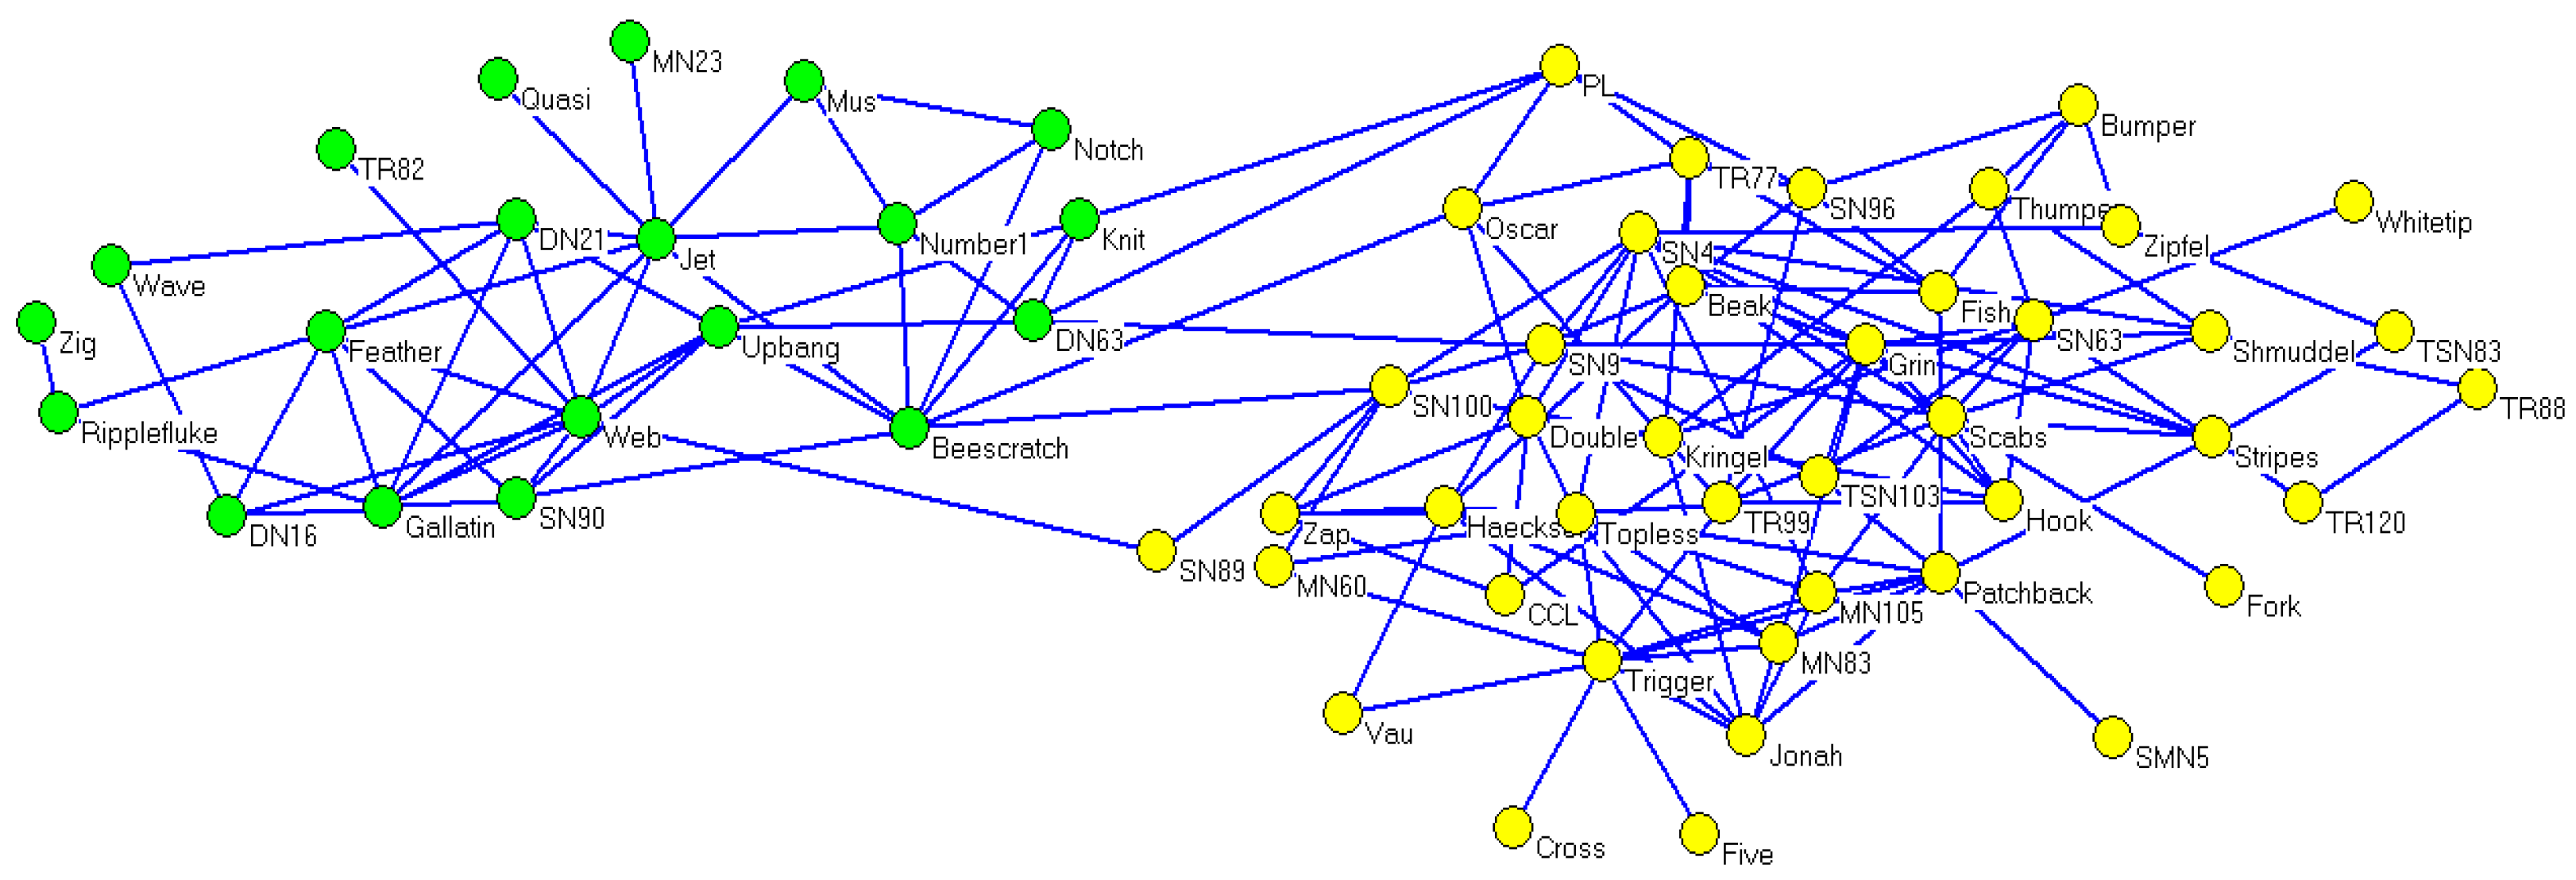
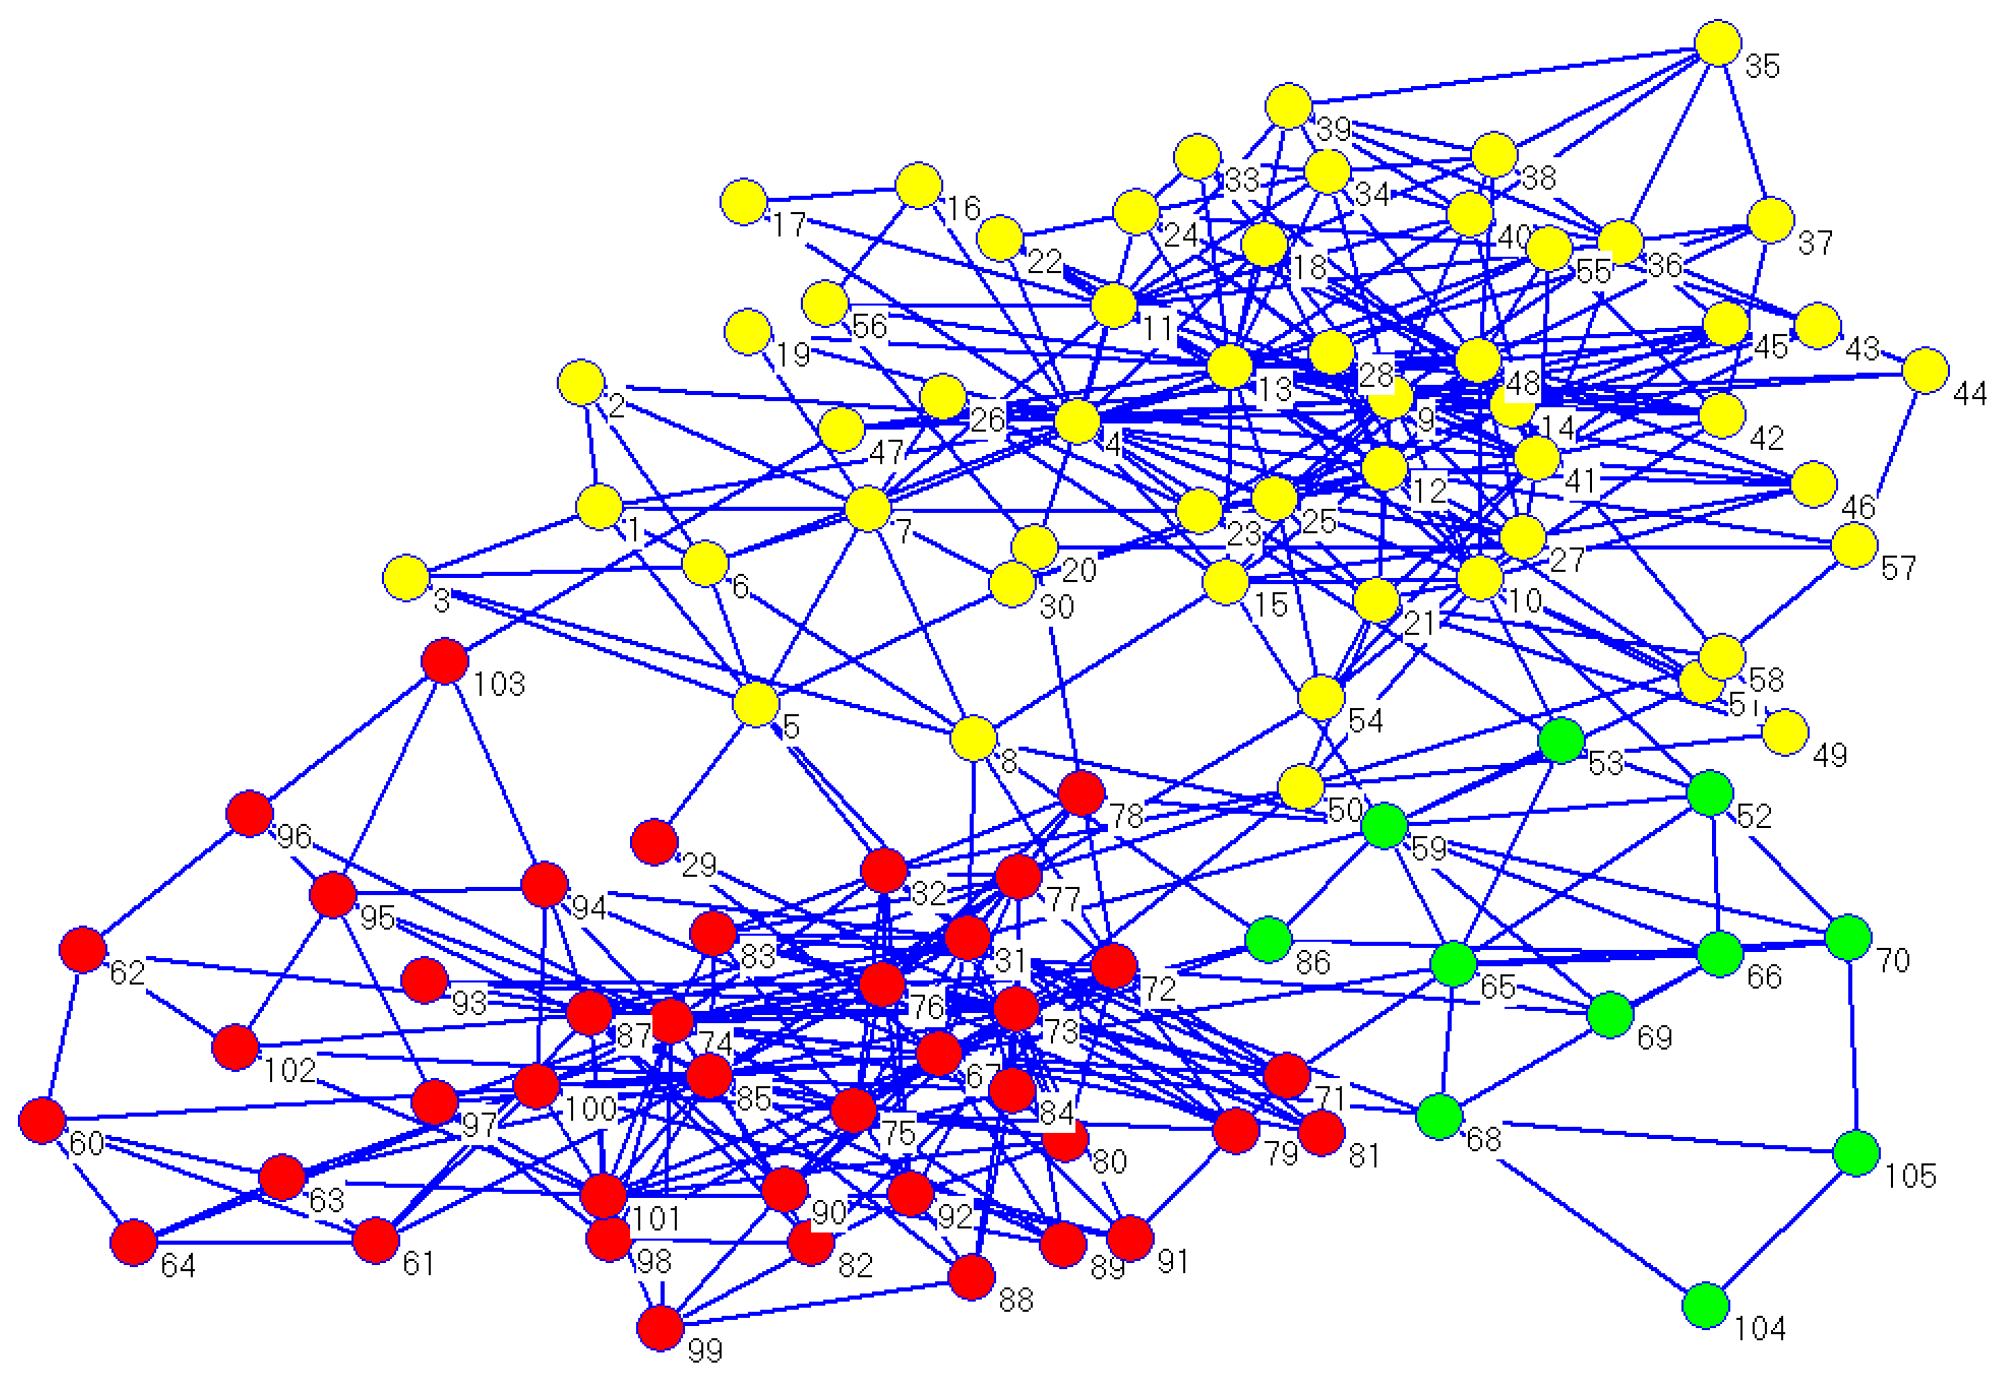
Concerning the dolphin social network, its real community partitions could also be detected using CDDEA in most conditions. For
, the corresponding average value of NMI was 0.9772, while the best NMI value of 1 occurred 27 times after running CDDEA 30 times, and the detected partitions are illustrated in
Figure 6. Meanwhile, as can be seen from
Table 6, the number of detected communities demonstrates a similar effect with the increase in
.
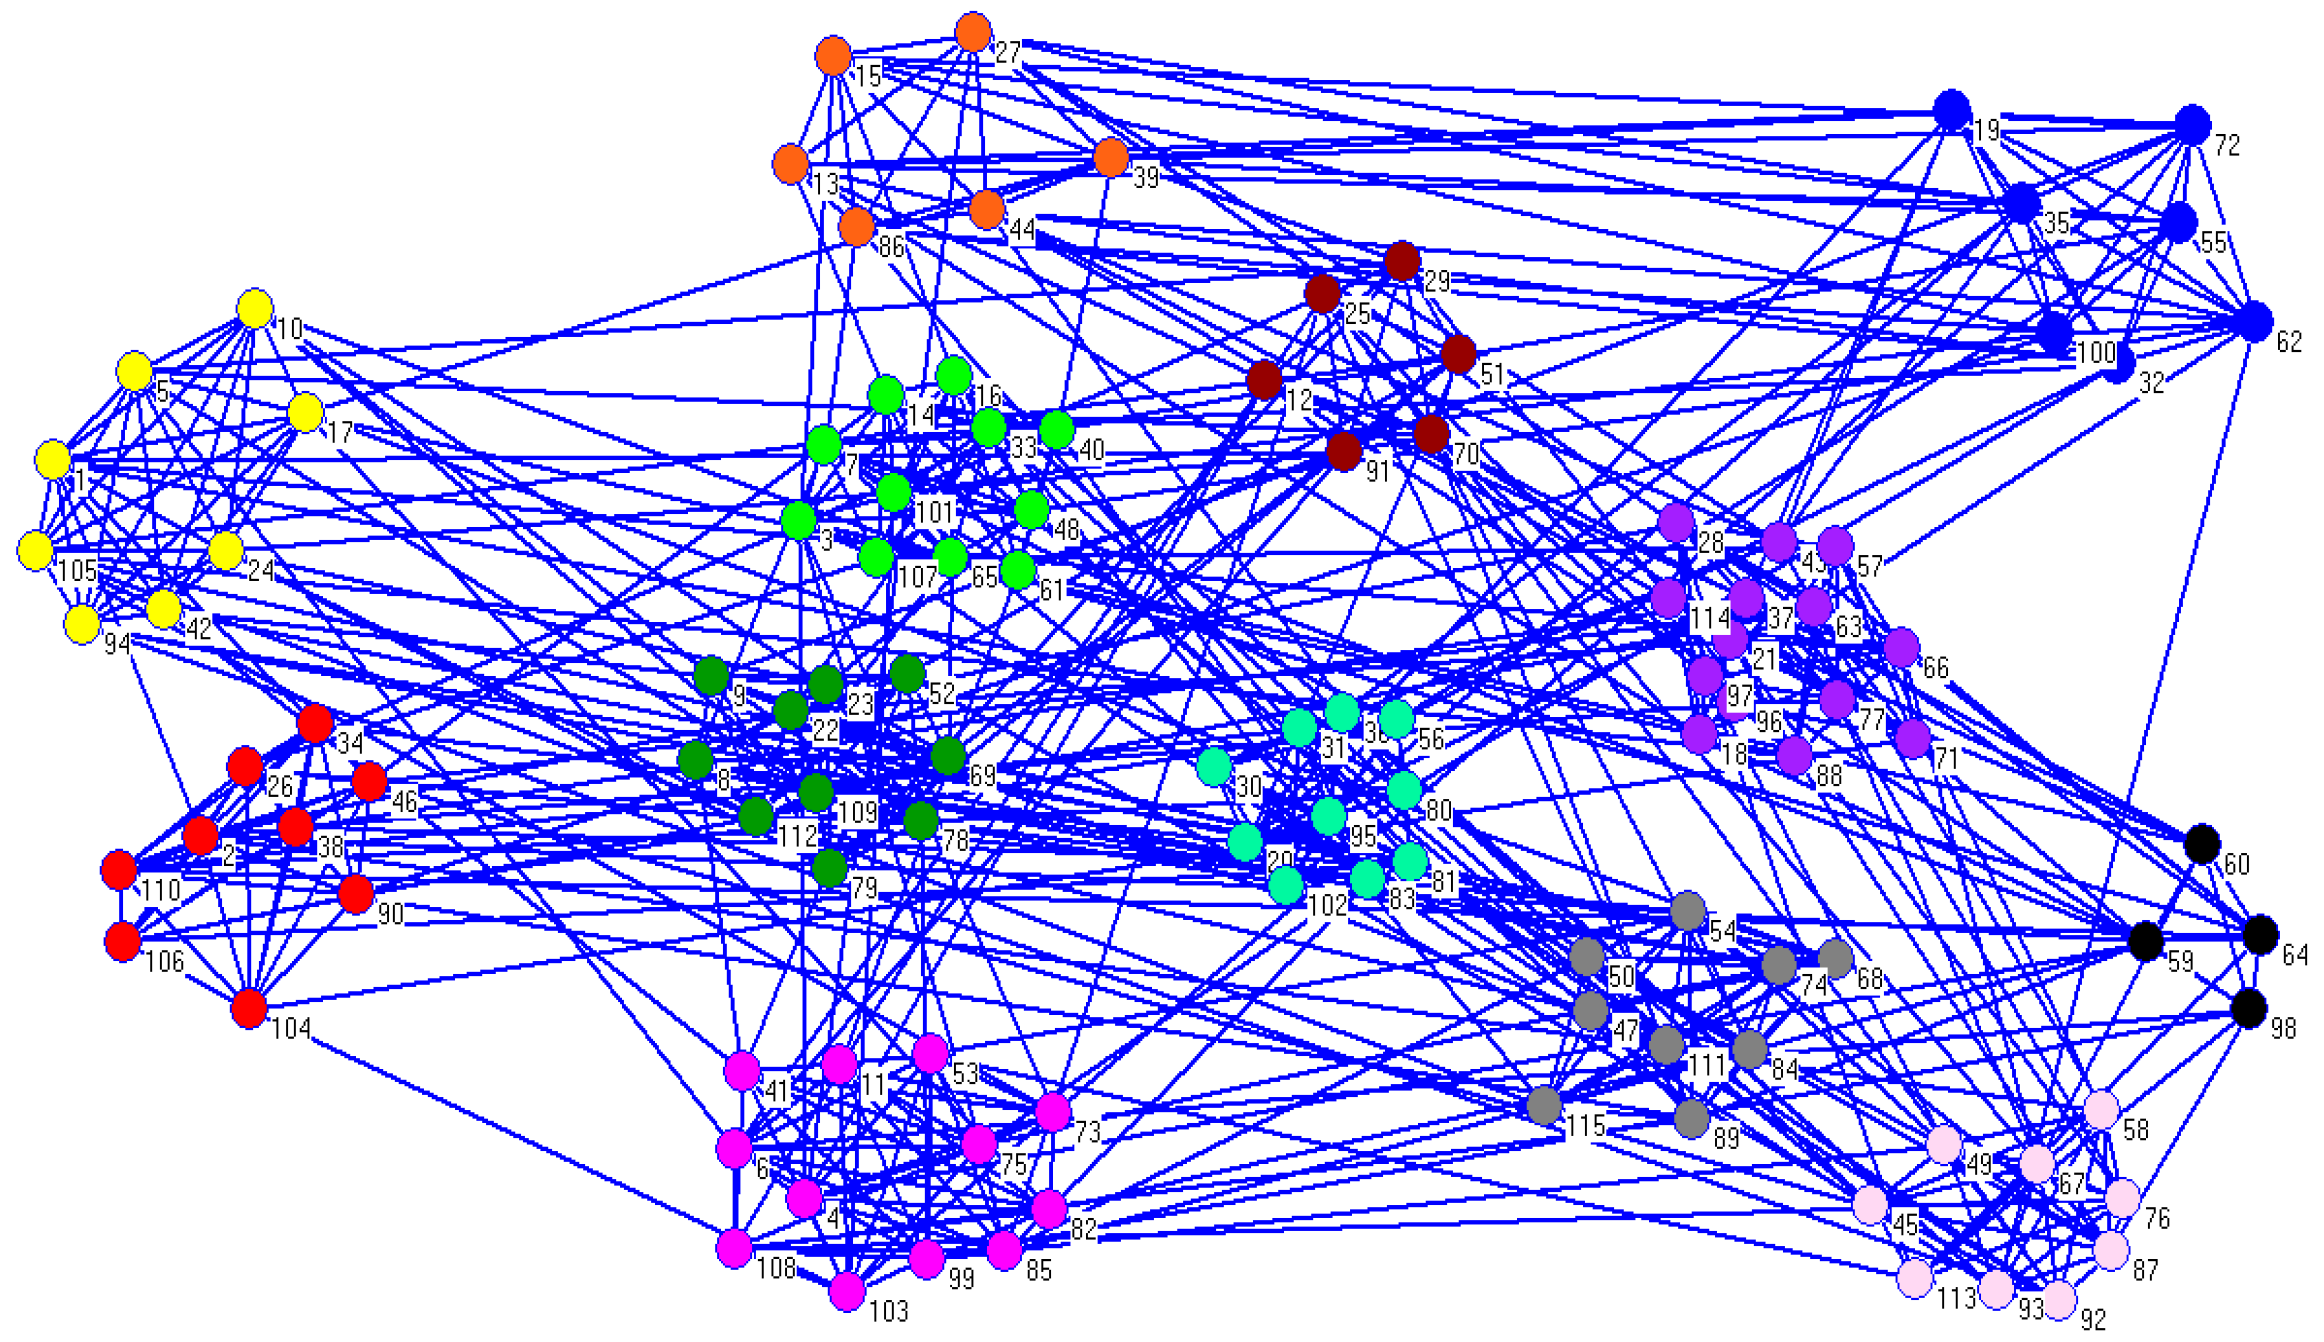
For the American college football network, we got a better result compared to the real partitions. When
, the average value of NMI value was 0.9129, which was very close to the real partitions.
Figure 7 shows the detected communities generated by CDDEA. As can be seen from
Figure 7, there were 13 partitions, which was the same as the number of real communities, while only a few nodes were misplaced.
On the American political books network, CDDEA did not acquire a better performance, and the best value of NMI was 0.6085 when
.
Figure 8 shows the three detected partitions in one run of CDDEA when
. Furthermore, other community detection algorithms, such as fast Newman and Meme-Net, also could not find real partitions in this network due to its complexity. As can be seen from
Table 5, the average value of NMI acquired by most algorithms was about 0.55, which means that the result of detected communities had some differences with the real ones.
4.3.2. Experimental Results of Synthetic Benchmark Networks
Firstly, we set the maximum generation of these five evolution-based algorithms to
; the mutation parameter is 0.2 in GA and Meme-Net, and some important parameters of CDDEA were set, as listed in
Table 7, while other parameters were the same as the initial part of
Section 4. There were 11 different networks, and with the increase in mix parameter
range from 0 to 0.5, the complexity of the corresponding network increased, resulting in them being more difficult distinguish. Therefore, parameter
needs to be tuned in the modularity density function in order to increase the ability of detection so as to find better community partitions. According to Reference [
2], the default proper value for
in Meme-Net is 0.5. However, this is not perfect with the increase in
as NMI was equal to 0 when
. In previous experiments on four real-world networks which have different complexities, we acquired better results by tuning the parameter
. Accordingly, we can also tune
in these 11 different networks. For each mix parameter
which represents a different kind of network, we may set a corresponding
to find better community partitions. After many tests on these benchmark networks, we found proper values for
. In Meme-Net, we set
when
ranged from 0 to 0.5. In CDDEA, the proper values of
were set as shown in
Table 7, according to the complexity of corresponding network. Then, we ran each algorithm 10 times, and
Figure 9 shows that CDDEA had a better performance in the benchmark network. When
, CDDEA could basically find real community partitions except for the influence of plunging into local optimization values, which may also exist in other evolution-based algorithms. Moreover, the performance of CDDEA was better than GA and DECD, and was close to Meme-net. When
increased, the complexity of network also increased, and our algorithm could also find better community partitions and its performance was better than other methods. For instance, when
, the average value of NMI was close to 1; when
, it was close to 0.9, which shows that the detected communities were very close to the real ones. If
continued increasing, the detection became a hard task for CDDEA, but the NMI was still close to 0.8, which was better than Meme-Net, GA, and DECD. When
reached 0.45 or 0.5, none of these algorithms could detect the real communities due to the great complexity of the networks.
Meanwhile, we also found that proper parameters could effectively improve the detection ability of CDDEA in the course of finding better communities. By tuning , we could improve the resolution and detection ability of CDDEA in analyzing complicated networks; by tuning the greedy factor, we could improve the mutation ability and increase the diversity of individuals; by tuning the maximum number of iterations of CDDEA, we could acquire exact solutions which were close to real ones.


