Abstract
Compacting orthogonal drawings is a challenging task. Usually, algorithms try to compute drawings with small area or total edge length while preserving the underlying orthogonal shape. We suggest a moderate relaxation of the orthogonal compaction problem, namely the one-dimensional monotone flexible edge compaction problem with fixed vertex star geometry. We further show that this problem can be solved in polynomial time using a network flow model. An experimental evaluation shows that by allowing additional bends could reduce the total edge length and the drawing area.
1. Introduction
The compaction problem in orthogonal graph drawing deals with constructing an area-efficient drawing on the orthogonal grid. Every edge is drawn as a sequence of horizontal and vertical segments, where the vertices and bends are placed on grid points. Compaction has been studied in the context of the topology–shape–metrics approach [1]. Here, in a first phase, a combinatorial embedding is computed that determines the topology of the layout with the goal to minimize the number of crossings. In the second phase, a dimensionless orthogonal shape of the graph is determined by fixing the angles between adjacent edges and the bends along the edges. The goal is to minimize the number of bends, which can be done in polynomial time for a fixed embedding [2]. In the third phase, metrics are added to the orthogonal shape. In this context, first the coordinates of vertices and bends are assigned to grid points so that the given orthogonal shape is maintained. Finally, the (orthogonal) compaction problem asks for a drawing minimizing geometric aesthetic criteria, such as the area of the drawing or the total edge length. The shape is not allowed to change.
Since the orthogonal compaction problem is NP-hard [3], in practice, heuristics are used that fix the x- (or y-, respectively) coordinates and solve the resulting compaction problem in one dimension. Given an initial drawing, the one-dimensional compaction problem with the goal of minimizing the height (or width, respectively) of the layout can be transformed to the longest path problem in a directed acyclic graph. If in addition the total edge length shall be minimized, the problem can be solved by computing a minimum cost flow.
The topology–shape–metrics approach aims at drawings with a small number of crossings, a small number of bends, and a small drawing area. These goals are addressed separately in this order, where the second and the third phase consider the outcome of the preceding phases. Indeed, the number of crossings and bends is relatively small in comparison to other approaches [4]. Unfortunately, this is not true for the drawing area. Often, the layouts contain large areas of white space.
Consider the drawing in Figure 1a which contains large areas of white space due to shape restrictions. By introducing two bends on one of the edges, the drawing area can be reduced drastically. This motivates us to study a compaction problem in which the shape conditions are relaxed. We want to favour compact drawings over few bends.
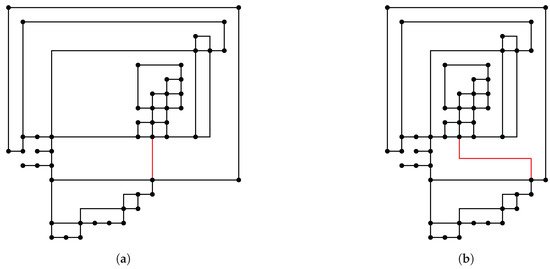
Figure 1.
(a) A drawing with large areas of white space due to shape restrictions; and (b) introducing two additional bends to red edge of the drawing leads to a smaller drawing.
This brings us back to the origin of the orthogonal compaction problem in VLSI layout design (see, e.g., [5]). Here, a compact drawing, corresponding to a small chip layout, is a natural objective.
In contrast to the compaction problem considered in graph drawing, even the permutation of wires along the boundary of a component (and hence, changing the embedding) is allowed.
We suggest a moderate relaxation of the orthogonal compaction problem. More precisely, we suggest to study the one-dimensional monotone flexible edge compaction problem with fixed vertex star geometry, henceforth the Fled-Five compaction problem, which asks for the minimization of the vertical (horizontal, respectively) edge length and allows changing the orthogonal shape of edges, but preserves the x-monotonicity (y-monotonicity, respectively) of edge segments and prohibits changing the directions of the initial edge segments around the vertices (vertex star geometry). We present a polynomial-time algorithm based on a network flow model that solves the Fled-Five compaction problem to optimality. Our computational results show that repeated application of Fled-Five compaction in x- and y-direction is able to reduce the total edge length and the drawing area at the expense of additional bends. We also experimented with approaches to control the number of additional bends.
2. State-of-the-Art
Patrignani [3] showed that planar orthogonal compaction is NP-hard in general, and Bannister et al. [6] gave inapproximability results for the nonplanar case. However, for some special cases there exist polynomial-time algorithms. In the case that all faces are of rectangular shape, one can find a minimum length assignment by sending flow horizontally and vertically through the layout guaranteeing that opposite sides of a rectangle have the same length, see e.g., [7]. Bridgeman et al. [8] showed that a so-called turn-regular shape for every face suffices to determine an optimum assignment. Klau and Mutzel [9] introduced a combinatorial description of all drawings that realize a given orthogonal shape, a so-called shape description. If this shape description is complete or has a unique completion, the compaction problem is solvable in polynomial time. In this case, the orthogonal shape already unambiguously defines the relative positions of edge segments to each other. If this is not the case, there are segments for which there is more than one feasible relative positioning and the authors suggested a branch-and-cut approach to solve an integer linear program to find an optimal completion.
However, in practice, heuristics are used which iteratively fix the x-, and then the y-coordinates, and solve the resulting one-dimensional compaction problem. This process is repeated until no further progress is made. One-dimensional compaction algorithms often use either network flow techniques or a longest path method in order to assign integer coordinates to the vertices, see, e.g., [10] for an overview. A method, which can also be used to construct an initial drawing, is to decompose all faces into rectangular or turn-regular faces by adding dummy edges and vertices and then to apply the compaction algorithms by Tamassia [2] or Bridgeman et al. [8], respectively. In the end, the dummy edges and vertices are removed from the drawing, thus leading to layouts with non-optimal area or edge length. Originating in VLSI layout design, compaction heuristics reach back to the 1970s, e.g., the compression ridge method by Dai and Kuh [11], which passes through the layout and identifies edges that can be shortened simultaneously so that the layout can be pushed together. Eiglsperger and Kaufmann [12] combined the concepts by Klau and Mutzel [9] and the decomposition technique by Tamassia [2] to a linear time algorithm that can also compact drawings with vertices of prescribed size. Hashemi and Tahmasbi [13] refined the decomposition phase of Bridgeman et al. [8] by using separation constraints already given by the orthogonal shape. An experimental comparison of planar compaction algorithms was presented by Klau et al. [14].
There has been some work to improve the quality of a drawing by changing its shape, e.g., [15] or [16]. The former uses shifting and resizing vertices and modifies the shape of the edges to save area and bends, and the latter may additionally change the topology to improve the drawing. However, most compaction algorithms for planar 4-graphs take as input an orthogonal representation and try to produce compact drawings with respect to that representation. This can lead to an unnecessarily large drawing area with unused space. Often better results in terms of area and edge length can be achieved if the orthogonal shape can be altered, as we have seen in Figure 1. On the other hand, it might be desirable to not change a given drawing too much to preserve the mental map. In some applications, such as laying out data flow diagrams, edges should start and end at specific points or sides of the vertices [17]. These so-called port constraints would correspond to fixing the initial edge segments around vertices (vertex star geometry) in an orthogonal representation while leaving flexibility to the edges.
To the best of our knowledge, there has not been much attention to orthogonal compaction in the last decade. Neta et al. [18] presented a genetic algorithm applied to the topology–shape–metrics approach, where individuals are determined by the order of edge traversal in the planarization phase and the fitness function takes into account the number of crossings, the number of bends and the total edge length of the drawing. Freivalds and Glagoļevs [19] considered the problem of minimizing the total edge length with an algorithm that combines local and global improvement. Local improvement is done via moving and swapping nodes following the idea of simulated annealing and global improvement is based on constrained quadratic programming.
3. Notation and Preliminary Results
In this section, we give basic definitions and notations. For more details on orthogonal drawings and graph drawing in general, see, e.g., [7,10,20].
3.1. Orthogonal Graph Drawing
For the rest of this paper, we restrict ourselves to undirected 4-graphs, i.e., graphs whose vertices have at most four incident edges. A graph with and is called planar if it admits a drawing in the plane without edge crossings. Such a planar drawing of G induces a (planar) embedding, which is represented by a circular ordered list of bordering edges for every face. The unbounded region of a planar drawing is called external face.
An orthogonal representation H is an extension of a planar embedding that gives combinatorial information about the orthogonal shape of a drawing. For every edge, we provide information about the bends encountered while traversing the edge and the angle formed at vertices by two consecutive edges. If one of these angles is 270° or 360° we associate with v a reflex corner. An orthogonal representation is called normalized if it has no bends. An orthogonal grid drawing of G is a drawing in which every edge is drawn as a sequence of horizontal and vertical edge segments and every vertex and bend has integer coordinates. Such a drawing induces an orthogonal representation and a star geometry for every vertex fixing the directions of the initial line segments of its incident edges. If an edge first turns to the right and then to the left, or vice versa, we call this a double bend and the edge segment between these two bends a middle segment. Every orthogonal representation can be normalized by replacing all bends in with dummy vertices of degree two, thus adding vertices to G and .
Since our new approach is based on a network flow model for one-dimensional compaction, we give a brief introduction to minimum cost flows here. For more information about network flows, see [21]. Let be a directed graph. Whenever we talk about flows, we call N a network, the members of nodes and the members of arcs (in contrast to vertices and edges in an undirected graph). Every arc a has a lower bound , an upper bound and a nonnegative cost . A demand is associated with every node. We call a function a flow if x satisfies the following conditions:
A minimum cost flow is a flow x with minimum total cost among all feasible flows. There are various polynomial-time algorithms to solve the minimum cost flow problem. An experimental evaluation of some selected algorithms can be found in [22]. Their experiments show that the network simplex algorithm, which has an exponential running time in theory, works very well in practice. Let A be an algorithm to solve the minimum cost flow problem. We denote the running time of A in a network by .
3.2. Compaction of Orthogonal Drawings
We focus on the vertical (orthogonal) compaction problem that receives as input a planar grid drawing of a graph G with an orthogonal representation , and asks for another planar orthogonal drawing of G realizing so that the vertical edge length is minimized subject to fixed x-coordinates.In the literature on this problem, the only valid modifications that can be applied to are changing the lengths of vertical edges, so that the visibility properties of the drawing are maintained. For simplicity, we describe a variation of the coordinate assignment algorithm in [7] that is similar to the commonly used improvement heuristic for the vertical orthogonal compaction problem.
Assume we have an initial grid drawing . In a first step, we normalize resulting in and . Then, we add vertical visibility edges (so-called dissecting edges). We insert a vertical edge connecting each reflex corner with the vertex or edge that is visible in vertical direction, possibly introducing dummy vertices. This gives us and . This way, we eliminate all reflex corners and have a representation with rectangular faces.
Now, we are ready to construct the vertical compaction network. For each face f in representation , we add a node to with demand and for every vertical edge e with left face and right face we insert an arc with lower bound and upper bound (minimum cost flow algorithms can handle this with a flag rather than a big numerical value). If e is a dummy edge, gets zero cost, otherwise a cost of one. See Figure 2 for an example.
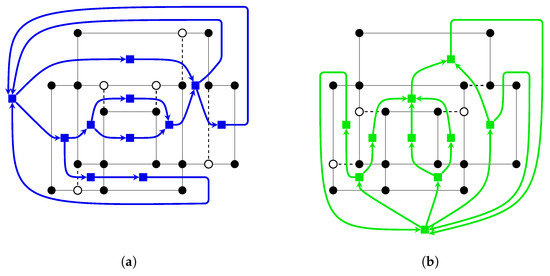
Figure 2.
The flow networks: (a) for vertical compaction; and (b) for horizontal compaction. White vertices are dummy vertices and dashed edges are dummy edges. Coloured network arcs over dashed graph edges have no cost, while all other arcs have a cost of one. All network arcs have a lower bound of one.
Suppose we have computed a feasible flow. Now, a unit of flow corresponds to one unit of vertical edge length. The x-coordinates remain unchanged. The capacity constraint assures that every edge gets a minimum length of one and the flow conservation constraint guarantees that every face is drawn as a proper rectangle. Finally, the visibility edges and dummy vertices can be removed.
Lemma 1.
The above algorithm solves the vertical compaction problem to optimality.
Proof.
In the vertical compaction problem, we have to preserve the vertical visibility properties of to avoid overlapping graph elements. This is achieved by the newly added visibility edges. Because of the one-to-one correspondence of vertical length of an edge segment in the resulting drawing and the amount of flow carried by a non-zero-cost arc , the result of the minimum cost flow gives us a minimum vertical length assignment. ☐
4. The Fled-Five Compaction Approach
The traditional one-dimensional flow-based compaction method, as described in the previous section, can only alter the length of vertical or horizontal edges. This limits the possibilities of compaction. We attempt to obtain greater flexibility by allowing to add new and delete unnecessary edge segments to the drawing. However, we also want to maintain some properties. We want to keep the embedding and do not want to change the local surrounding of a vertex. This can be crucial if, for example, the input graph contains artificial vertices that replace edge crossings or if vertices with degree greater than four are handled as faces. In these cases the embedding and the vertex star geometry matter.
In this section, we study the following relaxation of the one-dimensional compaction problem called the monotone flexible edge compaction problem with fixed vertex star geometry (Fled-Five compaction problem). For vertical compaction it is defined as follows: Given a planar grid drawing of a 4-graph G with an orthogonal representation , compute another planar grid drawing of G that minimizes the vertical edge length subject to fixed x-coordinates in which all horizontal edge segments of are drawn x-monotonically and the vertex star geometry for all vertices as well as the planar embedding is maintained.
In contrast to the classical compaction problem, it is not required here to realize the entire orthogonal representation, but only the local geometric surrounding of each vertex. The fixed x-coordinates and the x-monotonicity prohibits the lengthening of the total horizontal edge length (see Figure 3).
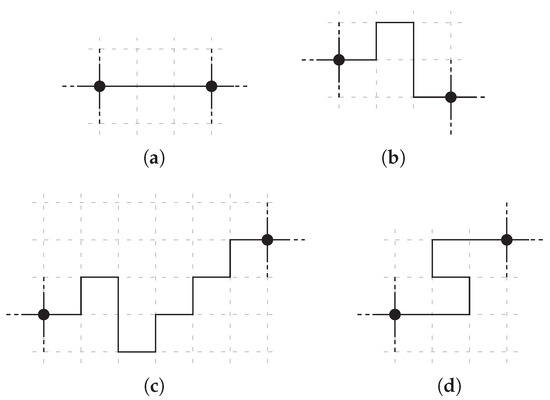
Figure 3.
Modifications in Fled-Five: (a) the original edge of length three; (b) modification allowed in Fled-Five; (c) not allowed because of changed x-coordinates; and (d) not allowed because x-monotonicity is violated.
We adapt the network flow approach described in Section 3.2. However, now we are able to introduce or remove double bends of certain edges in order to improve the vertical edge length. We illustrate the concept by the following example. Figure 4a shows an optimally compacted drawing with respect to its orthogonal representation. The blue arcs show the arcs of the vertical compaction network (compare Figure 2). For better readability, we omitted the network nodes belonging to the faces. In Figure 4b, the same graph is shown, but with a different orthogonal representation. The new double bend in the middle edge leads to a smaller drawing. In this drawing, it is possible to send flow between the two internal faces, since they are separated by a vertical edge segment. In the corresponding flow network there is a new network arc (red, dashed) connecting the upper and the lower face. This leads to the key idea of our approach. Introducing arcs in the vertical flow network between horizontally separated face nodes enables us to shift flow between them and therefore exchange vertical edge length at the expense of a double bend (see Figure 4c). We can also reverse this thought. If there is an unnecessary double bend, we can get rid of it by not sending flow over the arc corresponding to its middle segment and thus removing the middle segment from the drawing.
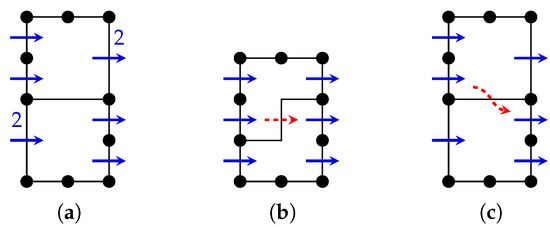
Figure 4.
A graph and the arcs of the corresponding flow network: (a,b) of the traditional algorithm; and (c) in our algorithm. Arc labels in (a,b) describe flow on network arcs, unlabeled arcs carry one unit of flow. Panel (c) demonstrates the network structure, no flow is indicated.
However, we have to be careful here. First, we are compacting in vertical direction, so we cannot change the x-coordinates. If an edge has a double bend, it needs to have a horizontal expansion of at least two. Thus, we will not consider edges of length one as possible candidates for getting a double bend. Second, adding a double bend to e introduces two reflex corners, one in both adjacent faces of e. Two double bends may even cause an edge overlap, see Figure 5a. We need to ensure that the computed flow corresponds to a feasible drawing. Therefore, we treat each grid point along an edge that could be part of a double bend as a potential reflex corner, which we eliminate by dissecting. We now describe the algorithm in detail.
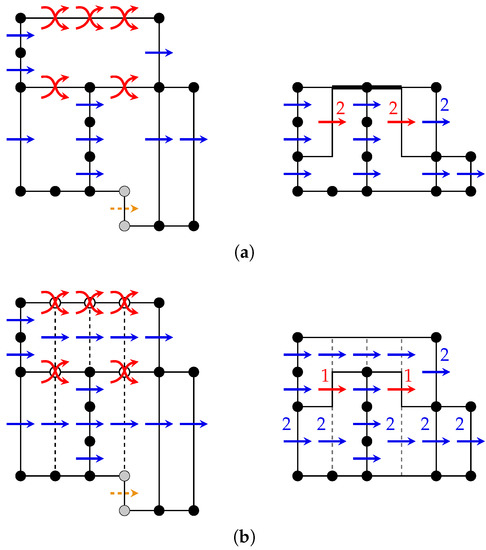
Figure 5.
Input graph with modified flow network and a minimum cost flow (all unlabeled arcs carry one unit of flow) with the resulting drawing: (a) without additional dissecting edges; and (b) including additional dissecting edges. The bold edge in (a) indicates an edge overlap and the grey vertices result from normalization, the white vertices in (b) are bend vertices. Dissecting edges are indicated in (b).
4.1. The Fled-Five Compaction Algorithm
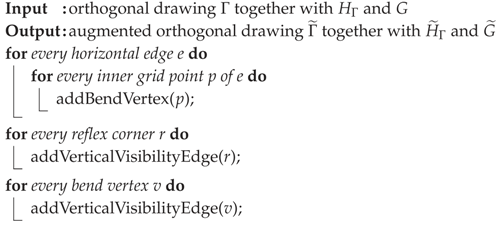
Our algorithm works in three phases: augmentation, computation of a minimum cost flow and transforming the flow into a new drawing. First we normalize to . Then, we split the horizontal edges of by placing an artificial bend vertex on every inner grid point of an horizontal edge. The bend vertices may later be transformed to double bends. After that we dissect as described in Section 3 and treat every bend vertex as a reflex corner in its adjacent faces (see Algorithm 1 and Figure 5b for an example). That means we may decompose the drawing in vertical stripes of unit length. Doing so, we solve both problems mentioned above. Since we consider only edges of length at least two, we guarantee that the edge will be long enough for a double bend and by inserting the visibility edges we keep the vertical separation of graph elements intact. This results in the extensions and and .
Observation 1.
After this augmentation, the number of vertices and edges in is , where and () is the height (width) of Γ.
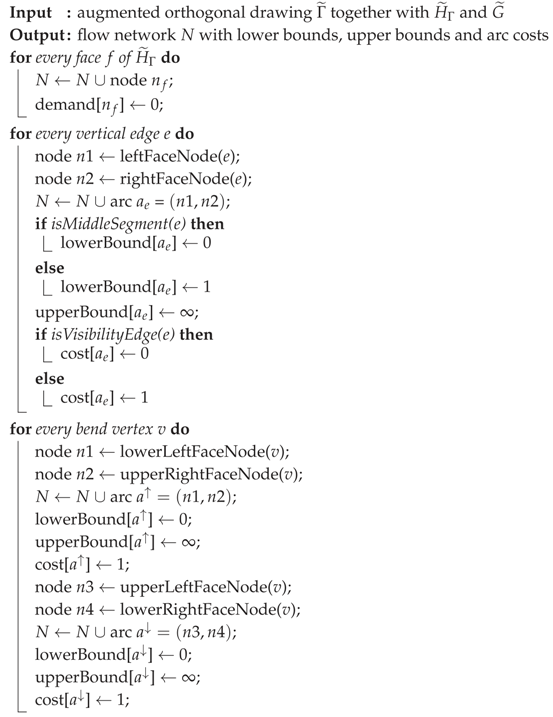
Next, we construct the network from Section 3.2. In addition to the already introduced arcs (straight blue arcs in Figure 5) ,we add two arcs and for every bend vertex v (curved, red arcs in Figure 5). Notice that every such bend vertex v has four adjacent faces, one at the lower and upper left and right. If it lies on the external face, two of the adjacent faces may coincide. Arc goes from the lower left face of v to its upper right face and goes from the upper left to the lower right face. Flow on one of these arcs will lead to a double bend in the edge segment of G that is split by v. The lower bound of these arcs is zero, the upper bound is set to infinity and the cost is one. For every edge that is a middle segment in G we decrease the lower bound of its arc to zero, since this is a vertical edge segment, that we may delete (dashed, orange arc in Figure 5). We call this network the vertical Fled-Five network (see Algorithm 2).
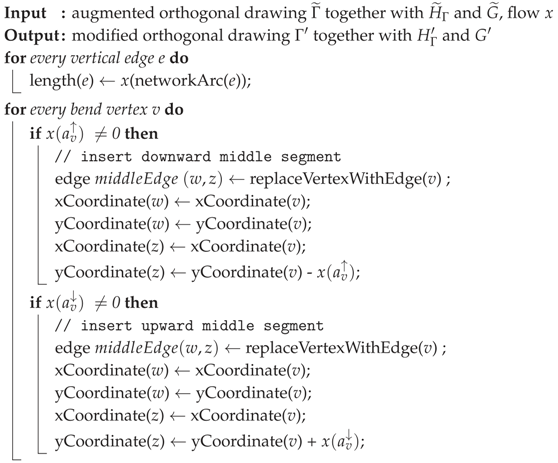
After computing a minimum cost flow in this network, we interpret the result in the following way: For every vertical edge e of , we translate the amount of flow on the arc of to the length of e. Let be an arc corresponding to a bend vertex v carrying k units of flow. Let e be the split horizontal edge and the x-coordinate of v. Then, e will start at its left endpoint in horizontal direction, bend downwards at x-coordinate , proceed for k units in y-direction and then continue to the right to its other endpoint. If we deal with an arc of the form , the corresponding edge will do an upward bend at . Let be an edge that corresponds to a middle segment and let be the corresponding arc. If carries no flow, we do not assign any vertical length to , hence the double bend to which belongs collapses (see Algorithm 3). Notice that flow on every non-zero-cost arc corresponds to vertical edge length. Theoretically, it is possible that both and carry flow in a feasible, but not optimal, solution. In this case, we can always augment the flow in a way that at most one of or carries flow. Finally, we remove all dummy edges and vertices. Figure 5 shows an example and Algorithm 4 summarizes the whole algorithm.
| Algorithm 1: verticalAugmentation |
 |
| Algorithm 2: verticalNetworkConstruction |
 |
| Algorithm 3: verticalLengthAssignment |
 |
| Algorithm 4: verticalFledFive |
| Input: orthogonal drawing Output: optimal solution to the Fled-Five compaction problem ← normalize(); ← verticalAugmentation(); N ← verticalNetworkConstruction(); x ← computeMinimumCostFlow(N); ← verticalLengthAssignment(, x); ← RemoveVisibilityEdges(); ← RemoveBendVertices(); |
Let us assume that the width and height of are bounded by the number of its vertices and bends. Otherwise, there would be a grid line without any vertex or bend on it. We can delete such grid lines iteratively until we reach our bound.
Theorem 1.
Let Γ be a planar grid drawing of a 4-graph G with an orthogonal representation . Let be the number of vertices and bends of Γ. Then, the vertical Fled-Five algorithm (Algorithm 4) takes time and solves the vertical Fled-Five compaction problem to optimality.
Proof.
Because of the visibility edges, we maintain visibility properties of . Every vertical edge segment of G that is not a middle segment gets a minimum length of one due to the lower bound of the corresponding arc in . Every bend vertex can safely be turned to a double bend if its corresponding arc carries flow, since we add visibility edges to the top and bottom of it. By this modification, we do not change the vertex star geometry of , because bend vertices are not part of G. Every middle segment can be removed if there is no flow on the corresponding arc. Because its edge has a horizontal expansion of at least two, e still have a proper length and due to the dissection phase visibility properties are maintained. This modification also does not affect the vertex star geometry of , since a middle segment is not adjacent to a vertex of G. Thus, every face will have a rectangular shape, no matter what modification we apply, and due to flow conservation every face and thus the entire graph is drawn consistently. Similar to Section 3.2, the length of vertical segments of is equal to the cost of the computed minimum cost flow. Since the initial drawing can be interpreted as a feasible flow, we get a drawing with total edge length less or equal to that of . The horizontal edge segments maintain their x-monotonicity, because we only add vertical segments to the drawing. Hence, the horizontal edge lengths and the x-coordinates of the vertices in stay the same. Because the minimum cost flow gives us a minimal vertical length assignment, we have an optimal solution for the vertical Fled-Five compaction problem.
For the running time, we first consider the augmentation phase. By Observation 1, we end up with vertices. For inserting dummy edges based on visibility properties, we can use a sweep-line algorithm that runs in time in our case. The construction of the flow network runs in linear time in the size of . For every face in the planar drawing we insert a node to the network, giving us network nodes. The number of arcs in the networks equals the sum of vertical edges and twice the number of bend vertices in , which is also . The coordinate assignment is done by traversing with a depth first search and interpreting the amount of flow as vertical length. Finally all non-original vertices and edges are removed from the drawing. The last two steps take time each. Therefore, we have a total running time of . ☐
4.2. Remarks on the Running Time
The running time depends highly on the number of added bend vertices. Thus, if we restrict the number of bend vertices to be linear, we can decrease the running time to .
The vertical Fled-Five network is not only bigger, in contrast to the traditional vertical compaction network, it is not planar. In Figure 6, we see a Fled-Five network with a -subdivision in it. This has also an effect on the asymptotical running time. Cornelsen and Karrenbauer [23] presented a algorithm for planar networks with n nodes that can be used in the classical vertical compaction algorithm. For general networks with n nodes and m arcs, the enhanced capacity scaling algorithm can be used that runs in time [24]. We have and this gives us the following corollary.
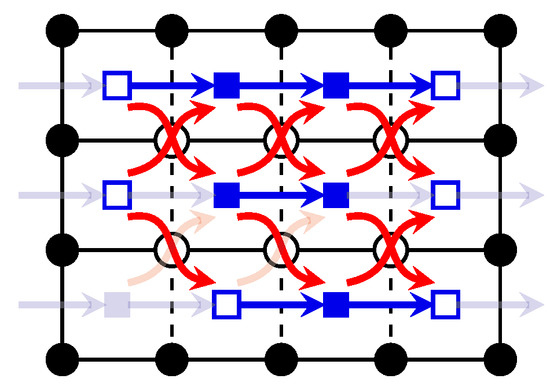
Figure 6.
subdivision in the modified network. Solid network nodes are the nodes of , empty network nodes correspond to subdivided edges.
Corollary 1.
The Fled-Five algorithm takes time in general and if the flow network is planar.
4.3. Controlling the Number of New Bends
Although the above compaction approach may reduce the total edge length, the number of bends in the resulting drawing may increase. A possible approach to control the number of new bends could be to bound the number of specific arcs used by a feasible flow. This is known as the binary case of the budget-constrained minimum cost flow problem for which Holzhauser et al. [25] showed strong NP-completeness even on bipartite graphs. It is defined as follows: Let be an instance of the minimum cost flow problem as we defined it in Section 3. Additionally, we have a budget and every arc has a usage fee . The binary total usage fee generated by a feasible flow x is defined as , where if and else. A minimum cost flow x that does not exceed the budget, i.e. , is called a budget-constrained minimum cost flow. An interpretation of this definition is that arcs of the network need to be bought in order to send flow over it.
We can extend the minimum cost flow instance for the Fled-Five problem in the following way. We replace the infinite upper bound of arcs and by a sufficiently big number M, e.g., twice the total edge length of the initial drawing , and we set , and for all other arcs. Let the budget F be the maximum number of bends we want to add to our drawing. Then, solving the budget-constrained minimum cost flow problem results in a new drawing with at most F additional bends and minimum vertical edge length with respect to the restriction of newly added bends.
Using a traditional minimum cost flow, we have no other control over the number of additional bends than restricting the number of bend vertices. Each such vertex can generate two new bends. By assigning higher cost to arcs and it becomes more unlikely for these arcs to carry much flow, but it does not limit its number used by the flow. It makes no difference in terms of total cost if we send, e.g., 10 units of flow over or one unit of flow over 10 such arcs, while the former produces two bends and the latter 20 bends.
4.4. Extensions to Other Models
While in a drawing model for 4-graphs a vertex occupies exactly one grid point, there are other models for drawing graphs with maximum degree greater four, e.g., the Kandinsky model [26]. In this model, vertices are placed on a coarse grid and edges run on a finer grid. All vertices have the same size, but are big enough to allow multiple edges to leave from the same side. Another way to handle high degree vertices is the Giotto model [27], where these vertices are drawn as boxes spreading over several grid points. In contrast to the Kandinsky model the sizes of the vertices can differ and their shape does not need to be quadratic. In the quasi-orthogonal model [28] edges are allowed to leave the grid around vertices. Incident edges of a high degree vertex can leave it in any, not necessarily orthogonal, direction to a near grid point, from where on they continue on the grid.
In the latter two models, high degree vertices are handled internally as faces of suitable size until the last step of actual drawing. Let v be a vertex with degree . Then, v is expanded to a face of size k and the edges incident to v are connected each to one of the k vertices of the new face. In the orthogonalization step, it is ensured that these faces admit a rectangular shape which is kept during traditional compaction. In the Giotto model, v will eventually occupy exactly the same space as . In the quasi-orthogonal model v is placed with normal vertex size in the middle of the corresponding face. Its incident edges are reconnected to v by drawing a straight line from the dummy vertex on the border of to v and the artificial face is deleted.
Our approach can be extended to these models in a straightforward way by prohibiting to add bend vertices to edges that participate in such faces during compaction. By doing so the shape of the edges will not change and the faces maintain their rectangular shape.
Although in the Kandinsky model this expansion of high degree vertices is not used, we can still model the vertices as quadratic faces in the same way and then apply our compaction algorithm as for the other two models.
5. Experimental Evaluation
In this section, we evaluate our algorithm FF focusing on the total edge length and area improvement. Klau et al. [14] compared 12 compaction heuristics that maintain the orthogonal representation and we chose the best of these traditional heuristics (t2fl in [14]), which we call TRAD, for comparison in order to demonstrate the benefit of slightly changing the orthogonal shape. In [14], this method was within one percent of the optimal value for practical instances. We do not compare against an optimal algorithm, e.g., the method of Klau and Mutzel [9], since the IP could not cope with most of our instances in a reasonable time. We refrain from comparing to improvement algorithms such as the 4M algorithm [15] or the refinement method from [16] since they change the vertex star geometry, the topology and even vertex sizes. The moving operation of the 4M algorithm is the only operation that fits our model, but would not change any layout generated by a flow-based compaction algorithm. The only applicable modification from [16] (superfluous bends) does not have an impact on bend minimal drawings that we use as input.
The algorithms were implemented in C++ using the OGDF library [29]. For both algorithms, we start with a bend minimal orthogonal representation. For TRAD, we apply a constructive compaction method, that transforms the orthogonal representation into a turn-regular one and then runs a flow-based coordinate assignment in order to get a feasible planar grid drawing. Then, we repeatedly apply horizontal and vertical compaction steps with a flow-based improvement method until no further improvement can be achieved, see heuristic t2fl in [14]. For FF, we use the same constructive method and then apply the modified flow technique from Section 4 with a cost of one for the network arcs causing double bends to achieve best possible shortening, also repeatedly in horizontal and vertical direction. Recall that, although both approaches are optimal for the one-dimensional compaction problems, repeated application of horizontal and vertical compaction steps does in general not lead to drawings with optimal total edge length for the two-dimensional compaction problems. Notice also that, due to the alternating repetitions in FF, the monotonicity of edge segments may no longer be maintained.
5.1. General Performance
We state the following hypotheses regarding the results of our new approach FF compared to those of TRAD:
Hypothesis 1.
The total edge length and therefore the area of the drawings will decrease.
Hypothesis 2.
The number of bends will rise significantly.
Hypothesis 3.
Although there will be many more dissecting edges, the running time will not increase drastically.
We also examine the influence on the maximum edge length. It is hard to predict the behaviour, because adding a double bend lengthens an edge, but may shorten other edges.
We tested our algorithm on six data sets.
| BICON | In total, 240 biconnected planar 4-graphs with 40–500 vertices, randomly generated with modified methods from OGDF. Starting with a triangle the graph is expanded by splitting edges or faces, maintaining 4-planarity. |
| QUASI | So-called quasi-trees which are known to be hard to compact optimally. They have already been used in the compaction literature (e.g., [14,30]). The set consists of 565 graphs with 40–2500 vertices. |
| ROME | The well-known Rome graphs introduced in [4] consists of about 11,000 real-world and real-world like graphs with 10–100 vertices. These graphs are widely used as benchmarks in various graph drawing experiments. |
| ROME4P | 4-planarized Rome graphs, i.e., we initially turned all Rome graphs into planar 4-graphs by planarizing them with methods from OGDF and replacing vertices with outgoing edges with faces of size k. This results in a graph size of up to 374 vertices. |
| IMDB | A movie collaboration data set of 1000 ego-networks of actors/actresses with 10–72 vertices [31]. |
| IMDB4P | A set of 4-planarized graphs of IMDB. Because the input graphs are very dense, we get graphs with over 10,000 vertices. Due to the very high running time for instances of this size, we selected a subset of 936 graphs that have at most 2500 vertices each. |
For QUASI, ROME and IMDB, we followed the Giotto model, see Section 4.4. The graphs are internally also 4-planarized before the orthogonalization step and therefore we have their expanded versions as input for the compaction phase.
All tests were run on an Intel Xeon E5-2640v3 2.6GHz CPU with 128 GB RAM. The input instances and the source code are available on https://ls11-www.cs.tu-dortmund.de/mutzel/compaction. Figure 7, Figure 8, Figure 9, Figure 10, Figure 11, Figure 12, Figure 13 and Figure 14 show the results.
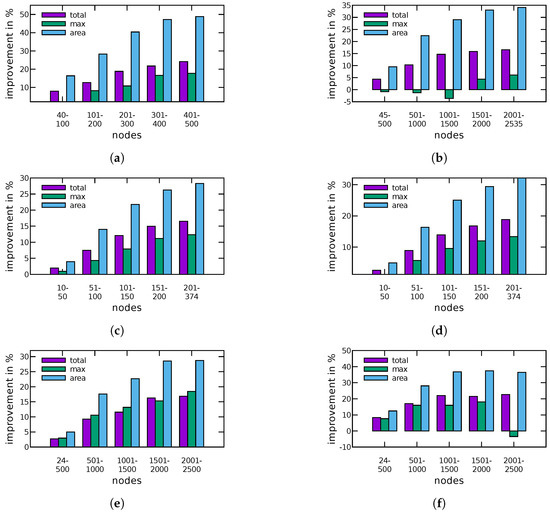
Figure 7.
Average change of the total edge length, the maximum edge length and the area from TRAD to FF in percent for: (a) BICON; (b) QUASI; (c) ROME; (d) ROME4P; (e) IMDB; and (f) IMDB4P.
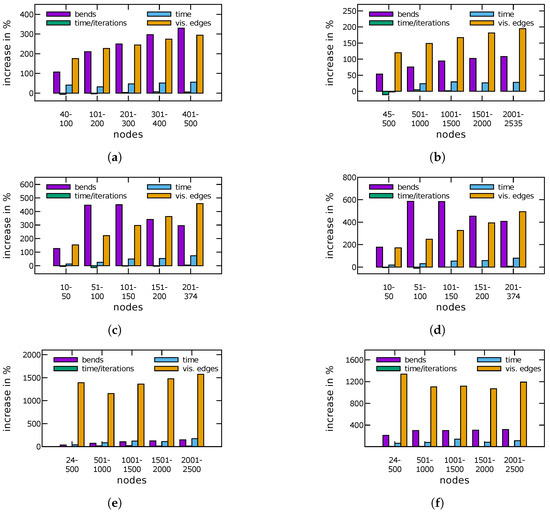
Figure 8.
Average change of the number of bends, the time per iteration, the total running time and the number of visibility edges from TRAD to FF in percent for: (a) BICON; (b) QUASI; (c) ROME; (d) ROME4P; (e) IMDB; and (f) IMDB4P.

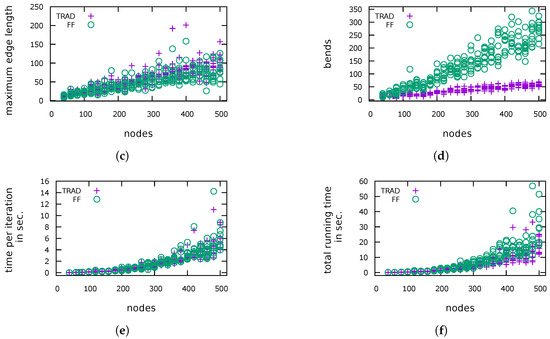
Figure 9.
Absolute results of TRAD and FF for BICON: (a) total edge length; (b) area; (c) maximum edge length; (d) number of bends; (e) time per iteration; and (f) total running time.
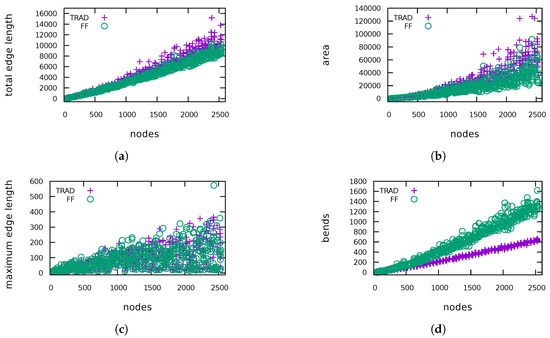

Figure 10.
Absolute results of TRAD and FF for QUASI: (a) total edge length; (b) area; (c) maximum edge length; (d) number of bends; (e) time per iteration; and (f) total running time.
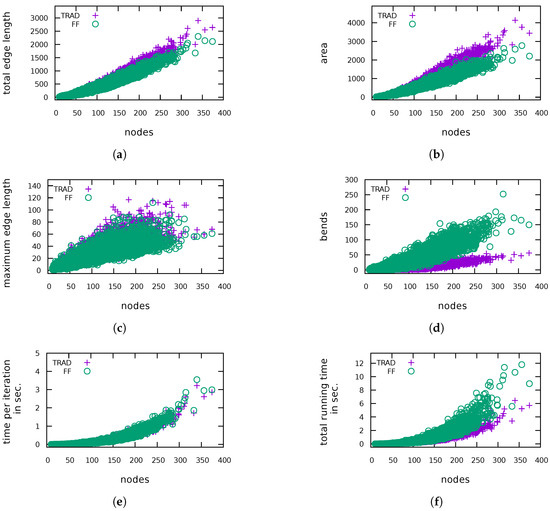
Figure 11.
Absolute results of TRAD and FF for ROME: (a) total edge length; (b) area; (c) maximum edge length; (d) number of bends; (e) time per iteration; and (f) total running time. The results for ROME4P are very similar.
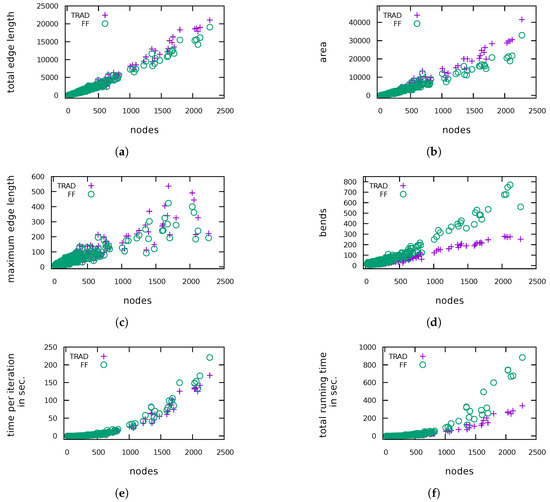
Figure 12.
Absolute results of TRAD and FF for the IMDB: (a) total edge length; (b) area; (c) maximum edge length; (d) number of bends; (e) time per iteration; and (f) total running time. The results for IMDB4P are very similar.

Figure 13.
Number of bends in the drawings produced by FF for: (a) ROME; and (b) QUASI. The plots for the other test sets show the same behaviour.


Figure 14.
Relation between additional bends and improvement of area (left) and total edge length (right) for: (a) BICON; and (b) IMDB4P.
(H1)Figure 7 shows the average decrease of the total and maximum edge length as well as of the area in percent. In all graph classes, the total edge length as well as the area has decreased. We were able to decrease the total edge length by up to 39.3% and the area by up to 66.6% (over all instances). In general, larger graphs allow a larger reduction. For five instances the total edge length and for 13 instances the area increased, which may be due to decisions of FF in early iterations that blocked further improvements in later iterations. It turned out that for the majority of the instances we were also able to reduce the maximum edge length. However, in general, the results are mixed, reaching from a shortening by 72.6% to more than tripling the length. Subfigures (a–c) in Figure 9, Figure 10, Figure 11 and Figure 12 show absolute values for the total edge length, the area and the maximum edge length measured for four of the six tested graph classes. The plots for ROME4P and IMDB4P are omitted, since they are very similar to those for ROME and IMDB.
(H2)Figure 8 displays the average increase of the number of bends. If an instance had no bends after TRAD, we use the number of bends after FF as relative increase to take also these instances into account for computing the average increase of bends. As expected, the drawings produced by FF have many more bends, especially for the Rome graphs. In one of the worst cases, the number of bends increased from 1 to 60. Although the relative increase of bends is very high, the average number of bends per edge in the drawings produced by FF ranges between 0 and 0.75 in comparison to at most 0.46 for drawings produced by TRAD. Recall that we have started with bend minimal orthogonal representations. Subfigure (d) in Figure 9, Figure 10, Figure 11 and Figure 12 show the absolute values for the number of bends measured for the test graphs. Figure 13 plots the relation between the number of bends and the number of edges for ROME and QUASI. The other graph classes show a similar behaviour.
(H3) We have measured the total running time and the number of performed compaction iterations. For better comparison, we also display the running time divided by the number of iterations, because FF tends to do more iterations. The reason is that a compaction step of FF changes the drawing and therefore the flow network of the next step more significantly, leading to more new possibilities for compaction. Figure 8 displays the average increase of the running time and the number of visibility edges. In all cases, the number of additional dissecting edges has increased significantly. In general, the running time per iteration for FF is very close to that for TRAD, but the running time per iteration has sometimes decreased, more often for small graphs. For ROME and ROME4P it even has gone down for clearly most of the instances. This effect can be explained by the fact that TRAD and FF have the same input only for the first iteration. They change the drawing in different ways resulting in different networks for the minimum cost flow problem in later iterations. Now, although the networks are bigger for FF, the network simplex algorithm may find an optimal solution faster here than in a smaller network. The highest decrease of the time per iteration was 62.1%. However, it also increased by 112.3% in the worst case. If we look at the total running time, we observe a clearer increase, but the times are still of roughly the same order of magnitude. Subfigures (e), (f) in Figure 9, Figure 10, Figure 11 and Figure 12 display the measured running time per iteration and the total running time, respectively.
The results support the hypotheses. Our new approach is able to improve the drawing area and the total edge length by introducing additional bends.
5.2. Reducing the Number of Additional Bends
As mentioned before, we cannot limit the number of bends added by FF. Figure 14 gives the relation between the number of invested bends and the improvement in terms of area and total edge length for BICON and IMDB4P. For some instances, the growth of the number of bends is very high. Therefore, we tried three different ways for controlling the number of additional bends and examined the impact on the resulting total edge length and area improvement. As a test set, we used the subset of the Rome graphs with 50–150 vertices (6294 graphs). These instances showed the greatest increase regarding the number of bends.
5.3. Increasing the Cost for New Bends
We decreased the likelihood to send flow over an arc of the form or by assigning higher costs to these arcs. As expected the number of new bends as well as the achieved improvement in terms of area and total edge length compared to TRAD decreases with increasing arc costs, see Figure 15a. With a slightly higher arc cost, we can reduce the number of additional bends without drastically affecting the area and total edge length improvement. The average relative increase of bends went down from 435.7% for an arc cost of one to 202.1% for an arc cost of two and 143.3% for an arc cost of three. The average improvement of area (total edge length) is 19.5% (10.7%), 17.1% (8.5%) and 15.0% (7.4%), respectively. The differences between higher arc costs in terms of additional bends become smaller. The data regarding the number of bends scatter over a wide range (notice the different scale on the right in Figure 15 for the change of bends).
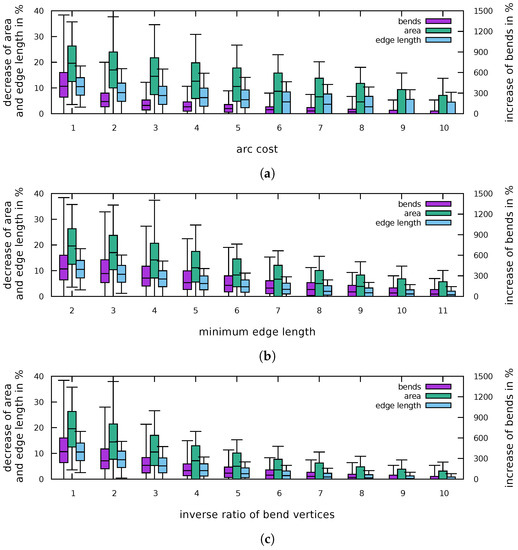
Figure 15.
Relative change of the number of bends (right y-scale) and area and total edge length (left y-scale) for a subset of the Rome graphs: (a) with increasing arc cost; (b) with increasing minimum length for edges to get bend vertices; and (c) with decreasing ratio of the length of an edge to the number of bend vertices on this edge. The whiskers cover 90% of the data, and no outliers are depicted for better readability.
5.4. Increasing the Minimum Length of an Edge to Get Bends
The intuition is that short edges do not have as much potential to change the orthogonal shape in a positive manner as long edges do. Therefore, we increased the minimum length of an edge to get bend vertices and by that to get bends. If an edge is shorter than the minimum length it gets no bend vertices at all. If its length is at least the minimum length, it gets bend vertices at every inner grid point. Figure 15b displays the relative increase of bends and the relative improvement of the total edge length and area with increasing minimum length. We observe a similar behaviour as for increasing arc cost, but the number of added bends does not reduce that fast. While the average relative increase of bends is 374.7% for a minimum edge length of three and 308.3% for a minimum length of four, the decrease of area (total edge length) is 17.1% (8.9%) and 14.4% (7.1%), respectively. For a minimum length of two, the values are the same as for an arc cost for bends of one, since this is the default value (remember that an edge of length one does never get any bend vertex at all). Again, with higher values for the minimum length the differences become smaller.
5.5. Decreasing the Ratio of Number of Bends To Edge Length
Not every bend vertex turns into an actual bend. We also observed that in some final drawings edges turned out to have a stair-like look, where one long additional segment would have had the same effect. This led us to the idea of adding fewer bend vertices on long edges. We did not add bend vertices on every inner grid point of an edge, but on every second, third and so on. The label i on the x-axis of Figure 15c means there is a bend vertex on every i-th inner grid point. A value of one means every inner grid point is equipped with a bend vertex. Again, we see a decrease of the number of added bends and a decrease of gained area and total edge length with higher values. The average relative increase of bends is 305.2%, if every second grid point gets a bend vertex, 215.5% for every third inner grid point. The average decrease of area (total edge length) is 15.0% (7.9%) and 11.3% (5.6%), respectively.
It turns out that increasing the cost of arcs that produce new bends is the most effective way of reducing the number of actually added bends. Even a cost of two is enough to halve the number of new bends on average, while not changing the area and total edge length improvement significantly. The other two methods get similar results regarding the area and total edge length for values close to the default value, but they invest more bends in general for that. This brings us to the assumption that bends in short edges also contribute to gaining area and total edge length and that the position of bend vertices is crucial.
Figure 16 shows four examples of varying improvement quality drawn with TRAD and FF, respectively.
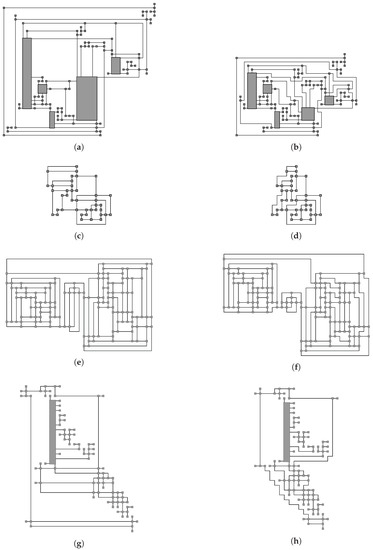
Figure 16.
(a,b) Rome graph with 97 vertices and 118 edges: (a) TRAD: total edge length 632, area 1326, bends 4; and (b) FF: total edge length 510, area 651, bends 46. (c,d) Biconnected graph with 40 vertices and 55 edges: (c) TRAD: total edge length 126, area 156, bends 7; and (d) FF: total edge length 110, area 120, bends 15. (e,f) The 4-planarized IMDB graph with 136 vertices and 221 edges: (e) TRAD: total edge length 548, area 570, bends 19; and (f) FF: total edge length 518, area 630, bends 39. (g,h) Quasi tree with 100 vertices and 118 edges: (g) TRAD: total edge length 305, area 720, bends 7; and (h) FF: total edge length 248, area 493, bends 33.
6. Conclusions
We have presented a new compaction model and an algorithm for orthogonal graph drawing that allows altering the orthogonal representation. We were able to reduce the total edge length and drawing area, but at the expense of additional bends. Unfortunately, in our model, we have only limited control over the number of bends added, but if the focus of interest lies on area and edge length, the results show a very positive effect. Future research could focus on studying the trade-off between bends and area or bends and total edge length as a bicriteria optimization problem.
Author Contributions
Conceptualization, M.J., P.M. and C.S.; Software, C.S.; Writing—original draft, M.J., P.M. and C.S.; and Writing—review and editing, M.J., P.M. and C.S.
Funding
This work was supported by the DFG under the project Compact Graph Drawing with Port Constraints (DFG MU 1129/10-1).
Acknowledgments
We would like to thank Gunnar Klau for providing some of the test instances and anonymous reviewers for helpful remarks on a previous version of this paper. We also gratefully acknowledge helpful discussions with Martin Gronemann, Sven Mallach, and Daniel Schmidt.
Conflicts of Interest
The authors declare no conflict of interest.
References
- Batini, C.; Nardelli, E.; Tamassia, R. A layout algorithm for data flow diagrams. IEEE Trans. Softw. Eng. 1986, SE-12, 538–546. [Google Scholar] [CrossRef]
- Tamassia, R. On Embedding a Graph in the Grid with the Minimum Number of Bends. SIAM J. Comput. 1987, 16, 421–444. [Google Scholar] [CrossRef]
- Patrignani, M. On the Complexity of Orthogonal Compaction. In Algorithms and Data Structures, 6th International Workshop, WADS ’99; Springer: Berlin, Germany, 1999; Volume 1663, pp. 56–61. [Google Scholar] [CrossRef]
- Di Battista, G.; Garg, A.; Liotta, G.; Tamassia, R.; Tassinari, E.; Vargiu, F. An Experimental Comparison of Four Graph Drawing Algorithms. Comput. Geom. 1997, 7, 303–325. [Google Scholar] [CrossRef]
- Lengauer, T. Combinatorial Algorithms for Integrated Circuit Layout; John Wiley & Sons, Inc.: New York, NY, USA, 1990. [Google Scholar]
- Bannister, M.J.; Eppstein, D.; Simons, J.A. Inapproximability of Orthogonal Compaction. J. Graph Algorithms Appl. 2012, 16, 651–673. [Google Scholar] [CrossRef]
- Di Battista, G.; Eades, P.; Tamassia, R.; Tollis, I.G. Graph Drawing: Algorithms for the Visualization of Graphs; Prentice-Hall: Upper Saddle River, NJ, USA, 1999. [Google Scholar]
- Bridgeman, S.S.; Di Battista, G.; Didimo, W.; Liotta, G.; Tamassia, R.; Vismara, L. Turn-regularity and optimal area drawings of orthogonal representations. Comput. Geom. 2000, 16, 53–93. [Google Scholar] [CrossRef]
- Klau, G.W.; Mutzel, P. Optimal Compaction of Orthogonal Grid Drawings. In International Conference on Integer Programming and Combinatorial Optimization; Cornuéjols, G., Burkard, R.E., Woeginger, G.J., Eds.; Springer: Berlin, Germany, 1999; Volume 1610, pp. 304–319. [Google Scholar] [CrossRef]
- Kaufmann, M.; Wagner, D. (Eds.) Drawing Graphs, Methods and Models; Springer: Berlin, Germany, 2001; Volume 2025. [Google Scholar]
- Dai, W.; Kuh, E. Global spacing of building-block layout. In Proceedings of the IFIP TC 10/WG 10.5 International Conference on Very Large Scale Integration, Vancouver, BC, Canada, 10–12 August 1987; pp. 193–205. [Google Scholar]
- Eiglsperger, M.; Kaufmann, M. Fast Compaction for Orthogonal Drawings with Vertices of Prescribed Size. In Proceedings of the Graph Drawing, 9th International Symposium, GD 2001, Vienna, Austria, 23–26 September 2001; Revised Papers. pp. 124–138. [Google Scholar] [CrossRef]
- Hashemi, S.M.; Tahmasbi, M. A better heuristic for area-compaction of orthogonal representations. Appl. Math. Comput. 2006, 172, 1054–1066. [Google Scholar] [CrossRef]
- Klau, G.W.; Klein, K.; Mutzel, P. An Experimental Comparison of Orthogonal Compaction Algorithms. In International Symposium on Graph Drawing; Marks, J., Ed.; Springer: Berlin, Germany, 2001; Volume 1984, pp. 37–51. [Google Scholar] [CrossRef]
- Fößmeier, U.; Heß, C.; Kaufmann, M. On Improving Orthogonal Drawings: The 4M-Algorithm. In International Symposium on Graph Drawing; Whitesides, S., Ed.; Springer: Berlin, Germany, 1998; Volume 1547, pp. 125–137. [Google Scholar] [CrossRef]
- Six, J.M.; Kakoulis, K.G.; Tollis, I.G. Refinement of Orthogonal Graph Drawings. In International Symposium on Graph Drawing; Whitesides, S., Ed.; Springer: Berlin, Germany, 1998; Volume 1547, pp. 302–315. [Google Scholar] [CrossRef]
- Spönemann, M.; Fuhrmann, H.; von Hanxleden, R.; Mutzel, P. Port Constraints in Hierarchical Layout of Data Flow Diagrams. In International Symposium on Graph Drawing; Eppstein, D., Gansner, E.R., Eds.; Revised Papers; Springer: Berlin, Germany, 2010; Volume 5849, pp. 135–146. [Google Scholar] [CrossRef]
- De Mendonça Neta, B.M.; Araújo, G.H.D.; Guimarães, F.G.; Mesquita, R.C.; Ekel, P.Y. A fuzzy genetic algorithm for automatic orthogonal graph drawing. Appl. Soft Comput. 2012, 12, 1379–1389. [Google Scholar] [CrossRef]
- Freivalds, K.; Glagolevs, J. Graph Compact Orthogonal Layout Algorithm. In Proceedings of the Combinatorial Optimization—Third International Symposium, ISCO 2014, Lisbon, Portugal, 5–7 March 2014; Revised Selected Papers. pp. 255–266. [Google Scholar] [CrossRef]
- Tamassia, R. (Ed.) Handbook on Graph Drawing and Visualization; Chapman and Hall/CRC: Boca Raton, FL, USA, 2013. [Google Scholar]
- Ahuja, R.K.; Magnanti, T.L.; Orlin, J.B. Network Flows: Theory, Algorithms, and Applications; Prentice-Hall, Inc.: Upper Saddle River, NJ, USA, 1993. [Google Scholar]
- Király, Z.; Kovács, P. Efficient implementations of minimum-cost flow algorithms. Acta Univ. Sapientiae Inform. 2012, 4, 67–118. [Google Scholar]
- Cornelsen, S.; Karrenbauer, A. Accelerated Bend Minimization. J. Graph Algorithms Appl. 2012, 16, 635–650. [Google Scholar] [CrossRef]
- Orlin, J.B. A Faster Strongly Polynominal Minimum Cost Flow Algorithm. In Proceedings of the 20th Annual ACM Symposium on Theory of Computing, Chicago, IL, USA, 2–4 May 1988; pp. 377–387. [Google Scholar] [CrossRef]
- Holzhauser, M.; Krumke, S.O.; Thielen, C. Budget-constrained minimum cost flows. J. Comb. Optim. 2016, 31, 1720–1745. [Google Scholar] [CrossRef]
- Fößmeier, U.; Kaufmann, M. Drawing High Degree Graphs with Low Bend Numbers. In International Symposium on Graph Drawing; Brandenburg, F., Ed.; Springer: Berlin, Germany, 1995; Volume 1027, pp. 254–266. [Google Scholar] [CrossRef]
- Tamassia, R.; Di Battista, G.; Batini, C. Automatic graph drawing and readability of diagrams. IEEE Trans. Syst. Man Cybern. 1988, 18, 61–79. [Google Scholar] [CrossRef]
- Jünger, M.; Klau, G.W.; Mutzel, P.; Weiskircher, R. AGD—A Library of Algorithms for Graph Drawing. In Graph Drawing Software; Springer: Berlin, Germany, 2004; pp. 149–172. [Google Scholar] [CrossRef]
- Chimani, M.; Gutwenger, C.; Jünger, M.; Klau, G.W.; Klein, K.; Mutzel, P. The Open Graph Drawing Framework (OGDF). In Handbook of Graph Drawing and Visualization; Tamassia, R., Ed.; CRC Press: Boca Raton, FL, USA, 2013; Chapter 17; pp. 543–569. [Google Scholar]
- Klau, G.W. A Combinatorial Approach to Orthogonal Placement Problems. Ph.D. Thesis, Saarland University, Saarbrücken, Germany, 2002. [Google Scholar] [CrossRef]
- Yanardag, P.; Vishwanathan, S.V.N. Deep Graph Kernels. In Proceedings of the 21th ACM SIGKDD International Conference on Knowledge Discovery and Data Mining, Sydney, Australia, 10–13 August 2015; pp. 1365–1374. [Google Scholar] [CrossRef]
© 2018 by the authors. Licensee MDPI, Basel, Switzerland. This article is an open access article distributed under the terms and conditions of the Creative Commons Attribution (CC BY) license (http://creativecommons.org/licenses/by/4.0/).