
A Benchmarking Analysis of Open-Source Business Intelligence Tools in Healthcare Environments


Abstract
:1. Introduction
2. Background and Related Work
2.1. Business Intelligence
2.2. Examples of Application of BI Tools in Healthcare Environments
- Turin ASL 3, which is a system developed in conjunction with the open-source Spago BI that allows the assignment of permissions for use according to the different types of users. It provides analytical documents, enables the data visualization, and also allows the use of the Online Analytical Processing (OLAP) technology. This solution is implemented in local healthcare institutions and the Italian National Health Service. Turin ASL 3 was born in 1995 and is implemented in two hospitals in the city of Turin (Amadeo di Savoia and Maria Vittoria), Italy [20];
- St Antonius is an application developed by Pentaho BI Suite, built in order to analyze the waiting times of patients. The main advantages of this application are the improvement of operational efficiency, elimination of costs resulting from the creation of manual reporting, behavioral analysis, and the identification of patterns and risk analysis. This application has been implemented in the St. Antonius Hospital, located in Nieuwegein, Netherlands [21].
2.3. Case Study—Context
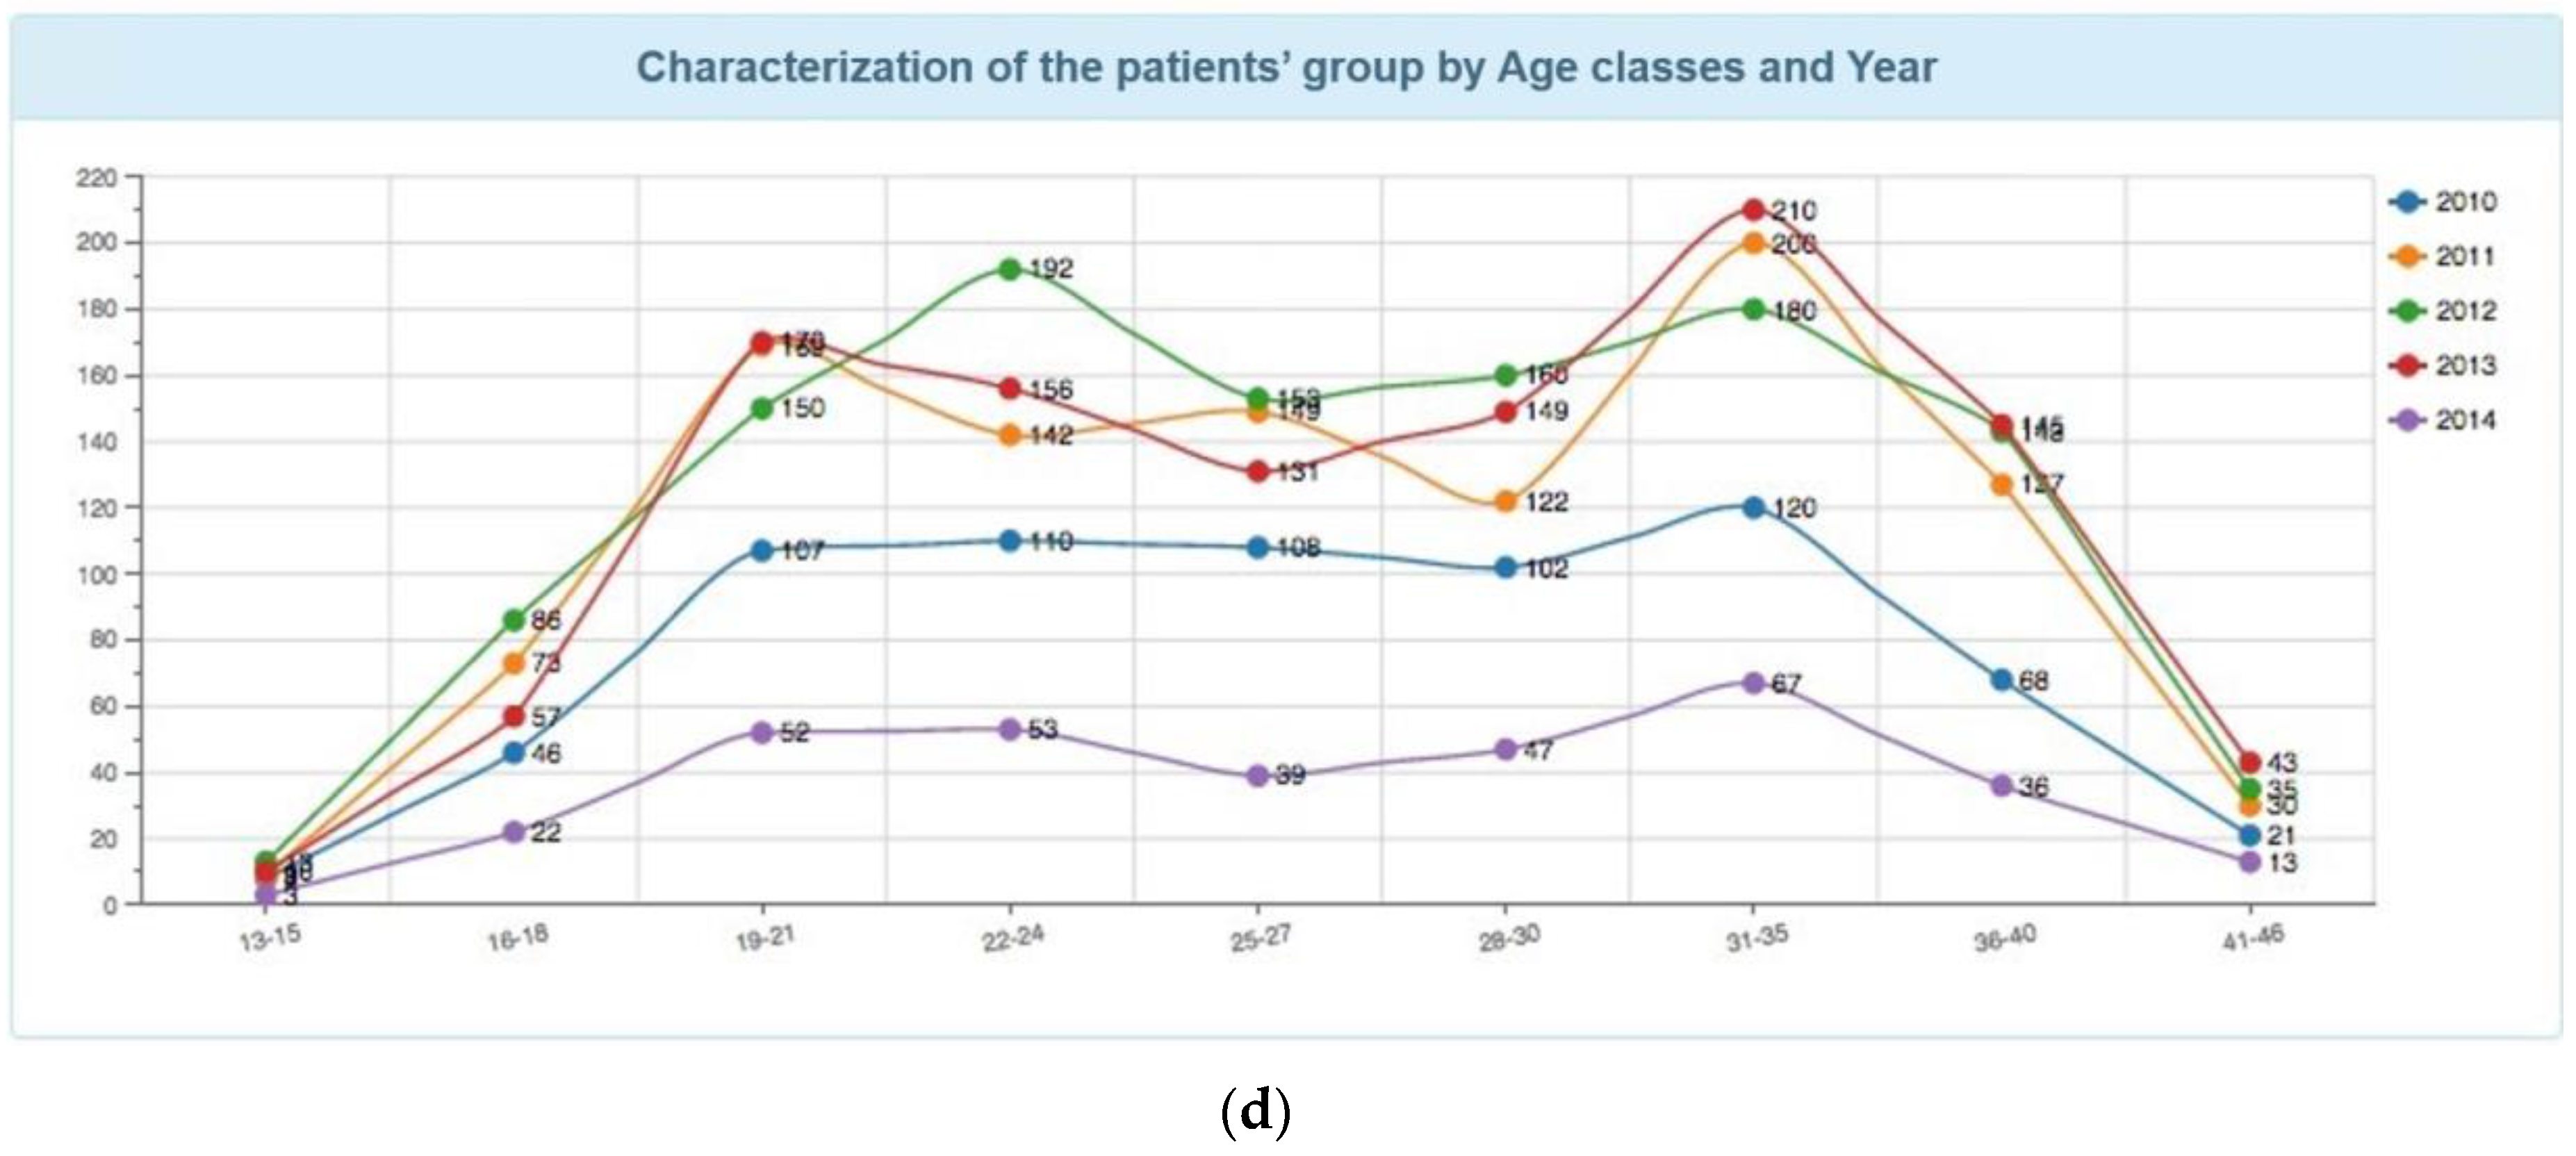
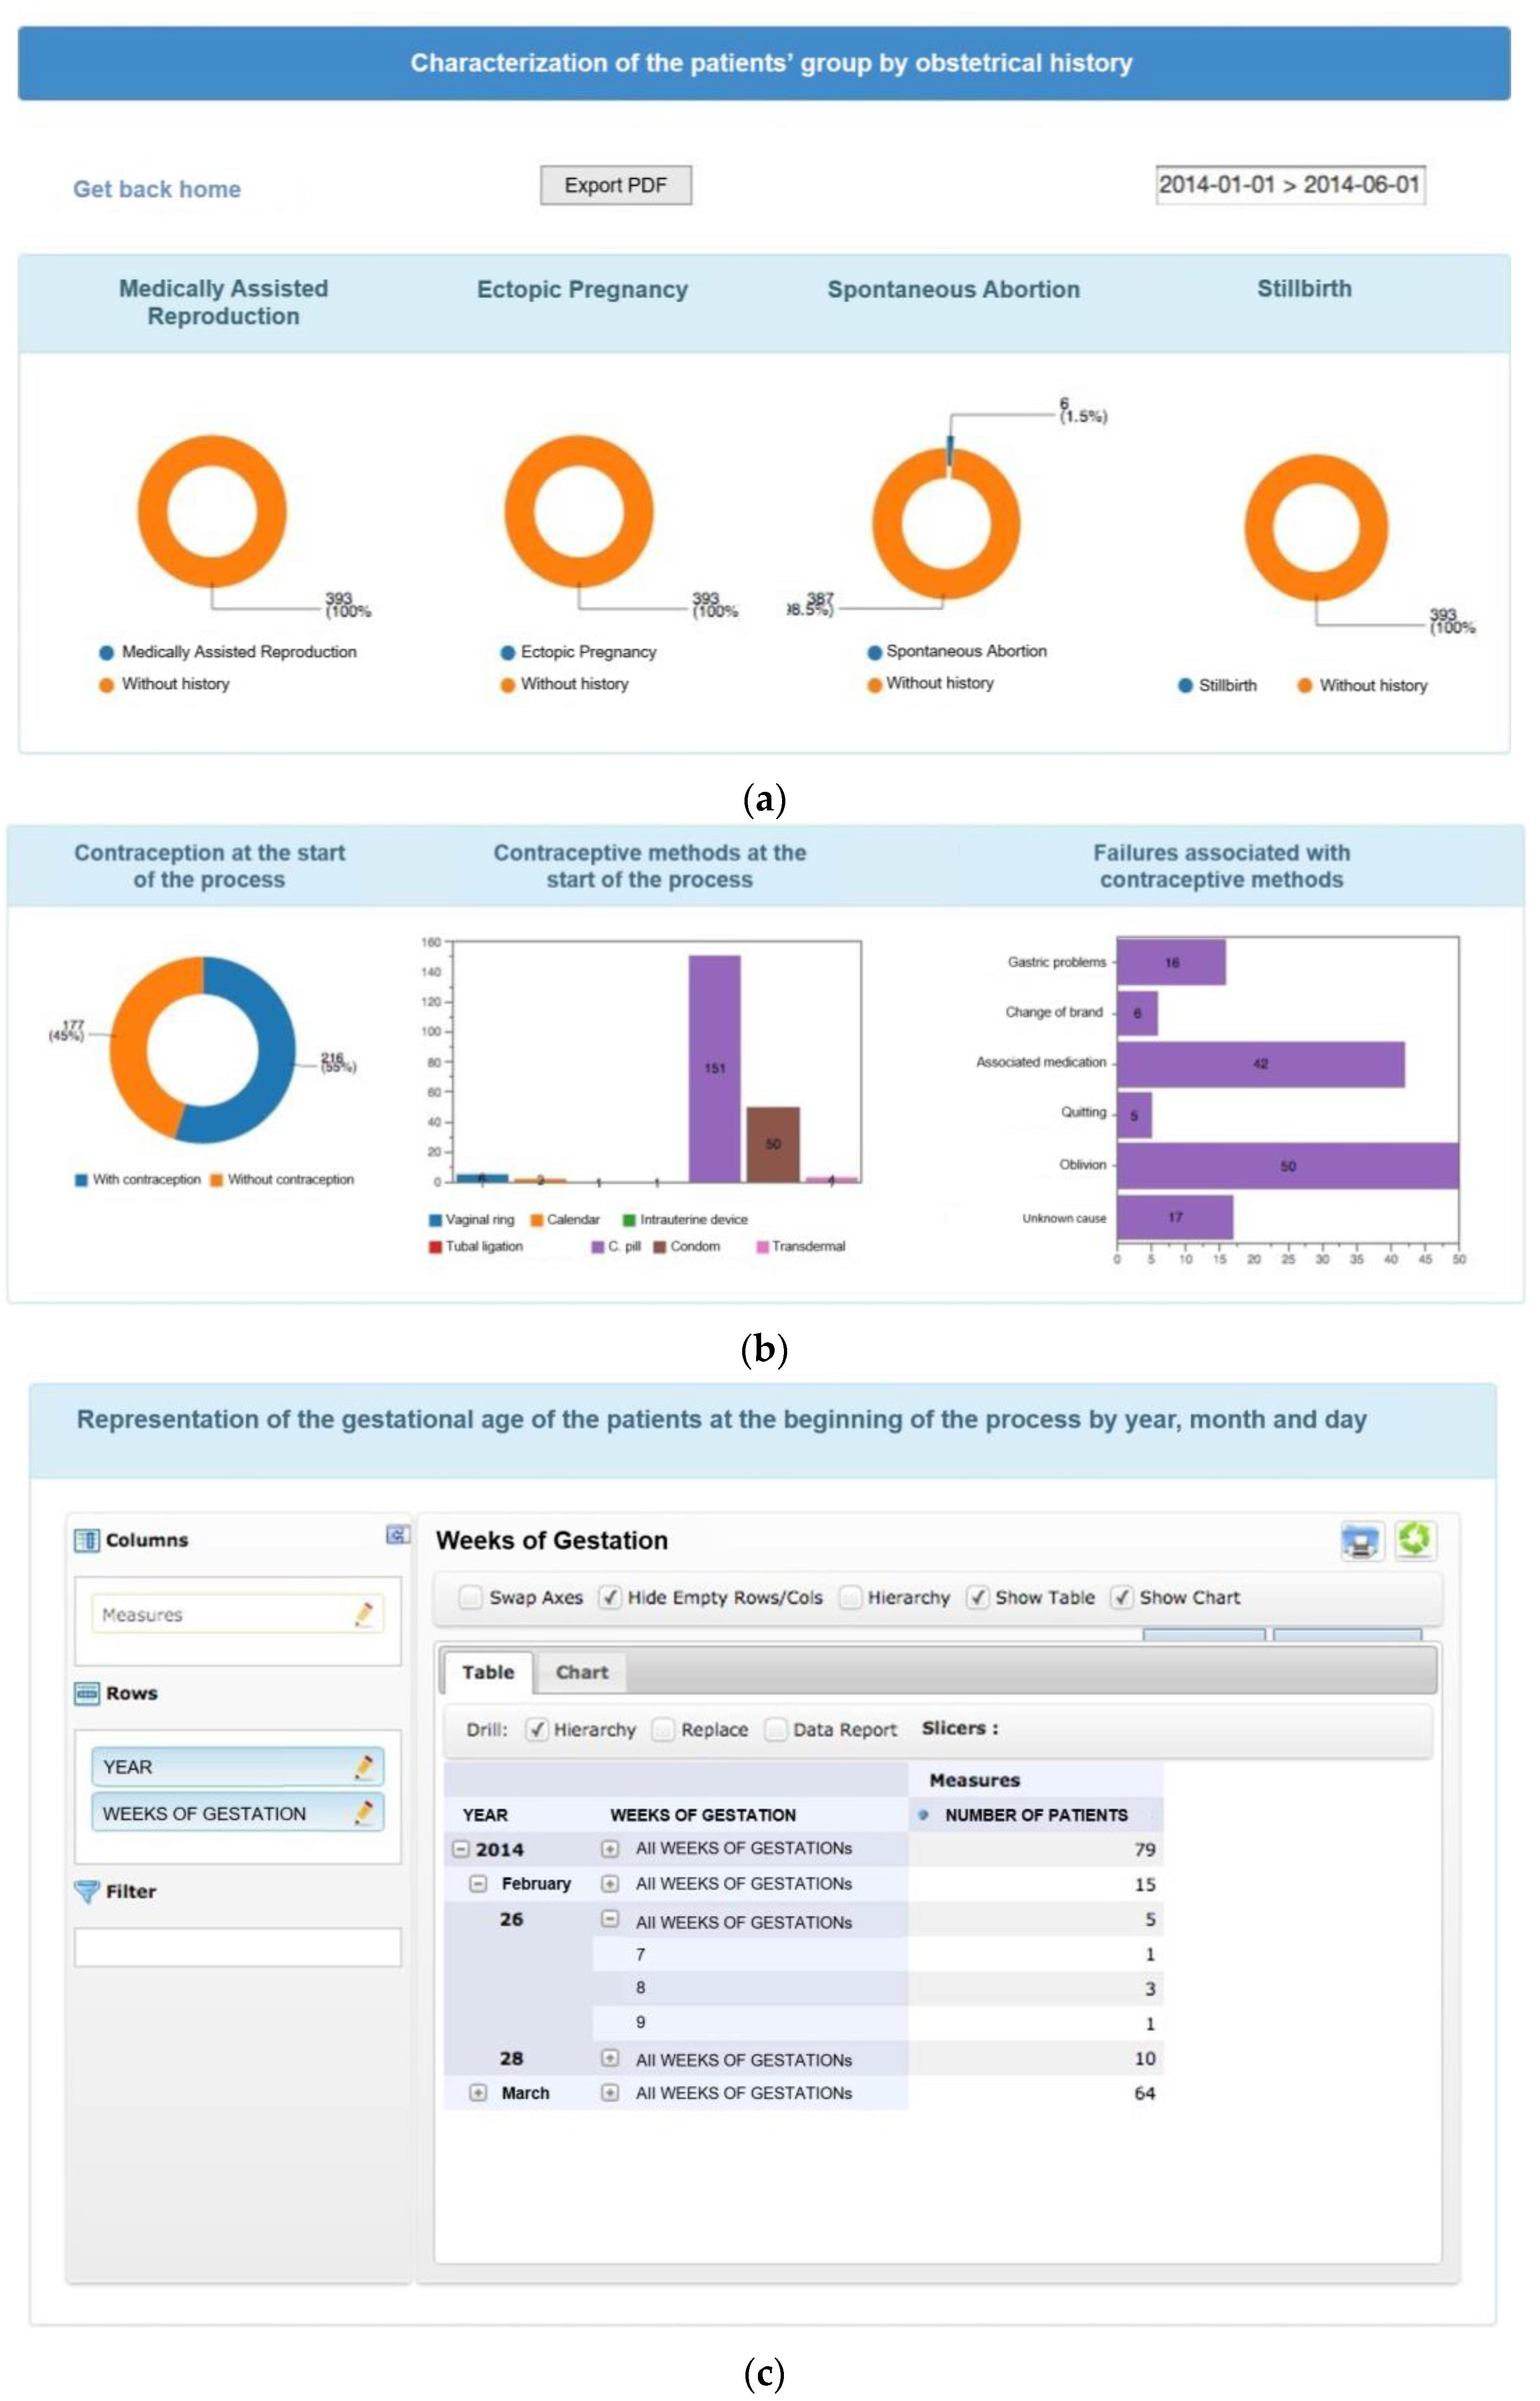
- Characterization of the patient group by number of pregnancies and by date;
- Characterization of the patient group by number of children and by date;
- Characterization of the patient group by number of previous VIP experiences and by date;
- Characterization of the patient group concerning the revision consultation for date;
- Characterization of the patient group based on contraception early in the process by date.
3. Applications of Open-Source BI Tools in Healthcare
4. Tool Requirements in Healthcare Environments
- Performance: assesses whether the tool has good performance in query processing with a high volume of data. In the healthcare sector, it is important that the performance is good, since it is an area where decisions have a major impact on the lives of human beings and sometimes need to be made in a very short period of time.
- Online Analytical Processing ad hoc queries: evaluate if the tool allows the user to have the freedom to define queries, which he considers appropriate in a given context. OLAP allows the users to perform ad hoc analyses on the data, considering multiple dimensions and providing the necessary information for an even more efficient decision-making process. This technique allows the analysis of the document’s history, and the use of operations such as the roll-up, drill-down, slice and dice, and pivot. In the healthcare sector, the process of analyzing historical clinical data is very important, since it allows the visualization of the patient and service evolution over time. Thus, this technique is essential in a BI system.
- Architecture: assesses whether or not the tool implements a Data Warehouse (DW) and OLAP architectures with high scalability, i.e., capable of processing information evenly, even if the load is increasing.
- Display of Key Performance Indicators (KPIs): assesses whether or not the tool provides visualization of the KPIs of the organization. These indicators can be clinical or management ones.
- Plug-ins: assess whether or not the tool allows the development and use of plug-ins that add functionality to it.
- Interactive visualization of data: assesses whether or not the tool allows interactivity between the user and dashboards, reports, and graphs. This is a very important characteristic since interactivity is appealing to the user, and also facilitates the understanding of the information demonstrated.
- Documentation: assesses the quality of the documentation given by the tool. This feature is very important for the programmer who develops the application since the installation process is sometimes a complicated procedure that requires documentation.
- Dashboards: assess whether or not the tool supports the development of dashboards, enabling the integration of graphics, tables, and other analyses such as OLAP and DM.
- Navigation Features: assess whether or not the tool enables the creation of reports, using roll-up, drill-down, slice and dice, and pivot operations.
- Extract, Transform, and Load (ETL): steps of the BI process responsible for the extraction, transformation, and loading of data by creating procedures incorporated into the tool.
- Connection to the database: it is very important that the BI tool enables a connection to be established to different databases so that it is possible to integrate information from different data sources. There are tools where the only possibility of connection is inherent to data visualization, others in which the connection can be made via the ETL process and via data display, and, lastly, those in which the connection is made only via the ETL process. In a hospital, this is also a key feature because, normally, these organizations have interoperable systems, and it is common to have different databases with clinical information. Thus, in order to facilitate the construction of the data warehouse (DW), we must choose a specific tool for the construction of the DW and, subsequently, a tool of BI is used to create OLAP cubes in order to visualize performance indicators.
- Integration of dimensional model: evaluates whether or not the BI tool allows the integration of a DW dimensional model.
- Open-source: assesses whether or not the tool presents a development model for which, besides being free, the source code is completely available for users to visualize, modify, and redistribute without restrictions placed by the owner of the product.
- Export: assesses whether or not the tool allows export to other formats such as PDF, HTML, spreadsheets, and others.
- Pervasive: assesses whether or not the free version of the tool provides a server that allows the development of a web application, which can be opened in a browser, or a mobile application that can be installed on different mobile devices and send alerts, and other pervasive data or healthcare characteristics [27]. If the tool has this feature, it is not necessary to install the application on all the computers in the organization, but only on a server, with all computers connected to the organization network able to access the web application. In a hospital, this feature is very important because, besides the reduction of costs in the application installation process, it also allows a reduction in the time spent, which is very important in the healthcare sector. Specifically, in the Centro Hospitalar do Porto (CHP), this aspect is also very important for the development of BI applications, as once the BI system is integrated into the AIDA it enables interoperability in all the constituents of the organization. Thus, pervasiveness is implemented in this context, so that the information is distributed to all the users of the organization and is not just focused at the top of the organizational pyramid.
- Online Help: assesses whether or not the tool provides the online help resources.
- Support for mobile devices: assesses whether or not the tool supports the use of mobile devices, which can be quite useful in a healthcare organization, in that health professionals are then able to access information by other means than a computer.
- Data Mining: evaluates whether or not the tool provides the ability to use data to predict chosen outcomes as clinical situations or behavior patterns.
- Ease of Use: assesses the ease with which a non-experienced user is able to identify and to find the tools’ features, as well as how easy it is to perform them.
- Attractiveness: assesses the degree of a tool’s interface attractiveness.
- Customization of the interface: identifies if the tool allows customization of the interface by the administrator.
- User Profile: verifies whether or not the tool allows the administrator to set hierarchies by assigning different permissions to different system users.
- Real-time: it is an approach to data analysis that allows users to access the application and the information in real time. This is an important feature in healthcare organizations because it is crucial that health professionals are able to access current data to support the decision-making process. It includes real-time data processing (ETL) and dashboard updates.
5. Business Intelligence Tools—Benchmarking
5.1. QlikView
5.2. Palo BI Suite
- Palo OLAP Server is a multidimensional OLAP in-memory (Molap). The data are stored and then organized into cubes, dimensions, elements, and element attributes. Compared with Rolap (Relational OLAP), the Molap has the potential to be 100 times faster. A simple Palo cube can contain data from multiple data sources, which simplifies the analysis of data from different data sources, for example, the comparison of actual and predicted data collection. Users can import data that rises incrementally, from any data source that Palo get access to, and stores them in the structure defined by them. The way that the tables are listed in the database is not relevant, since this architecture is defined in the software itself.
- Palo Excel Add-in allows a connection to Excel via a centralized and multidimensional database such as the Palo OLAP server, making it a highly sophisticated BI tool.
- Palo Worksheet Server provides a complete reporting and analysis Web-based system that can be maintained by the users. The reports can be created and published to the web, and a flexible and secure content management is provided. Since it is quite similar to Excel, users can easily adapt to this tool by creating reports in the same way as in Excel. However, the resulting calculation sheets are automatically updated when the databases are changed, e.g. when new data is added to a dimension.
- Palo ETL Server supports the ETL process. Palo is equipped for the extraction of large quantities of data from a wide range of data sources. The ETL server is not limited to load the Palo OLAP Server, but is also adapted to the specific needs of the import and export of data to and from Palo models.
5.3. Jaspersoft BI
- Jaspersoft iReport Designer is the report designer for JasperReports and JasperReports Server. It enables the creation of sophisticated layouts with graphics, images, and tables. It also allows access to data via JDBC, TableModels, JavaBeans, XML, Hibernate, CSV, and custom sources. On the other hand, reports can be exported in PDF, RTF, XML, XLS, CSV, HTML, DOCX, or OpenOffice formats.
- Jaspersoft Studio has the same functionality as the Jaspersoft iReport Designer, differing only in that it is based on Eclipse.
- JasperReports Library is an open-source reporting engine, fully written in Java, that can use data from any data source and produce pixel-perfect documents that can be viewed, printed, or exported in a variety of document formats.
- JasperSoftReports Server is a reporting server allowing access to reports and analysis that can be incorporated into a web page or a mobile application, and providing real-time information, which is scheduled for a browser, mobile device, printer, or e-mail inbox in a great variety of file formats. It is optimized to share, protect, and centrally manage their Jaspersoft reports and analytical views.
- Jaspersoft OLAP is a powerful environment for data analysis that can be accessed through an intuitive user interface, designed for the analysis of large volumes of datasets and to perform complex analytical queries. Consisting of an OLAP engine, this tool provides an interactive environment for users to perform slice and dice, pivot, and filter operations and to summarize data in real time through a web-based interface or MS Excel.
- Jaspersoft ETL is a simple deployment and running of the ETL process in many external systems. It is used to extract data from the transactional system, to create a data warehouse or data mart, and for creating reports or analysis.
5.4. Tableau Public
5.5. Spago BI
- Spago BI server corresponds to the main module of this software. It offers all the core and analytical capabilities of the application.
- Spago BI studio is a development environment based on Eclipse. It allows the user to design and modify all the analysis documents such as reports, OLAP, dashboards, and DM. The interaction between this module and the Spago BI server is possible due to the Spago BI SDK module.
- Spago BI Meta is a module oriented towards the management of metadata and search. The platform manages the metadata, allowing the user to edit and import from external tools such as ETL. This module enriches the knowledge base of metadata from Spago BI server, so that they can be easily queried through available tools, such as OLAP.
- Spago BI SDK is the specific tool used to integrate services provided by the server. Specifically, it is used by Spago BI Studio so that the users can download/upload the analysis of documents to/from the server. This module allows the integration of documents, due to a wide range of services available through a Web service, and the publishing of documents Spago BI on an external portal.
- Spago BI Applications is a collection of analytical models developed using Spago BI. These models are developed taking into consideration the sector of the market and the purpose or the end product, such as analytical specific component.
5.6. Pentaho BI Suite
- Pentaho BI Platform provides various services to end users, such as subscriptions scheduling, reporting and integration tools, and incorporated centralized security.
- Pentaho Reporting allows the easy development of a report, enabling organizations to access, format, and distribute information. This module contains all the graphical features for the construction of reports as well as ad hoc queries.
- Pentaho Analysis provides an OLAP analysis, supporting the users in the decision-making process. The Pentaho Analysis facilitates the interactive exploration of information through the intersection of data, in addition to providing a complete integration with other services available in the Pentaho BI Suite, via plugins.
- Pentaho Data Integration is a powerful tool for ETL process using an innovative, metadata-driven approach.
- Community Edition Dashboard provides a graphical environment allowing users access to critical information essential to the understanding and optimization of organizational performance. Complete integration with Pentaho Reporting and Pentaho Analysis is possible.
- Weka Pentaho Data Mining enables a predictive analysis, providing information about hidden patterns and relationships between data, as well as performance indicators. This module provides a graphical interface for pre-processing of data, classification, regression, clustering, rules association, and visualization.
6. Business Intelligence Tools—Assessment Process
7. Business Intelligence Tools—Assessment Results
- Must Have: 5 + 5 + 5 + 4 = 19;
- Administrator: (2 + 3 + 4 + 5) × 0.05 = 0.7;
- End-user: (5 + 4 + 5 + 0 + 4) × 0.25 = 4.5;
- Technologies: (5 + 4 + 3) × 0.3 = 3.6;
- Other Important: (4 + 5 + 5 + 5 + 5) × 0.25 = 6;
- Data Processing: (5 + 1) × 0.15 = 0.9.
8. Case Study Application
9. Conclusions
Acknowledgments
Author Contributions
Conflicts of Interest
References
- Janamanchi, B.; Katsamakas, E.; Raghupathi, W.; Gao, W. The State and Profile of Open Source Software Projects in health and medical informatics. Int. J. Med. Inform. 2009, 78, 457–472. [Google Scholar] [CrossRef] [PubMed]
- Waring, T.; Maddocks, P. Open Source Software implementation in the UK public sector: Evidence from the field and implications for the future. Int. J. Inf. Manag. 2005, 25, 411–428. [Google Scholar] [CrossRef]
- Ishola, M.D. Healthcare Business Intelligence: The Case of University’s Health Center. Master’s Thesis, Universiti Utara Malaysia, Kedah, Malaysia, 30 July 2011. [Google Scholar]
- Bernardino, J. Open Source Business Intelligence Platforms for Engineering Education. In Proceedings of the 1st World Engineering Education Flash Week, Lisbon, Portugal, 27–30 September 2011.
- Brandão, A.; Pereira, E.; Portela, F.; Santos, M.F.; Abelha, A.; Machado, J. Predicting risk pregnancy in maternity care using data mining. In Proceedings of the 7th International Conference on Agents and Artificial Intelligence, Lisbon, Portugal, 10–12 January 2015.
- Canada Health Infoway. Available online: https://www.infoway-inforoute.ca/en/ (accessed on 10 July 2016).
- QlikView. Available online: http://www.qlik.com/ (accessed on 12 October 2016).
- Jedox. Available online: http://www.jedox.com/ (accessed on 12 October 2016).
- Jaspersoft. Available online: https://www.jaspersoft.com/ (accessed on 12 October 2016).
- Tableau Public. Available online: http://www.tableausoftware.com/public/ (accessed on 12 October 2016).
- Spagobi. Available online: http://www.spagobi.org/ (accessed on 12 October 2016).
- Pentaho. Available online: http://www.pentaho.com/ (accessed on 12 October 2016).
- Completo, J.; Cruz, R.S.; Coheur, L.; Delgado, M. Design and Implementation of a Data Warehouse for Benchmarking in Clinical Rehabilitation. Procedia Technol. 2012, 5, 885–894. [Google Scholar] [CrossRef]
- Côrte-real, N.E.D.P. Avaliação da Maturidade da Business Intelligence nas Organizações. Ph.D. Thesis, Universidade Nova, Lisbon, Portugal, 18 February 2011. [Google Scholar]
- Tereso, M.; Bernardino, J. Open source business intelligence tools for SMEs. In Proceedings of the 6th Iberian Conference on Information Systems and Technologies (CISTI 2011), Chaves, Portugal, 15–18 June 2011.
- Care2X: The Open Source Hospital Information System. Available online: http://www.care2x.org/ (accessed on 17 May 2016).
- OpenEHR: An Open Domain-Driven Platform for Developing Flexible e-Health Systems. Available online: http://www.openehr.org/ (accessed on 3 May 2016).
- Welch, W.P.; Bazarko, D.; Ritten, K.; Burgess, Y.; Harmon, R.; Sandy, L.G. Electronic Health Records in Four Community Physician Practices: Impact on Quality and Cost of Care. J. Am. Med. Inform. Assoc. 2007, 14, 320–328. [Google Scholar] [CrossRef] [PubMed]
- Open Source Software: A Primer for Health Care Leaders. Available online: http://www.chcf.org/publications/2006/03/open-source-software-a-primer-for-health-care-leaders (accessed on 11 October 2016).
- SpagoBI for Areas. Available online: http://www.spagoworld.org/xwiki/bin/view/SpagoBI/ApplicationsAreas (accessed on 18 May 2016).
- Pentaho Healthcare Solutions Presentations. Available online: http://pt.slideshare.net/Pentaho/pentaho-healthcare-solutions-presentation (accessed on 10 July 2016).
- Machado, J.; Alves, V.; Abelha, A.; Neves, J.M. Ambient intelligence via multiagent systems in the medical area. Int. J. Eng. Intell. Syst. Electr. Eng. Commun. 2007, 15, 151–158. [Google Scholar]
- Peixoto, H.; Santos, M.; Abelha, A.; Machado, J. Intelligence in Interoperability with AIDA. In Foundations of Intelligent Systems; Springer: Berlin/Heidelberg, Germany, 2012; pp. 264–273. [Google Scholar]
- Filipe, P.; Manuel, F.S.; Marta, V.-B. A Pervasive Approach to a Real-Time Intelligent Decision Support System in Intensive Medicine. In Knowledge Discovery, Knowledge Engineering and Knowledge Management; Fred, A., Dietz, J.L.G., Liu, K., Filipe, J., Eds.; Springer: Berlin/Heidelberg, Germany, 2013. [Google Scholar]
- Lapa, J.; Bernardino, J.; Figueiredo, A. A comparative analysis of open source business intelligence platforms. In Proceedings of the International Conference on Information Systems and Design of Communication, Lisbon, Portugal, 16–17 May 2014; pp. 86–92.
- Sá, T.; Mateus, A.; Iwanaga, M.; Ribeiro, A.; Escovedo, T.; Melo, R.N. Uma Análise Comparativa entre as Ferramentas OLAP como Apoio a Soluções de BI nas Empresas. Available online: http://www.infobrasil.inf.br/userfiles/15-S1-1-97127-ma%20An%C3%A1lise%20Comparativa___.pdf (accessed on 11 October 2016). (In Portuguese)
- Orwat, C.; Graefe, A.; Faulwasser, T. Towards Pervasive Computing in Healthcare—A Literature Review. BMC Med. Inform. Decis. Mak. 2008, 8. [Google Scholar] [CrossRef] [PubMed]
- Portela, F.; Santos, M.F.; Silva, Á.; Machado, J.; Abelha, A. Enabling a Pervasive Approach for Intelligent Decision Support in Critical Healthcare. In Proceedings of International Conference (CENTERIS 2011), Vilamoura, Portugal, 5–7 October 2011.
- Jedox Whitepaper. Available online: http://www.altavia.com/avcfiles/jedox_whitepaper.pdf (accessed on 9 July 2016).
- Arriaga, A.; Marques, P. Web OLAP, Exploração de Sistemas OLAP via Web. Available online: https://www.researchgate.net/profile/Afonso_Arriaga/publication/264845178_Web_OLAP_Exploracao_de_Sistemas_OLAP_via_Web/links/56661e0d08ae192bbf92798a.pdf?origin=publication_detail (accessed on 12 October 2016).
- Technologies, N. MicroStrategy 9 vs. QlikTech—A comparison white paper. Available online: https://www.ndm.net/bi/pdf/MicroStrategy-9-vs-QlikTech-11.pdf (accessed on 12 October 2016).
- QlikView-vs-OLAP. Available online: http://www.covaligroup.com/blog/bid/47883/QlikView-vs-OLAP (accessed on 23 May 2016).
- Rueter, A.M.; Solutions, S. Tableau for the Enterprise: An Overview for IT. Available online: http://www.tableau.com/learn/whitepapers/tableau-enterprise (accessed on 12 October 2016).
- Qlik View. Available online: http://scholar.google.com/scholar?hl=en&btnG=Search&q=intitle:Qlik+View#0 (accessed on 15 May 2016).
- Pereira, E.; Brandão, A.; Portela, C.F.; Santos, M.F.; Machado, J.; Abelha, A. Business Intelligence in Maternity Care. In Proceedings of the 18th International Database Engineering & Applications Symposium, Porto, Portugal, 7–9 July 2014; pp. 352–355.
- Brandão, A.; Pereira, E.; Portela, F.; Santos, M.; Abelha, A.; Machado, J. Real-time Business Intelligence Platform to Maternity Care. In Proceedings of 2014 IEEE Conference on Biomedical Engineering and Sciences, Kuala Lumpur, Malaysia, 8–10 December 2014.


| Features | BI Open-Source Tools | Group | |||||
|---|---|---|---|---|---|---|---|
| Jaspersoft BI | Palo BI Suite | Pentaho BI Suite | QlikView | SpagoBI | Tableau Public | ||
| Performance | 4 | 3 | 4 | 3 | 4 | 4 | D |
| OLAP Ad hoc Queries | 1 | 5 | 5 | 3 | 5 | 4 | B |
| Architecture | 4 | 4 | 5 | 4 | 5 | 4 | D |
| Display of KPIs | 1 | 1 | 5 | 4 | 4 | 4 | A |
| Plug-ins | 3 | 0 | 5 | 0 | 0 | 3 | D |
| Interactive Visualization of Data | 5 | 4 | 5 | 5 | 4 | 4 | C |
| Documentation | 4 | 4 | 2 | 2 | 2 | 3 | F |
| Dashboards | 1 | 1 | 4 | 4 | 5 | 4 | B |
| Navigation Features | 5 | 4 | 4 | 1 | 2 | 4 | C |
| ETL | 4 | 5 | 5 | 3 | 4 | 1 | E |
| Connection to the Database | 5 | 4 | 4 | 5 | 5 | 3 | A |
| Integration of Dimensional Model | 1 | 1 | 1 | 2 | 4 | 1 | E |
| Open-source | 5 | 5 | 5 | 1 | 5 | 5 | D |
| Export | 5 | 2 | 5 | 2 | 5 | 4 | C |
| Pervasive | 5 | 5 | 5 | 1 | 5 | 4 | A |
| Online Help | 4 | 2 | 3 | 4 | 3 | 4 | F |
| Support for Mobile Devices | 4 | 1 | 0 | 5 | 5 | 3 | C |
| Data Mining | 1 | 1 | 3 | 2 | 4 | 1 | B |
| Ease of Use | 4 | 4 | 4 | 4 | 4 | 5 | F |
| Attractiveness | 4 | 3 | 4 | 5 | 5 | 4 | C |
| Customization of the Interface | 4 | 0 | 5 | 5 | 5 | 5 | F |
| User Profile | 5 | 4 | 5 | 1 | 4 | 0 | D |
| Real-time | 5 | 4 | 5 | 1 | 5 | 1 | A |
| Group | Characteristics | Percentage | |
|---|---|---|---|
| A | Must Have | Pervasive | - |
| Real-time | |||
| Display of Key Performance Indicators | |||
| Connection to the Database | |||
| B | Technologies | OLAP Ad hoc Queries | 30% |
| Dashboards | |||
| Data Mining | |||
| C | End-User | Interactive Visualization of Data | 25% |
| Navigation Features | |||
| Export | |||
| Support for Mobile Devices | |||
| Attractiveness | |||
| D | Other Important | Performance | 25% |
| Architecture | |||
| Plug-ins | |||
| Open-source | |||
| User Profile | |||
| E | Data Processing | ETL | 15% |
| Integration of Dimensional Model | |||
| F | Administrator | Documentation | 5% |
| Online Help | |||
| Ease of Use | |||
| Customization of the Interface | |||
| BI Tool | Final Grade |
|---|---|
| Spago BI | 34.85 |
| Pentaho BI Suite | 34.70 |
| Jaspersoft BI | 29.45 |
| Palo BI Suite | 25.00 |
| Tableau Public | 24.60 |
| QlikView | 21.95 |
© 2016 by the authors; licensee MDPI, Basel, Switzerland. This article is an open access article distributed under the terms and conditions of the Creative Commons Attribution (CC-BY) license (http://creativecommons.org/licenses/by/4.0/).
Share and Cite
Brandão, A.; Pereira, E.; Esteves, M.; Portela, F.; Santos, M.F.; Abelha, A.; Machado, J. A Benchmarking Analysis of Open-Source Business Intelligence Tools in Healthcare Environments. Information 2016, 7, 57. https://doi.org/10.3390/info7040057
Brandão A, Pereira E, Esteves M, Portela F, Santos MF, Abelha A, Machado J. A Benchmarking Analysis of Open-Source Business Intelligence Tools in Healthcare Environments. Information. 2016; 7(4):57. https://doi.org/10.3390/info7040057
Chicago/Turabian StyleBrandão, Andreia, Eliana Pereira, Marisa Esteves, Filipe Portela, Manuel Filipe Santos, António Abelha, and José Machado. 2016. "A Benchmarking Analysis of Open-Source Business Intelligence Tools in Healthcare Environments" Information 7, no. 4: 57. https://doi.org/10.3390/info7040057
APA StyleBrandão, A., Pereira, E., Esteves, M., Portela, F., Santos, M. F., Abelha, A., & Machado, J. (2016). A Benchmarking Analysis of Open-Source Business Intelligence Tools in Healthcare Environments. Information, 7(4), 57. https://doi.org/10.3390/info7040057