Article

Multi-Dimensional Control Rules and Assessment Methods for Surface Engineering Data Quality in Oil and Gas Field

1
Natural Gas Gathering and Transmission Engineering Technology Research Institute, PetroChina Southwest Oil and Gas Field Company, Chengdu 610041, China
2
The Infrastructure Construction Engineering Department of PetroChina Southwest Oil and Gas Field Company, Chengdu 610051, China
3
Petroleum Engineering School, Southwest Petroleum University, Chengdu 610500, China
*
Authors to whom correspondence should be addressed.
Information 2025, 16(8), 701; https://doi.org/10.3390/info16080701
Submission received: 6 July 2025 / Revised: 11 August 2025 / Accepted: 15 August 2025 / Published: 18 August 2025

Abstract

The current digital delivery of surface engineering in oil and gas fields faces challenges such as difficulty in integrating multiple heterogeneous data sources, low efficiency in quality reviews, and a lack of unified evaluation standards, which seriously restrict the implementation of intelligent operation and maintenance. Based on this, this study constructs multi-dimensional control rules for data quality covering the entire lifecycle. Based on the characteristics of structured, semi-structured, and unstructured data, five-dimensional review criteria and quantification methods for normative, integrity, consistency, accuracy, and timeliness were developed. At the same time, by integrating the analytic hierarchy process (AHP) and the entropy weight method (EWM), a combined subjective and objective weight evaluation model was established to achieve scientific quantitative calculation of quality indicators. Verification with a project by Southwest Oil and Gas Field shows that the system effectively achieves quantifiable diagnosis and traceability of engineering data quality, revealing the differentiation characteristics of different data types in the quality dimension. The research results provide core methodological support for the establishment of an integrated data governance paradigm of “collection—review—operation and maintenance” in oil and gas fields, facilitating the implementation of intelligent operation and maintenance.

1. Introduction

1.1. Motivation

In the petroleum industry, digitalization refers to the integrated management of upstream, midstream, and downstream sectors through technology, which continuously enhances business value by improving efficiency, eliminating losses, reducing costs, increasing labor productivity, and optimizing decision-making [1]. Currently, digitalization in construction has become a key strategy for oil and gas fields to enhance production efficiency, reduce operating costs, and strengthen safety assurance, with data becoming a core element driving production operations, improving efficiency, and ensuring safety [2,3,4]. However, in oil and gas field digitalization practices, data quality challenges are prominent. Although the Tarim oilfield has taken the lead in implementing system-level mandatory verification of field data, significantly reducing document missing risks, a traditional manual review still struggles to meet lifecycle data control requirements, and the lack of unified quantitative standards makes quality assessment results incomparable. A gathering station project in the Changqing oilfield lacked unified data standards during design/construction phases, causing >30% field missing or logical conflicts in key equipment parameters, resulting in digitalization models failing to map physical entities and increased false alarm rates in intelligent warning systems. Although the Daqing oilfield’s second production plant deployed a digitalization platform, the incomplete collection of unstructured documents caused construction rework rates to increase to 15%. These challenges systematically hinder data value realization and business goal achievement [5,6,7].
In response, this study addresses the pain points of surface engineering data management in oil and gas fields by constructing multi-dimensional control rules and a quantitative assessment system covering the data construction phase. It not only provides methodological support for data governance but also drives the transformation of engineering management toward intelligence and refinement through traceable quality control [8,9].

1.2. Literature Review

In the context of digitalization within oil and gas fields, data has emerged as a pivotal asset for optimizing production operations, improving operational efficiency, and ensuring safety integrity. Nevertheless, substantial data quality deficiencies inherent in current digitalization implementations across upstream platforms have been increasingly exposed, thereby significantly impeding value extraction from data assets and undermining the attainment of strategic business objectives.
Wang et al. [10] pioneered the construction of a digital management platform by optimizing engineering design reviews and construction management processes, becoming the first group to explicitly state the critical role of high-quality data in enabling platform functionality. However, the platform only provided qualitative descriptions for data quality assessments, lacking standardized quantification methods and resulting in evaluation outcomes susceptible to subjective bias. Addressing data governance gaps exposed by platform-centric approaches, Yin [11] proposed a heterogeneous data integration architecture based on a data service bus using Xinjiang oilfield’s Fengcheng operation area as a case study, aiming to resolve multiple-source data integration challenges. This research primarily focused on technical integration design, with limited exploration of quantitative assessment rules for data quality. In the same year, Cheng et al. [12] enhanced data acquisition, transmission, and application platform functionalities in Tarim Desert oilfield practices, validating the feasibility of Yin’s technical approach. Nonetheless, both shared the same critical gap—a superficial discussion on data quality assessment methodologies, failing to provide scientific validation. As field practices advanced, localized data quality issues became prominent. Ren [13], through a digital station case study, empirically validated the critical impact of data accuracy on management efficiency—partially echoing Wang et al.’s data-dependency perspective. However, its scope was confined to station-level units, failing to address comprehensive quality control requirements across the full lifecycle of surface engineering. Li et al. [14] proposed the suggestion of building a digital experimental platform to enhance production efficiency in response to the problems of incomplete data collection at oilfield stations and high reliance on manual labor in the second oil production plant of the Daqing oilfield. However, the station and yard data still have problems such as a large data volume, difficult processing, and incomplete collected data. By 2025, the research focus shifted to quality fundamentals. Sun [15] emphasized that normative and integrity attributes of IoT data underpin security and value, elevating the discourse from technical layers to data attributes. Nevertheless, it did not overcome integration barriers for full lifecycle data assessments. Wang [16] ultimately identified the core contradiction as the deep coupling between multiple-source heterogeneous data quality defects and systemic challenges, including data security risks and intelligent equipment barriers, positioning high-quality data as the fundamental solution. While synthesizing all prior pain points, this work remained at problem identification, urgently requiring actionable quantitative metrics and systematic quality control frameworks. Existing research universally acknowledges that the core contradiction in oil and gas digitalization stems from multiple sources of heterogeneous data quality defects. However, no study has established a systematic quality control framework covering the full construction lifecycle while adapting to multiple-source data characteristics. This critical gap persistently exacerbates data siloing, review delays, and subjective evaluations.
To break through the development bottleneck caused by data quality deficiencies in the digitalization of oil and gas fields, it is imperative to establish a scientific and robust data quality assessment system, where the scientific basis of weight calculation is a decisive factor for governance effectiveness. The article systematically reviews common weighting calculation methods, including subjective weighting, the analytic hierarchy process (AHP), the entropy weighting method (EWM), and the fuzzy comprehensive evaluation method [17,18,19]. Subjective weighting is a straightforward way of calculating weights, which is based on the subjective judgment of the decision-maker and directly assigns weights to each factor or indicator. The advantage of this method lies in its simplicity and ease of implementation, enabling rapid weight allocation while leveraging expert knowledge to address highly subjective or non-quantifiable challenges in data governance. However, the credibility and reliability of explicitly assigned weights may be compromised by inherent subjective biases. The AHP, proposed by Thomas Saaty in 1970, is a multi-criteria decision analysis method. Its key advantages include decomposing decision-making problems into a hierarchical structure that accounts for the relative importance of each factor, making it systematic and practical. However, the AHP can be computationally intensive and time-consuming for large-scale problems and may require substantial expert input. The EWM, based on Claude Shannon’s information entropy theory, is a weight calculation method. This methodology incorporates intrinsic discrepancies among factors without subjective intervention, demonstrating significant scalability for big data processing in digitalization frameworks. However, limitations include computationally intensive processes and stringent data quality requirements for governance validity [20]. The fuzzy comprehensive evaluation method applies to dealing with situations where there is fuzziness and uncertainty in decision-making problems. Its advantages include the ability to comprehensively consider multiple fuzzy factors, comprehensively assess the review object, avoid missing important information, and flexibly adjust the index system and weight distribution according to specific review objectives. However, the determination of index weights carries inherent subjectivity risks, potentially undermining the objectivity of outcomes in data-driven decision models for digitalization. And there may be correlations among the indicators, resulting in inaccurate evaluation results, difficulty in determining membership functions, and poor uniformity and accuracy [21,22].
To address this, this paper proposes a dual-path innovative solution in terms of the data review mechanism. Firstly, based on the varying degrees of data structuring, engineering data can be categorized into three distinct types: structured data exemplified by row–column databases, such as equipment parameter tables; semi-structured data characterized by hierarchical models, including P&ID drawings; and unstructured data that lacks a fixed format, encompassing technical documents like design drawings. Subsequently, to address the challenges of non-standard materials and missing documents in oil and gas fields, this article establishes a five-dimensional quality review system, which will focus on reviewing the standardization, completeness, consistency, accuracy, and timeliness of these three types of data [23,24]. In the construction of the evaluation model, this article employs a combination of the AHP and EWM to determine the weight combinations, thereby enhancing the accuracy and credibility of weight calculations. By utilizing the AHP, we clarify the relationships and relative importance among various factors, allowing for the derivation of subjective weights based on expert judgment. Concurrently, the EWM facilitates an objective calculation of factor weights, mitigating potential biases that may arise from subjective influences. The integration of these two methodologies results in more reliable weight outcomes [25,26,27,28,29]. This approach improves the accuracy and credibility of weight calculation, effectively enhances the overall efficiency of digital construction in oil and gas fields, and ensures that data plays a key role in the intelligent operation and scientific decision-making of oil and gas fields.
In summary, the extant literature consistently highlights the pivotal role of data quality in oil and gas field digitalization, uncovering the multifaceted complexities of data quality challenges, thereby establishing a robust theoretical and practical foundation for this research. However, systematic methodologies for data quality enhancement remain notably deficient, particularly regarding domain-specific data quality assessment frameworks that account for the inherent complexities of oil and gas field operations in digitalization environments. Therefore, this paper presents a systematic approach to digital data quality reviews and assessments, aiming to fill this research gap and provide a more comprehensive and effective data quality assurance strategy for the digital transformation of oil and gas fields.

1.3. Contributions

(1)
To ensure standardized control of the data, classify the data types as structured, semi-structured, and unstructured and the quality characteristics as normative, integrity, consistency, accuracy, and timeliness.
(2)
Review rules for five characteristics based on quality characteristics have been established to fill the technical gap in the quantitative verification of oil and gas field engineering data quality.
(3)
By integrating the AHP and EWM, a combined subjective and objective weight calculation method was formed to achieve quantitative assessments and scientific diagnosis of data quality indicators.
(4)
Through project examples, it is known that the application of data review rules and quality assessment methods can systematically guarantee the quality of on-site delivered data, providing a standardized data governance paradigm and quantitative decision support for the digital transformation, intelligent operation, and maintenance of oil and gas field surface engineering.

1.4. Paper Organization

The following content of this paper is arranged as follows: Section 2 describes the data quality management system for digital delivery of oil and gas field surface engineering. Section 3 explains the data quality review rules. Section 4 introduces the data quality assessment methods. Section 5 presents an example of data organization with a project by Southwest Oil and Gas Field in surface engineering. Section 6 summarizes the full text.

2. System Description

Southwest Oil and Gas Field’s surface engineering digital delivery builds a systematic data quality management system, effectively ensuring engineering quality through data collection, organization, quality control formulation, and data quality review processes. As shown in Figure 1, in the data collection process, on-site construction personnel, technicians, or supervising engineers use explosion-proof industrial tablets or dedicated handheld terminals in the construction work area to scan device tags or QR codes or to manually enter construction parameters in mobile application forms, and they enter them in real time after the process or the acceptance node. IoT sensors deployed on critical equipment, pipeline nodes, and facilities automatically capture device operating status in real time or at preset sampling intervals and transmit it to the management platform. The environmental monitoring device installed at the designated monitoring point will upload environmental data according to the preset cycle through a dedicated network channel. The design-change document shall be uploaded electronically by the design management engineer through the workstation of the management platform within 24 h after the approval process is completed. The documents related to completion acceptance shall be scanned, archived, and uploaded by the project data officer within 48 h after passing the acceptance process. In the data organization stage, the data is uploaded to the management platform, and data supervision adopts the engineering decomposition structure method for hierarchical management. Subsequently, the collected data is classified into three categories: structured data, semi-structured data, and unstructured data. For these three types of data, the system conducts strict reviews from five core dimensions: normative, integrity, consistency, accuracy, and timeliness. To evaluate the quality of uploaded data, a sample check of the data is required to determine the measurement method, perform weight allocation and calculation, and ultimately obtain a comprehensive data quality assessment result. Through the complete quality control chain mentioned above, the system achieves standardized management and full lifecycle traceability of engineering data, providing solid and reliable data support for digital delivery and intelligent operation and maintenance.

3. Digital Delivery Data Quality Rules

To ensure the reliability and timeliness of digital delivery data in oil and gas field surface engineering, this study establishes a five-dimensional data review framework that enables comprehensive control over three data types: structured, semi-structured, and unstructured. The framework encompasses five review mechanisms: normative, integrity, consistency, accuracy, and timeliness. A normative review ensures compliance with predefined data formats, standards, and naming conventions. An integrity review verifies the completeness of core data fields and confirms that all model components align with the design checklist. A consistency review identifies discrepancies by comparing critical attribute values across interconnected business systems. An accuracy review assesses the rationality of numerical data and the precision of spatial positioning. A timeliness review guarantees that data entry and updates occur within specified timeframes.

3.1. Normative

In oil and gas field surface engineering, misclassification of equipment can lead to a chain of errors in design, procurement, and construction. Therefore, the normative review of structured data requires verifying whether the classification codes of all entity objects strictly conform to the entity classification system defined in the specification for digital delivery of oil and gas field surface engineering (Q/SY 01015-2022) [30], including primary, secondary, and subdivision types. We verify the classification code format through regular expressions and compare it with the standard classification table, as shown in Equation (1).
c s C s t d
where cs is the classification code for entity s and Cstd is a collection of classification codes defined by Q/SY 01015-2022.
Semi-structured data that does not follow a standardized format or layering rules can result in data not being integrated or parsing errors, causing construction delays. Therefore, the normative review of semi-structured data requires verifying whether the model format is within the allowed list, whether the coordinate system is CGCS2000, whether the units are uniformly metric, and whether the hierarchical name conforms to the corresponding hierarchical norms. The format and standard compliance verification formula is shown in Equation (2), which requires extracting metadata through the file parsing tool to verify the format suffix and coordinate system encoding. The hierarchical naming compliance verification formula, as shown in Equation (3), requires checking whether the model node paths strictly follow the hierarchical specification (the path is structured as follows: factory, device, system unit, and equipment/pipeline), and whether the node names exactly match the PBS encoding. The coordinate system review of semi-structured data requires verifying that the EPSG code of the coordinate system in the model information conforms to CGCS2000. This process uses a regular expression (AUTHORITY [“EPSG”, “1043”]) to match the key identifier. If the identifier is missing or the match fails, it is determined that the coordinate system is abnormal.
b j B s t d
where bj is the file format of model j, while Bstd is the set of standard file formats specified for the project. The file format of model j must comply with the standard format set specified by the project.
D e p t h m = L m , N a m e m = P B S m
where Depthm is the hierarchical depth of node m and Lm is the specified hierarchical depth. The factory level is taken as 1, the facility level as 2, the system unit level as 3, and the equipment level as 4. Namem is the name of node m in the engineering breakdown structure. PBSm is the standard name in engineering breakdown structures.
The normative review of unstructured data requires verifying whether the file format conforms to the set of standard formats specified by the project, as shown in Equation (4).
q o Q s t d
where qo is the file format of file o and Qstd is the set of allowed formats.

3.2. Integrity

Omission of required fields during construction can lead to data silos. The integrity review of structured and unstructured data requires checking whether the core business fields are non-empty, as shown in Equation (5).
M m i s s = f k f k F r e q , f k
where fk is the field value and Freq is a collection of required fields.
Due to the absence of key components in the completed model, which can result in incomplete functionality of the digital twin, the integrity review of semi-structured data requires checking whether the model covers all entities in the design list and whether the required fields in the property table are omitted. We compare the number of components using the model statistics tool and query the missing fields in the property table, as shown in Equation (6).
d r D s t d
where dr is the collection of model components r and Dstd is the collection of unstructured standard file formats specified for the project.

3.3. Consistency

Throughout the entire lifecycle of surface engineering in oil and gas fields, business processes such as design, construction, and procurement are typically managed through separate systems. Critical information about the same entity, such as equipment or pipelines, may vary across these systems, leading to inconsistencies. For example, discrepancies may arise if the equipment model recorded during the design phase differs from the one received during procurement, or if the pipeline material documented during construction does not align with the design specifications. These inconsistencies can directly hinder the smooth coordination of project phases. Therefore, ensuring consistency among these three data types requires a focus on aligning key attributes across business systems. By clearly defining comparison rules, it can be ensured that no conflicting information exists. The corresponding calculation formula is shown in Equation (7).
A k T design = A k T construction = A k T purchase , k material , model   specifications
where Ak (Tdesign) is the value of attribute k in the design stage table Tdesign, Ak (Tconstruction) is the value of attribute k in the construction phase table Tconstruction, and Ak (Tpurchase) is the value of attribute k in the material procurement stage table Tpurchase.

3.4. Accuracy

In oil and gas field surface engineering, manually entered values may not match the results of formula calculations due to confusion of units or input errors. The accuracy review of structured data should be combined with engineering design parameters and physical laws to check whether the values are within a reasonable range and to verify the value range, unit standardization, and correctness of the derived fields of the formula. Scripts need to be written to automatically calculate the theoretical values and compare them with the input values. A deviation of ±5% is marked as abnormal. The formula is as shown in Equation (8).
v enter v calculate 0 . 05 × v calculate
where venter is the data entered and vcalcuate is the theoretical value calculated according to the standard equation.
Errors in coordinate system conversion or manual modeling errors may cause the position of the device in the 3D model to deviate from reality. Therefore, the accuracy review of semi-structured data requires a review of the consistency between the model’s key point coordinates and the actual measured values by calculating the three-dimensional straight-line distance between the model coordinates and the measured coordinates for each measurement point, taking the maximum of all points to see if it is below the specified threshold. The formula is shown in Equation (9).
ε = max x 1 x 2 2 + y 1 y 2 2 + z 1 z 2 2
where ε is the specified threshold, (x1, y1, z2) is the coordinates of the three-dimensional model in the as-built drawing, and (x2, y2, z2) is the coordinates of the three-dimensional model in the actual measurement.

3.5. Timeliness

High-frequency construction data requires system entry within defined timeframes to complete the process, ensuring real-time synchronization between physical progress and digital records. Design-change documents must be updated in the system within the prescribed time after the approval process is completed to ensure that construction and material procurement are adjusted in a coordinated manner. The data related to completion acceptance must be filed within the prescribed time after the acceptance is qualified. Therefore, the timeliness review of the three types of data needs to be compared with the completion time of the process and the time of data entry into the database, and a warning will be triggered for exceeding the time limit, as shown in Equation (10).
t enter t p r o c e s s Δ t
where tenter is the time of data entry, tprocess is the process completion time, and ∆t is the maximum allowable delay time for process entry.

4. Digital Delivery Data Quality Assessment Methods

To scientifically evaluate the effectiveness of digital delivery data quality reviews in oil and gas field surface engineering, this study established a systematic quantitative assessment method. Based on the five-dimensional review rules established in Section 3, the quantitative scores of each dimension were calculated separately through formulas.

4.1. Data Quality Assessment System

This paper constructs a systematic assessment framework, as shown in Figure 2, first categorizing the input digital delivery dataset into three types: structured data, semi-structured data, and unstructured data. Building upon this classification, the framework evaluates all three data types against five critical quality dimensions: normative compliance, integrity, consistency, accuracy, and timeliness. Different weights were assigned according to each item’s importance for the evaluation task, and scores were given based on actual performance. The final data quality score was obtained by summing the weighted scores.

4.2. Data Quality Quantification Method

Data normative reflects the extent to which data elements conform to predefined criteria. Manual operational errors or system integration flaws may result in deviations in data formats, such as incorrectly assigned classification codes and inconsistent coordinate systems. This paper verifies the standard compliance of each data item using a rule engine, whose core metric formula is shown in Equation (11).
Q N = i = 1 I f N i n × 100 %
where QN is the standardization rate of the entered data, I is the total sample size, and fN (i) is the normative judgment function for data item i, returning 1 when all format criteria are met and 0 when any standard deviation exists.
Data integrity characterizes the extent to which critical information is missing. Omissions in field collection or transmission failures may cause null values in mandatory fields, which can lead to data silos. This paper quantifies the degree of missing values using a null value scanning technique, and the core measurement formula is shown in Equation (12).
Q C = p = 1 P f C p P × 100 %
where QC is the integrity rate of the input data, P is the total number of required fields, and fC(p) is the integrity status function for field p, returning 1 when the field contains valid values and 0 when the field is empty.
Data consistency reflects the degree of data conflict between multiple source systems. When independent business systems (design/construction/procurement) operate in parallel, the same entity attribute values may be contradictory. This paper quantifies the level of conflict through cross-system alignment verification, as shown in Equation (13).
Q K = u = 1 U f K u U × 100 %
where QK is the consistency rate of the input data, U is the total sample size, and fK(u) is the consistency state function for recording u, returning 1 when all system attribute values deviate less than or equal to the threshold and 0 when any system is out of tolerance.
Data accuracy measures the extent to which numerical errors or spatial offsets occur. Manual entry errors or coordinate transformation errors can cause theoretical values to deviate from actual values. This paper validates quantified deviation levels through physical rules, as shown in Equation (14).
Q A = l = 1 L f A l L × 100 %
where QA is the accuracy rate of the input data, L is the total amount of verification data, and fA(l) is the accuracy state function of data item l, which returns 1 when the input value is within the tolerance range and 0 when it is out of tolerance.
Data timeliness characterizes the extent to which data collection lags behind the project schedule. Asynchronous on-site operations and data entry can lead to the failure of progress monitoring. This paper quantifies the degree of delay by timestamp comparison, as shown in Equation (15).
Q T = e = 1 E f T e E × 100 %
where QT is the timeliness rate of data entry, E is the total amount of process-associated data, and fT(e) is the timeliness status function for data item e, which returns 1 when entered within the allowed time window and 0 when entered beyond the time window.

4.3. Weighting Calculation Method

The AHP decomposes the decision problem hierarchically, constructing pairwise comparison matrices to quantify the relative importance of elements at each level. These matrices undergo eigenvalue decomposition to derive and normalize the principal eigenvector. Each matrix must pass a consistency test to validate the weight assignments; otherwise, the comparisons require revision. The EWM commences with the collection and standardization of data for each factor to eliminate dimensional effects. Subsequently, the information entropy of each factor is computed, followed by the determination of factor weights, which exhibit an inverse proportionality to their corresponding information entropy values. Conclusively, a comprehensive evaluation of all factors is conducted to yield the final results. The combined weight method combines the advantages of the AHP and the EWM and is more comprehensive when considering the weights of various indicators. The method first uses both methods to calculate the weights of each indicator, and then calculates the combined weights according to Equation (16).
α b = β b Z p b = 1 B β b Z b
where αp is the combined weight value of indicator b, βb is the subjective weight value of metric p, and Zp is the objective weight value of the indicator p.

5. Digital Delivery of Data Organization Instances

5.1. Data Collection and Classification

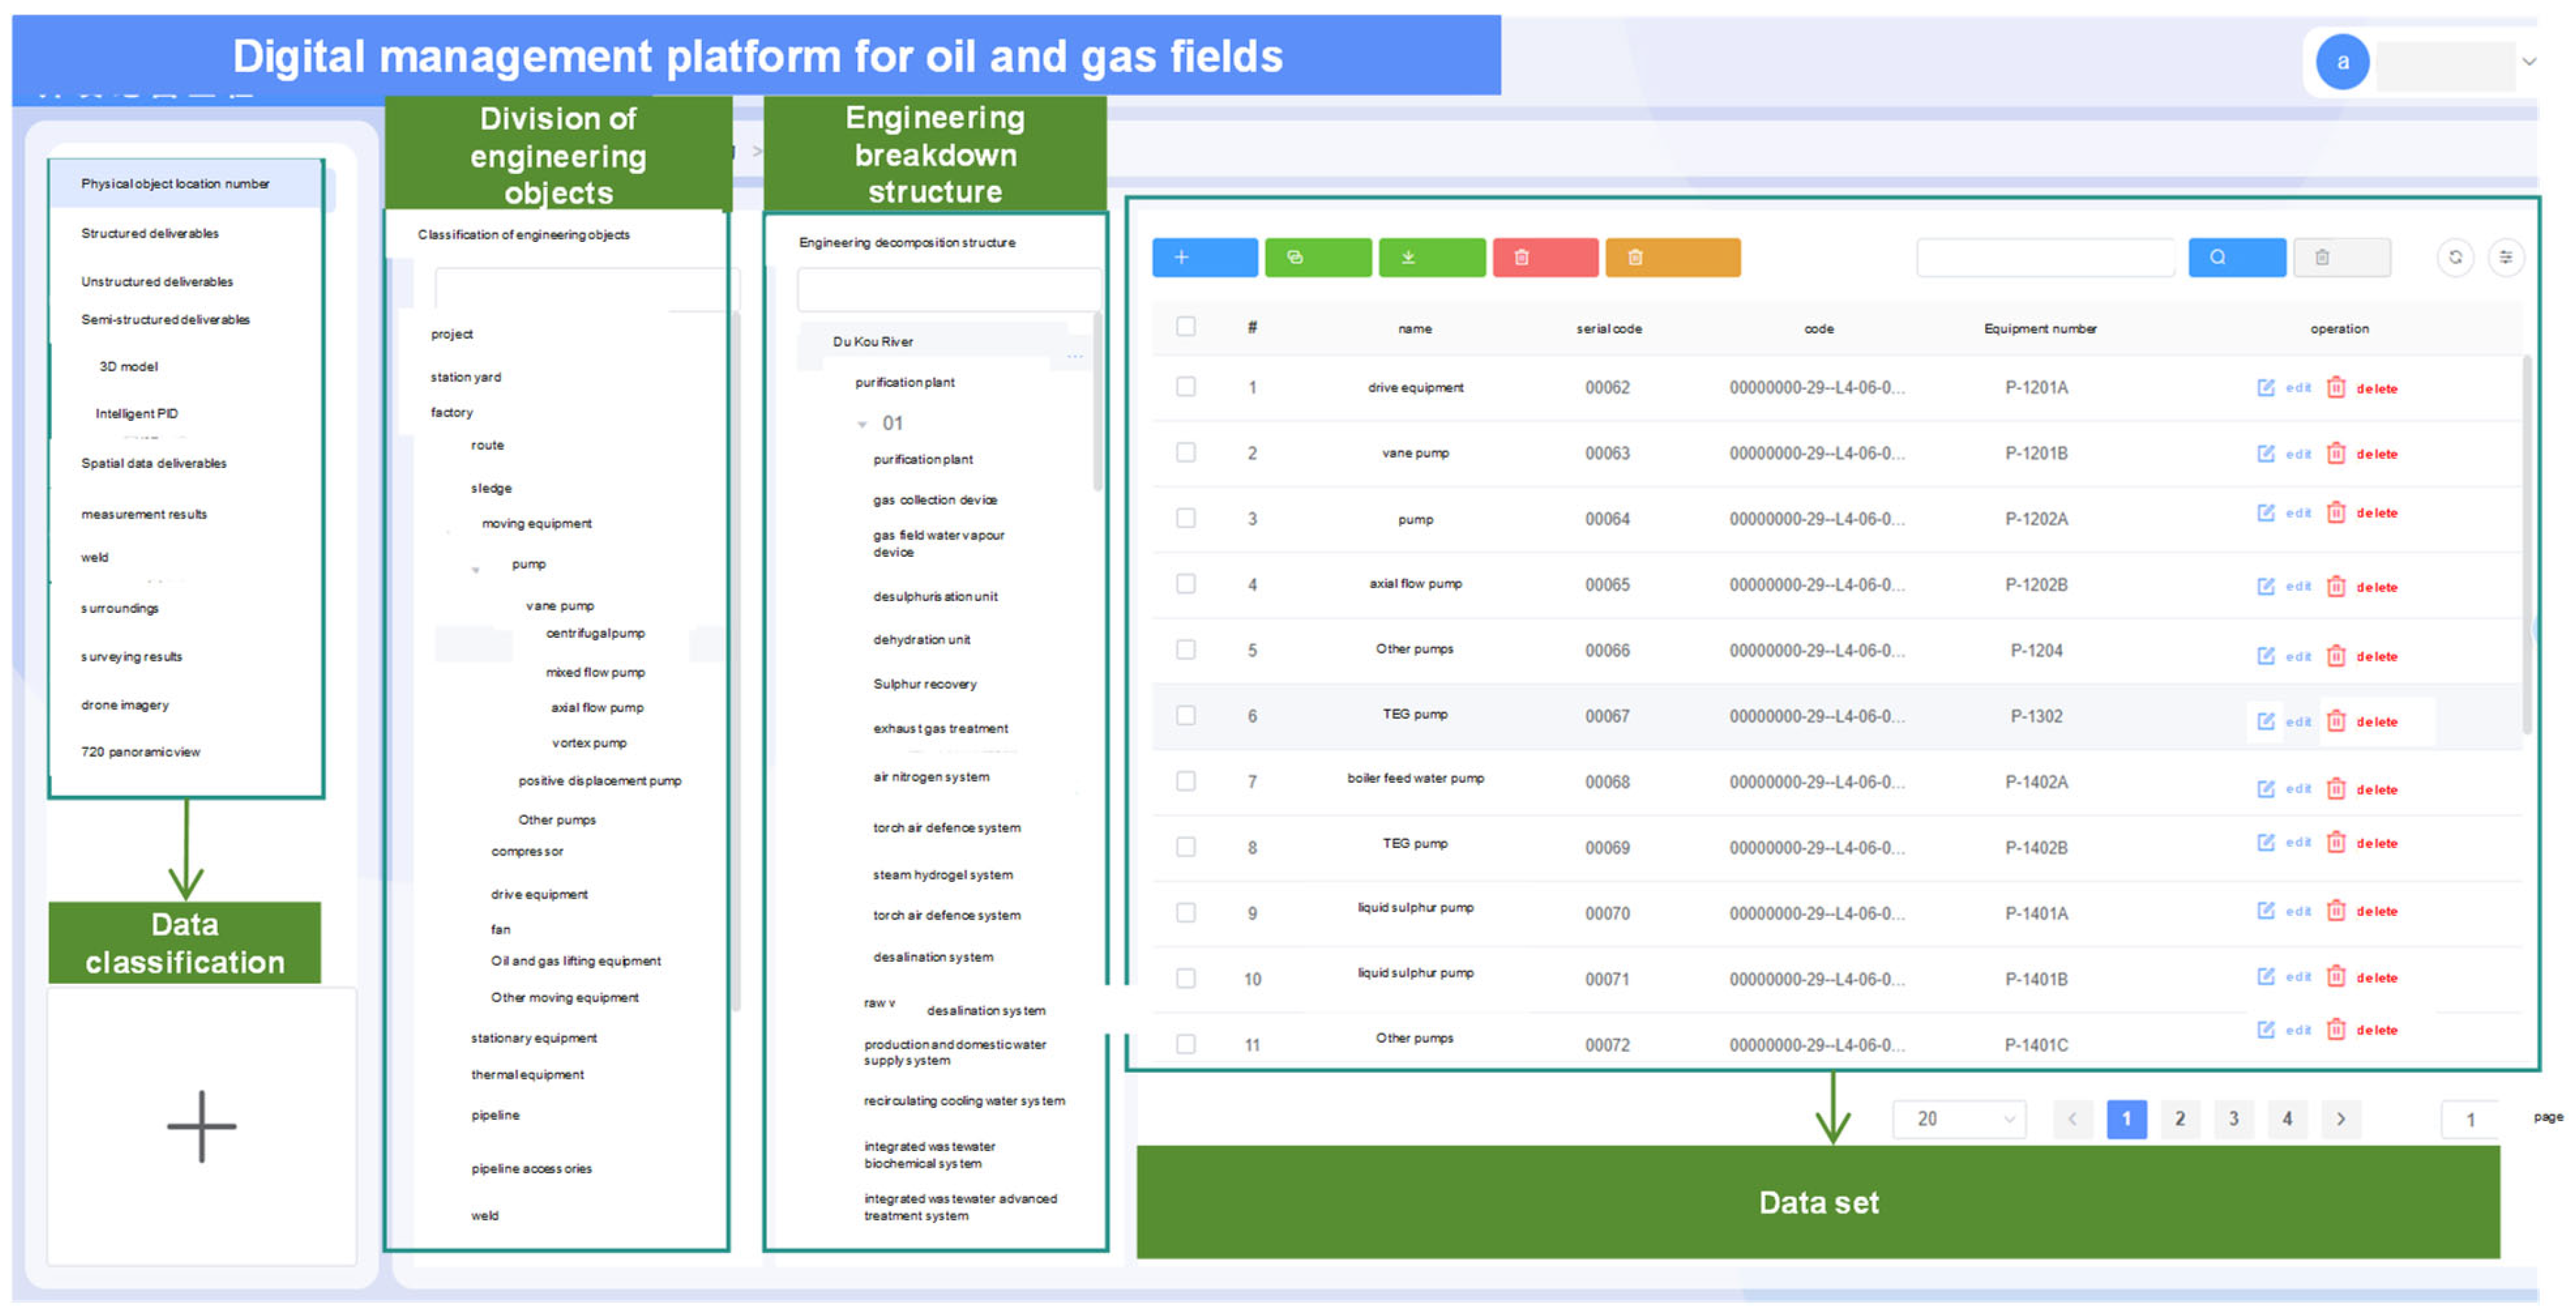
To verify the feasibility of the data quality review rules for digital delivery of oil and gas field surface systems proposed in this paper, this study takes an actual project by Southwest Oil and Gas Field as a case and conducts a case analysis of its field data. Based on the engineering management platform, the project effectively integrated multiple-source heterogeneous data generated during the design, procurement, and construction phases, as shown in Figure 3.
The project delivered 9402 physical objects of equipment, instruments, and valves and 2775 objects of pipelines/conduits and completed the structuring of a total of 12,177 engineering entities; for the gathering and transportation project, there were 1719 and 540 entities of the corresponding categories, totaling 2259. A total of 159 types of physical objects were structured throughout the project, involving a total of more than 14,000 objects. In terms of unstructured data delivery, the research covered multimodal file types, including quality certification documents, design drawings, technical documentation, and multimedia materials throughout the entire lifecycle. Semi-structured data delivery is centered on intelligent P&ID design and based on the PDMS software (https://epc365.com) to achieve digital delivery that meets the depth requirements of the project. Currently, the 3D model of the project has been delivered in nine versions, covering 30%, 60%, 90% and 100% versions of the design model, as shown in Figure 4.

5.2. Weight Calculation Results

This paper uses the combined weight method for the comprehensive evaluation of the control results of oil and gas field surface engineering data using the AHP to calculate subjective weights, taking into account the subjective judgment of decision-makers and expert opinions. The EWM is used to calculate the objective weights. The specific calculation is as follows:
(1) The AHP determines subjective weights.
Based on the weight importance judgment matrix in Table 1 and following on-site requirements and expert opinions, the judgment matrix data for each layer of indicators was obtained. The expert scoring result for judgment matrix T is shown in Equation (17).
T = 1 2 2 3 3 1 / 2 1 2 2 3 1 / 2 1 / 2 1 2 2 1 / 3 1 / 2 1 / 2 1 2 1 / 3 1 / 3 1 / 2 1 / 2 1
We perform column normalization on the matrix, as shown in Equation (18), to obtain the column normalization result of the judgment matrix, where
T ¯ = 0.32 0.46 0.33 0.35 0.27 0.32 0.23 0.33 0.24 0.27 0.16 0.12 0.17 0.24 0.18 0.11 0.12 0.08 0.12 0.18 0.11 0.08 0.08 0.06 0.09
We sum the rows of the normalized judgment matrix, and according to Equation (19), the result is as follows:
W ¯ = 0.35 0.28 0.17 0.12 0.08
The objective weight results of the indicators calculated by the AHP are shown in Table 2.
(2) We determine objective weights using the EWM.
In order to comprehensively assess the quality of surface engineering data in oil and gas fields, this study selected structured data from 10 unit projects of a certain project by Southwest Oil and Gas Field as samples on the platform described in Section 5.1. Through the review rules and data quantification methods in Section 3 and Section 4, the quality scores of the calculated conformity rate are shown in Table 3.
Combined with the EWM, the original data was calculated and processed. After organizing the results, the objective weights are shown in Table 4.
(3) The combined weighting method determines the final weights.
According to Equation (16), the subjective weights and objective weights are substituted to obtain the combined weights, as shown in Figure 5.

5.3. Data Quality Assessment Results

The method for calculating the comprehensive score F of data quality assessments is shown in Equation (20). For the convenience of comparative analysis among the data, the scores of each indicator were expanded by 100 times, and ultimately the scores of each evaluation indicator of the three types of data of a certain oil and gas field surface project by Southwest Oil and Gas Field were obtained.
F = α 1 × Q N + α 2 × Q C + α 3 × Q K + α 4 × Q A + α 5 × Q T
where α1, α2, α3, α4, and α5 are the scores for normative, integrity, consistency, accuracy, and timeliness of the data.
The data quality scores of the three types of data are shown in Figure 6. It can be seen from the figure that the overall quality of unstructured data is the best, followed by structured data, and semi-structured data is relatively weak. Among them, unstructured data leads significantly in terms of standardization and accuracy. Structured data, due to the application of IoT collection technology, performs evenly in all dimensions but has shortcomings in completeness. Semi-structured data, although it stands out in model completeness, has consistency as its main shortcoming due to the lack of cross-system collaboration mechanisms. Timeliness is a common bottleneck for all three types of data, and the root cause lies in the disconnection between manual entry processes and automated transmission mechanisms.

6. Conclusions

This study establishes a systematic methodology for data quality governance in oil and gas field surface engineering. By integrating the analytic hierarchy process (AHP) and the entropy weight method, we construct a combined weight evaluation model that synthesizes subjective and objective factors, thereby overcoming the subjective limitations inherent in traditional weight allocation. Simultaneously, differentiated five-dimensional review rules are implemented for structured, semi-structured, and unstructured data, enabling dual control over both data form and quality dimensions. Empirical results reveal that unstructured data exhibits significant advantages in standardization and accuracy. Structured data demonstrates overall balance but requires urgent improvement in integrity. Semi-structured data, however, faces challenges in consistency and timeliness due to insufficient cross-system collaboration.

Author Contributions

Conceptualization, F.W. and T.X.; methodology, T.X.; software, T.X. and W.Z.; validation, C.L.; formal analysis, T.X.; investigation, F.W.; resources, F.W.; data curation, Z.H.; writing—original draft preparation, G.C.; writing—review and editing, Z.H. and J.Z.; visualization, T.X.; supervision, G.C.; project administration, W.Z.; funding acquisition, J.Z. All authors have read and agreed to the published version of the manuscript.

Funding

This research received no external funding.

Institutional Review Board Statement

Not applicable.

Informed Consent Statement

Not applicable.

Data Availability Statement

All data, models, and code generated or used during the study appear in the submitted article.

Conflicts of Interest

Authors Taiwu Xia, Feng Wang, Wei Zhang, Gangping Chen were employed by the PetroChina Southwest Oil and Gas Field Company. Author Zhan Huang was employed by the The Infrastructure Construction Engineering Department of PetroChina Southwest Oil and Gas Field Company. The remaining authors declare that the research was conducted in the absence of any commercial or financial relationships that could be construed as a potential conflict of interest.

References

  1. Sylthe, O.; Brewer, T. The impact of digitalization on offshore operations. In Proceedings of the Offshore Technology Conference, Houston, TX, USA, 30 April 2018. [Google Scholar]
  2. Wang, H.F. The Research of Digital Construction of Daqing Oilfield. Master’s Thesis, Northeast Petroleum University, Daqing, China, 2013. [Google Scholar]
  3. Qian, L. Problems and Countermeasures in Digital Construction of Oilfields. Small Medium-Sized Enterp. Manag. Technol. 2016, 1, 234. [Google Scholar]
  4. Fang, Z. Research on the Application of Internet of Things Technology in the Digital Construction of Oilfields. Chem. Eng. Des. Commun. 2021, 47, 11–12. [Google Scholar]
  5. Tai, L.M. Research and Discussion on the Digitization Examination of the Construction Drawing Design Document. Eng. Constr. Des. 2019, 24, 277–278. [Google Scholar]
  6. Zhang, P.H. Research of the Isomerous EDA Design Data Checkup Technology in Digitalization Test Systems. Master’s Thesis, Xidian Science and Technology University, Xi’an, China, 2009. [Google Scholar]
  7. Alwan, A.A.; Ciupala, M.A.; Brimicombe, A.J.; Ghorashi, S.A.; Baravalle, A.; Falcarin, P. Data Quality Challenges in Large-scale Cyber-Physical Systems: A Systematic Review. Inf. Syst. 2022, 105, 101951. [Google Scholar] [CrossRef]
  8. Zhang, X.X.; Du, P.; Chen, H.; Lu, Y.J.; Zhang, J.Q. Research and Implementation of Quality Inspection Model for Basic Data of Science and Technology Based on Custom Constraint Rules. J. Sci. Technol. Resour. China 2017, 49, 60–67. [Google Scholar]
  9. Song, H.T.; Yu, J.S.; Han, Q.L. Industrial Multivariate Time Series Data Quality Assessment Method. Appl. Comput. 2024, 44, 1743–1750. [Google Scholar]
  10. Wang, C.P.; Meng, L.; Feng, X.Z.; Wang, J.J.; Cui, X.Q.; Wu, R. Research and Application of Digital Technology in Surface Construction Engineering of Oil and Gas Fields. In Proceedings of the 32nd National Natural Gas Academic Conference (2020), Chongqing, China, 12–14 November 2020; pp. 3051–3072. [Google Scholar]
  11. Yin, C.L. Technical Integration and Integration of Heterogeneous Data Sources of Oilfield Digitisation. Chem. Manag. 2021, 34, 191–192. [Google Scholar]
  12. Cheng, M.L.; Xue, J.; Zhang, C.S.; Zhang, B.N.; Tang, Z.G. Practice and Exploration of Digital Construction of Surface Engineering in Desert Oilfields. China Instrum. 2021, 09, 81–84. [Google Scholar]
  13. Ren, S.H. Construction of Digital Construction Mode for Oilfield Stations. China Pet. Chem. Stand. Qual. 2023, 43, 50–52. [Google Scholar]
  14. Li, Y.; Lyu, H.; Liu, L.; Yin, L. Practice and Understanding of Oilfield Digitalisation Construction. China Plant Eng. 2023, 47–50. Available online: https://caod.oriprobe.com/articles/65482725/you_tian_shu_zi_hua_jian_she_de_shi_jian_yu_ren_sh.htm (accessed on 11 August 2025).
  15. Sun, F.T. Exploration and Practice of Internet of Things Technology in the Construction of Oilfield Digitization. Inf. Comput. 2025, 37, 76–78. [Google Scholar]
  16. Wang, C.C. Discussion on the Problems and Countermeasures of Digital Construction in Oilfields. China Pet. Chem. Stand. Qual. 2025, 45, 91–93. [Google Scholar]
  17. Chernov, A.V.; Chernova, V.A.; Kolganova, E.V. Prioritization of Key Areas of the Digitalization Strategy of Energy Complex Enterprises Based on the Analytical Hierarchy Process (AHP). Unconv. Resour. 2025, 6, 100154. [Google Scholar] [CrossRef]
  18. Yin, Y.; Song, C.; Jing, Y.; Zhang, S.; Ye, S.; Wang, Y.; Gao, P. EWMS: A Software Tool for Interactively Using Entropy Weight Coefficient Method for Aggregating Sustainability Indicators. Environ. Model. Softw. 2025, 19, 106500. [Google Scholar] [CrossRef]
  19. Han, G.; Feng, G.; Tang, C.; Pan, C.; Zhou, W.; Zhu, J. Evaluation of the Ventilation Mode in an ISO Class 6 Electronic Cleanroom by the AHP-Entropy Weight Method. Energy 2023, 284, 128586. [Google Scholar] [CrossRef]
  20. Jing, Y. Research on Safe Mining Risk Control System of Deep Phosphate Mine Based on Analytic Hierarchy Process and Fuzzy Comprehensive Evaluation Method. Master’s Thesis, Wuhan Institute of Technology, Wuhan, China, 2023. [Google Scholar]
  21. Wu, D.X. Construction Safety Risk Management of New Airport Project Based on Analytic Hierarchy Process. Master’s Thesis, Qingdao University of Technology, Qingdao, China, 2023. [Google Scholar]
  22. Li, Z.H. Research on WRSN Charging Planning Algorithm Based on Energy Consumption Optimization and Analytic Hierarchy Process. Master’s Thesis, Guilin University of Technology, Guilin, China, 2023. [Google Scholar]
  23. Taggart, J.; Liaw, S.T.; Yu, H. Structured Data Quality Reports to Improve EHR Data Quality. Int. J. Med. Inform. 2015, 84, 1094–1098. [Google Scholar] [CrossRef] [PubMed]
  24. Presser, K.; Hinterberger, H.; Weber, D.; Norrie, M. A Scope Classification of Data Quality Requirements for Food Composition Data. Food Chem. 2016, 193, 166–172. [Google Scholar] [CrossRef] [PubMed]
  25. Du, H.L. Post-evaluation Research of Wind Power Projects Based on AHP-entropy Weight Method. Master’s Thesis, North China University of Technology, Beijing, China, 2023. [Google Scholar]
  26. Zou, L. Value Evaluation of WeChat Subscription Official Account Based on AHP-Entropy Weight Method and Grey Correlation Analysis. Master’s Thesis, Chongqing University of Technology, Chongqing, China, 2023. [Google Scholar]
  27. Wang, H.D. Ergonomic Research and Design of Automatic Follow Maintenance Cart Based on Simulation Analysis and AHP-Entropy Weight Method. Master’s Thesis, East China University of Science and Technology, Shanghai, China, 2022. [Google Scholar]
  28. Liu, Y.X. Research on Risk Evaluation and Optimization of Internal Control of Engineering Projects Based on FCE—Taking School A as an Example. Master’s Thesis, Chongqing University of Technology, Chongqing, China, 2023. [Google Scholar]
  29. Zhang, M.Y. Power Transmission Project Based on Fuzzy Comprehensive Evaluation Method Social Stability Risk Assessment. Master’s Thesis, Kunming University of Science and Technology, Kunming, China, 2023. [Google Scholar]
  30. Q/SY 01015-2022; Specification for digital delivery of oil and gas field surface engineering. China National Petroleum Corporation: Beijing, China, 2022.
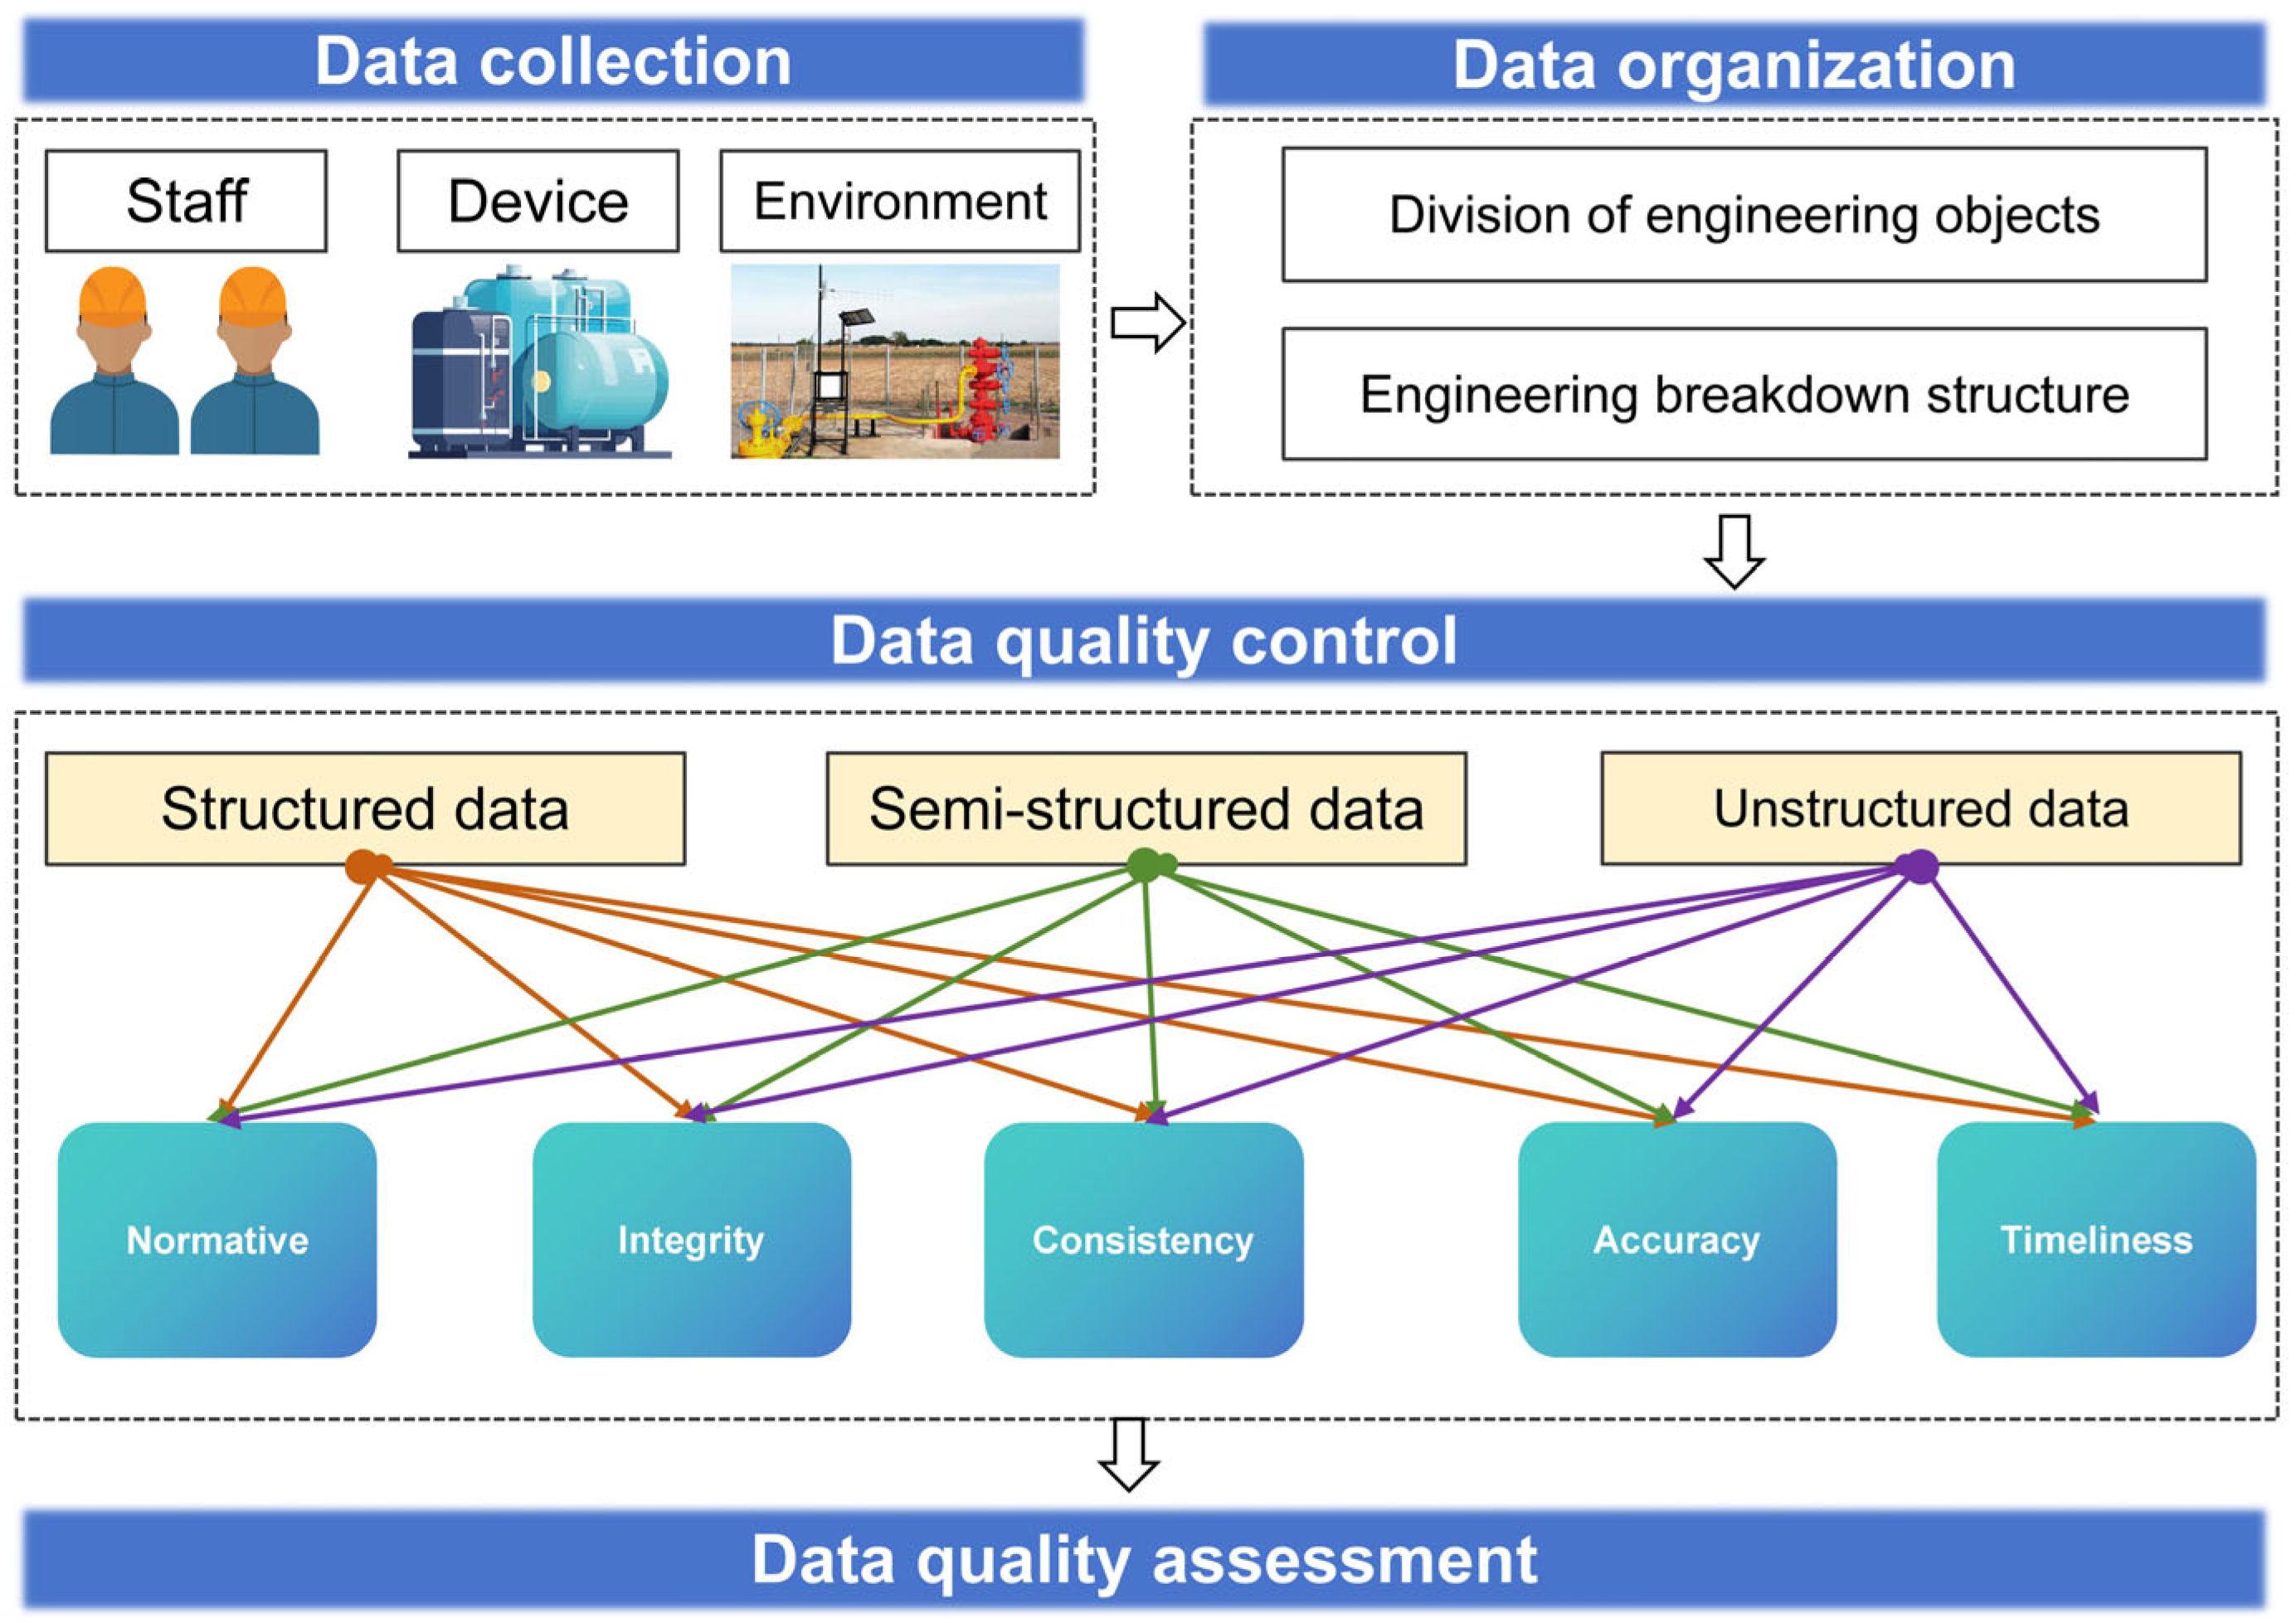
Figure 1. Quality review and evaluation system for oil and gas field surface engineering data.
Information 16 00701 g001
Figure 2. Data evaluation framework.
Information 16 00701 g002
Figure 3. Data platform.
Information 16 00701 g003
Figure 4. Overview of data delivery.
Information 16 00701 g004
Figure 5. Results of weight calculation.
Information 16 00701 g005
Figure 6. Results of data quality assessments.
Information 16 00701 g006
Table 1. Description of the weighting importance judgment matrix.
ScaleMeaning
1Equally important
3Slightly more important
5Moderately more important
7Strongly more important
9Extremely more important
2/4/6/8Intermediate values between adjacent scales
Table 2. Subjective weight and consistency test results.
Indicator NamesSubjective WeightConsistency Test
Normative0.35
Integrity0.28
Consistency0.17
Accuracy0.12
Timeliness0.08
Table 3. Evaluation of the original data by the EWM.
SampleNormative RateIntegrity RateConsistency RateAccuracy RateTimeliness Rate
19288859078
28590889282
38886908580
49092848875
58685929085
69488869278
78990898782
89187859180
98791888683
109389909376
Table 4. Results of entropy weight calculation.
Index NamesObjective Weight
Normative0.31
Integrity0.23
Consistency0.19
Accuracy0.17
Timeliness0.10
Disclaimer/Publisher’s Note: The statements, opinions and data contained in all publications are solely those of the individual author(s) and contributor(s) and not of MDPI and/or the editor(s). MDPI and/or the editor(s) disclaim responsibility for any injury to people or property resulting from any ideas, methods, instructions or products referred to in the content.