Article

Multi-Class Visual Cyberbullying Detection Using Deep Neural Networks and the CVID Dataset

1
School of Systems and Technology, University of Management and Technology, Lahore 54770, Pakistan
2
Department of Physics, The Manar College, Lahore 54770, Pakistan
3
School of Information Technology, Deakin University, Campus 221 Burwood Hwy, Burwood, VIC 3125, Australia
4
Department of Information Technology, Satya Wacana Christian University, Salatiga 50715, Indonesia
5
Department of Experimental Medical Science, Biomedical Center (BMC), Lund University, 22184 Lund, Sweden
*
Author to whom correspondence should be addressed.
Information 2025, 16(8), 630; https://doi.org/10.3390/info16080630
Submission received: 23 June 2025 / Revised: 21 July 2025 / Accepted: 23 July 2025 / Published: 24 July 2025
(This article belongs to the Special Issue AI-Based Image Processing and Computer Vision)

Abstract

In an era where online interactions increasingly shape social dynamics, the pervasive issue of cyberbullying poses a significant threat to the well-being of individuals, particularly among vulnerable groups. Despite extensive research on text-based cyberbullying detection, the rise of visual content on social media platforms necessitates new approaches to address cyberbullying using images. This domain has been largely overlooked. In this paper, we present a novel dataset specifically designed for the detection of visual cyberbullying, encompassing four distinct classes: abuse, curse, discourage, and threat. The initial prepared dataset (cyberbullying visual indicators dataset (CVID)) comprised 664 samples for training and validation, expanded through data augmentation techniques to ensure balanced and accurate results across all classes. We analyzed this dataset using several advanced deep learning models, including VGG16, VGG19, MobileNetV2, and Vision Transformer. The proposed model, based on DenseNet201, achieved the highest test accuracy of 99%, demonstrating its efficacy in identifying the visual cues associated with cyberbullying. To prove the proposed model’s generalizability, the 5-fold stratified K-fold was also considered, and the model achieved an average test accuracy of 99%. This work introduces a dataset and highlights the potential of leveraging deep learning models to address the multifaceted challenges of detecting cyberbullying in visual content.

1. Introduction

Every day, the number of people using social networking services (SNS) is rapidly rising. SNS is a platform that offers individuals in various industries many opportunities and provides a means of contact. Using this platform, people can discuss and debate many different topics; however, cyberbullying on social networking sites is a major problem. Every day, there is an increase in cyberbullying via various messaging and image formats; 95% of respondents in one study acknowledged having seen instances of cyberbullying. Thus, it is imperative that we address cyberbullying [1]. Cyberbullying might appear in numerous different forms, such as harassing someone on a social networking site by sending them abusive remarks, direct messages, altered photos, etc. The topic of cyberbullying has grown increasingly complex, causing several issues in people’s personal lives. To address this problem, some SNS providers ban users according to their usage patterns. Nevertheless, this remains an ongoing problem for SNS. Image classification is a domain that encompasses several disciplines to address the inherent misclassification issues.
Cyberbullying may have harmful implications, and it can damage the victim’s personality and physical appearance [2,3]. Cyberbullying results in severe mental health problems, such as poor self-esteem and anxiety, which profoundly alter a person’s capacity to live a calm life [4]. When cyberbullying is extreme, the victim may also experience suicidal thoughts, and even act on them, without the perpetrator’s knowledge [5]. The implementation of a cyberbullying filter necessitates the deployment of a powerful tool to identify and remove bullying posts, thereby providing the user with a calm and torment-free existence. Due to the increased usage of social media by teenagers and an enhanced internet access, the number of cyberbullying incidents recorded globally is growing daily. In 2018, India emerged as the nation most afflicted by cyberbullying among teenagers, trailed by Brazil and the United States. However, the unreported instances are equally as important as the overall number of cases. A Mumbai-based anti-cyberbullying initiative called CyberBAPP reports that one in three users have received threats via the internet. However, only half of the bullying occurrences are recorded. In contrast, half of the users have experienced bullying at least once, meaning that identifying cyberbullying is challenging. Given that only around 50% of these instances are recorded, more people would benefit from this filter than initially anticipated.
Most research has focused on text content analysis to detect cyberbullying using text messages and comments. These days, image sharing is a major aspect of social media platforms like Pinterest, Flickr, Instagram, and Telegram. With these developments, cyberbullying content that uses images to incite victims to engage in cyberbullying behaviors has gradually overtaken text-based cyberbullying. Therefore, it is critical to thoroughly research the components of images used in cyberbullying to enable the development of automatic detection methods. Detection approaches that employ visual cyberbullying variables such as body stance, facial expression, objects, gestures, and social aspects can be used to identify cyberbullying photographs. The process of identifying cyberbullying in images is considerably more difficult since social media data are noisy, restricted, and somewhat unstructured [6].
The statistics and the constraints of the required dataset suggest that there is an urgent need to address the problem of cyberbullying. Nevertheless, one of the main obstacles to this research is the lack of an annotated dataset. In this study, we have created an image dataset to close this gap. Numerous studies using various deep learning (DL) and machine learning (ML) methods have been published recently to address cyberbullying in textual datasets [7,8]. On the other hand, cyberbullying which includes images has been given relatively less attention. This raises a significant problem because most posts nowadays include both text and graphics, therefore these harassing posts remain undetected by the system. Thus, the primary goal of this study was to detect image-based social cyberbullying messages. The research community has recently started using transfer learning models and DL-based convolutional neural networks (CNNs) to process images and extract the desired information from them. Recent reports on research employing CNNs [9] include a wide range of topics including healthcare [10,11] and spam detection [12], in addition to the identification of cyberbullying.
Online users’ exposure to cyberbullying has skyrocketed as a result of social media platforms like Facebook, Instagram, Twitter, and many more. Bullying can occur in written or visual forms. The following section summarizes the earlier research and studies conducted on cyberbullying in the last several years.
Zhong et al. [13] investigated the detection of cyberbullying in picture-sharing networks. This research focused on early warning techniques for identifying photos that may be targeted for attack on Instagram. Using a dataset of more than 3000 photos, they examined the uploaded pictures and descriptions to enhance bullying identification in response to shared content. To categorize and identify bullying aspects in the images, various ML and DL techniques were utilized. They utilized classifiers such as Word2Vec, OFF, and BoW, along with the captions, to achieve 95% accuracy in a natural language processing task. Using DL-FS (stacked) and the captions, they obtained an overall accuracy of 68.55%.
An overview of the various forms of cyberbullying and their identification was completed by Ali et al. [14]. The review covered the characteristics and classification strategies, as well as the detection of cyberbullying and the available data sources. The article addressed the subject of cyberbullying detection, which this review study also examined. The methods considered in the paper heavily relied on machine learning classifiers and natural language processing (NLP). To decrease the number of trolling incidents, a system was proposed by Hitkul et al. [15] which was designed to recognize the photographs most prone to trolling and alert the user before the material was posted online. It was found that the traditional (i.e., state-of-the-art) image classification algorithms were not valuable in this context. The test accuracy for VGG16 was 61.81, while the validation accuracy for Inception V3 was 65.62. Therefore, these results were not deemed adequate.
Talpur and O’Sullivan [16] developed a supervised machine learning strategy for identifying and multi-classifying the severity of cyberbullying on Twitter. The dataset was created using text extracted from the tweets. For instance, they employed naïve Bayes, KNN, decision trees, random forest, and support vector machine algorithms to leverage embeddings for sentiment, lexicon characteristics for lexicon, and PMI-semantic alignment. For identifying bullying, the accuracy ranged from 89% to 91%; the models with the highest accuracy were SVM and random forest.
A DCNN method was presented by Krizhevsky et al. [17] to locate objects in pictures, and better characteristics for object detection were reportedly extracted using this method. To identify abusive comments, Anand and Eswari [18] presented the LSTM with and without word GloVe embeddings, focusing on websites that circulate these specific communications with a view to blocking the websites to enhance the safety of conversations on online platforms. The Kaggle dataset is utilized in this study to categorize different types of harmful comments. The text mining method used to organize conversations using a term-based strategy was presented by Li et al. [19]. Notably, several problems have been identified with the current approaches, including issues with synonymy and polysemy. Term-based approaches have not outperformed pattern-based processes for many years; however, large datasets are incompatible with these techniques, which remains a significant challenge in text mining.
A DL model was employed by AlAjlan et al. [20] to detect cyberbullying. They employed feature engineering and feature selection approaches to obtain the features from the data. They used a 39,000-tweet Twitter dataset, from which redundant entries were eliminated during the cleaning process. The algorithm was evaluated on the detection of 2700 bullying and 6300 non-bullying tweets after being trained using 9000 bullying and 21,000 non-bullying tweets. With a 95% accuracy, their model outperformed the SVM by a wide margin. A dataset including 69,874 tweets was employed by Banerjee et al. [21]. Utilizing GloVe word embedding, they transformed the words into vectors. The data preparation step involved removing the accentuation marks around the stop words and converting them to lowercase. Using a CNN-based DL algorithm to identify the bullying posts, they obtained a 93.97% accuracy rate on the processed data.
Using text mining techniques, Acı et al. [22] developed an algorithm to automatically identify instances of cyberbullying on social networks. They experiment with several classifier types, utilizing feature selection methods to achieve the best results. Three distinct social networks were used to obtain the dataset: YouTube, Myspace, and Formspring. The dataset was used to establish two classes, namely positive and negative. An XML file contained 13,158 conversations from the Formspring.me dataset; 892 of those messages addressed cyberbullying positively, while the remaining 12,266 dealt with cyberbullying negatively. Of the 1753 messages in the Myspace sample, 357 were positive, and the remaining 1396 were negatively tagged. The YouTube dataset consisted of 3464 messages from various individuals, with 417 messages belonging to the positive class and the remaining 3047 messages belonging to the negative class. For every dataset, the F-measure value was more than 0.90 for two classifiers, namely, SGD and MLP.
A unified arrangement of text and images was employed by Kumari et al. [23], aiming for the ultimate creation of cyberbullying-free social media. A total of 1100 photos were manually collected for the study from various sources including Google, Instagram, Twitter, and Facebook. The CNN-based algorithm classified each image and remark as either bullying or not, producing a weighted F1-score of 0.68. Gomez et al. [24] found hate speech to be almost identical to cyberbullying regarding the F-score. Two different methodologies were used: multimodal and unimodal. They employed the InceptionV3 framework using a 2048-dimensional feature vector and then a 150-dimensional vector for the picture text obtained via OCR. The multimodal dataset contained 150,000 text and photographic tweets. The LSTM architecture was the source of the tweet text. Inputs such as picture text, image text, and tweet text were fed into the models. With just text input, the LSTM model produced an accuracy rating of 68.30% and an F1-score value of 0.703. Analogous to the LSTM algorithm achieved with text data alone, the algorithm obtained an F1-score value of 0.701 and a 68.2% accuracy for the joint input characteristics, i.e., tweet text, image text, and images.
A CNN-based text classification model was presented by Chen et al. [25] for the de facto verbal aggressiveness dataset. The emotions and feelings were not taken into account when Facebook comments and Tweets were manually added to the databases. In addition to the hand-labeled remarks, comment information was gathered from social networks using the “sentiment140 corpus.” Following the alteration, the tweet’s polarity was classified as aggressive or non-aggressive. During preprocessing, the words were made lowercase. The usernames were eliminated, followed by the ‘@’ symbol and the stickers from the hash topics. Using the TF-IDF method, the features were extracted. The DL-based CNN model achieved the best results, with an accuracy of 0.92 and an AUC value of 0.98.
Kumari et al. [26] proposed a strategy to retrieve characteristics from photos and text using DL approaches to determine whether an image was cyber-aggressive. The binary particle swarm optimization (BPSO) approach reduced the number of features. A manually generated multimodal dataset comprising 3600 pictures and their corresponding comments was assembled. Most images were symbolic and fell into three categories: low, medium, or extreme aggression. The VGG16 network, combined with a three-layered CNN and the BPSO algorithm, was used in this model to optimize the results. The VGG16 network processed the images. The text features were delivered to several classifiers to categorize the images into predetermined categories after being integrated into the BPSO for optimal feature selection. With an F1-score of 0.74, the random forest classifier was the best.
Although several studies have been conducted on cyberbullying detection, as summarized in Table 1, there is still room for improvement regarding both the image-based datasets and the model performance, especially for multi-class cyberbullying detection. Furthermore, several approaches have reported moderate results for purely image-based tasks. The proposed study contributes to the classification of cyberbullying in several ways:
  • We have compiled a dataset from real-world environments, ensuring enhanced relevance and authenticity.
  • We have considered data augmentation techniques to increase the dataset’s sample size and improve the model’s performance.
  • We have implemented patch-based deep learning models and convolutional neural network (CNN)-based pretrained models to enhance the categorization accuracy.
  • To enhance the model generalization, we have employed transfer learning techniques and fine-tuning strategies.
Table 1. Cyberbullying literature summary.
StudyDataset DescriptionDataset TypeModelResults
Zhong et al.,
2016 [13]
A dataset of more than 3000 photos from Instagram was created, including uploaded photos and descriptions.Text + ImagesWord2Vec, OFF, BoW, and captions, DL-FS (stacked)Overall accuracy of 68.55% with DL-FS (stacked)
Kumari et al., 2020 [23]A dataset of 2100 images was manually collected from various sources, including Google, Instagram, Twitter, and Facebook.ImagesMultilayered CNN modelWeighted F1-score of 0.68
Kumari et al., 2021 [26]Manually generated dataset consisting of 3600 pictures with three levels of aggression categories: low, medium, and extreme.Text + ImagesVGG16 with a 3-layer CNN and BPSOF1-score = 0.74
Gomez et al., 2020 [24]A multimodal dataset consisting of 150,000 tweets with both text and photo data.Text + ImagesInceptionV3 with OCR, LSTM for tweets processingAccuracy = 0.73.2
AUC = 0.683
Al-Ajlan et al., 2018 [20]A 39,000-tweet Twitter dataset, with 9000 bullying tweets and 21,000 non-bullying tweets considered.TextCNN-CBAccuracy = 0.95
Pericherla et al.,
2025 [27]
The dataset was originally collected from public sources, including Facebook, Twitter, and Instagram, and consists of 19,300 images.ImagesCB-2DCNN,
CB-YOLO
CB-2DCNN:
Acc = 0.9432,
F1-score = 0.9592
CB-YOLO:
Acc = 0.9785
F1-score = 0.9720
Roy et al.,
2022 [28]
A total of 3000 images were collected from Google searches, and some were taken from the dataset MMHS150K.ImagesVGG16,
Inception V3
Acc = 0.86
Acc = 0.89
Pericherla et al.,
2024 [29]
19,300 images were manually annotated as either cyberbullying or not cyberbullying, which were originally collected from Facebook, Twitter, and Instagram by Vishwamitra et al. [30]ImagesCNBD combining Binary Encoder Image Transformer (BEiT) and Multi-layer perceptron (MLP)Acc = 0.9630,
Precision = 0.9616, Recall = 0.9630

2. Methodology

This section includes the description and preprocessing of the dataset, the methodologies we utilized, and the in-depth details of the network. Figure 1 presents an abstract overview of the suggested study.

2.1. Dataset

For the proposed study, a cyberbullying visual indicators dataset (CVID) was created using real-world examples. Four types of cyberbullying were chosen for the proposed work, and approximately 150 images of each type were captured in a real-world environment. The complete dataset consisted of 781 collected images belonging to four different classes, labelled as abusing (0), curse (1), discourage (2), and threat (3). Unlike the other datasets where manual annotation was required, the images in this study were captured using a typical smartphone. The photos were categorized into four classes—abuse, curse, discourage, and threat—at the time of capture based on the visual context, and no separate annotation was required in this case. Different environmental factors including indoor, outdoor, sunny, and cloudy conditions were considered when collecting the data to increase the diversity of the dataset. Furthermore, both genders, i.e., male and female, were also included in the captured images. An overview of the samples belonging to the different classes is available in Figure 2.

2.2. Dataset Preprocessing

The CVID dataset was created using different scenarios from real-world environments using a smartphone. The CVID dataset required extensive and careful preprocessing to maintain the image quality for classification. In this regard, all the images were first resized to 224 × 224 to ensure a uniform image scale, enabling them to be classified using a deep learning model. Next, all the images were normalized to attain pixel values ranging from 0 to 225. This ensures consistency in the scale and distribution of the input images, facilitating better algorithm learning. When the input data are normalized, the training process becomes more stable and converges more quickly. Without normalization, those features with wider number ranges might be more prevalent during learning, causing the model to become biased toward those features. Normalization ensures that every feature makes an equal contribution to the learning process.

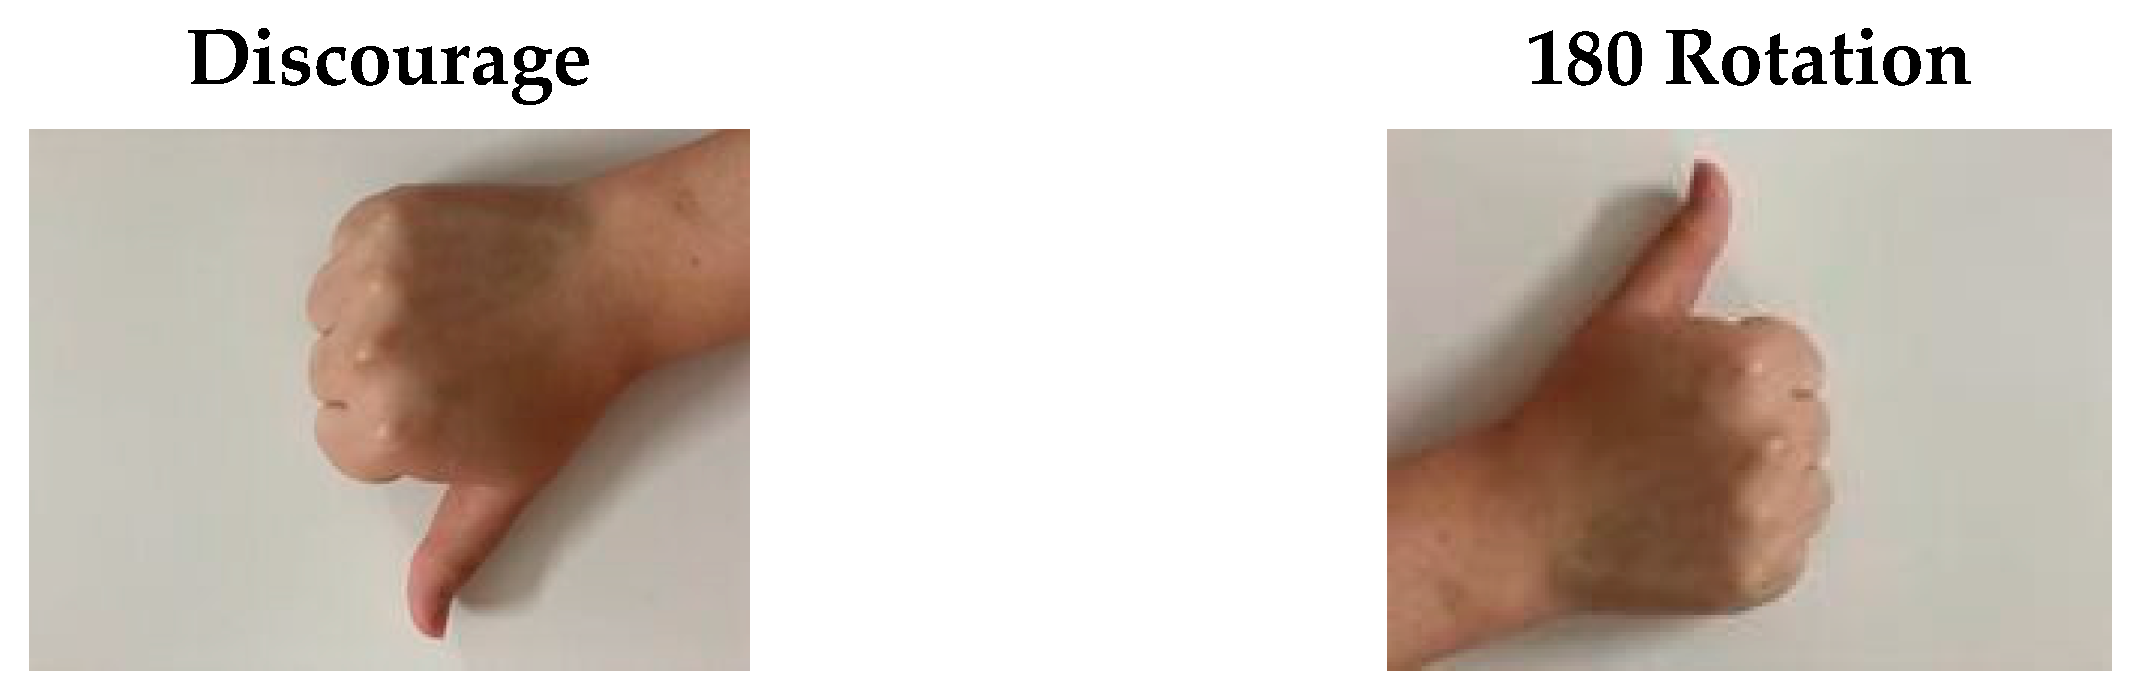
2.3. Dataset Augmentation

Data augmentation expands the number of data samples available for the deep learning models. Overfitting occurs when an algorithm performs well on the training set but struggles with the new, unseen data. We can reduce overfitting by creating new data samples that are slightly varied from the original ones. Standard methods of data augmentation include rotation, zooming, flipping, and adding noise to the original samples. These variations enable the model to recognize consistent patterns despite minor changes, thereby improving its generalization abilities. We considered random rotations of 90, 180, and 270 degrees, as well as flipping, for the augmentation of the CVID dataset. However, the rotation augmentation technique is excluded for images in the discourage class, as the rotation can convert the discouraging image into an encouraging image (see Figure 3). Table 2 provides the details of the samples in each class before and after augmentation.

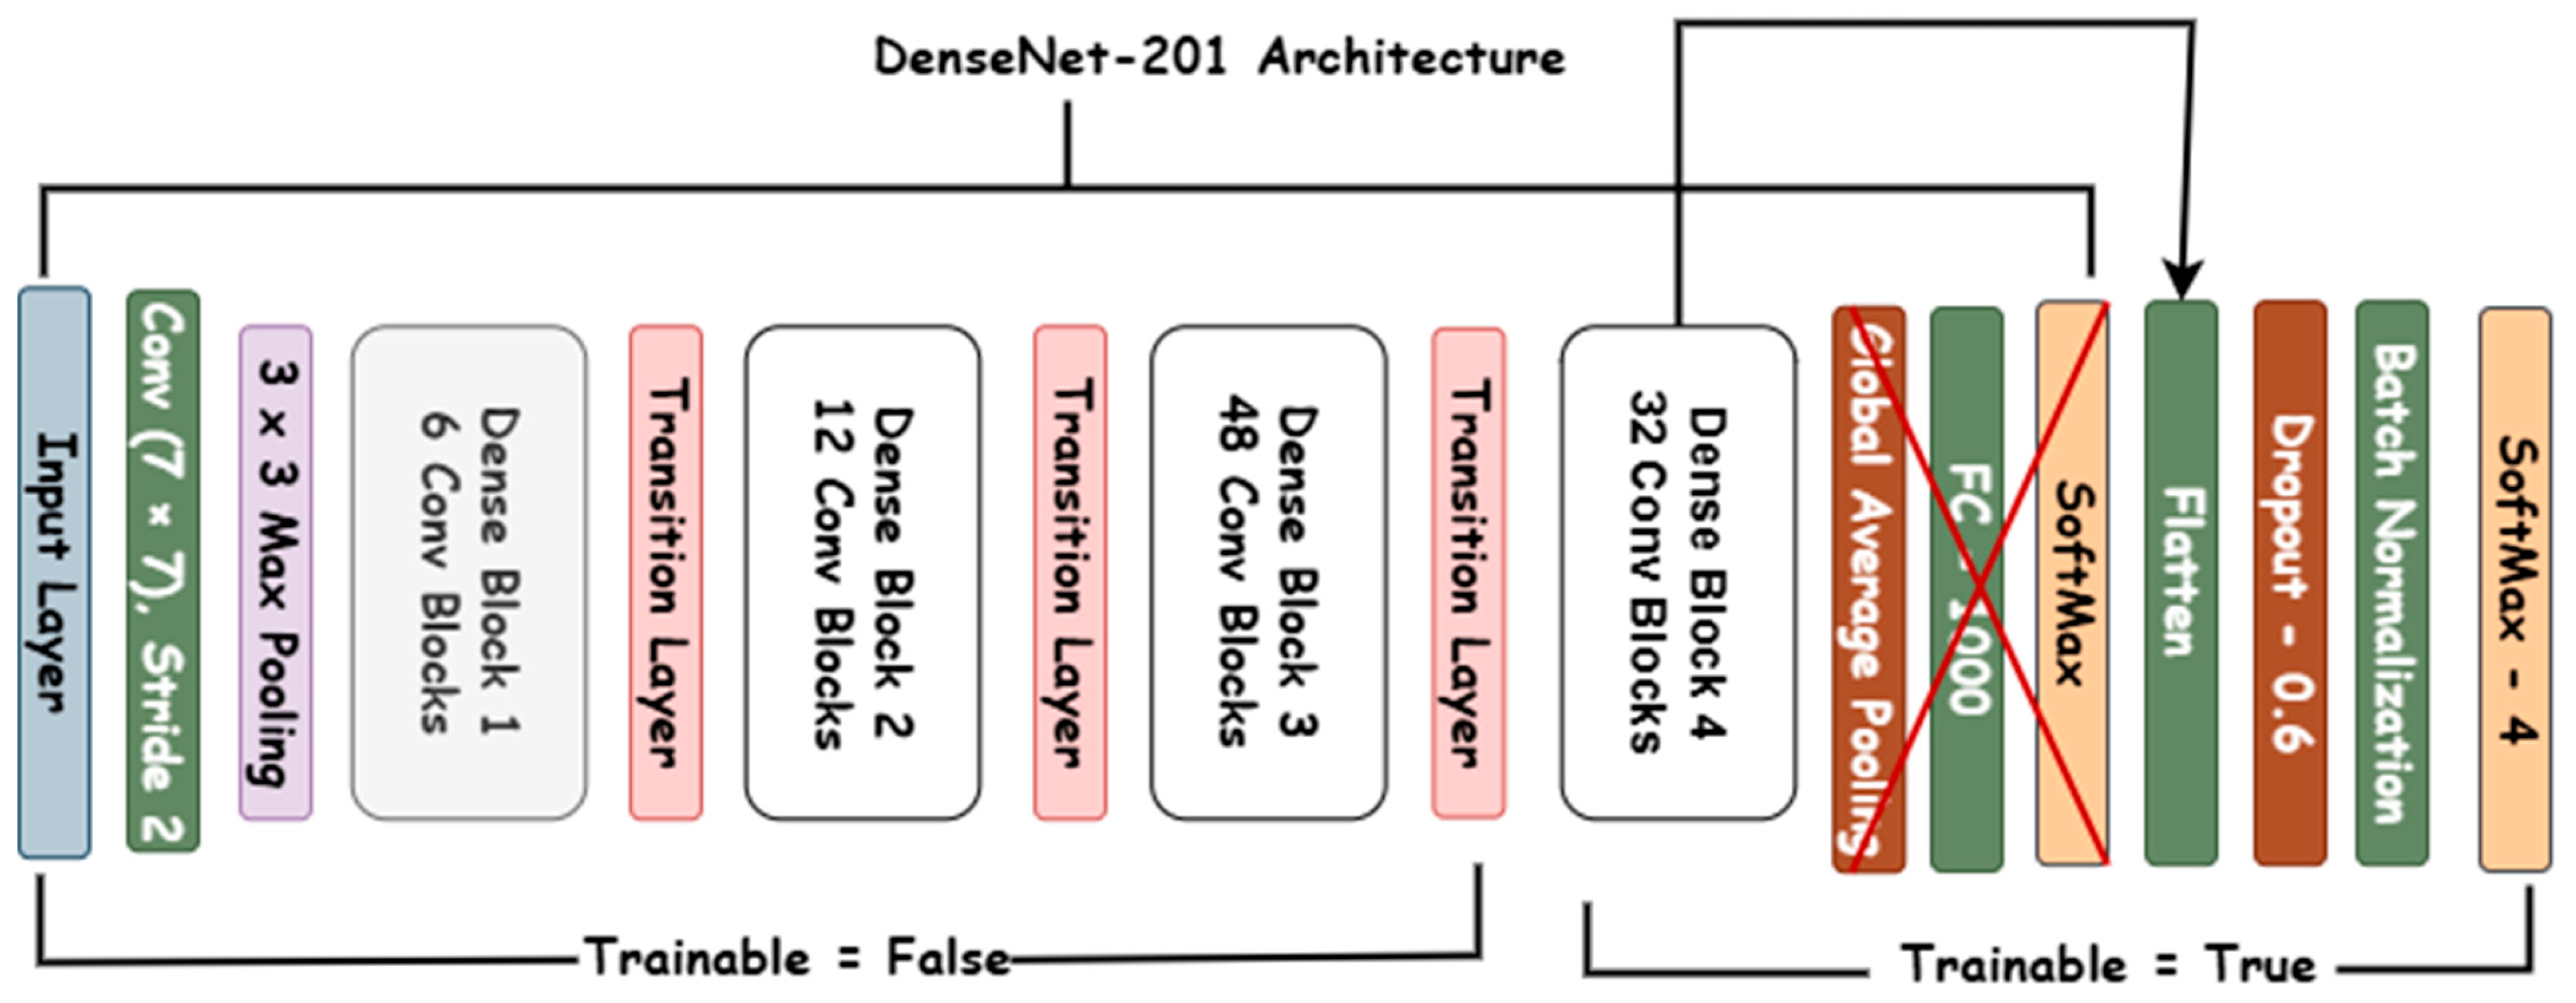
2.4. Proposed Fine-Tuned Model (D-Net)

The CNN-based model was proposed using a transfer learning-based technique for categorizing sign-based cyberbullying. This approach has become an invaluable strategy in deep learning, especially when data are limited. It substantially reduces the training time and computing resources needed by utilizing pretrained models to adapt knowledge from one domain to another. Furthermore, it enhances performance and helps to improve accuracy when data are scarce. This study used various deep learning models to achieve the desired outcome, applying the transfer learning technique to optimize performance. DenseNet201 emerged as the most effective model for classifying sign-based cyberbullying. For the proposed D-Net model, the original architecture of DenseNet201 was slightly modified by removing the global average pooling layer, the fully connected layer (FC-1000), and the SoftMax layer at the end of the model. In their place, three additional layers were introduced: a flattened layer, a dropout layer with a rate of 0.6, and a batch normalization layer. Finally, a SoftMax layer with four neurons was added as the output layer to facilitate classification. The revised architecture of the suggested algorithm is presented in Figure 4.
The proposed D-Net model was fine-tuned by adjusting various hyperparameters, including optimizers, learning rates, loss functions, and batch sizes. To evaluate the impact of these hyperparameters, the model was trained over 30 epochs for each configuration using the training set; see Table 3 for the hyperparameters and their values. Additionally, 20% of the training data was reserved for validation purposes, ensuring that the model’s performance was carefully monitored throughout the process.

3. Results and Discussion

This section includes a detailed description of the performance evaluation metrics, the experimental protocols, and the outcomes achieved using the suggested methodology.

3.1. Evaluation Measures

Evaluation measures are crucial for understanding the performance of the algorithms related to machine learning and deep learning, offering valuable insights into their overall effectiveness. These metrics are critical in ML, DL, and statistical research, as they provide a clear and comprehensive assessment of a model’s capabilities. In this research, we concentrated on various significant evaluation measures to accurately measure the efficacy of our proposed model.
Accuracy: This metric assesses the overall accuracy of the algorithm’s performance by calculating the ratio of accurately categorized samples to the total count of instances, see Equation (1). Although accuracy is a valuable indicator, it may not be adequate by itself, particularly in scenarios where the datasets are imbalanced or when several error types have erratic impact levels.
A c c u r a c y = T P + T N T P + T N + F P + F N
Precision: Precision measures the capability of an algorithm to correctly identify the true samples from those it has predicted as positive instances. It is calculated by evaluating the number of true positives versus the sum of overall positives predicted by the algorithm, highlighting the reliability of the algorithm’s positive predictions, see Equation (2).
P r e c i s i o n = T P T P + F P
Recall: Recall assesses the model’s capacity to correctly separate the positive instances from the actual positive cases. It highlights how well the model captures the whole range of positive predictions and is computed as the ratio of actual positives to the total of actual positives and false negatives, see Equation (3).
R e c a l l = T P T P + F N
F1-score: The F1-score is a balanced statistic that considers both measures: accuracy and recall. It is calculated as the harmonic mean of these two measures; see Equation (4). It is valuable when working with uneven category distributions, or when giving equal weight to minimizing both types of errors is important. The measure has a value range between 0 and 1 inclusively, where 1 indicates the highest attainable result.
F 1   S c o r e = 2 × P r e c i s o n × R e c a l l P r e c i s i o n + R e c a l l
The ratio of accurate predictions (true positives and negatives) to all forecasts, irrespective of class, determines the accuracy in multi-class categorization. However, precision, recall, and F1-scores are evaluated using weighted averages. This method addresses class imbalances by giving each class a weight determined by its percentage of the dataset. Doing so offers a more effective and comprehensive evaluation of the algorithm’s performance among the various categories.

3.2. Experimental Setup

The experiments for this study were conducted within a Python virtual environment. The models were trained and evaluated using a system running Ubuntu 18.04 as the operating system. The system and virtual environment were equipped with the following resources: 32 GB of RAM, Python version 3.8, TensorFlow-GPU 2.3.0, an NVIDIA GPU with version 11.0, and a CPU operating at 3.10 GHz.

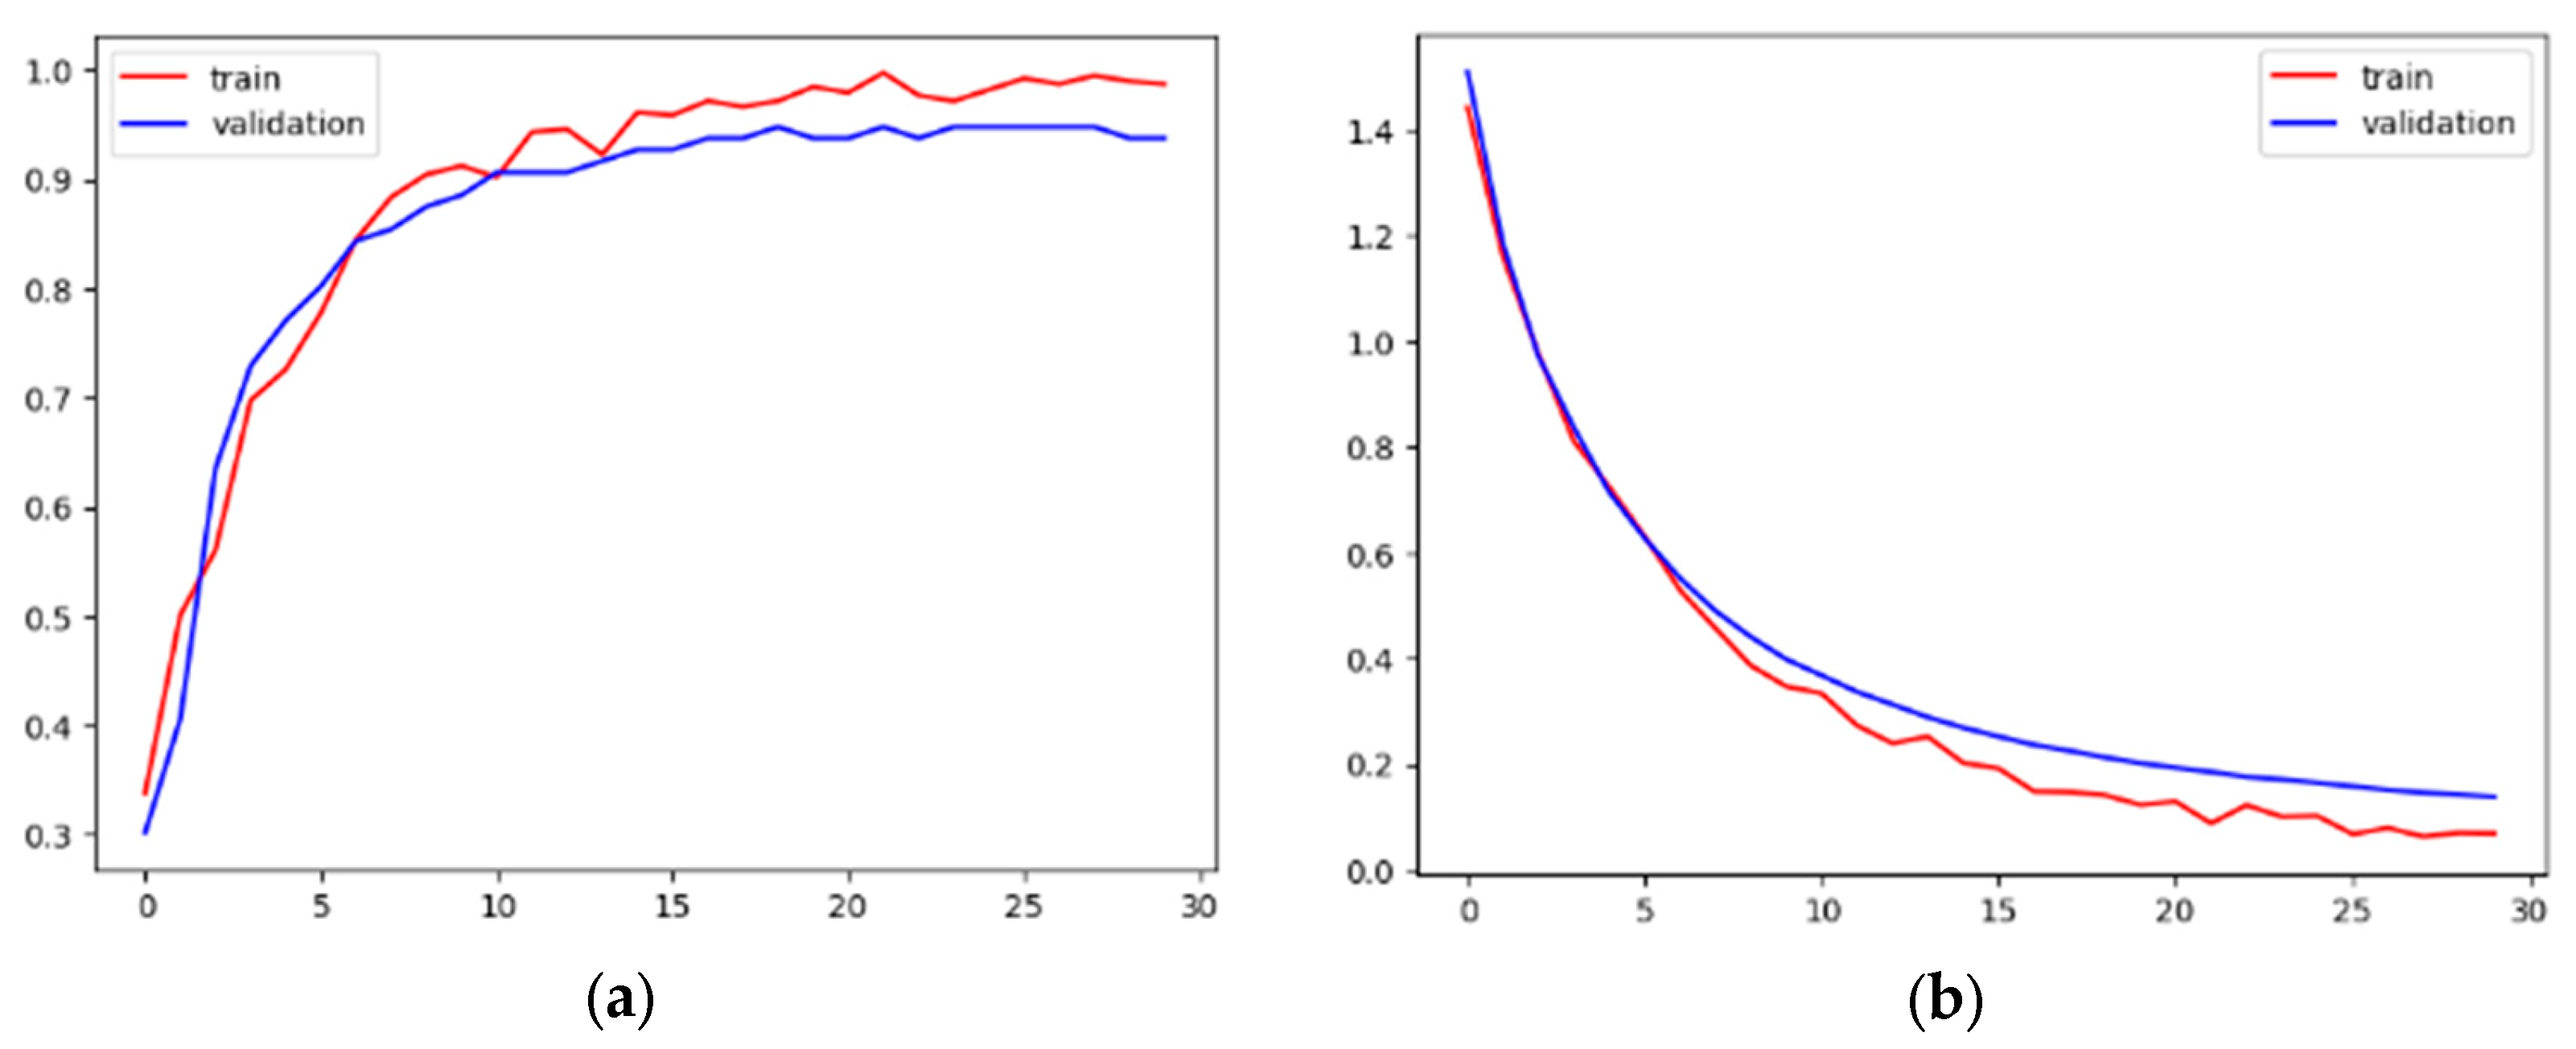
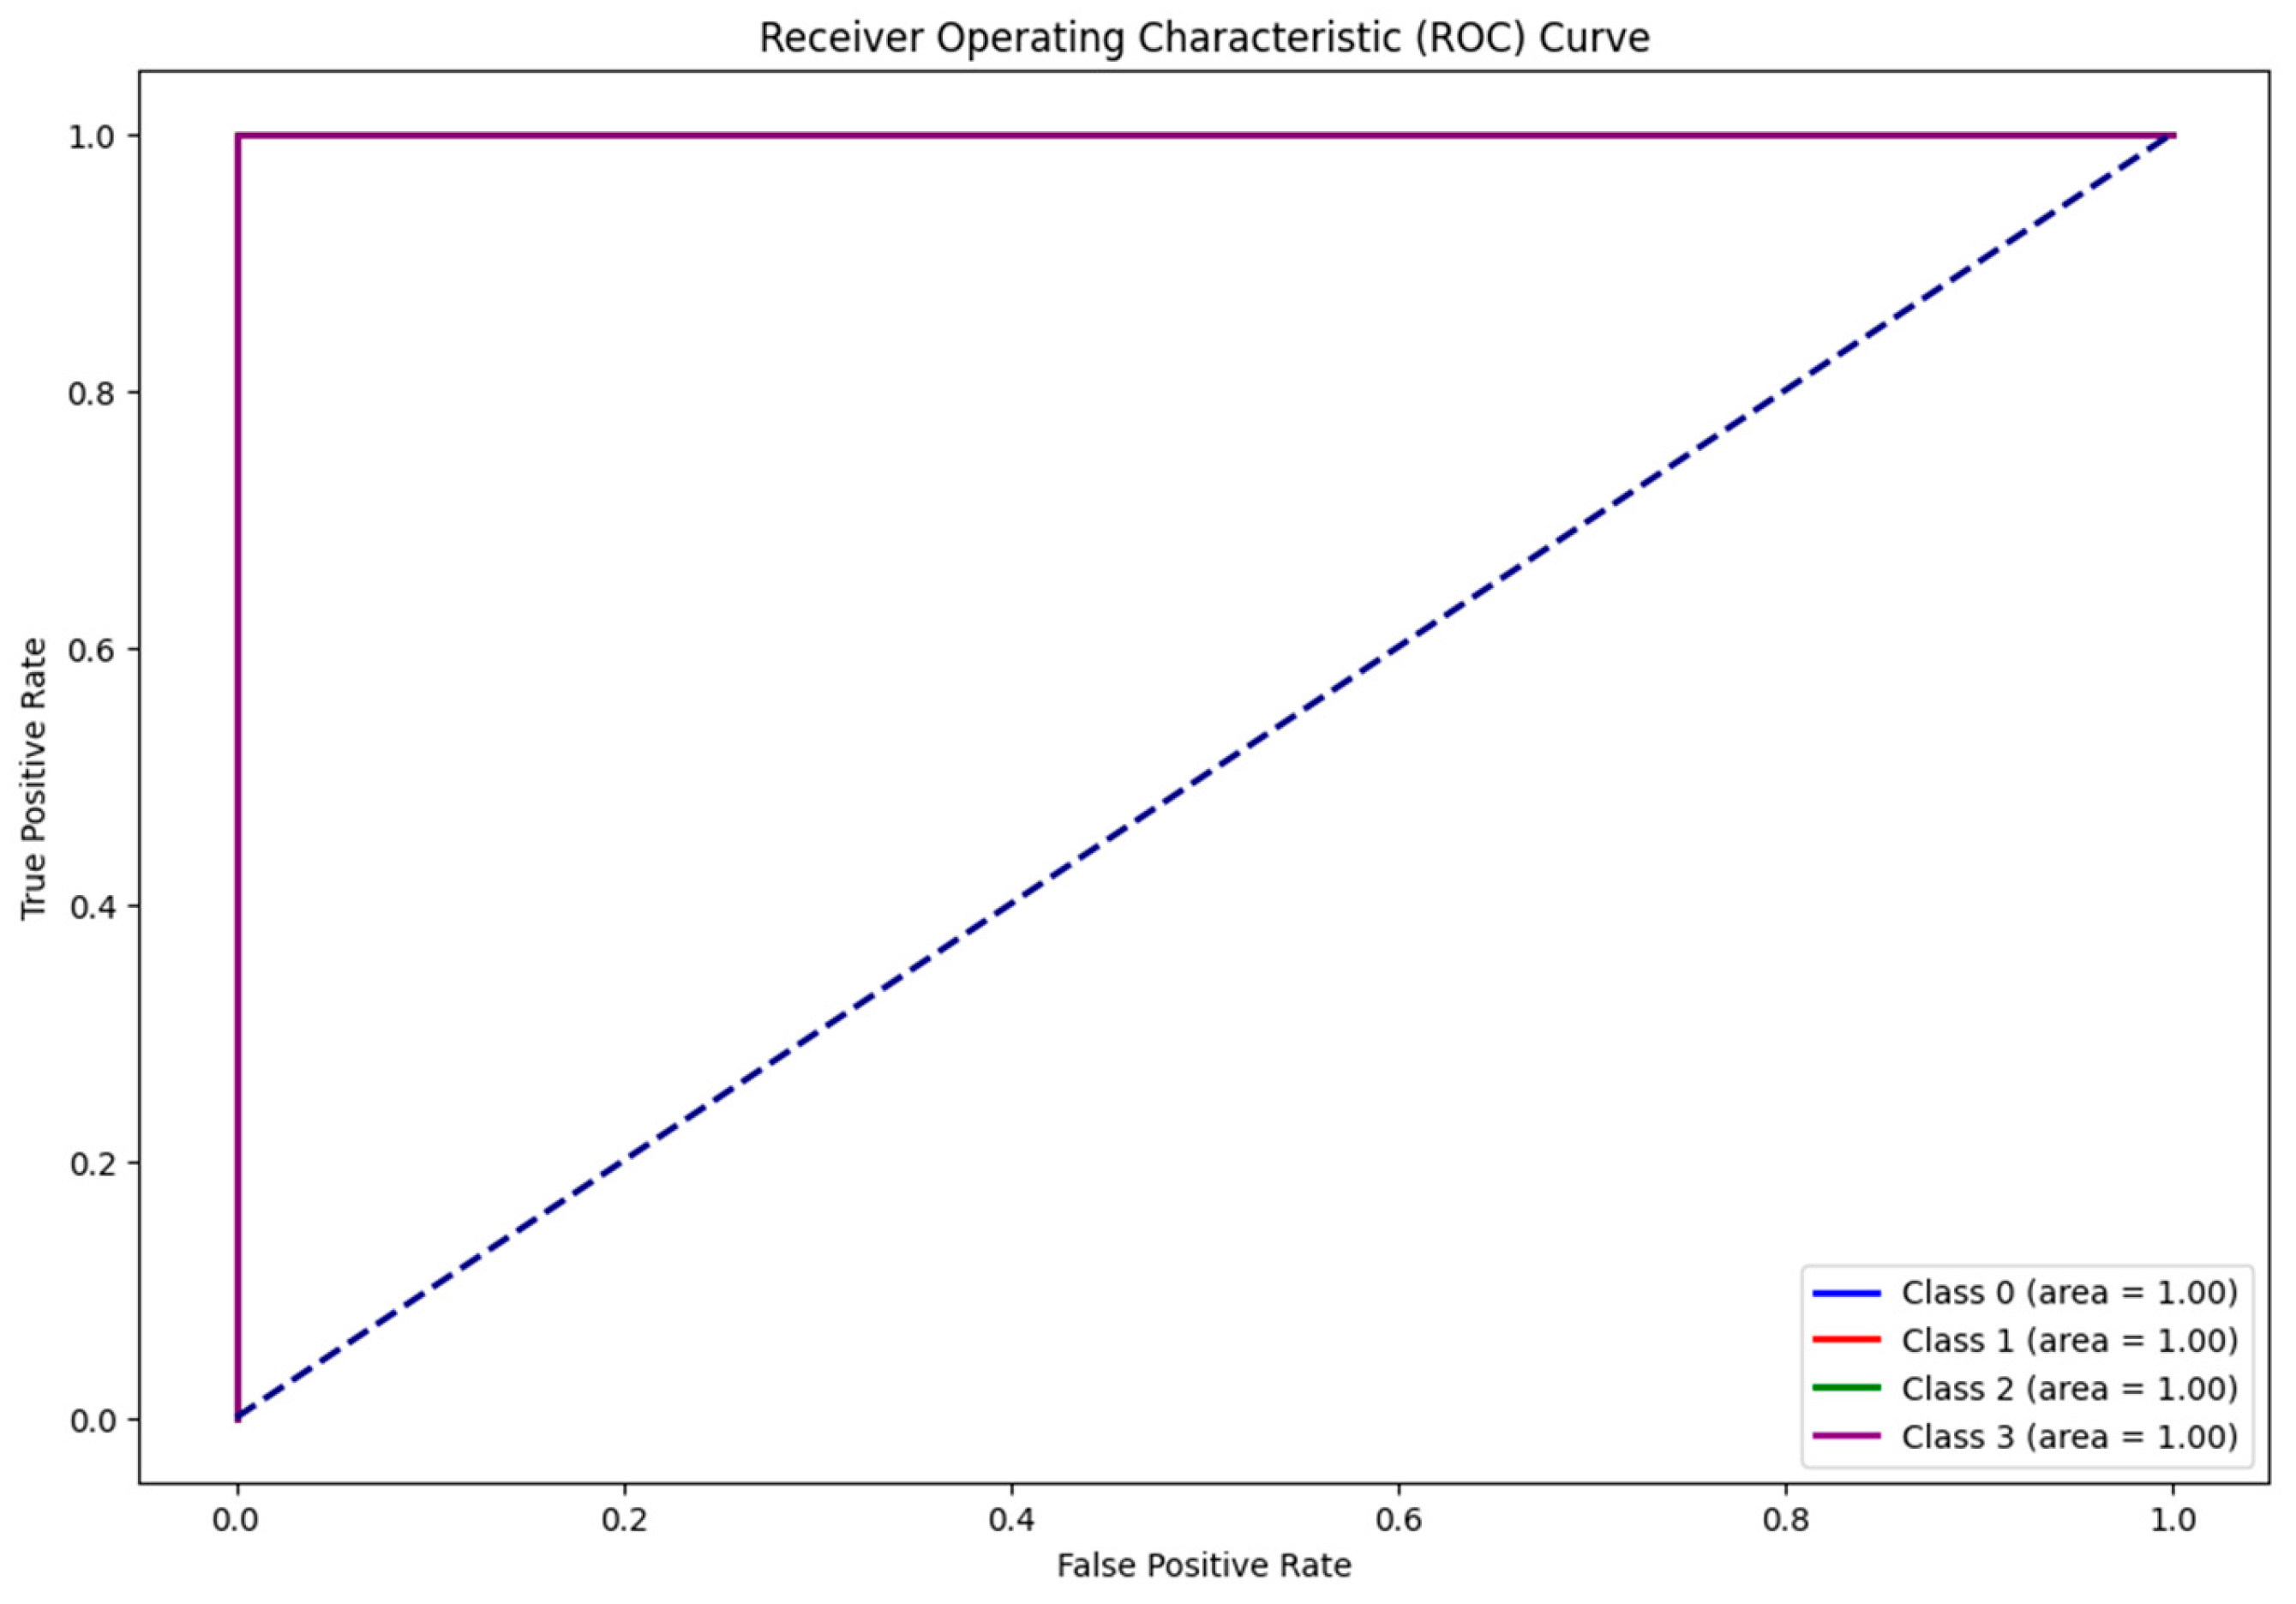
3.3. Proposed D-Net Model Results

The proposed D-Net model, based on DenseNet201, was trained using 664 training images before augmentation and 1924 training images after augmentation. Using the RMSprop optimizer and sparse categorical cross-entropy as the loss function, the algorithm was trained over 30 epochs with a learning rate of 0.001. Additionally, the validation set, comprising 10% of the training set’s images, was used to evaluate the training performance of the algorithm. Test sample 119 was used to evaluate both models (trained with or without augmented images) after the training process was complete. The trained model achieved 100% training accuracy, 94% validation accuracy, and 49% test accuracy for the proposed model, which was trained using the training images without augmentation. Later, the proposed model demonstrated 100% accuracy in training, 99% in validation, and 99% in testing for the algorithm trained using the augmented training images. Figure 5 and Figure 6 present the accuracy and loss metrics throughout the training process for the standard and augmented datasets, respectively. The slight difference between the training and validation curves in all figures shows that the model is performing consistently well on both the training and validation data. These plots demonstrate that the models effectively avoid overfitting, as evidenced by the close alignment of the training and validation curves.
The complete classification report for both models is presented in Table 4. The performance of the threat class is poor in the absence of data augmentation, with concerns that the model fails to classify any samples in this class. However, after augmentation the performance significantly increased, resulting in efficient and accurate classification in all classes, including the threat class. The poor performance of the model without augmentation highlights the model’s dependency on training data diversity. Data augmentation plays a crucial role in preventing overfitting, improving class balance, and enhancing the model’s generalizability with limited original samples.

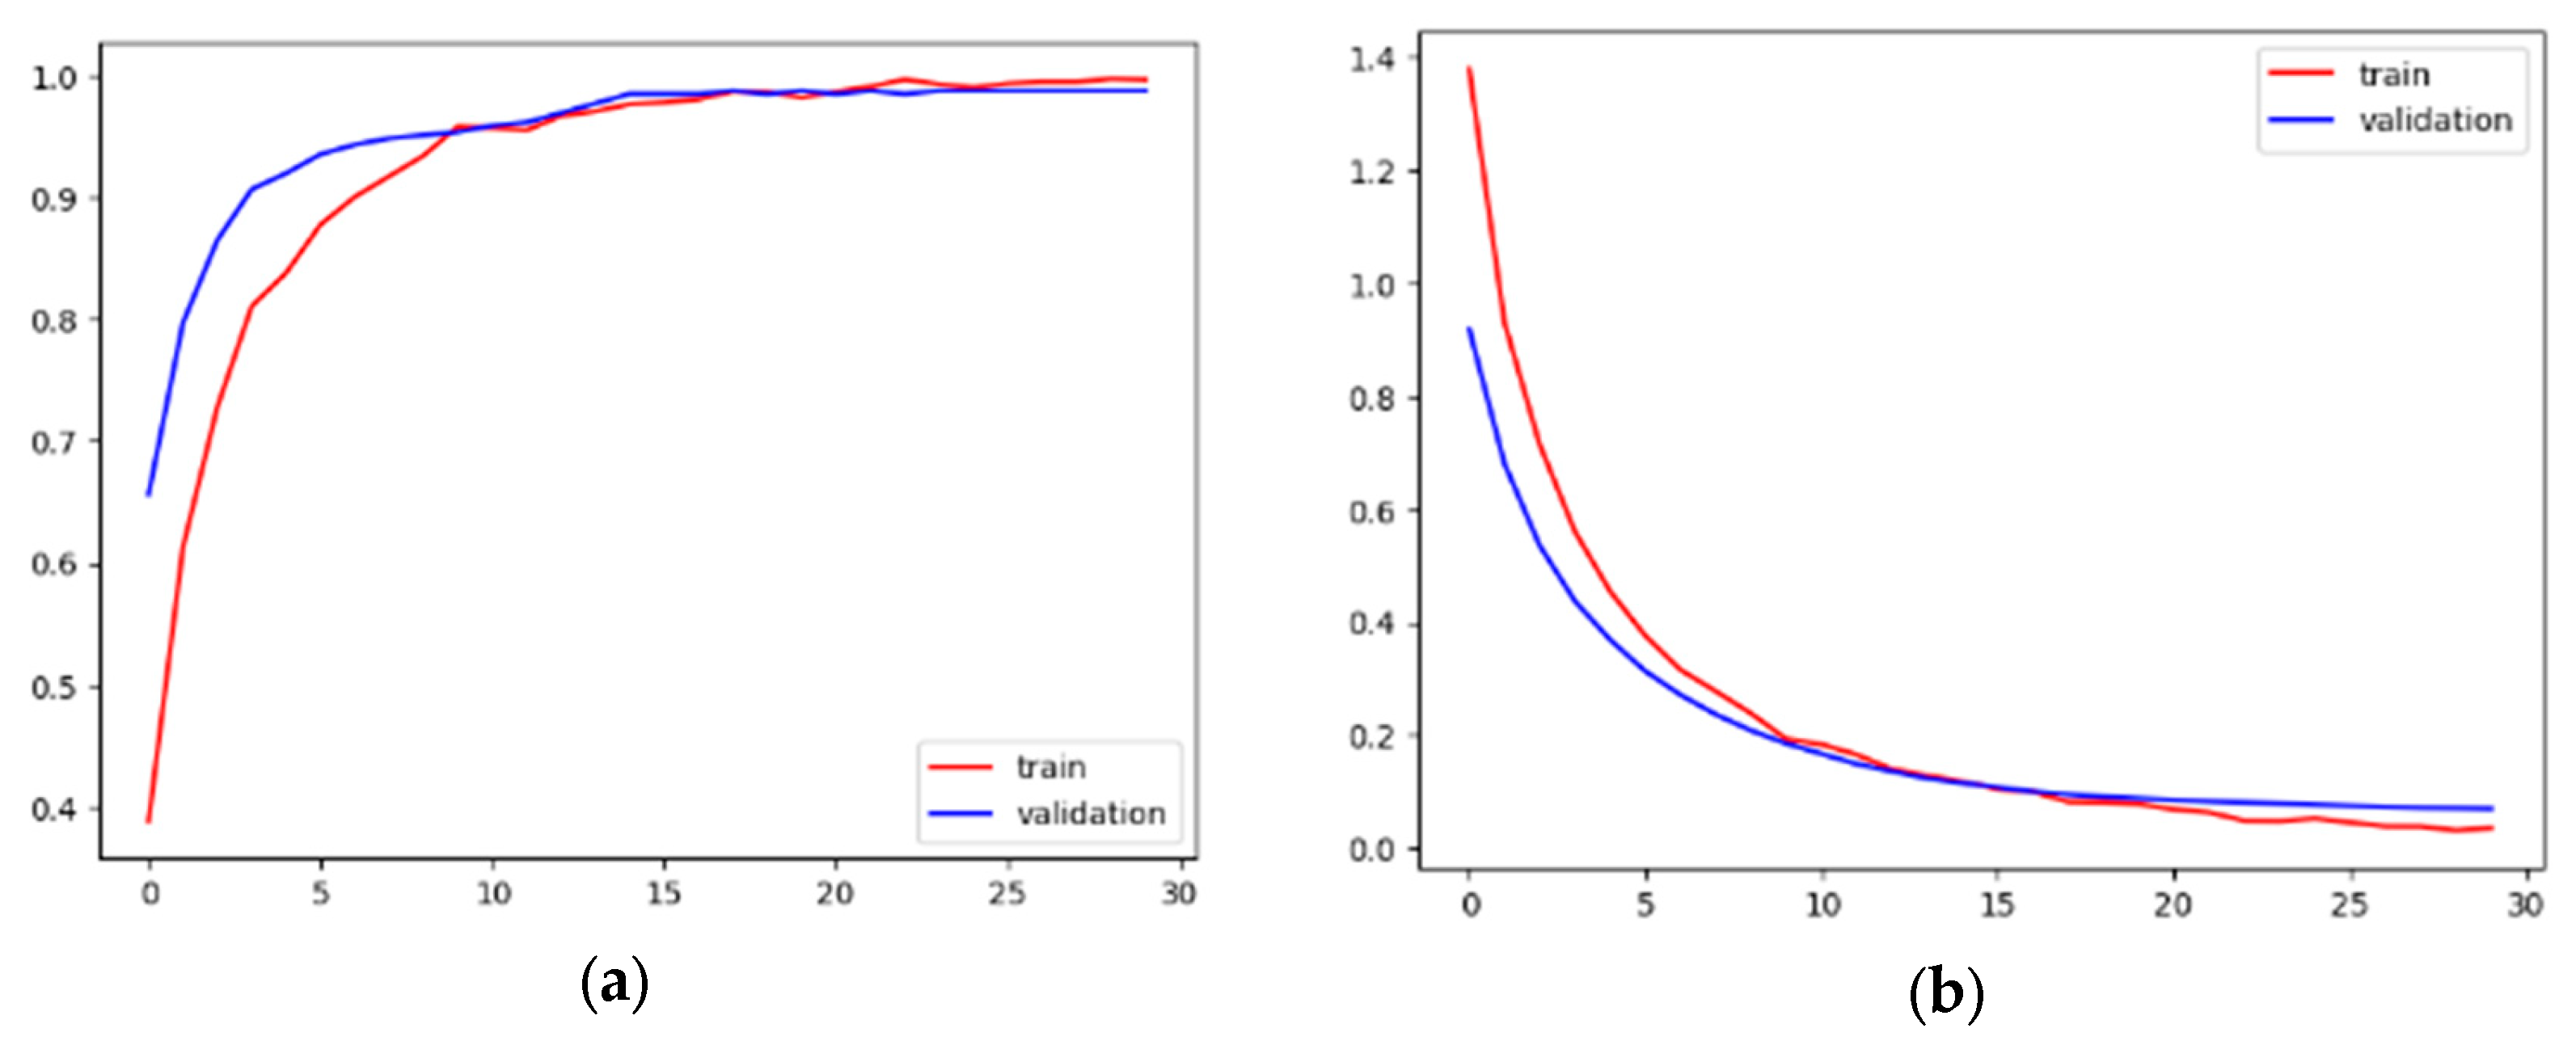
3.4. Robustness of the Proposed Model

To confirm the significance of the suggested algorithm, the same hyperparameter settings were utilized to train the other deep learning algorithms. The VGG16, VGG19, Inception V3, and MobileNetV2 models were trained using the augmented training set. For all the models, the output layer was switched with a fully connected layer (four neurons) to forecast the type of cyberbullying. Further, a vision transformer (ViT) algorithm was also trained using the same dataset in this study. The results generated by the proposed algorithm remain noteworthy when compared to other trained models, as demonstrated by the outcomes of all the algorithms presented in Table 5.
Detecting cyberbullying through sign-based images has practical benefits, such as making online spaces safer by identifying harmful content early on and helping to protect individuals from harassment. On the other hand, this research deepens our understanding of how AI and deep learning can address social issues, particularly by leveraging visual data in innovative and meaningful ways. The confusion matrix and the receiver operating characteristic (ROC) curve for the proposed model are shown in Figure 7 and Figure 8, respectively.
To demonstrate the generalizability of the proposed model, we also conducted experiments using 5-fold stratified K-fold cross-validation, and the model achieved an average test accuracy of 99% (see Table 6).

3.5. Practical Implications

This study expands on cyberbullying research by categorizing four types of harm (abuse, curse, discouragement, threat) and validates the efficacy of advanced transfer learning models, specifically DenseNet201. It enriches the theories of online classification and the challenges of ethical and accurate detection methods.
This study addresses the significant challenges of cyberbullying on social media sites by introducing a sign-based image dataset (CVID) with four classes: abuse, curse, discourage, and threat. A transfer learning-based model named DenseNet201 was fine-tuned effectively for the identification of cyberbullying signs. Different CNN-based pretrained models, including VGG-16 and MobileNet, are considered in this study to show the robustness of the proposed model. The proposed model achieved a test accuracy of 99% with data augmentation. The model can be easily deployed on resource-constrained devices such as smartphones because the proposed model is based on DenseNet201, a lightweight, pretrained architecture. This model can also be integrated into social or personal sites for safer online interactions.

4. Conclusions

In this study, we propose a novel methodology for cyberbullying detection by introducing a dataset of visual images categorized into four classes: abuse, curse, discourage, and threat. Through extensive experimentation, we evaluated the performance of several state-of-the-art deep learning models. VGG16 and VGG19 achieved accuracies of 95.38% and 97.40%, respectively. Additionally, Inception V3, MobileNetV2, and Vision Transformer achieved accuracies of 94%, 95%, and 87%, respectively. The proposed D-Net model demonstrates the most effective performance, reaching an accuracy of 99.14%. The D-Net model outperforms other models due to its ability to extract hierarchical features and complex patterns from images, making it particularly well-suited for the challenging task of identifying the subtle cues associated with cyberbullying.
This work can be extended in several directions, including ablation experiments. One key direction that can be considered is the inclusion of night images in the dataset, which will help to address the difficulties associated with changes in illumination that can hinder the determination of certain features in visual content. Moreover, the observed results could be improved by increasing the depth of the dataset and refining the existing models, which could further improve the effectiveness and generalizability of the detection system. To enhance the robustness of the dataset, evaluation methodologies [31] may be incorporated. For the safety awareness of deep learning models in visual cyberbullying detection, the knowledge management principles informed by hazard analysis frameworks [32] could be considered in the future. Finally, this research lays the groundwork for developing more comprehensive tools to combat visual cyberbullying across diverse online environments.

Author Contributions

Conceptualization, M.A.A., Z.S., A.A., L.A., H.M., C.D. and M.K.; Methodology, M.A.A., Z.S., A.A., L.A., H.M., C.D. and M.K.; Validation, M.A.A., Z.S., A.A., L.A., H.M., C.D. and M.K.; Data curation, M.A.A., Z.S., A.A., L.A., H.M., C.D. and M.K.; Writing—original draft, M.A.A., Z.S., A.A., L.A., H.M., C.D. and M.K.; Writing—review & editing, M.A.A., Z.S., A.A., L.A., H.M., C.D. and M.K. All authors have read and agreed to the published version of the manuscript.

Funding

This research received no external funding.

Institutional Review Board Statement

Not applicable.

Informed Consent Statement

Not applicable.

Data Availability Statement

The dataset used in this study will be made available upon reasonable request for research purposes only, excluding the threat class due to privacy concerns.

Acknowledgments

During the preparation of this manuscript, the authors used ChatGPT-4 (https://chat.openai.com/, accessed on 1 February 2025) for English correction. The authors have reviewed and edited the output and take full responsibility for the content of this publication.

Conflicts of Interest

The authors declare no conflicts of interest.

References

  1. Ozcan, S.; Homayounfard, A.; Simms, C.; Wasim, J. Technology Roadmapping Using Text Mining: A Foresight Study for the Retail Industry. IEEE Trans. Eng. Manag. 2022, 69, 228–244. [Google Scholar] [CrossRef]
  2. Smith, P.K.; Mahdavi, J.; Carvalho, M.; Fisher, S.; Russell, S.; Tippett, N. Cyberbullying: Its nature and impact in secondary school pupils. J. Child Psychol. Psychiatry 2008, 49, 376–385. [Google Scholar] [CrossRef]
  3. López-Vizcaíno, M.F.; Nóvoa, F.J.; Carneiro, V.; Cacheda, F. Early detection of cyberbullying on social media networks. Future Gener. Comput. Syst. 2021, 118, 219–229. [Google Scholar] [CrossRef]
  4. Cénat, J.M.; Hébert, M.; Blais, M.; Lavoie, F.; Guerrier, M.; Derivois, D. Cyberbullying, Psychological Distress and Self-Esteem among Youth in Quebec Schools. J. Affect. Disord. 2014, 169, 7–9. [Google Scholar] [CrossRef] [PubMed]
  5. Singh, V.K.; Huang, Q.; Atrey, P.K. Cyberbullying detection using probabilistic socio-textual information fusion. In Proceedings of the 2016 IEEE/ACM International Conference on Advances in Social Networks Analysis and Mining, ASONAM, San Francisco, CA, USA, 18–21 August 2016; pp. 884–887. [Google Scholar] [CrossRef]
  6. Rosa, H.; Pereira, N.; Ribeiro, R.; Ferreira, P.C.; Carvalho, J.P.; Oliveira, S.; Coheur, L.; Paulino, P.; Simão, A.M.V.; Trancoso, I. Automatic cyberbullying detection: A systematic review. Comput. Hum. Behav. 2019, 93, 333–345. [Google Scholar] [CrossRef]
  7. Balakrishnan, V.; Khan, S.; Arabnia, H.R. Improving cyberbullying detection using Twitter users’ psychological features and machine learning. Comput. Secur. 2020, 90, 101710. [Google Scholar] [CrossRef]
  8. Reynolds, K.; Kontostathis, A.; Edwards, L. Using machine learning to detect cyberbullying. In Proceedings of the 10th International Conference on Machine Learning and Applications, ICMLA, Honolulu, HI, USA, 18–21 December 2011; Volume 2, pp. 241–244. [Google Scholar] [CrossRef]
  9. Almomani, A.; Nahar, K.; Alauthman, M.; Al-Betar, M.A.; Yaseen, Q.; Gupta, B.B. Image Cyberbullying Detection and Recognition Using Transfer Deep Machine Learning. Int. J. Cogn. Comput. Eng. 2024, 5, 14–26. [Google Scholar] [CrossRef]
  10. Yu, X.; Yang, T.; Lu, J.; Shen, Y.; Lu, W.; Zhu, W.; Bao, Y.; Li, H.; Zhou, J. Deep transfer learning: A novel glucose prediction framework for new subjects with type 2 diabetes. Complex Intell. Syst. 2022, 8, 1875–1887. [Google Scholar] [CrossRef]
  11. Khan, M.A.; Kadry, S.; Parwekar, P.; Damaševičius, R.; Mehmood, A.; Khan, J.A.; Naqvi, S.R. Human gait analysis for osteoarthritis prediction: A framework of deep learning and kernel extreme learning machine. Complex Intell. Syst. 2023, 9, 2665–2683. [Google Scholar] [CrossRef]
  12. Roy, P.K.; Singh, J.P.; Banerjee, S. Deep learning to filter SMS Spam. Future Gener. Comput. Syst. 2020, 102, 524–533. [Google Scholar] [CrossRef]
  13. Zhong, H.; Li, H.; Squicciarini, A.C.; Rajtmajer, S.M.; Griffin, C.; Miller, D.J.; Caragea, C. Content-Driven Detection of Cyberbullying on the Instagram Social Network. 2016. In Proceedings of the Twenty-Fifth International Joint Conference on Artificial Intelligence (IJCAI-16), New York, NY, USA, 9–15 July 2016; Available online: https://www.researchgate.net/publication/313796198 (accessed on 25 April 2024).
  14. Ali, W.N.H.W.; Mohd, M.; Fauzi, F. Cyberbullying Detection: An Overview. In Proceedings of the 2018 Cyber Resilience Conference, CRC, Putrajaya, Malaysia, 13–15 November 2018. [Google Scholar] [CrossRef]
  15. Hitkul, H.; Shah, R.R.; Kumaraguru, P.; Satoh, S. Maybe look closer? Detecting trolling prone images on Instagram. In Proceedings of the 2019 IEEE 5th International Conference on Multimedia Big Data, BigMM, Singapore, 11–13 September 2019; pp. 448–456. [Google Scholar] [CrossRef]
  16. Talpur, B.A.; O’Sullivan, D. Cyberbullying severity detection: A machine learning approach. PLoS ONE 2020, 15, e0240924. [Google Scholar] [CrossRef]
  17. Krizhevsky, A.; Sutskever, I.; Hinton, G.E. ImageNet classification with deep convolutional neural networks. Commun. ACM 2017, 60, 84–90. [Google Scholar] [CrossRef]
  18. Anand, M.; Eswari, R. Classification of abusive comments in social media using deep learning. In Proceedings of the 3rd International Conference on Computing Methodologies and Communication, ICCMC, Erode, India, 27–29 March 2019; pp. 974–977. [Google Scholar] [CrossRef]
  19. Li, Y.; Algarni, A.; Albathan, M.; Shen, Y.; Bijaksana, M.A. Relevance feature discovery for text mining. IEEE Trans. Knowl. Data Eng. 2015, 27, 1656–1669. [Google Scholar] [CrossRef]
  20. Al-Ajlan, M.A.; Ykhlef, M. Deep Learning Algorithm for Cyberbullying Detection. Int. J. Adv. Comput. Sci. Appl. 2018, 9, 199–205. [Google Scholar] [CrossRef]
  21. Banerjee, V.; Telavane, J.; Gaikwad, P.; Vartak, P. Detection of Cyberbullying Using Deep Neural Network. In Proceedings of the 2019 5th International Conference on Advanced Computing and Communication Systems, ICACCS, Coimbatore, India, 15–16 March 2019; pp. 604–607. [Google Scholar] [CrossRef]
  22. Acı, Ç.İ.; Çürük, E.; Eşsiz, E.S. Automatic Detection of Cyberbullying in Formspring. Me, Myspace and Youtube Social Networks. Turk. J. Eng. 2019, 3, 168–178. [Google Scholar] [CrossRef]
  23. Kumari, K.; Singh, J.P.; Dwivedi, Y.K.; Rana, N.P. Towards Cyberbullying-free social media in smart cities: A unified multi-modal approach. Soft Comput. 2020, 24, 11059–11070. [Google Scholar] [CrossRef]
  24. Gomez, R.; Gibert, J.; Gomez, L.; Karatzas, D. Exploring Hate Speech Detection in Multimodal Publications. In Proceedings of the IEEE/CVF Winter Conference on Applications of Computer Vision, Snowmass, CO, USA, 1–5 March 2020; pp. 1470–1478. Available online: https://www.hatebase.org/ (accessed on 26 April 2024).
  25. Chen, J.; Yan, S.; Wong, K.C. Verbal aggression detection on Twitter comments: Convolutional neural network for short-text sentiment analysis. Neural. Comput. Appl. 2020, 32, 10809–10818. [Google Scholar] [CrossRef]
  26. Kumari, K.; Singh, J.P.; Dwivedi, Y.K.; Rana, N.P. Multi-modal aggression identification using Convolutional Neural Network and Binary Particle Swarm Optimization. Future Gener. Comput. Syst. 2021, 118, 187–197. [Google Scholar] [CrossRef]
  27. Pericherla, S.; Ilavarasan, E. Cyberbullying detection and classification on social media images using Convolution Neural Networks and CB-YOLO model. Evol. Syst. 2025, 16, 43. [Google Scholar] [CrossRef]
  28. Roy, P.K.; Mali, F.U. Cyberbullying detection using deep transfer learning. Complex Intell. Syst. 2022, 8, 5449–5467. [Google Scholar] [CrossRef]
  29. Pericherla, S.; Ilavarasan, E. Overcoming the challenge of cyberbullying detection in images: A deep learning approach with image captioning and OCR integration. Int. J. Comput. Digit. Syst. 2024, 15, 393–401. [Google Scholar] [CrossRef]
  30. Vishwamitra, N.; Hu, H.; Luo, F.; Cheng, L. Towards understanding and detecting cyberbullying in real-world images. In Proceedings of the 2020 19th IEEE International Conference on Machine Learning and Applications (ICMLA), Online, 14–17 December 2020. [Google Scholar]
  31. Nakkawita, N.; Pushpakumara, B. Development of a rating model for assessing the condition of steel railway bridges. J. Saf. Sustain. 2024, 1, 151–160. [Google Scholar] [CrossRef]
  32. Abellanosa, A.D.; Pereira, E.; Lefsrud, L.; Mohamed, Y. Integrating Knowledge Management and Large Language Models to Advance Construction Job Hazard Analysis: A Systematic Review and Conceptual Framework. J. Saf. Sustain. 2025; In Press. [Google Scholar] [CrossRef]
Figure 1. Abstract diagram of the proposed study for cyberbullying identification.
Information 16 00630 g001
Figure 2. Overview of the prepared CVID dataset samples.
Information 16 00630 g002
Figure 3. Reason for avoiding rotation in the discourage class.
Information 16 00630 g003
Figure 4. Architecture of the proposed D-Net model.
Information 16 00630 g004
Figure 5. Learning graph of the proposed model before data augmentation. (a): Train and Validation Accuracy (b): Train and Validation Loss.
Information 16 00630 g005
Figure 6. Learning graph of the proposed model after data augmentation. (a): Train and Validation Accuracy (b): Train and Validation Loss.
Information 16 00630 g006
Figure 7. Confusion matrix for the proposed model with data augmentation for abuse (0), curse (1), discourage (2), and threat (3).
Information 16 00630 g007
Figure 8. ROC curve for the proposed model with data augmentation for abuse (0), curse (1), discourage (2), and threat (3).
Information 16 00630 g008
Table 2. Dataset sample distribution in the train and test sets.
Before AugmentationAugment
Only for Train
After Augmentation
ClassTrainTest--TrainTest
Abuse1813030048130
Curse1762930548129
Discourage1813030048130
Threat1263035848130
Total66411912631924119
Table 3. Hyperparameters used for training the D-Net model and baseline deep learning models.
HyperparameterValue
Batch Size32
OptimizerRMSprop
Learning Rate1 × 10−5
Epochs30
Early Stopping Patience3
Restore Best WeightsTrue
Image Size224 × 224
Loss FunctionSparse Categorical Cross-Entropy
Activation FunctionReLU
Final Output Activation Function SoftMax
Table 4. Classification report for the proposed model before and after augmentation.
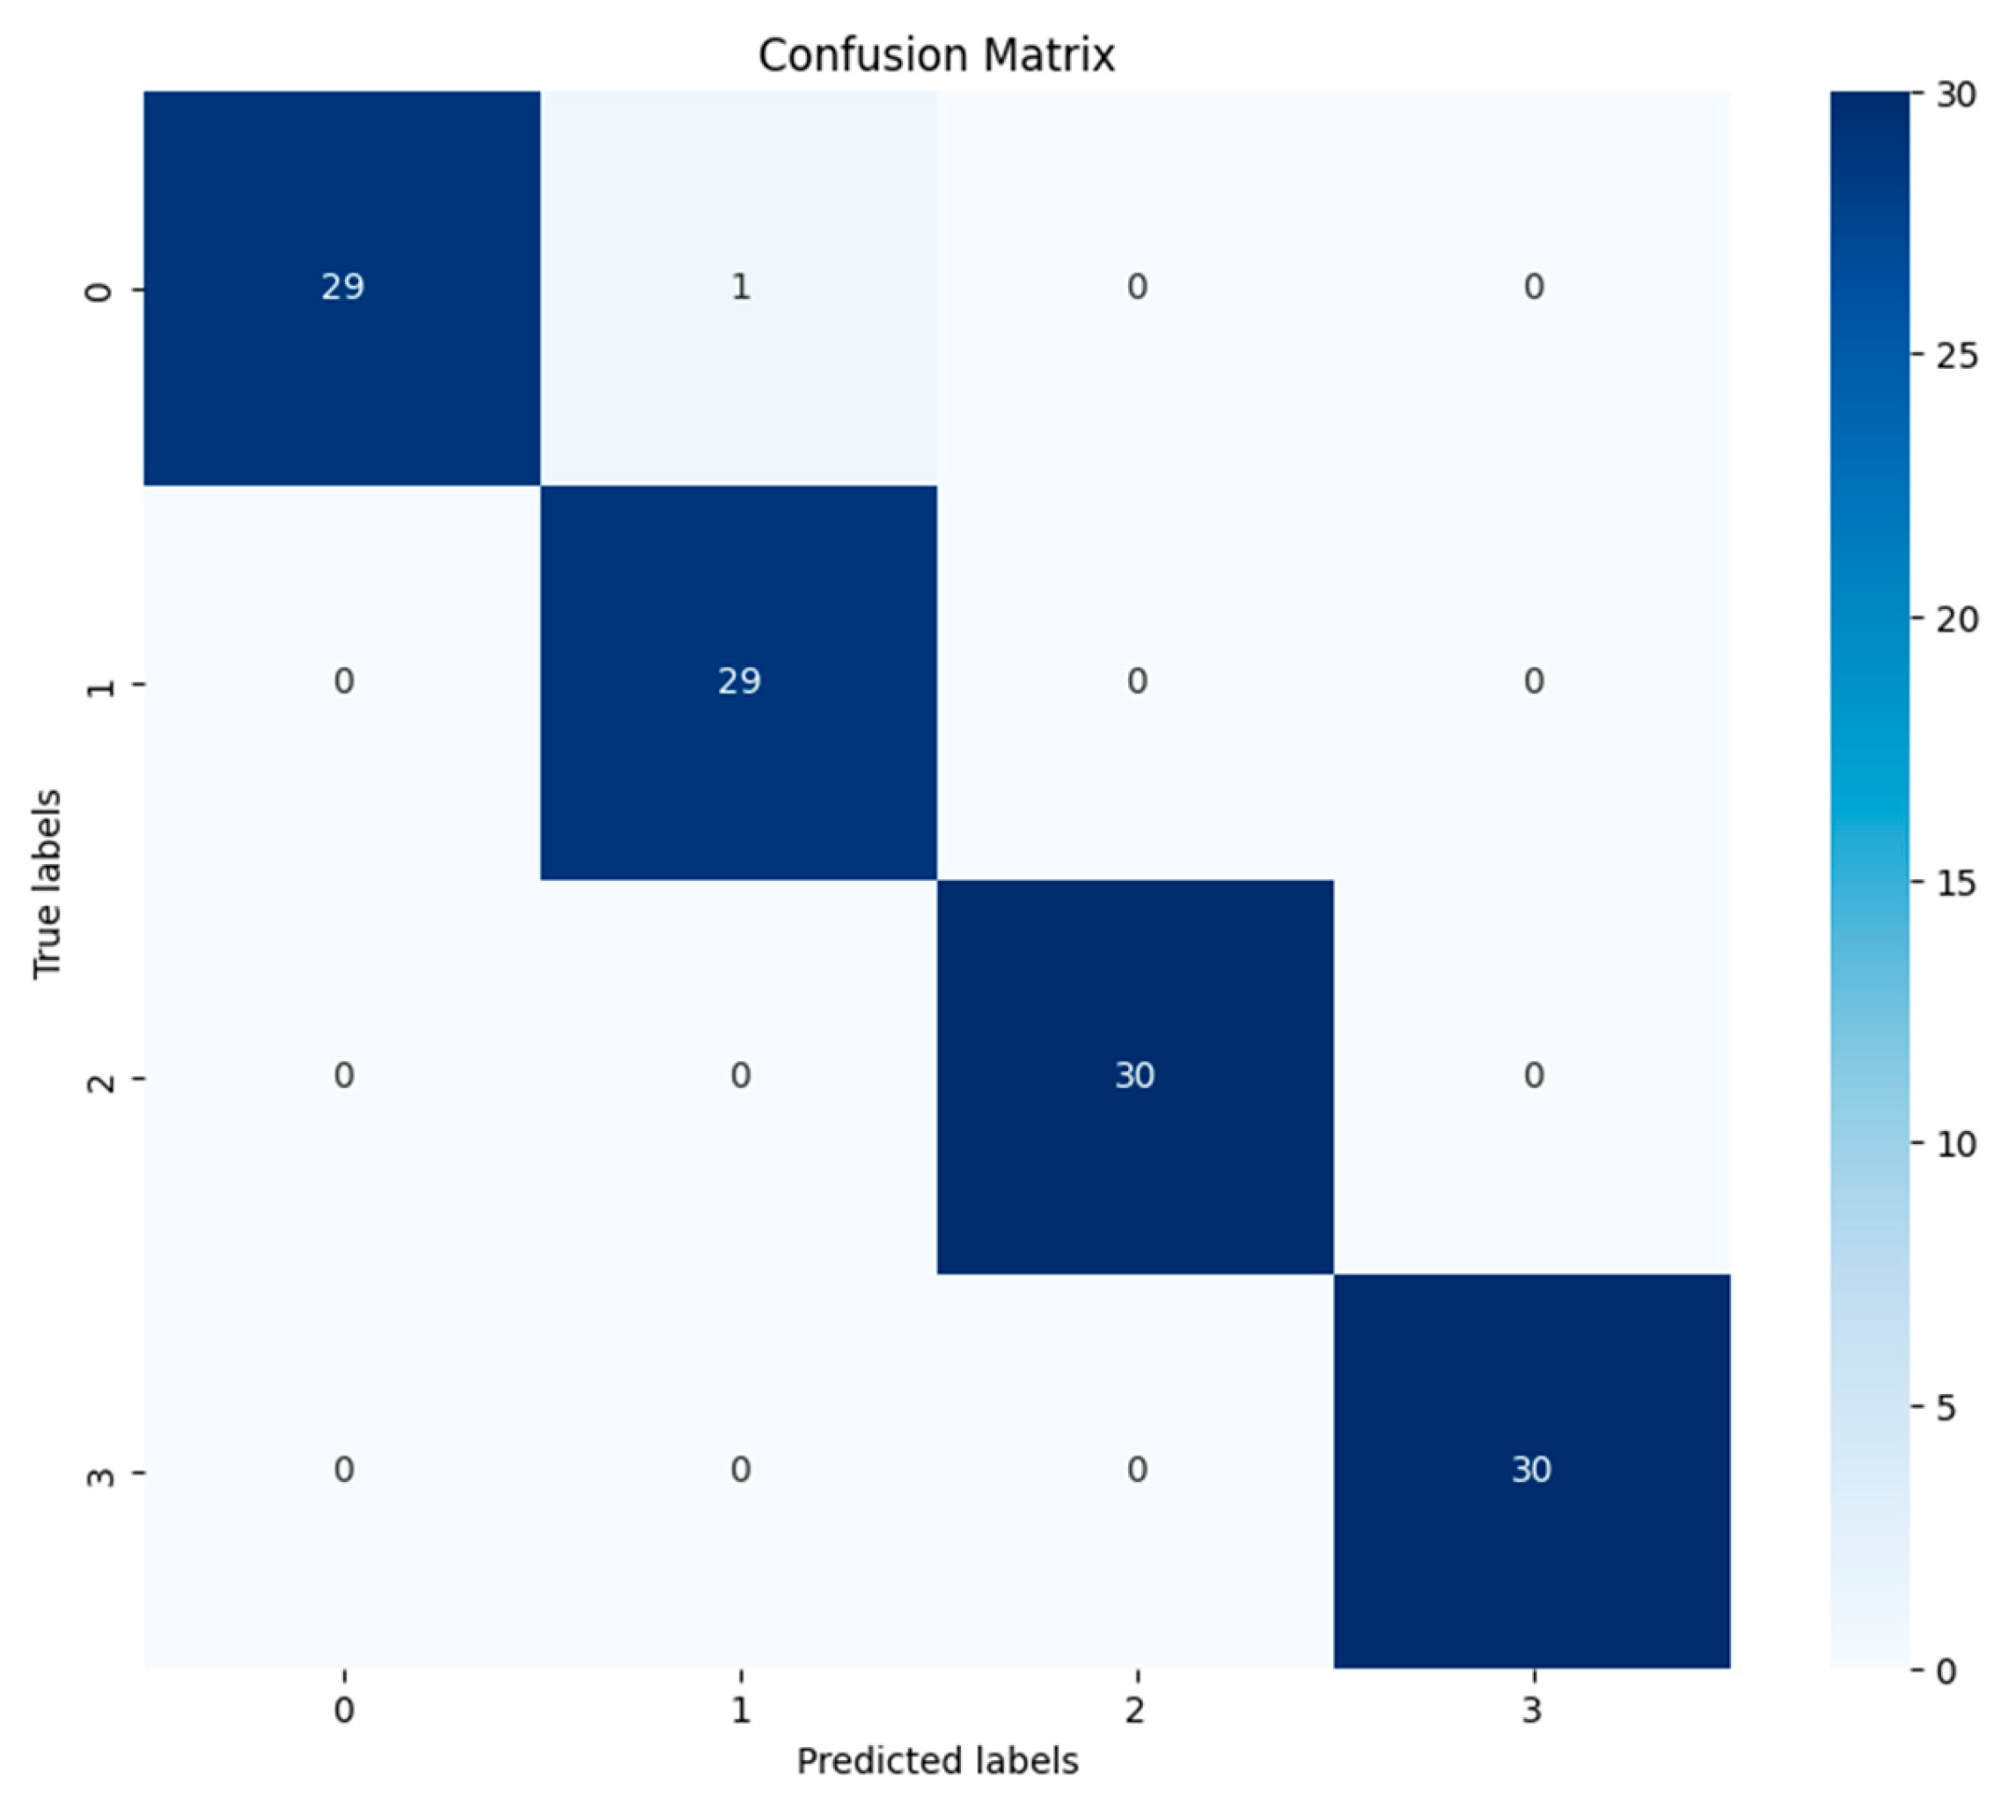
Classification Report—D-Net (Before Augmentation)
ClassPrecisionRecallF1-ScoreSupport
Abusing67%87%75%30
Curse62%100%77%29
Discourage9%10%10%30
Threat0%0%0%30
Accuracy 49%119
Macro Average35%49%40%119
Weighted Average35%49%40%119
Classification Report—D-Net (After Augmentation)
ClassPrecisionRecallF1-ScoreSupport
Abusing100%97%98%30
Curse97%100%98%29
Discourage100%100%100%30
Threat100%100%100%30
Accuracy 99%119
Macro Average99%99%99%119
Weighted Average99%99%99%119
Table 5. Comparative analysis of numerous models with the proposed model with and without data augmentation.
ModelScores
Without Augmentation
TrainValTest
VGG-16100%93%92%
VGG-19100%94%92%
Inception V3100%93%93%
MobileNetV2100%95%47%
ViT99%97%87%
D-Net100%94%49%
With Augmentation
VGG-1699%97%95%
VGG-1999%98%97%
Inception V398%94%94%
MobileNetV299%96%95%
ViT99%98%87%
D-Net100%99%99%
Table 6. Proposed model results with data augmentation and 5-fold stratified K-fold cross-validation.
Rounded Evaluation Scores of the Proposed Model (Augmentation + Stratified K-Fold)
ClassTrain AccuracyVal AccuracyTest AccuracyWeighted
Precision
Weighted
Recall
Weighted
F1-Score
Fold-1100%99%100%100%100%100%
Fold-2100%98%98%98%98%98%
Fold-3100%99%100%100%100%100%
Fold-4100%99%99%99%99%99%
Fold-5100%97%99%99%99%99%
Average100%98%99%99%99%99%
Disclaimer/Publisher’s Note: The statements, opinions and data contained in all publications are solely those of the individual author(s) and contributor(s) and not of MDPI and/or the editor(s). MDPI and/or the editor(s) disclaim responsibility for any injury to people or property resulting from any ideas, methods, instructions or products referred to in the content.

