1. Introduction
With the increasing frequency of maritime trade and ship activities, the amount of relevant maritime video and image data has also increased rapidly. However, the traditional way of obtaining maritime images, such as through cameras installed in ports or on sailboats, has problems such as limited information, fixed viewpoints, and unstable image quality [
1,
2]. These limitations make it difficult for traditional methods to meet the demands of increasingly complex maritime scene analyses. In contrast, maritime images acquired using remote sensing technology have significant advantages. In recent years, with the continuous progress of technology, the field of maritime remote sensing target detection has received wide attention and rapid development. Remote sensing images can not only provide a wider perspective and richer detailed information, but also have higher stability and flexibility [
3,
4,
5,
6].
Maritime images obtained through remote sensing can be divided into two categories: ocean images (which only include ship targets and ocean backgrounds) and coastal images (which include ships and coastal building targets with more complex backgrounds). The reason for dividing images into these two categories is that coastal areas often contain more buildings, port facilities, and other man-made structures, increasing the complexity of the scene. Coastal images represent real-world scenarios where ships appear alongside other targets (such as docks or cranes), providing a more diverse range of maritime scenarios. We believe that this classification better reflects the variety of environments ships may encounter in practice. Therefore, it covers most real-world scenarios where ships appear. In fact, these coastal images can be seen as an extension of ship-target images and a subset of maritime images, offering more application scenarios for future maritime target detection.
Target recognition algorithms can generally be divided into two categories: traditional image processing and pattern recognition algorithms, and neural network-based algorithms. Traditional algorithms rely on classical machine learning, image processing, and pattern recognition techniques, typically performing target recognition through manually designed features or heuristic methods. On the other hand, neural network-based algorithms include both shallow and deep architectures. Shallow neural networks, such as multilayer perceptrons (MLPs) and support vector machines (SVMs), use relatively simple network structures for pattern recognition, but their recognition capabilities often fall short of practical requirements. Deep neural networks offer higher performance, simplified design processes, and better adaptability to complex scenarios. Deep learning algorithms can be further divided into two categories: two-stage algorithms (e.g., Fast R-CNN [
7] and Faster R-CNN [
8]) and single-stage algorithms (e.g., YOLO [
9,
10,
11,
12,
13,
14] and SSD [
15]). Two-stage algorithms usually have higher recognition accuracy, but are more suitable for scenarios with sufficient computational resources due to high computational requirements and slower running speed. Single-stage algorithms, on the other hand, have the advantage of faster speed and lower computational resource requirements, but the accuracy is relatively slightly lower and is more suitable for scenarios with high real-time requirements.
Existing maritime remote sensing detection methods (e.g., Related-YOLO [
16] and YOLOv8: Ship Detection in Foggy Weather [
17]) have achieved significant performance improvements, but still face many challenges. For example, accurate localization of small targets is still difficult, as feature extraction is limited due to the dense distribution of targets and the limited number of pixels; and for large aspect ratio targets, such as elongated ships, the mismatch between the ground truth region and the square sensing field in RoI Align will lead to detection errors. In addition, traditional models based on basic convolutional operations are limited in their ability to cope with these problems.
The intended application of the proposed method primarily focuses on satellite target detection, particularly for maritime remote sensing tasks. In these scenarios, due to the harsh space environment, the onboard computer (SOC) on satellites faces significant hardware and computational resource constraints, typically relying on embedded devices such as FPGA development boards whose processing power is far inferior to that of ground-based systems. Therefore, algorithms designed for satellite platforms must be both lightweight and efficient. Although advanced architectures like YOLOv8 and other state-of-the-art frameworks offer performance improvements, they require higher computational resources, making them less suitable for resource-constrained platforms. In contrast, YOLOv5 strikes an excellent balance between detection accuracy and computational efficiency, with superior portability and deployment flexibility, enabling faster inference and more reliable detection on embedded or edge devices. Consequently, in satellite-based maritime remote sensing scenarios, choosing YOLOv5 over YOLOv8 is a wise decision, as it achieves an optimal trade-off between performance and resource requirements.
Building on the strengths of YOLOv5, this paper addresses the specific challenges of maritime target detection by introducing several targeted enhancements. These include:
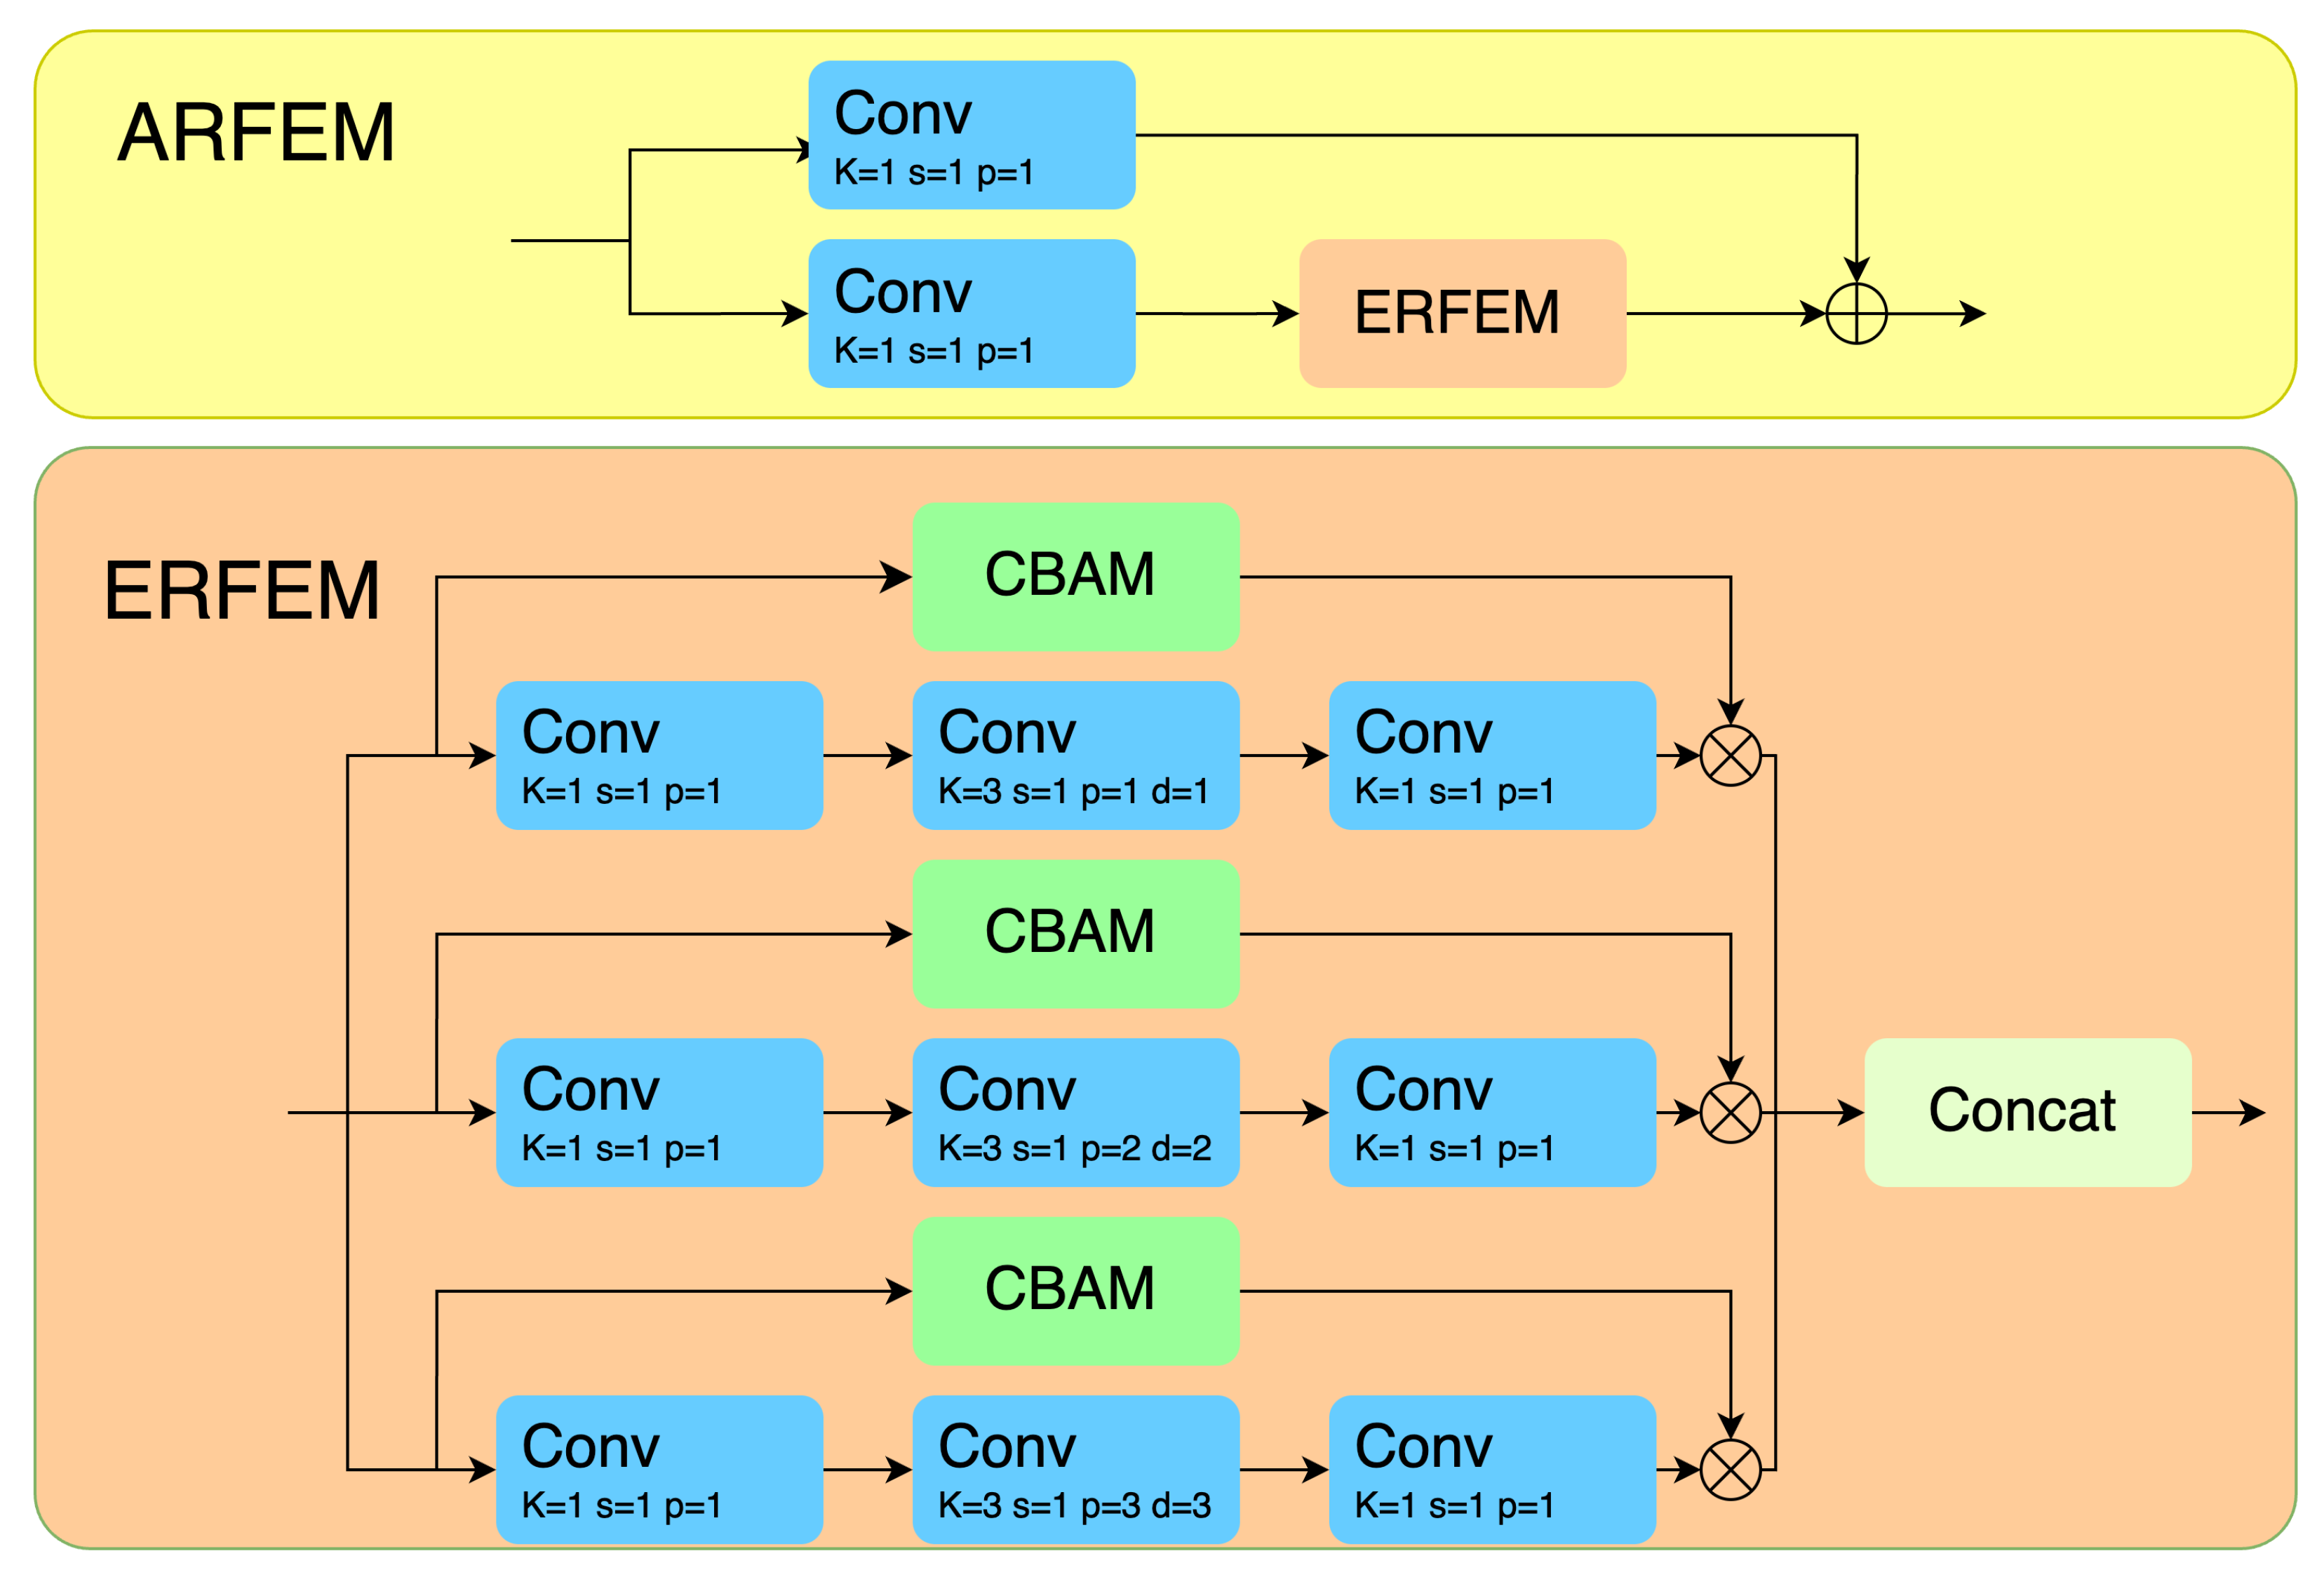
Attention-based Receptive Field Enhancement Module: This paper introduces an original module that combines feature attention mechanisms with receptive field enhancement. The module uses different dilation rates to extract features with varying scales and dependencies, and further strengthens the extracted information using an attention mechanism [
18]. Compared to simple receptive field enhancement, this structure better improves the model’s ability to extract multi-scale information, thereby significantly enhancing the model’s classification accuracy.
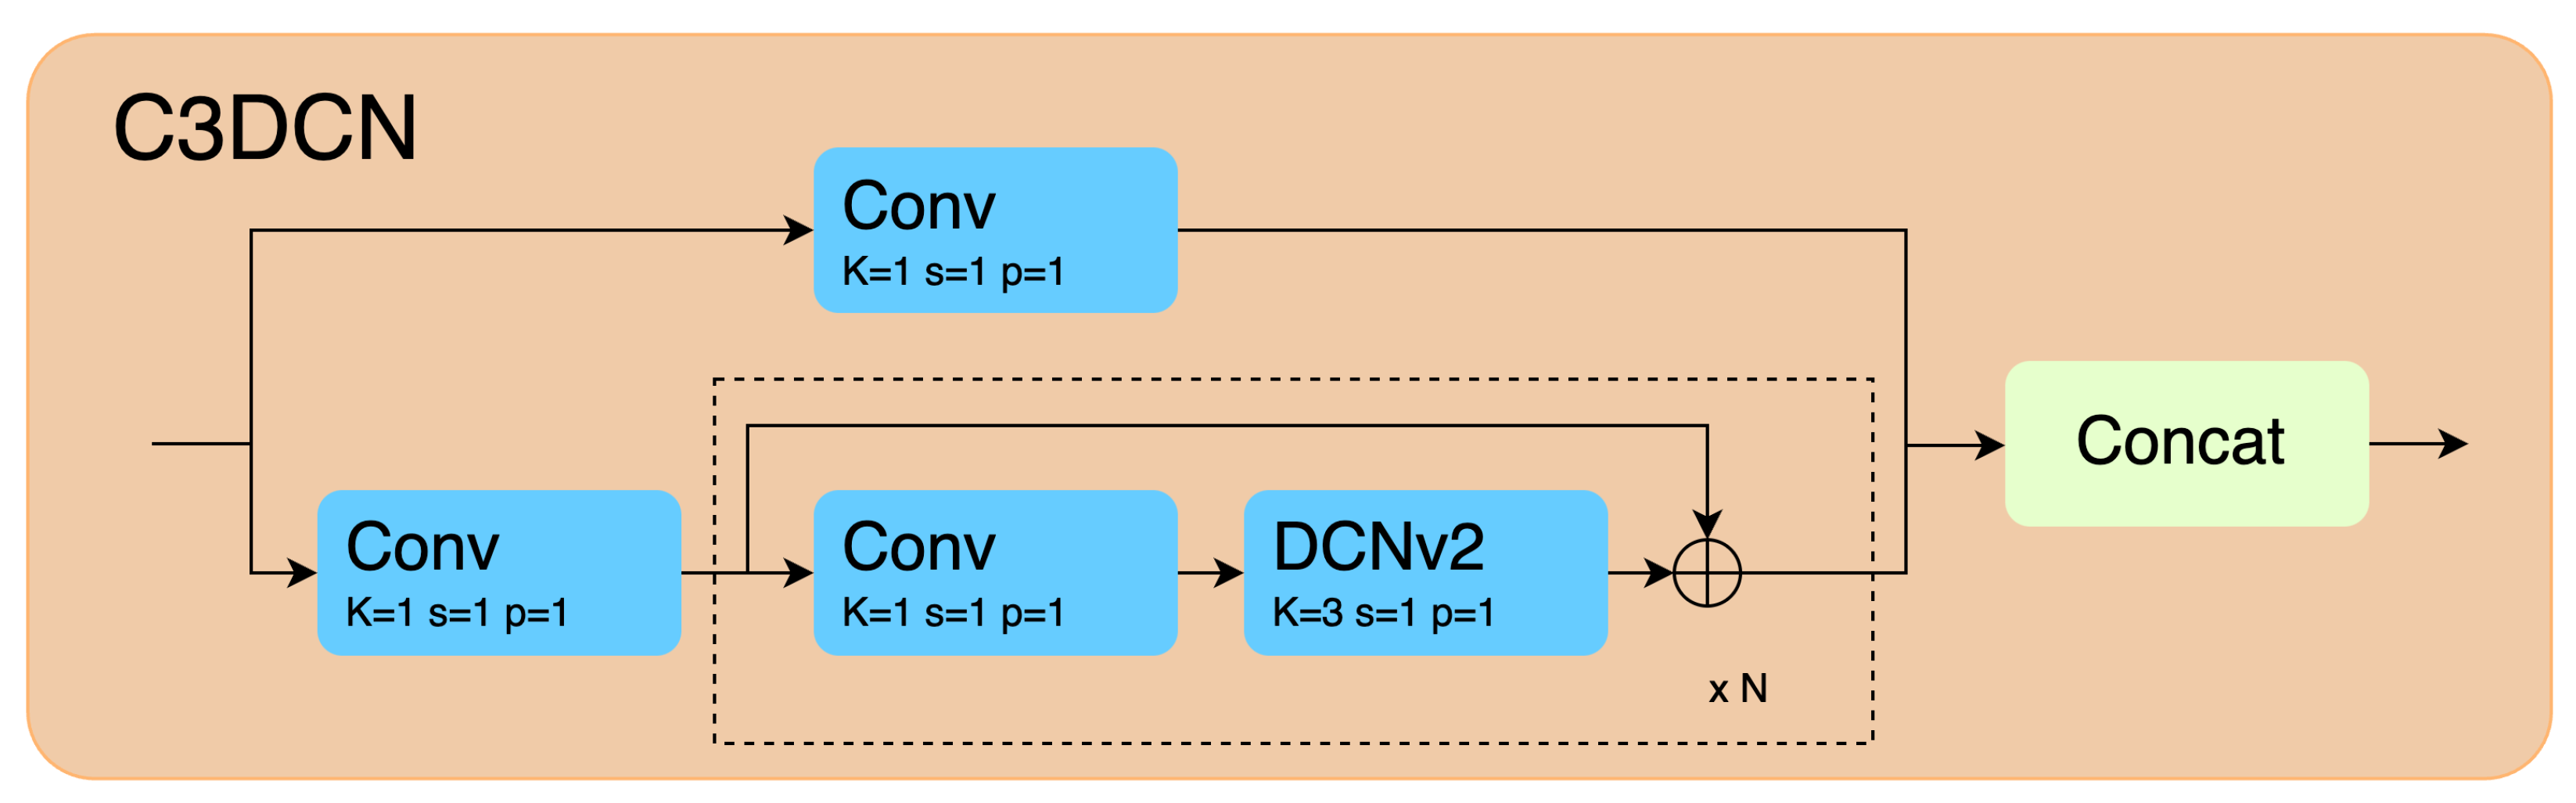
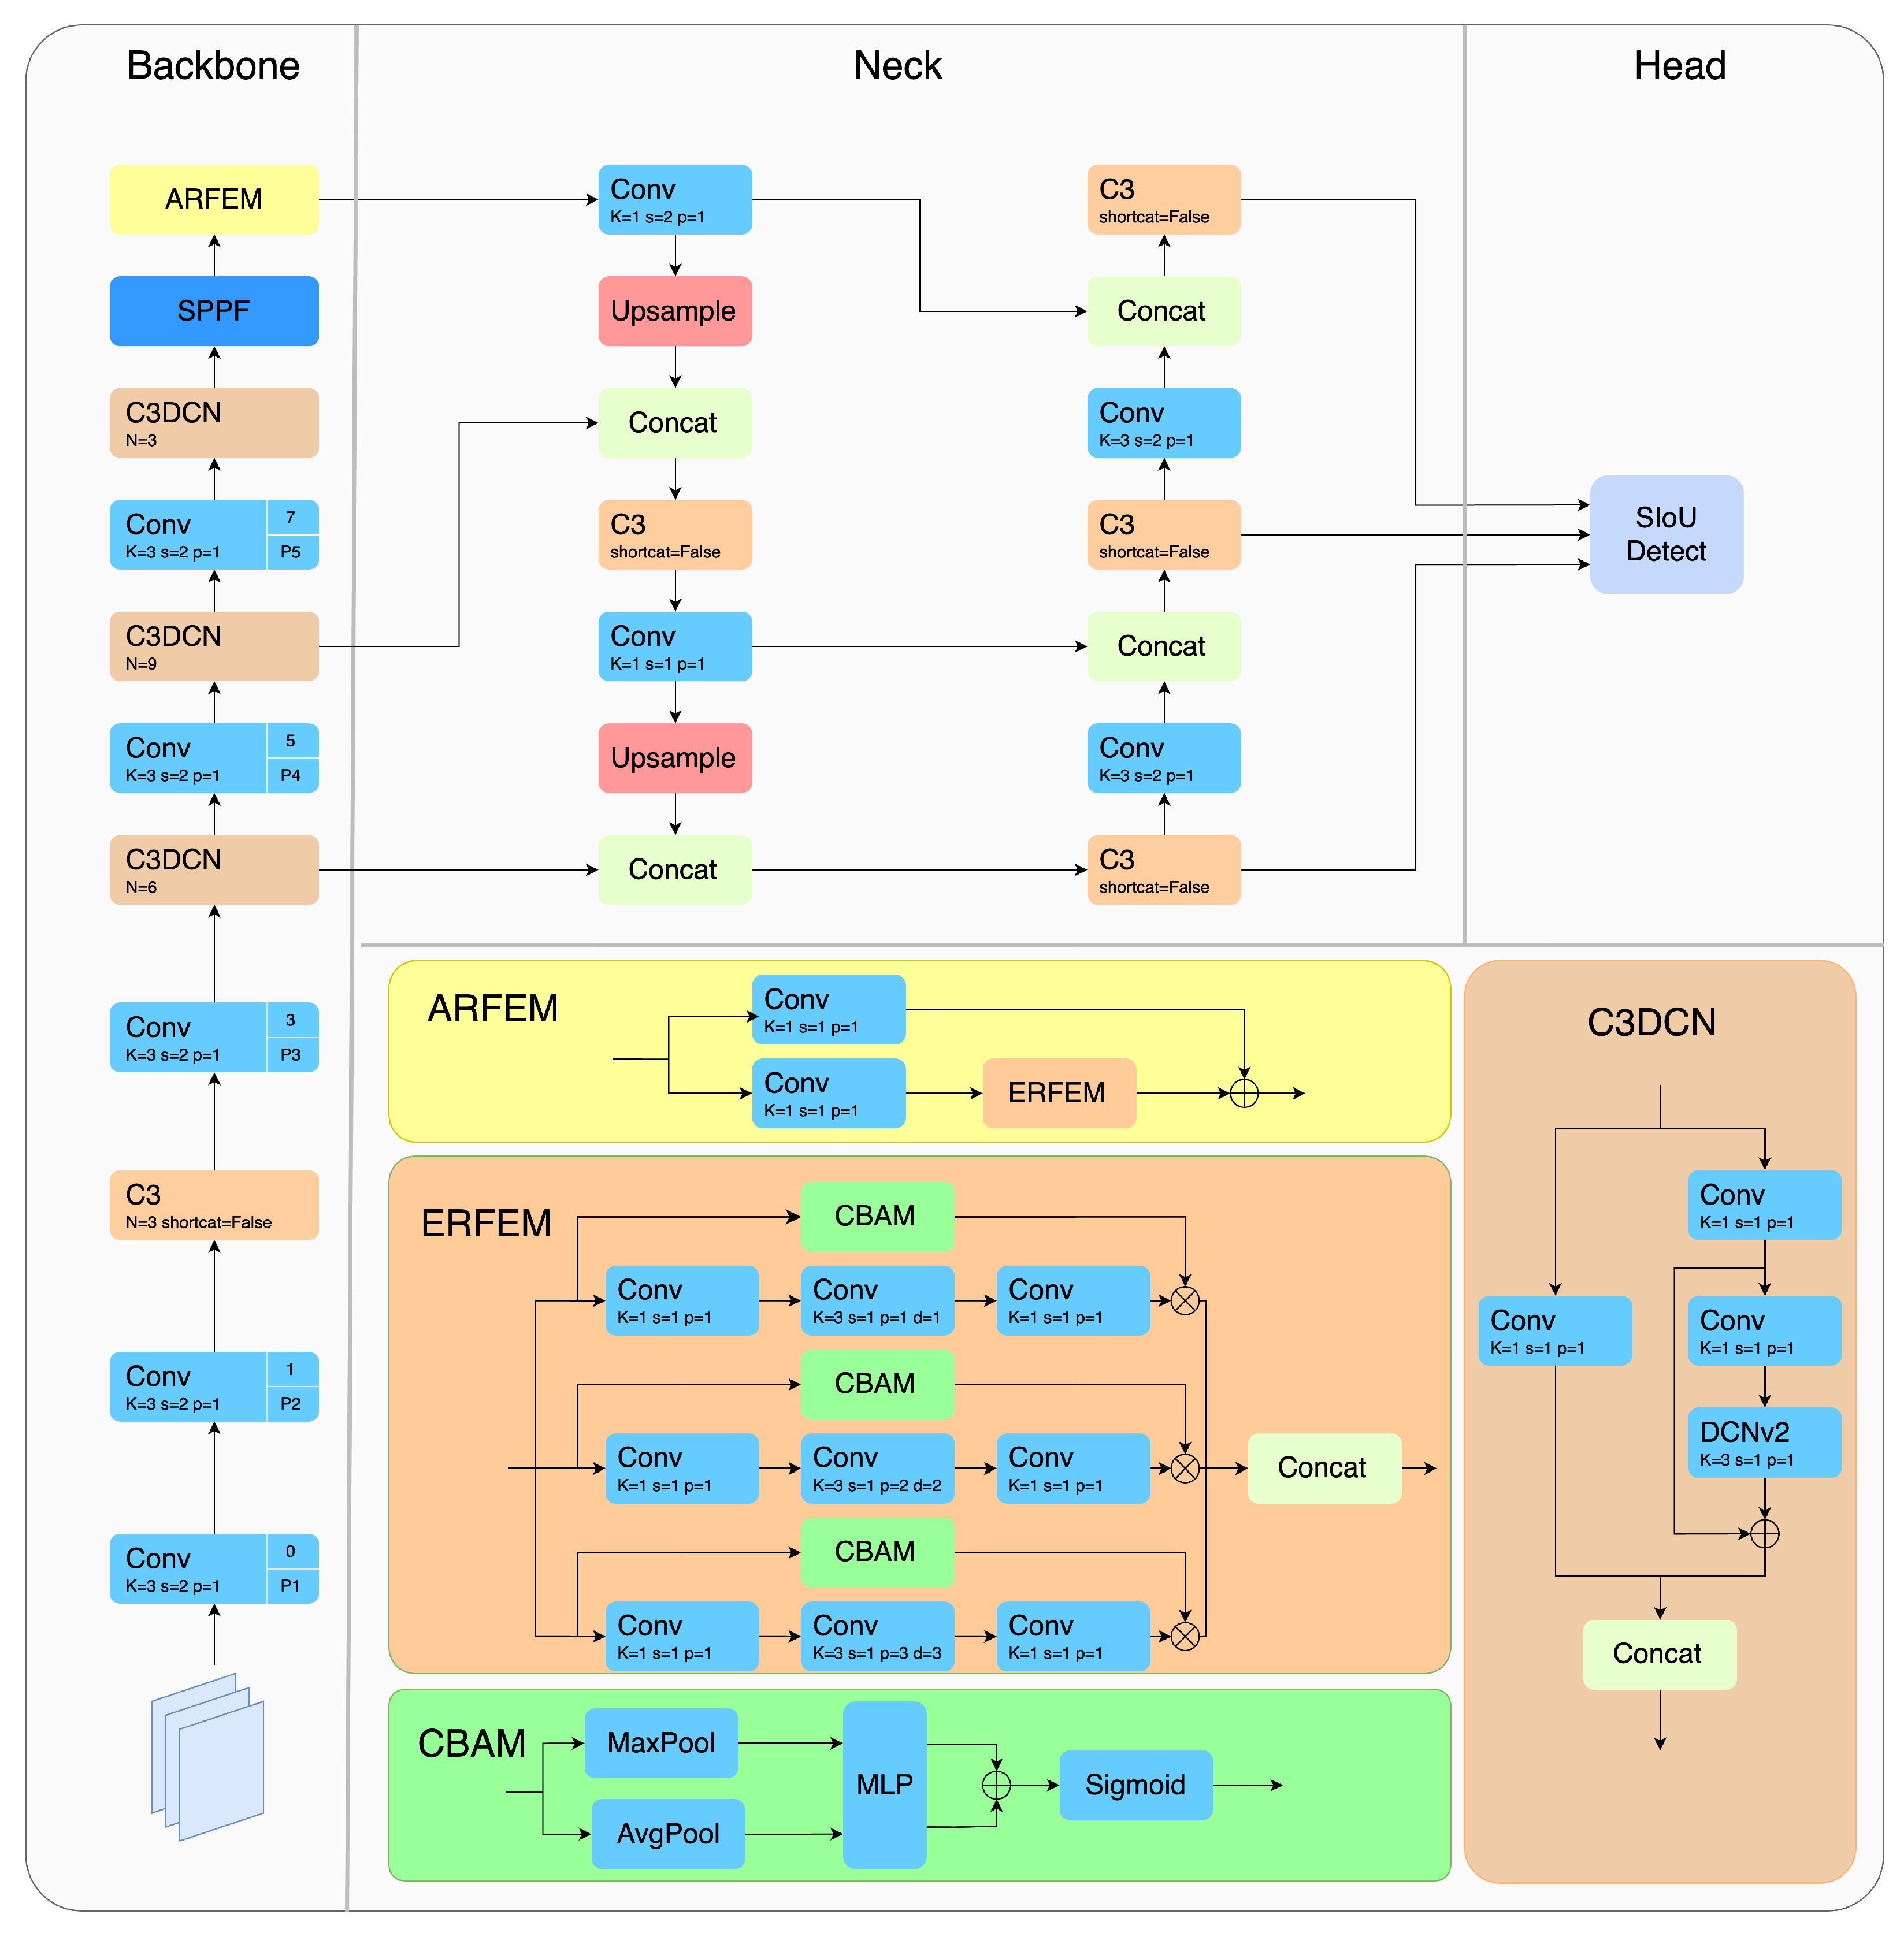
Optimized model for maritime remote sensing scenarios: The proposed YOLOv5-ASC model integrates an attention-based receptive field enhancement (ARFEM), deformable convolutions (C3DCN), and the SIoU loss function to optimize feature extraction for maritime remote sensing. The attention mechanism enhances the model’s ability to capture multi-scale information, while deformable convolutions adaptively handle the large aspect ratios of ship targets, thereby improving detection performance. The SIoU (Smooth Intersection over Union) loss function enhances the model’s accuracy in locating targets by better handling the geometric relationship between predicted and ground truth boxes, especially in cases of extreme aspect ratios or target overlaps. This optimization effectively addresses unique challenges in maritime remote sensing, such as limitations in computational and transmission capabilities, as well as the complexity of detecting both ships and port-related objects within the same scene.
In this paper, an improved model of YOLOv5 using Attention Mechanism and Multi-Scale Feature Fusion is proposed, aiming to overcome the challenges faced by the original model in maritime remote sensing scenarios, such as large aspect ratio targets and targets in complex backgrounds. Furthermore, we evaluate the proposed model on ShipRSImageNet and demonstrate that it can improve the detection accuracy of remotely sensed maritime targets. Finally, the proposed model also demonstrates its effectiveness on additional maritime-related datasets.
2. Related Work
Maritime remote sensing target detection is a combination of remote sensing and maritime targets. Currently, there are many detection algorithms for this scenario, but it also faces many challenges.
Ma et al. [
16] proposed a new model called Related-YOLO to address ship rotation and fine-grained characteristics. Although the model includes a detection head specifically designed for small targets, it does not fully utilize shallow feature information. Liang et al. [
17] proposed an improved YOLOv8 model for detecting nearshore ships under fog interference, but the model did not take into account the special points of the ship target and the scene. Abhinaba H. et al. [
19] designed a self-attention-based residual network for ship detection and classification, but their approach only implements a basic network design and does not address the unique challenges of maritime remote sensing images, such as the large aspect ratios compared to other remote sensing images. Xiong et al. [
20] proposed an explainable attention network for fine-grained ship image classification to explore transparent and interpretable prediction processes. However, their study does not address the frequent need to detect numerous small targets in maritime remote sensing images. Zalukhu et al. [
21] employed an extended YOLOv5x6 network to identify ships in the large-scale ShipRSImageNet dataset, but the network requires 209.8 GFLOPs of computation, making it unsuitable for maritime object detection. Guo et al. [
22] proposed a detection algorithm based on shape-aware feature learning, which considers the large aspect ratio challenge in fine-grained ship detection. However, their method does not fully account for the identification of numerous small targets in complex backgrounds and fails to effectively utilize multi-scale information. Chenguang and Guifa [
23] explored the application of an improved YOLOv5s model in remote sensing image target detection, applying a structurally optimized version of the model to assess regional poverty. Although their study improved detection performance in a specific domain, it primarily focused on land-based scenes and did not address the specific challenges of maritime remote sensing, such as dense small targets, complex sea clutter, and large aspect ratio variations of ships.
In conclusion, while existing maritime remote sensing object detection methods have demonstrated certain performance enhancements, there remain some deficiencies. A significant challenge is the accuracy of target localization for a large number of small targets. The detection and localization of small targets remains a challenging task due to their frequent clustering, which results in unclear boundaries, and the limited pixel count of individual small targets, which makes it difficult to capture clear texture features. Another issue is the detection of targets with large aspect ratios, as ships in satellite images often have elongated shapes. This results in a discrepancy between the ground-truth regions and the square receptive fields employed in RoI Align operations, which, in turn, affects detection performance [
22]. Conventional models utilize basic convolution, resulting in a receptive field that is shaped like a square [
24]. Small target categories are susceptible to confusion: The fine-grained classification of the dataset may result in intra-class differences exceeding inter-class differences, thereby increasing the difficulty of recognition. It is challenging to control the size of the model parameters. While larger parameter models typically yield better performance, excessive parameters limit the model’s applicability. The demand for remote sensing target recognition often arises on platforms with limited computational power. Although satellite remote sensing image recognition can be performed without edge computing, the recognition requirements are much larger, which creates the need for limiting computational load in recognition that is often overlooked in maritime remote sensing target recognition.
In order to address the aforementioned challenges, this paper proposes an improved model. This model incorporates an Attention-based Receptive Field Enhancement Module (ARFEM), the purpose of which is to enhance the localization of small objects, a Deformable Convolutional Network (C3DCN) to adapt to targets with large aspect ratios, and an optimized SIoU loss function to enhance bounding box regression accuracy. The model achieves a good balance between accuracy and computational efficiency, significantly improving detection performance and demonstrating potential for applications in resource-constrained platforms and complex scenarios.
4. Experimental Results and Analysis
4.4. Analysis of Detection Performance
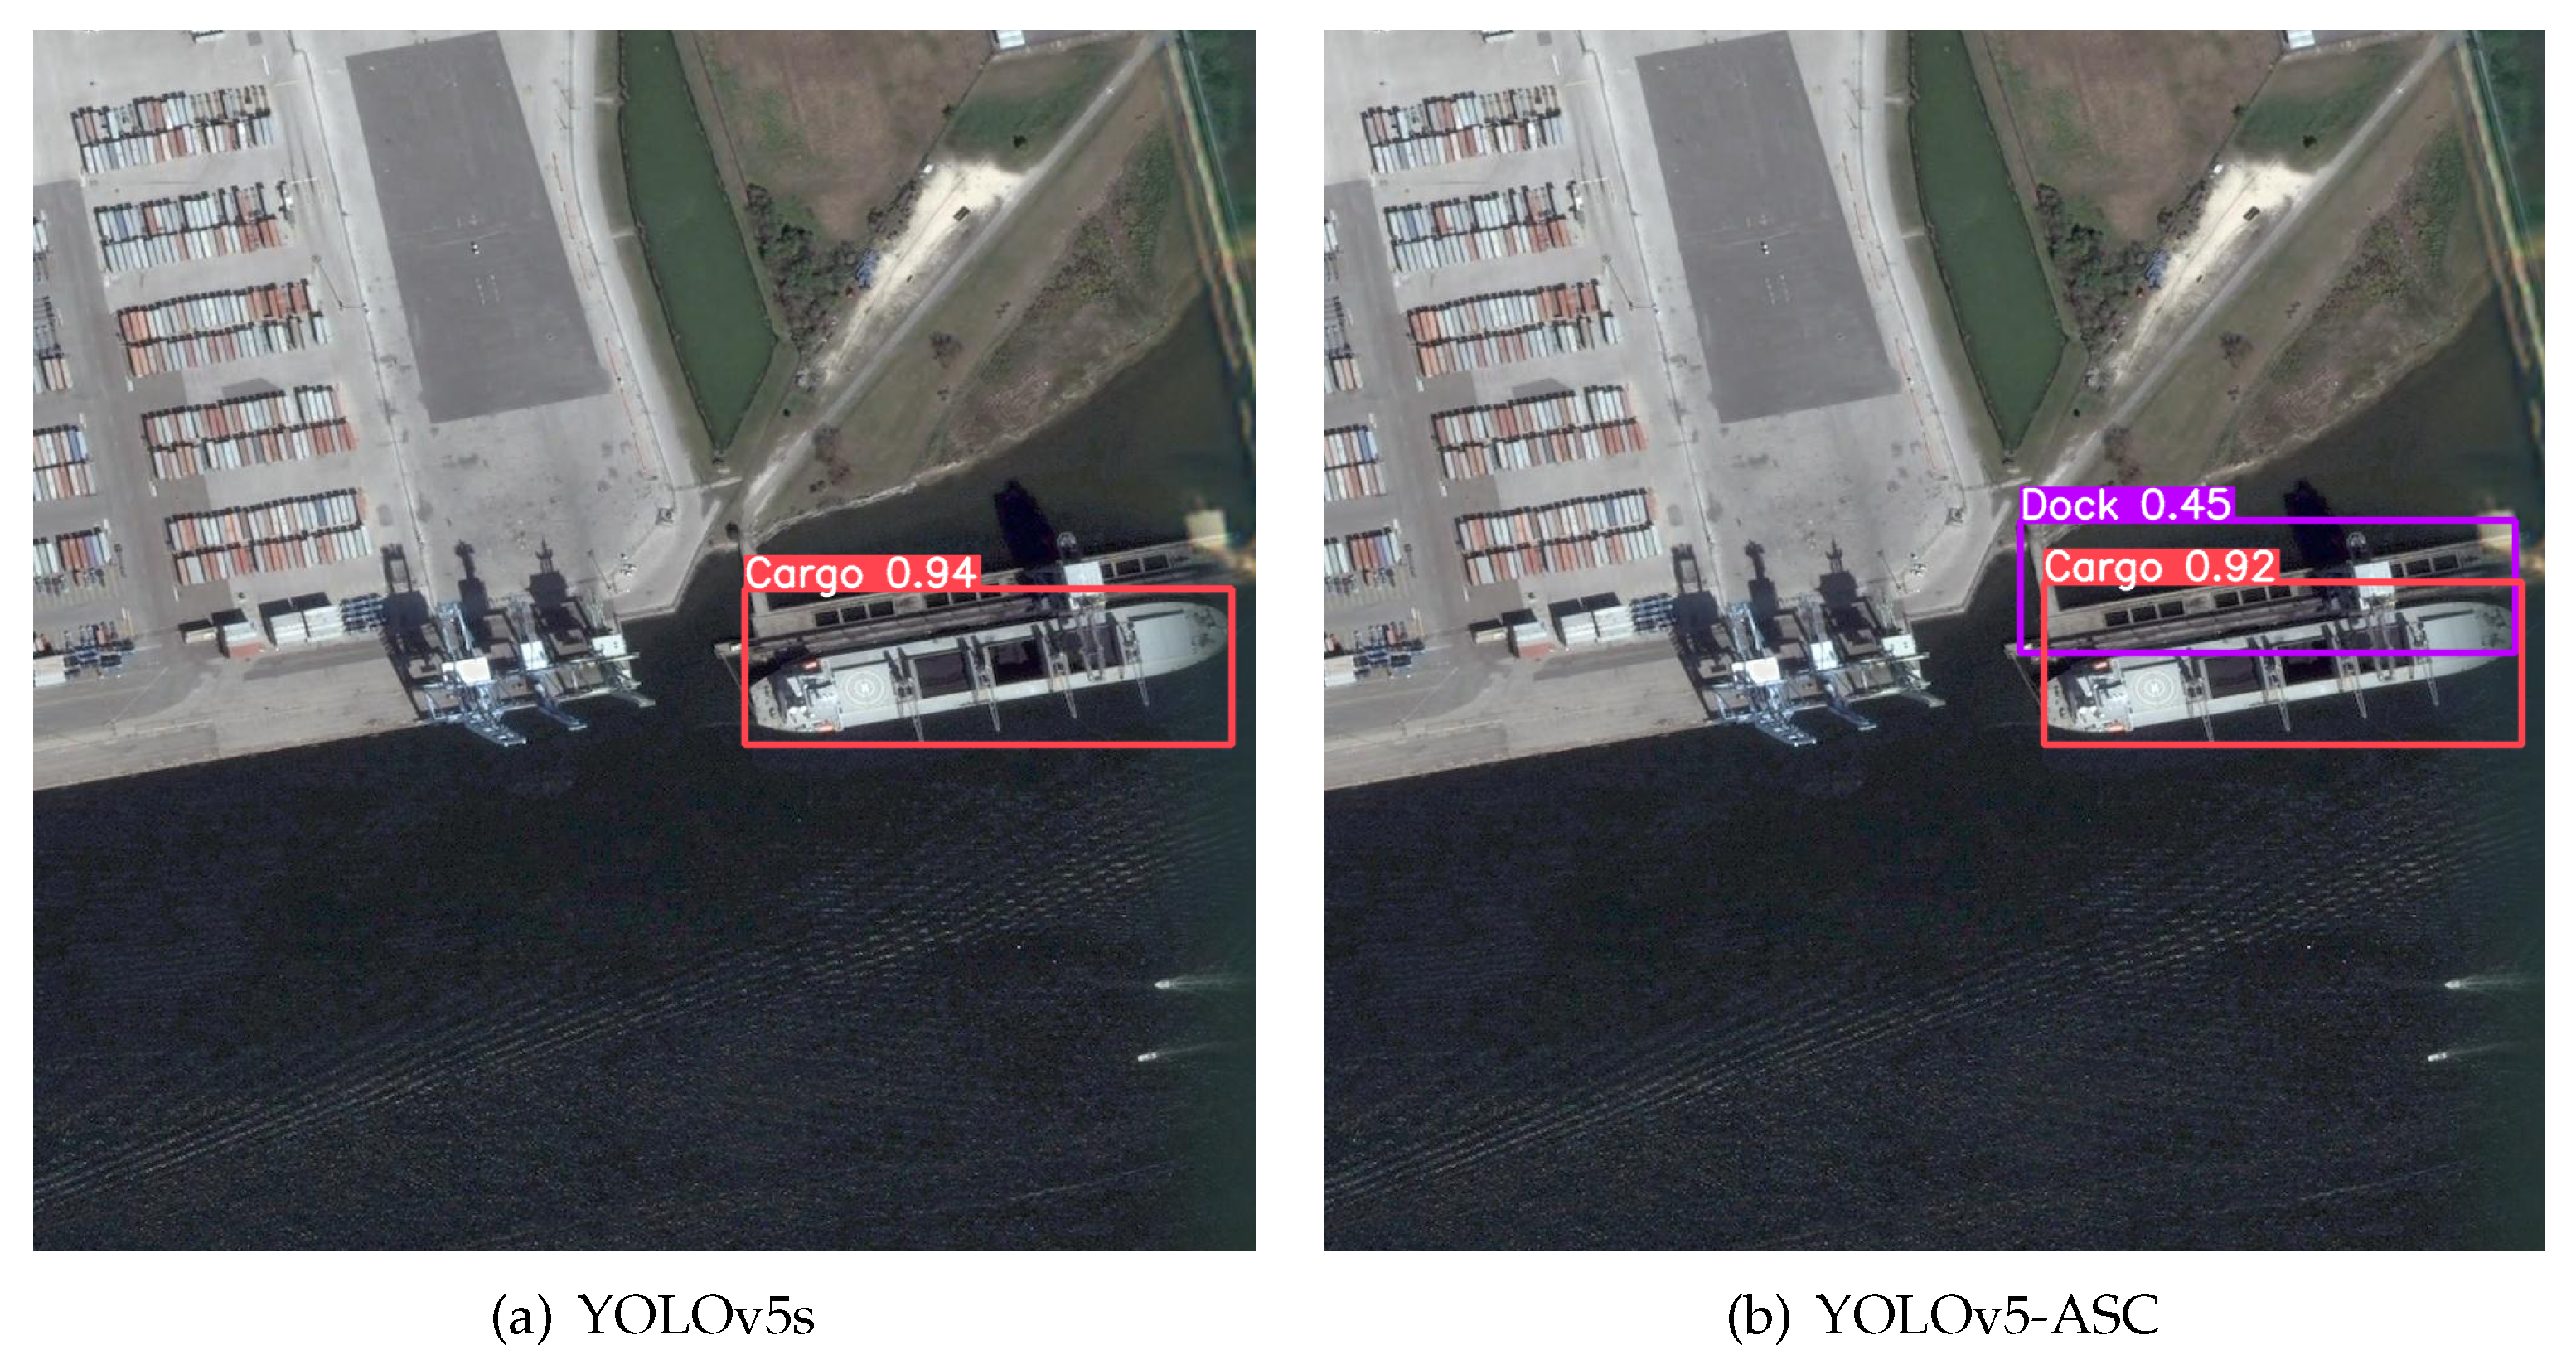
In order to assess the efficacy of the YOLOv5-ASC model in real-world application environments, this paragraph delves into the model’s ability to perform in specific contexts. A variety of challenging scenarios were carefully selected for testing, including scenarios with small targets that are easily confused and scenarios with cluttered backgrounds. As shown in the figure below, these scenarios specifically cover situations where targets are closely fitting and difficult to distinguish, scenes with complex and variable backgrounds, blurred scenes with low image clarity, scenes containing targets with large aspect ratios, and scenes with small targets that occur in complex environments.
The label and confidence score displayed on the detection box represent the detected category and confidence. The confidence score indicates the model’s confidence that a target exists within a specific detection box, and it is the product of the objectness probability and the class probability.
In comparison, it can be observed that the dock and the ship have overlapping parts, resulting in the loss of clear boundaries, which presents a challenge for target recognition. The detection result of the original model (
Figure 6a) fails to successfully differentiate between the dock and the ship. In contrast, the proposed model demonstrates an advantage in handling this challenge and clearly differentiates between the dock and the ship, as shown in
Figure 6b.
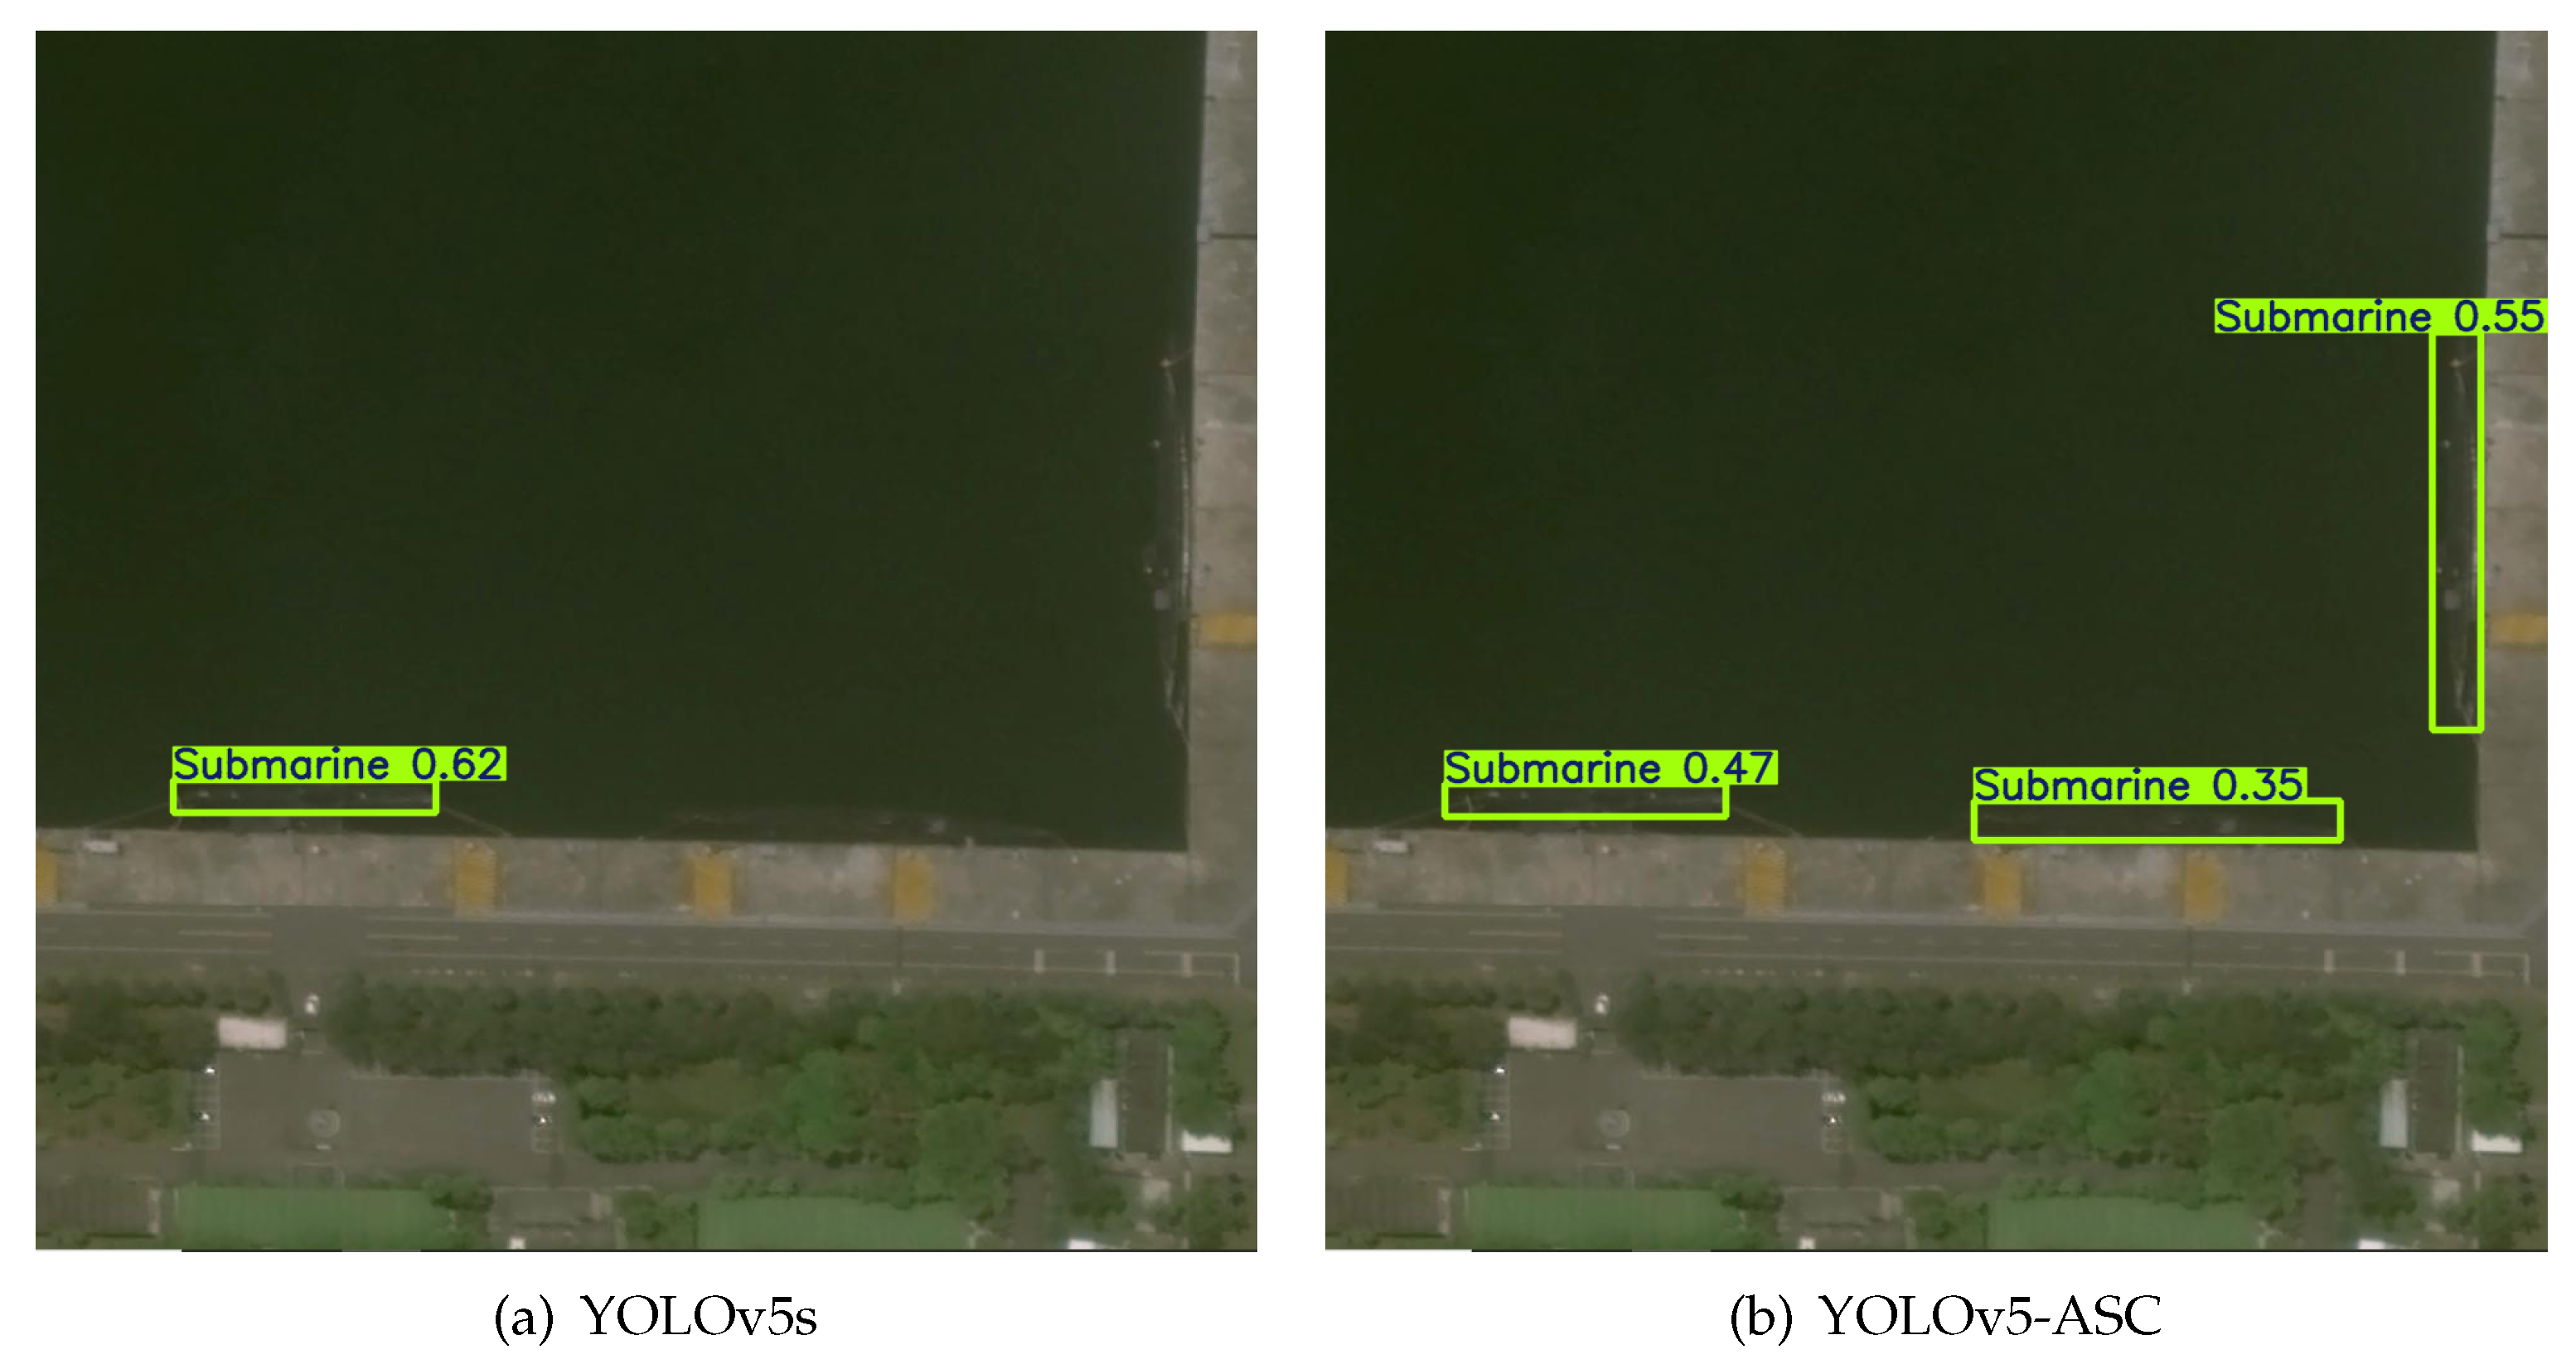
In maritime remote sensing scenarios, image blurring is a frequent occurrence, which may be due to weather, air quality, light angle, camera resolution, and so on. We can see that the model has an advantage in recognizing blurred images; as can be seen in
Figure 7a, the YOLOv5s model detects one submarine, while the proposed model succeeds in recognizing all three submarines (
Figure 7b).
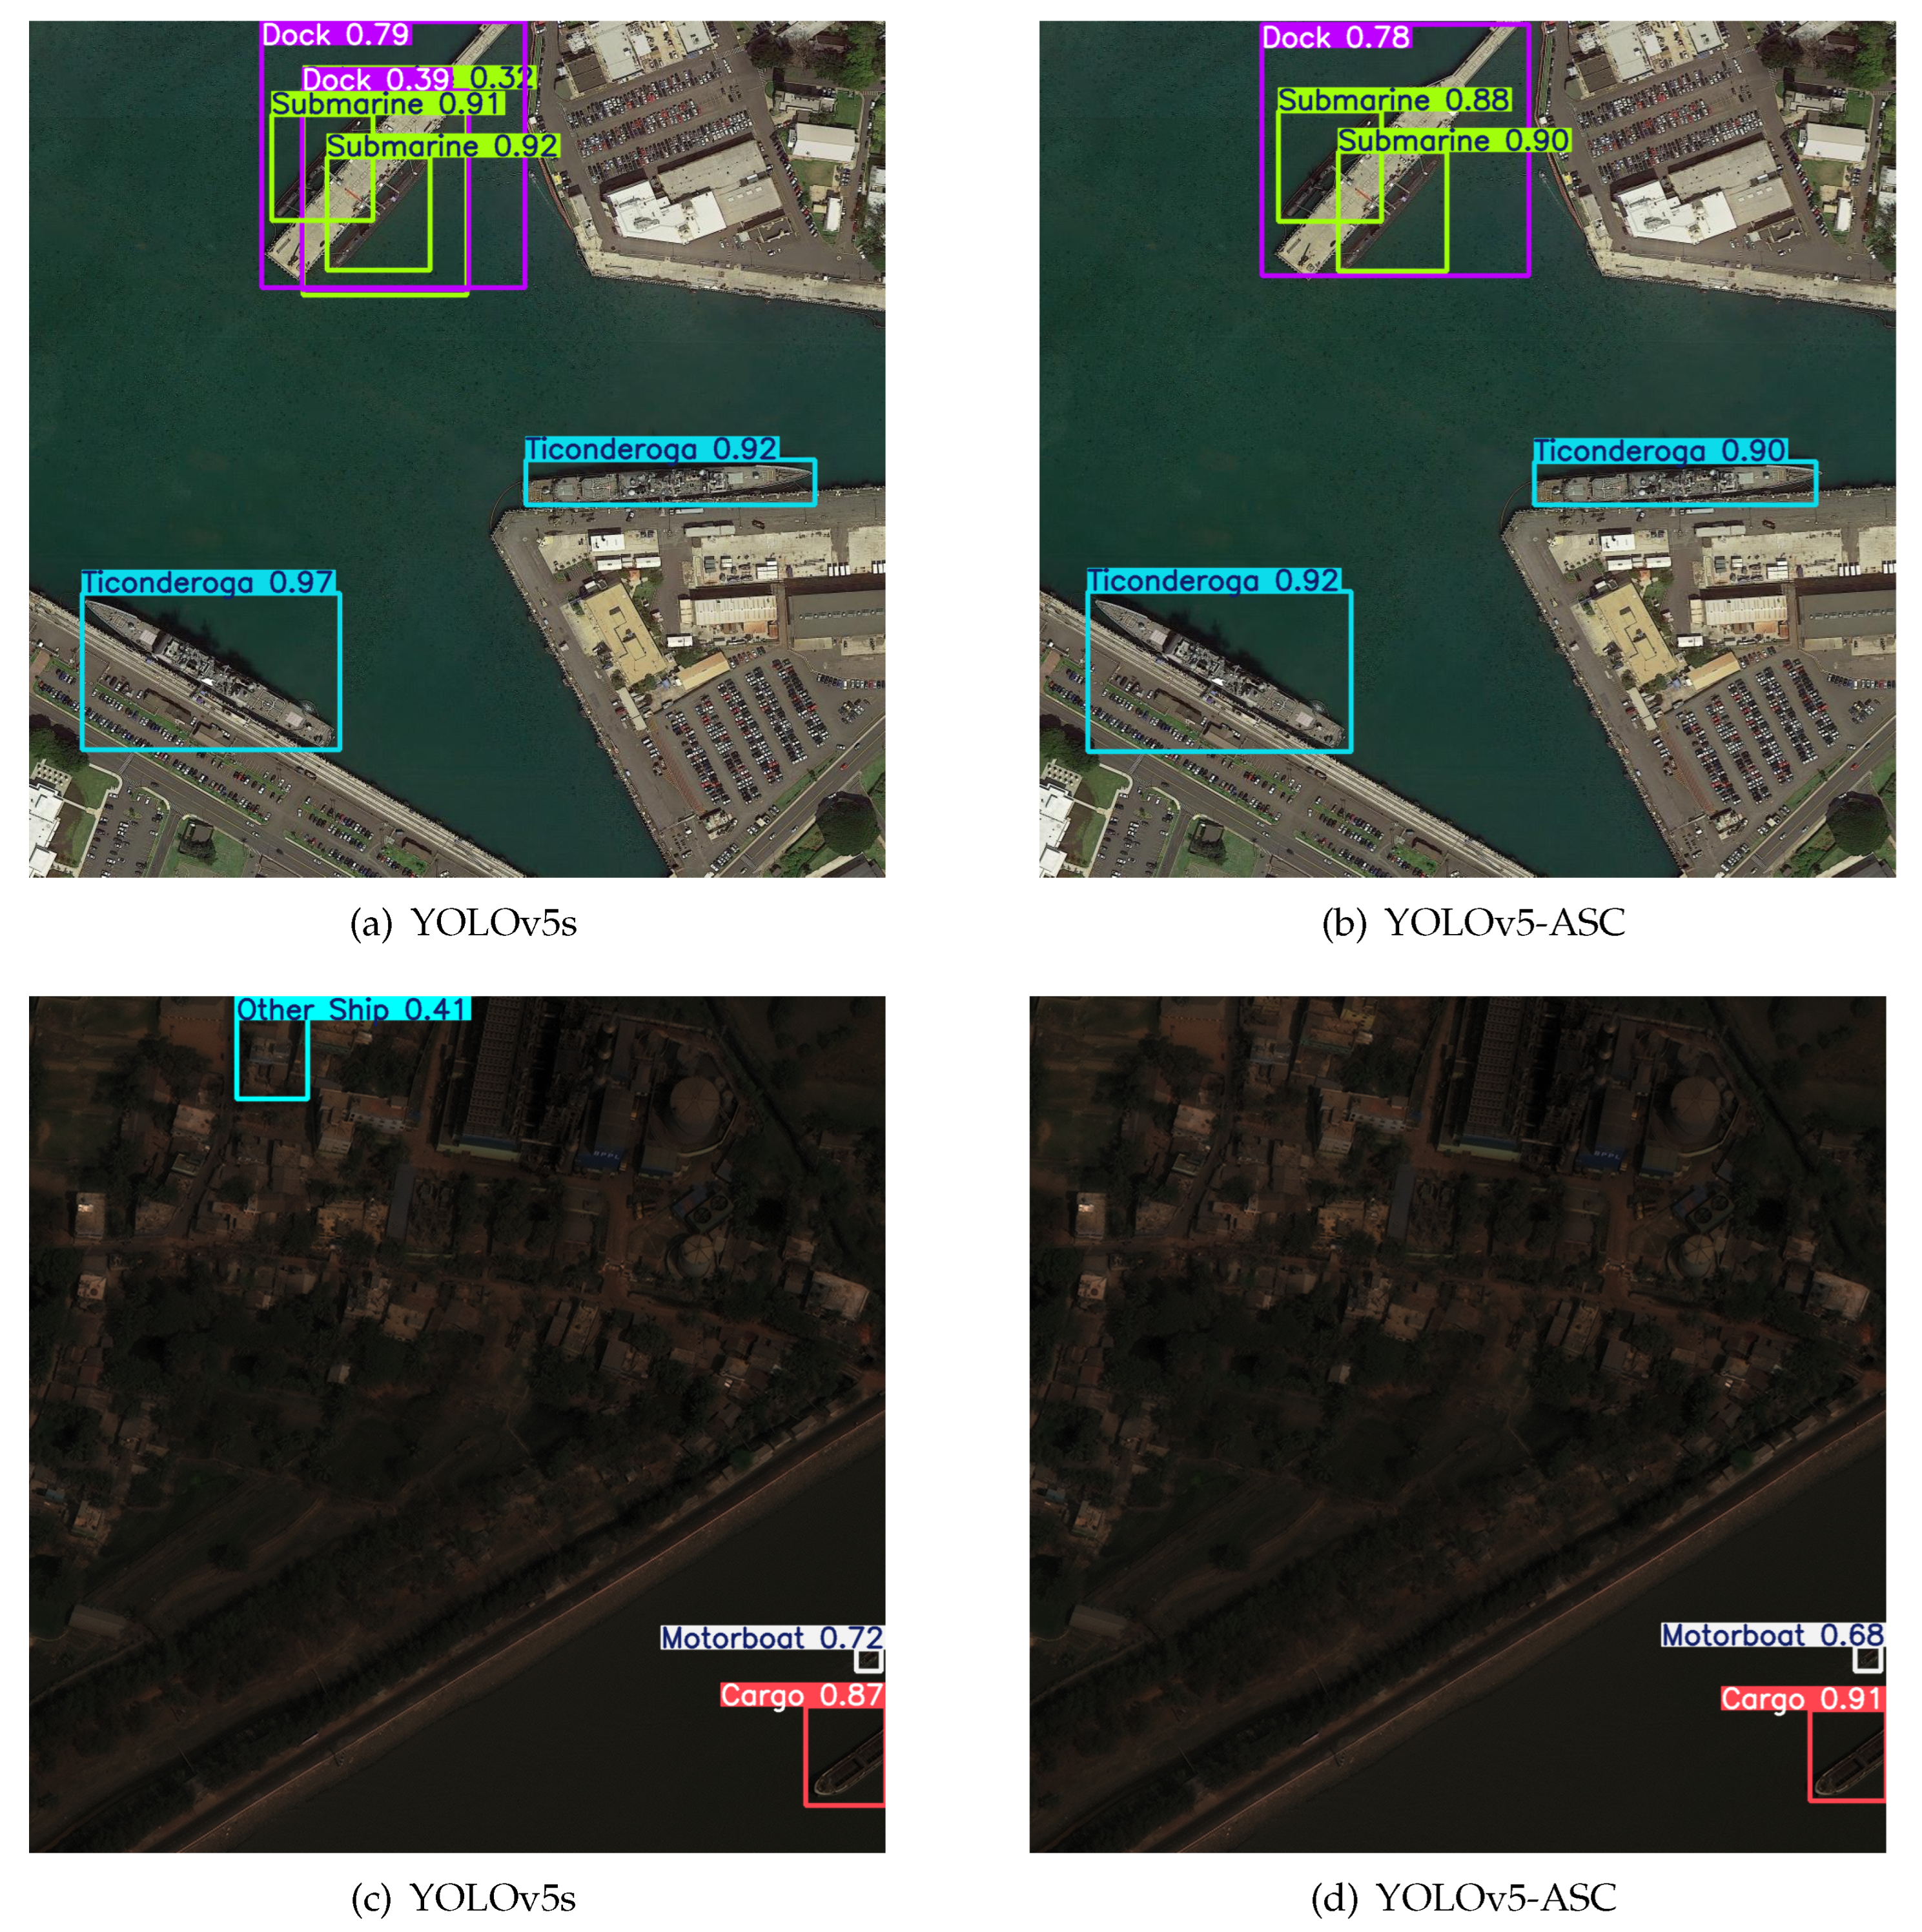
Maritime remote sensing images of ships in the harbor—this situation is a test of the model’s ability to recognize complex scenes. In this scenario, due to the complex shape of the dock, the original model recognizes the two dock
Figure 8a images, but the proposed model successfully recognizes the dock
Figure 8b image and is not confused. The relevant context can also lead to misrecognition—as shown in
Figure 8c, the original model recognizes the buildings on the shore as ships. The proposed model, on the other hand, was not confused by the buildings (
Figure 8d).
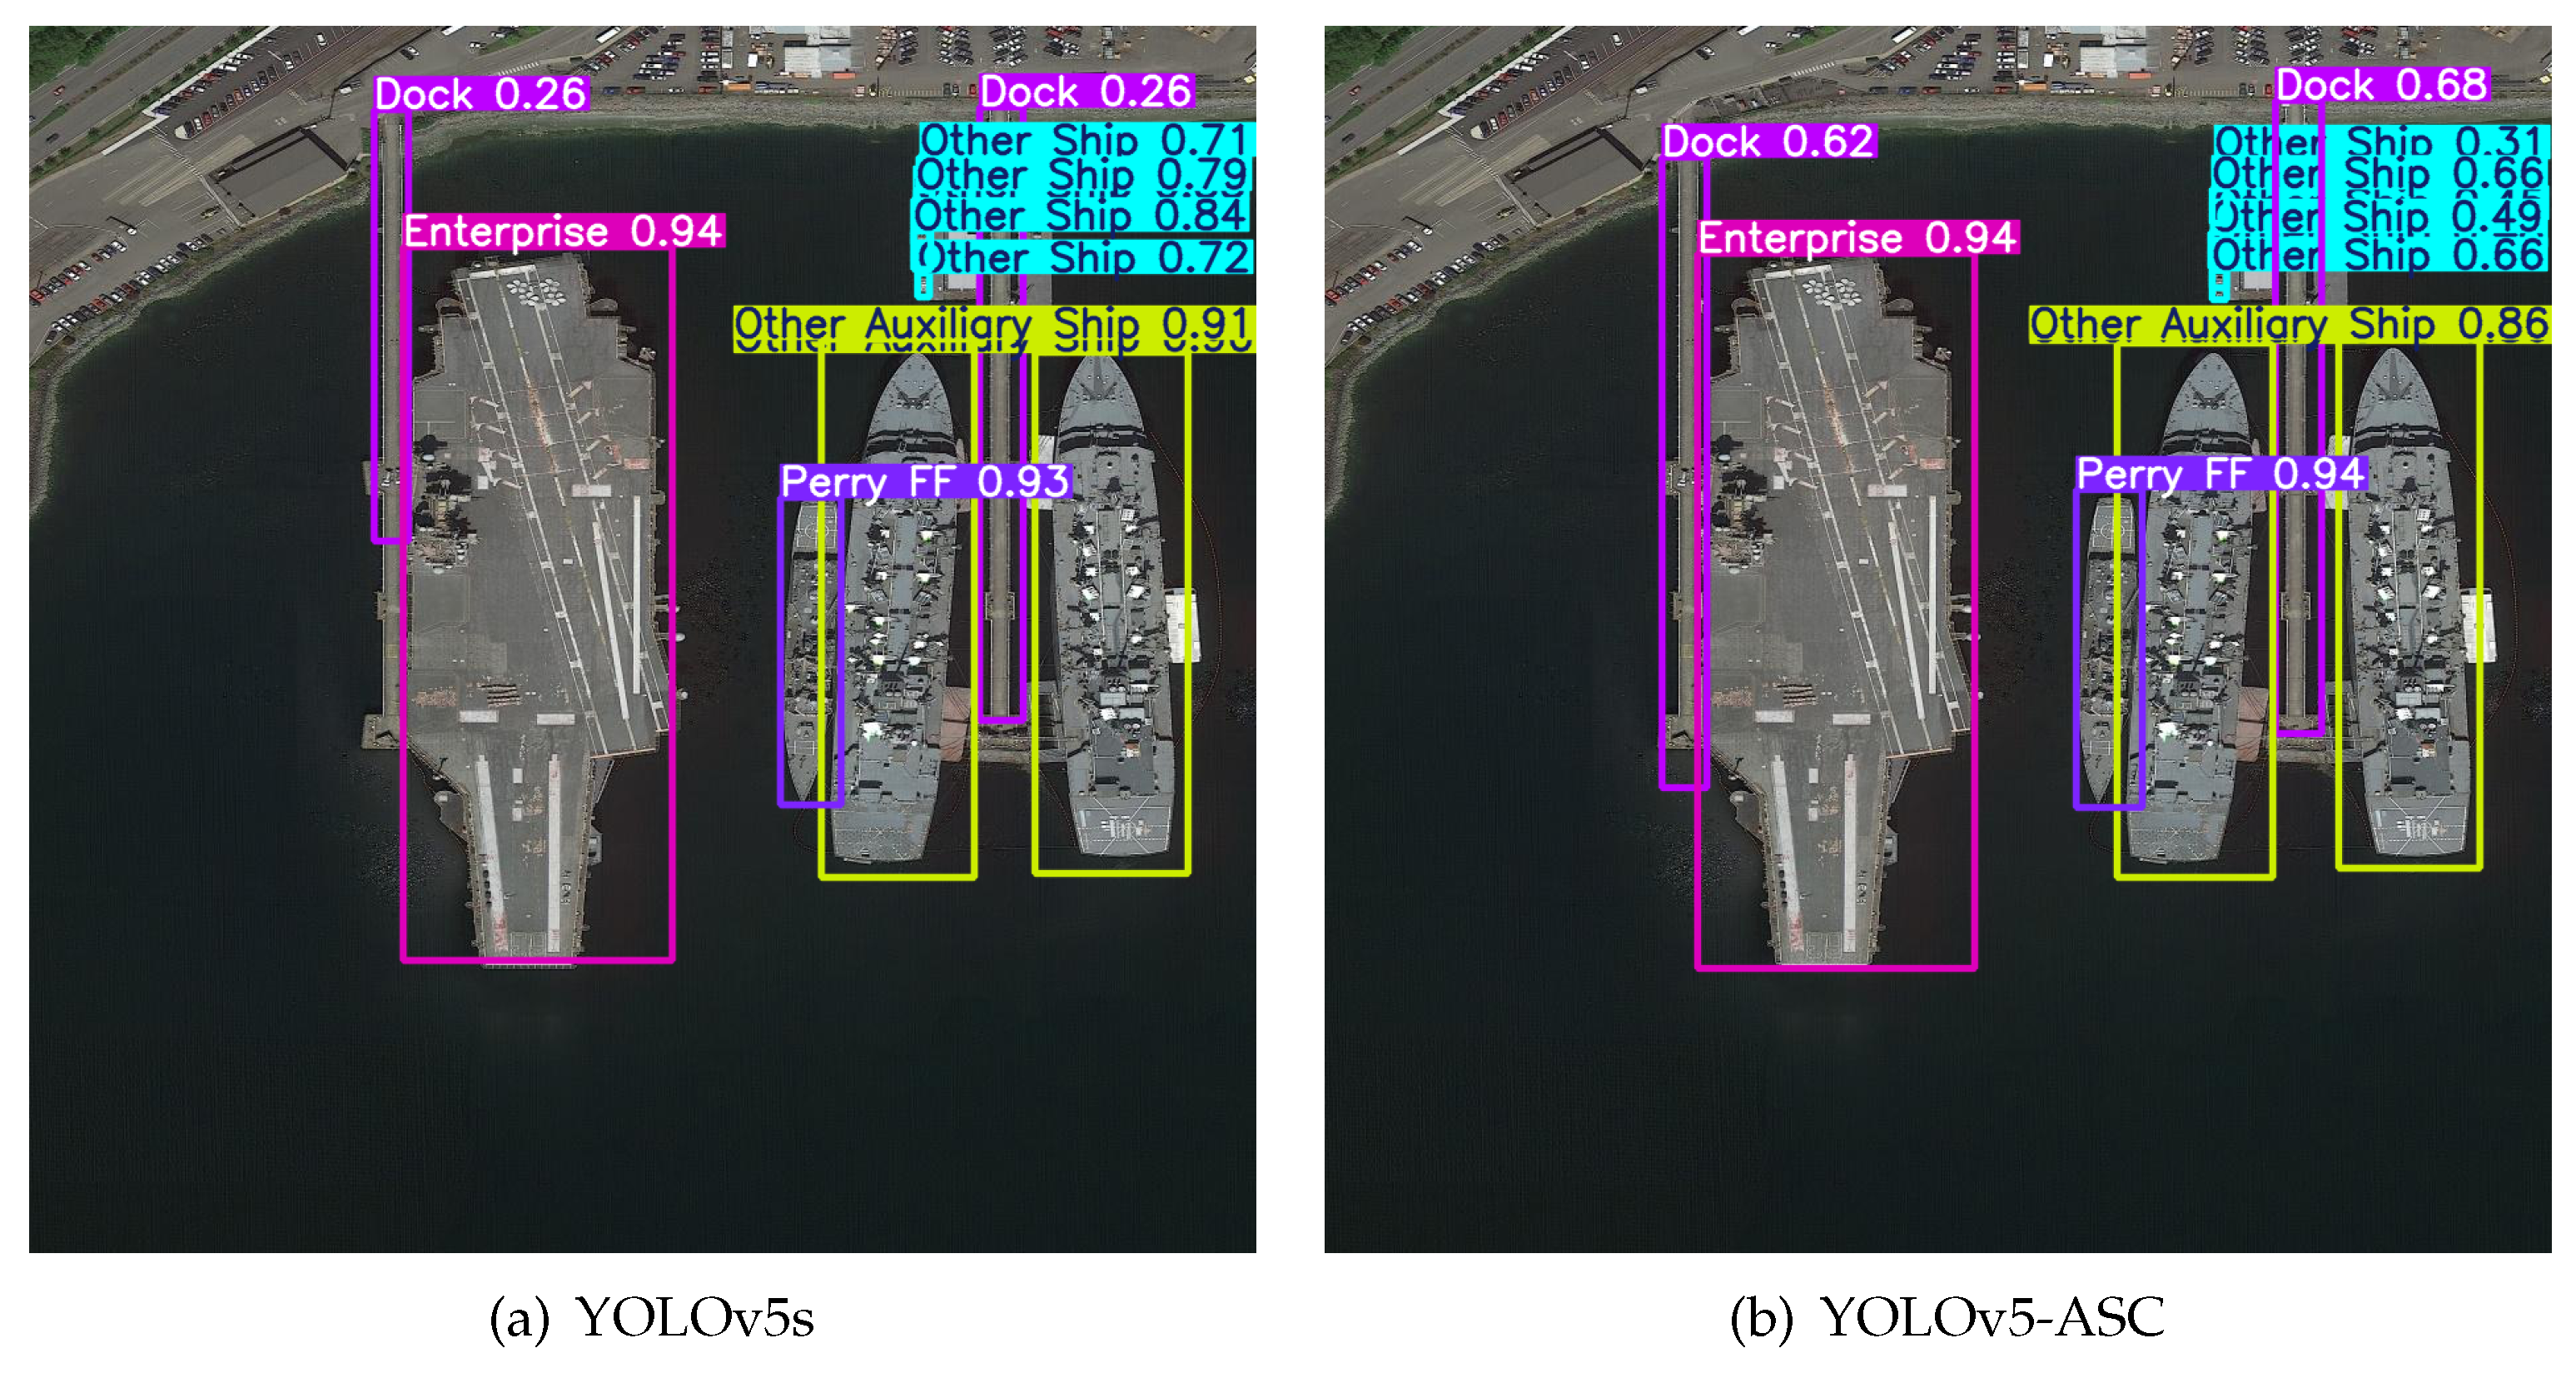
A marina is a special recognition target in remote sensing maritime imagery; it has a large aspect ratio and often appears side-by-side with boats that also have large aspect ratios, which poses a great challenge for recognition, as can be seen from
Figure 9a. The original model rightly recognises the marina, but its box information is wrong and contains only a part of the marina. As can be seen from
Figure 9b, the proposed model successfully meets this challenge by not only identifying the class correctly, but also the location of the box is not incorrect.
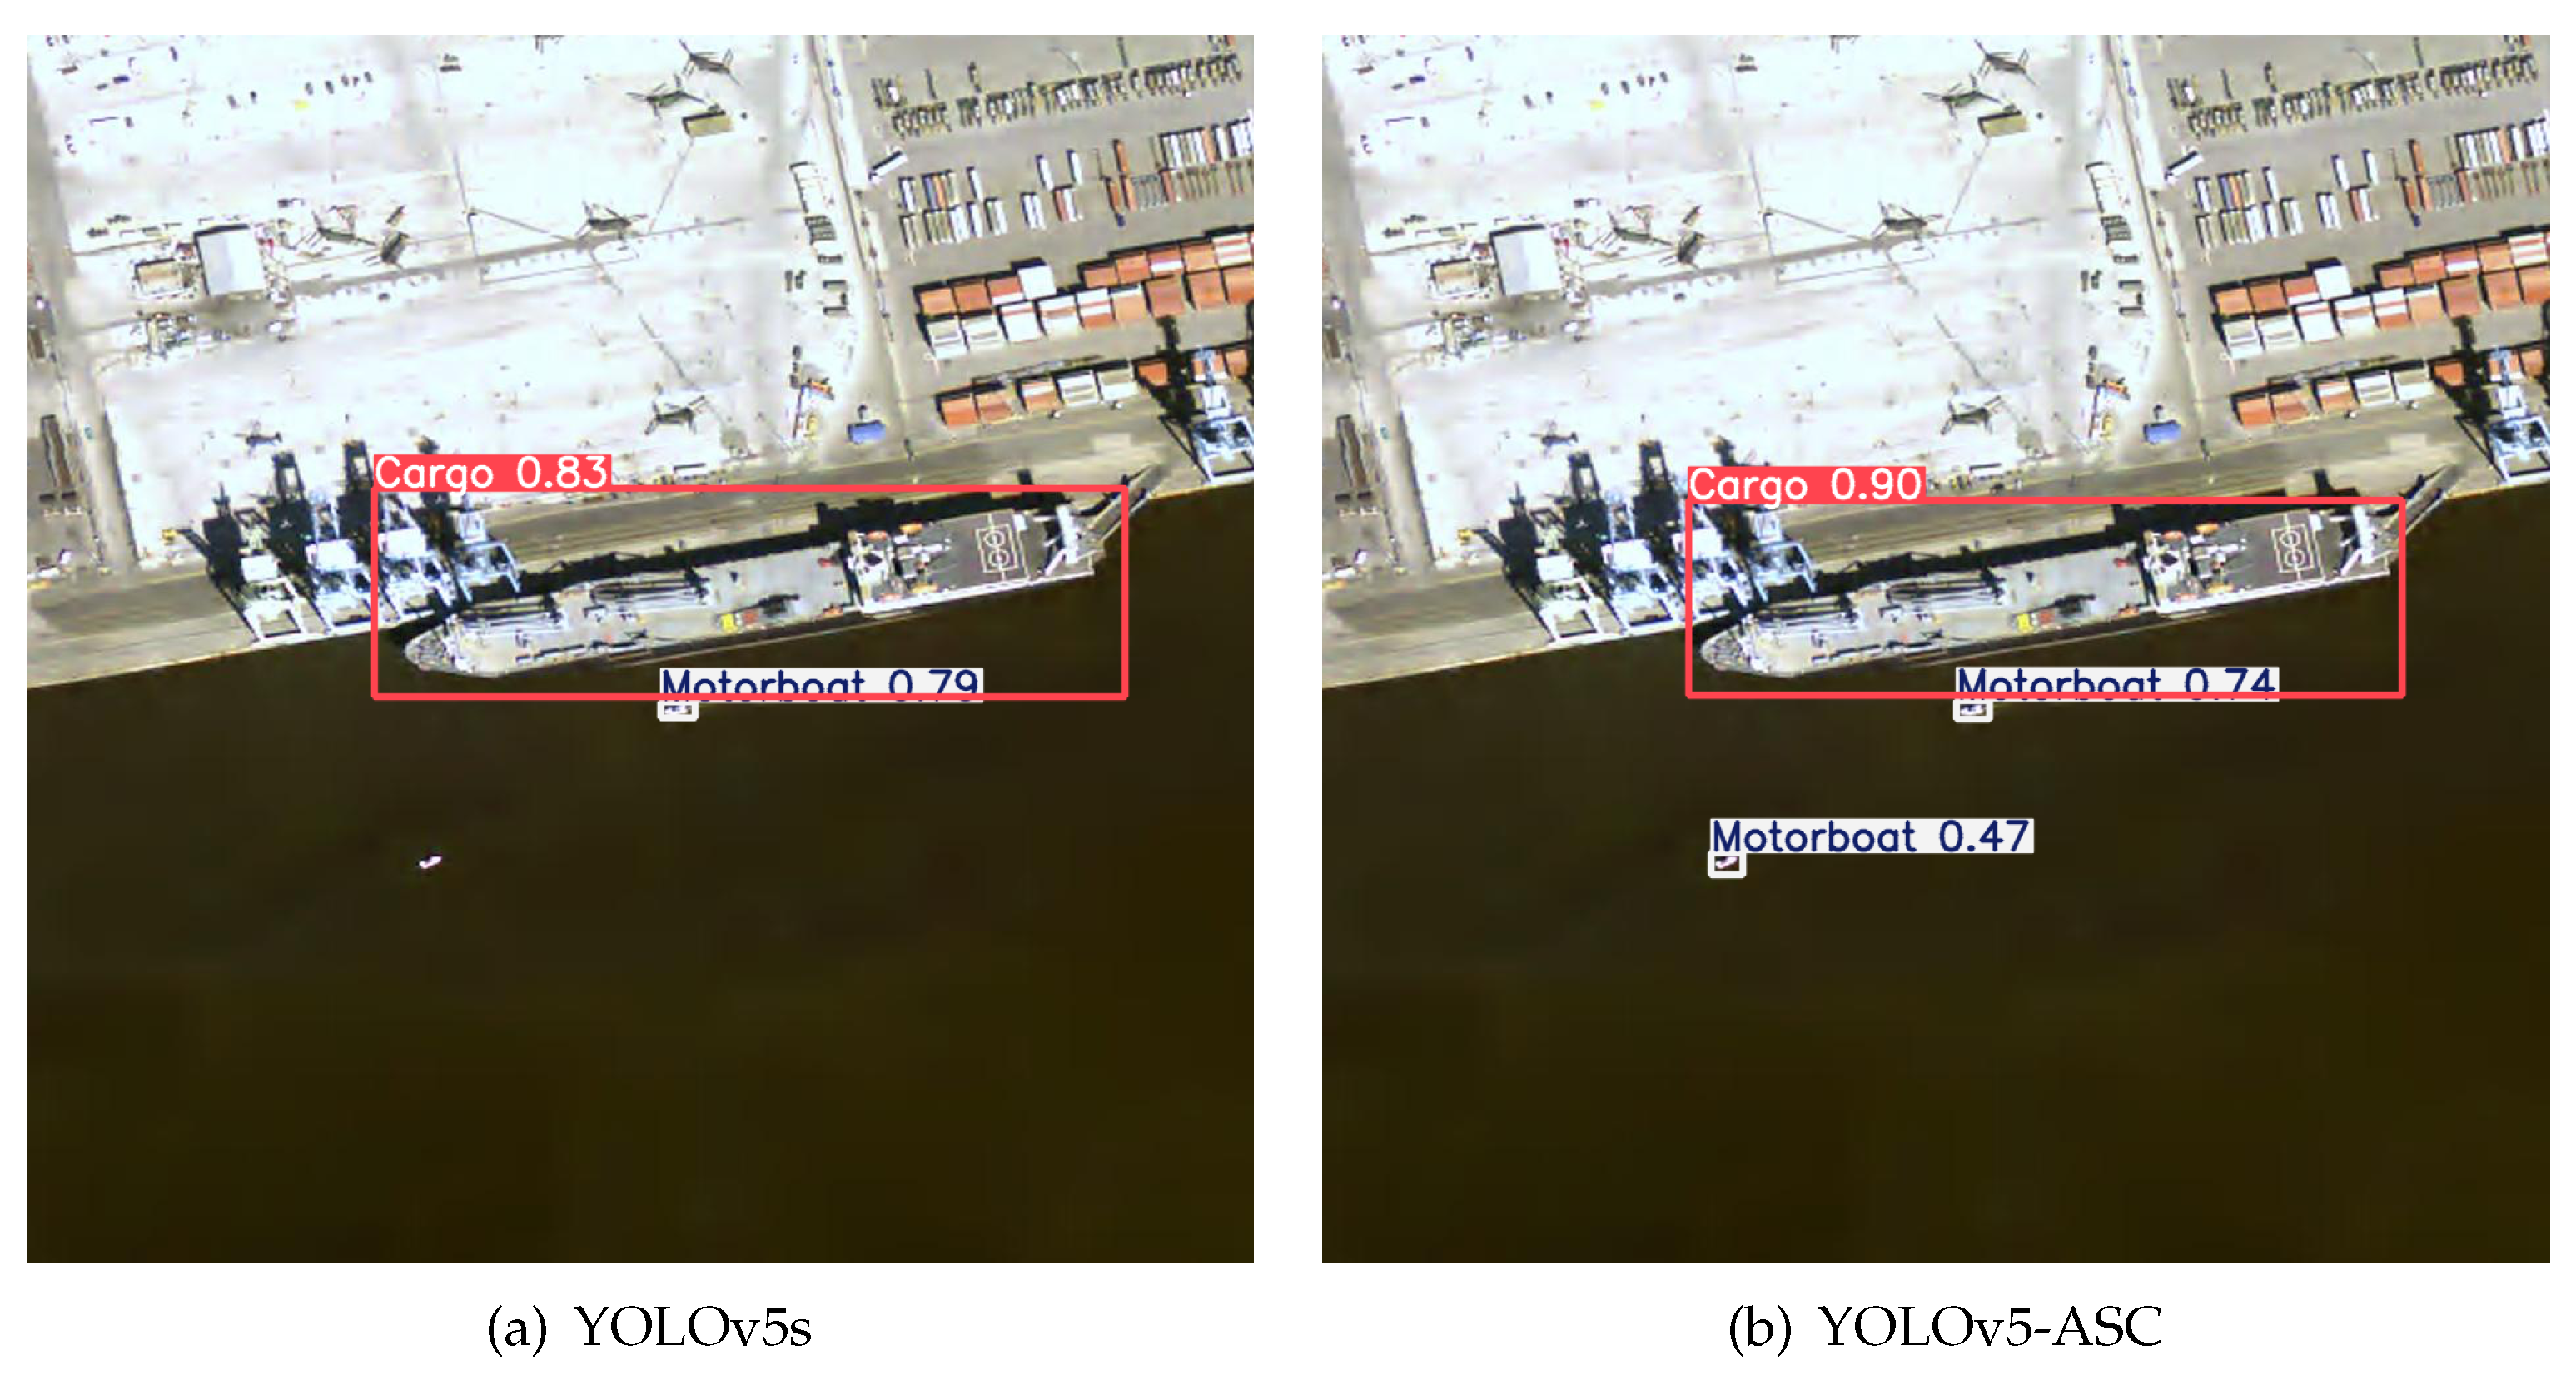
A huge difference in target size is also a frequent occurrence in ship remote sensing recognition scenarios, as seen in
Figure 10; the original model does not accurately recognize small targets, and the motorboat in
Figure 10a is ignored, while this problem does not appear in
Figure 10b, the result of the improved model recognition.
4.6. Comparison of Different Methods
In the results comparison section, we selected several models for comparison, including YOLOv5s, YOLOv5s-DCS, SSD-VGG16, YOLOv8s, YOLOv5n, and YOLOv5s-BSD. YOLOv5s is the base model for the proposed YOLOv5-ASC, and comparing it with this model provides a clear demonstration of the performance improvements brought by our proposed modifications. YOLOv5n is a smaller version of the YOLOv5 series, and including it helps assess the impact of model size on performance. YOLOv8, as the latest version in the YOLO series, adopts more advanced structural designs. Comparing it with YOLOv8s allows us to verify the competitiveness of our proposed method in the context of current mainstream detectors. YOLOv5s-DCS is optimized for maritime target detection in general scenes (non-remote sensing), and by comparing it with our model, we can evaluate the performance in similar scenarios. YOLOv5s-BSD is optimized for remote sensing maritime target detection, and since it uses the same dataset as our study, the comparison clearly highlights the advantages of our model. SSD-VGG16, which uses VGG16 as the backbone in the SSD (Single Shot MultiBox Detector) model, is a classic target detection algorithm. Although not part of the YOLO series, its performance provides valuable reference data. Through these comparisons, we comprehensively evaluate the performance of the YOLOv5-ASC model.
As shown in
Table 5, the proposed YOLOv5-ASC model demonstrates certain advantages compared to its baseline model. It maintains high accuracy and mAP while also offering advantages in terms of parameters and model size.
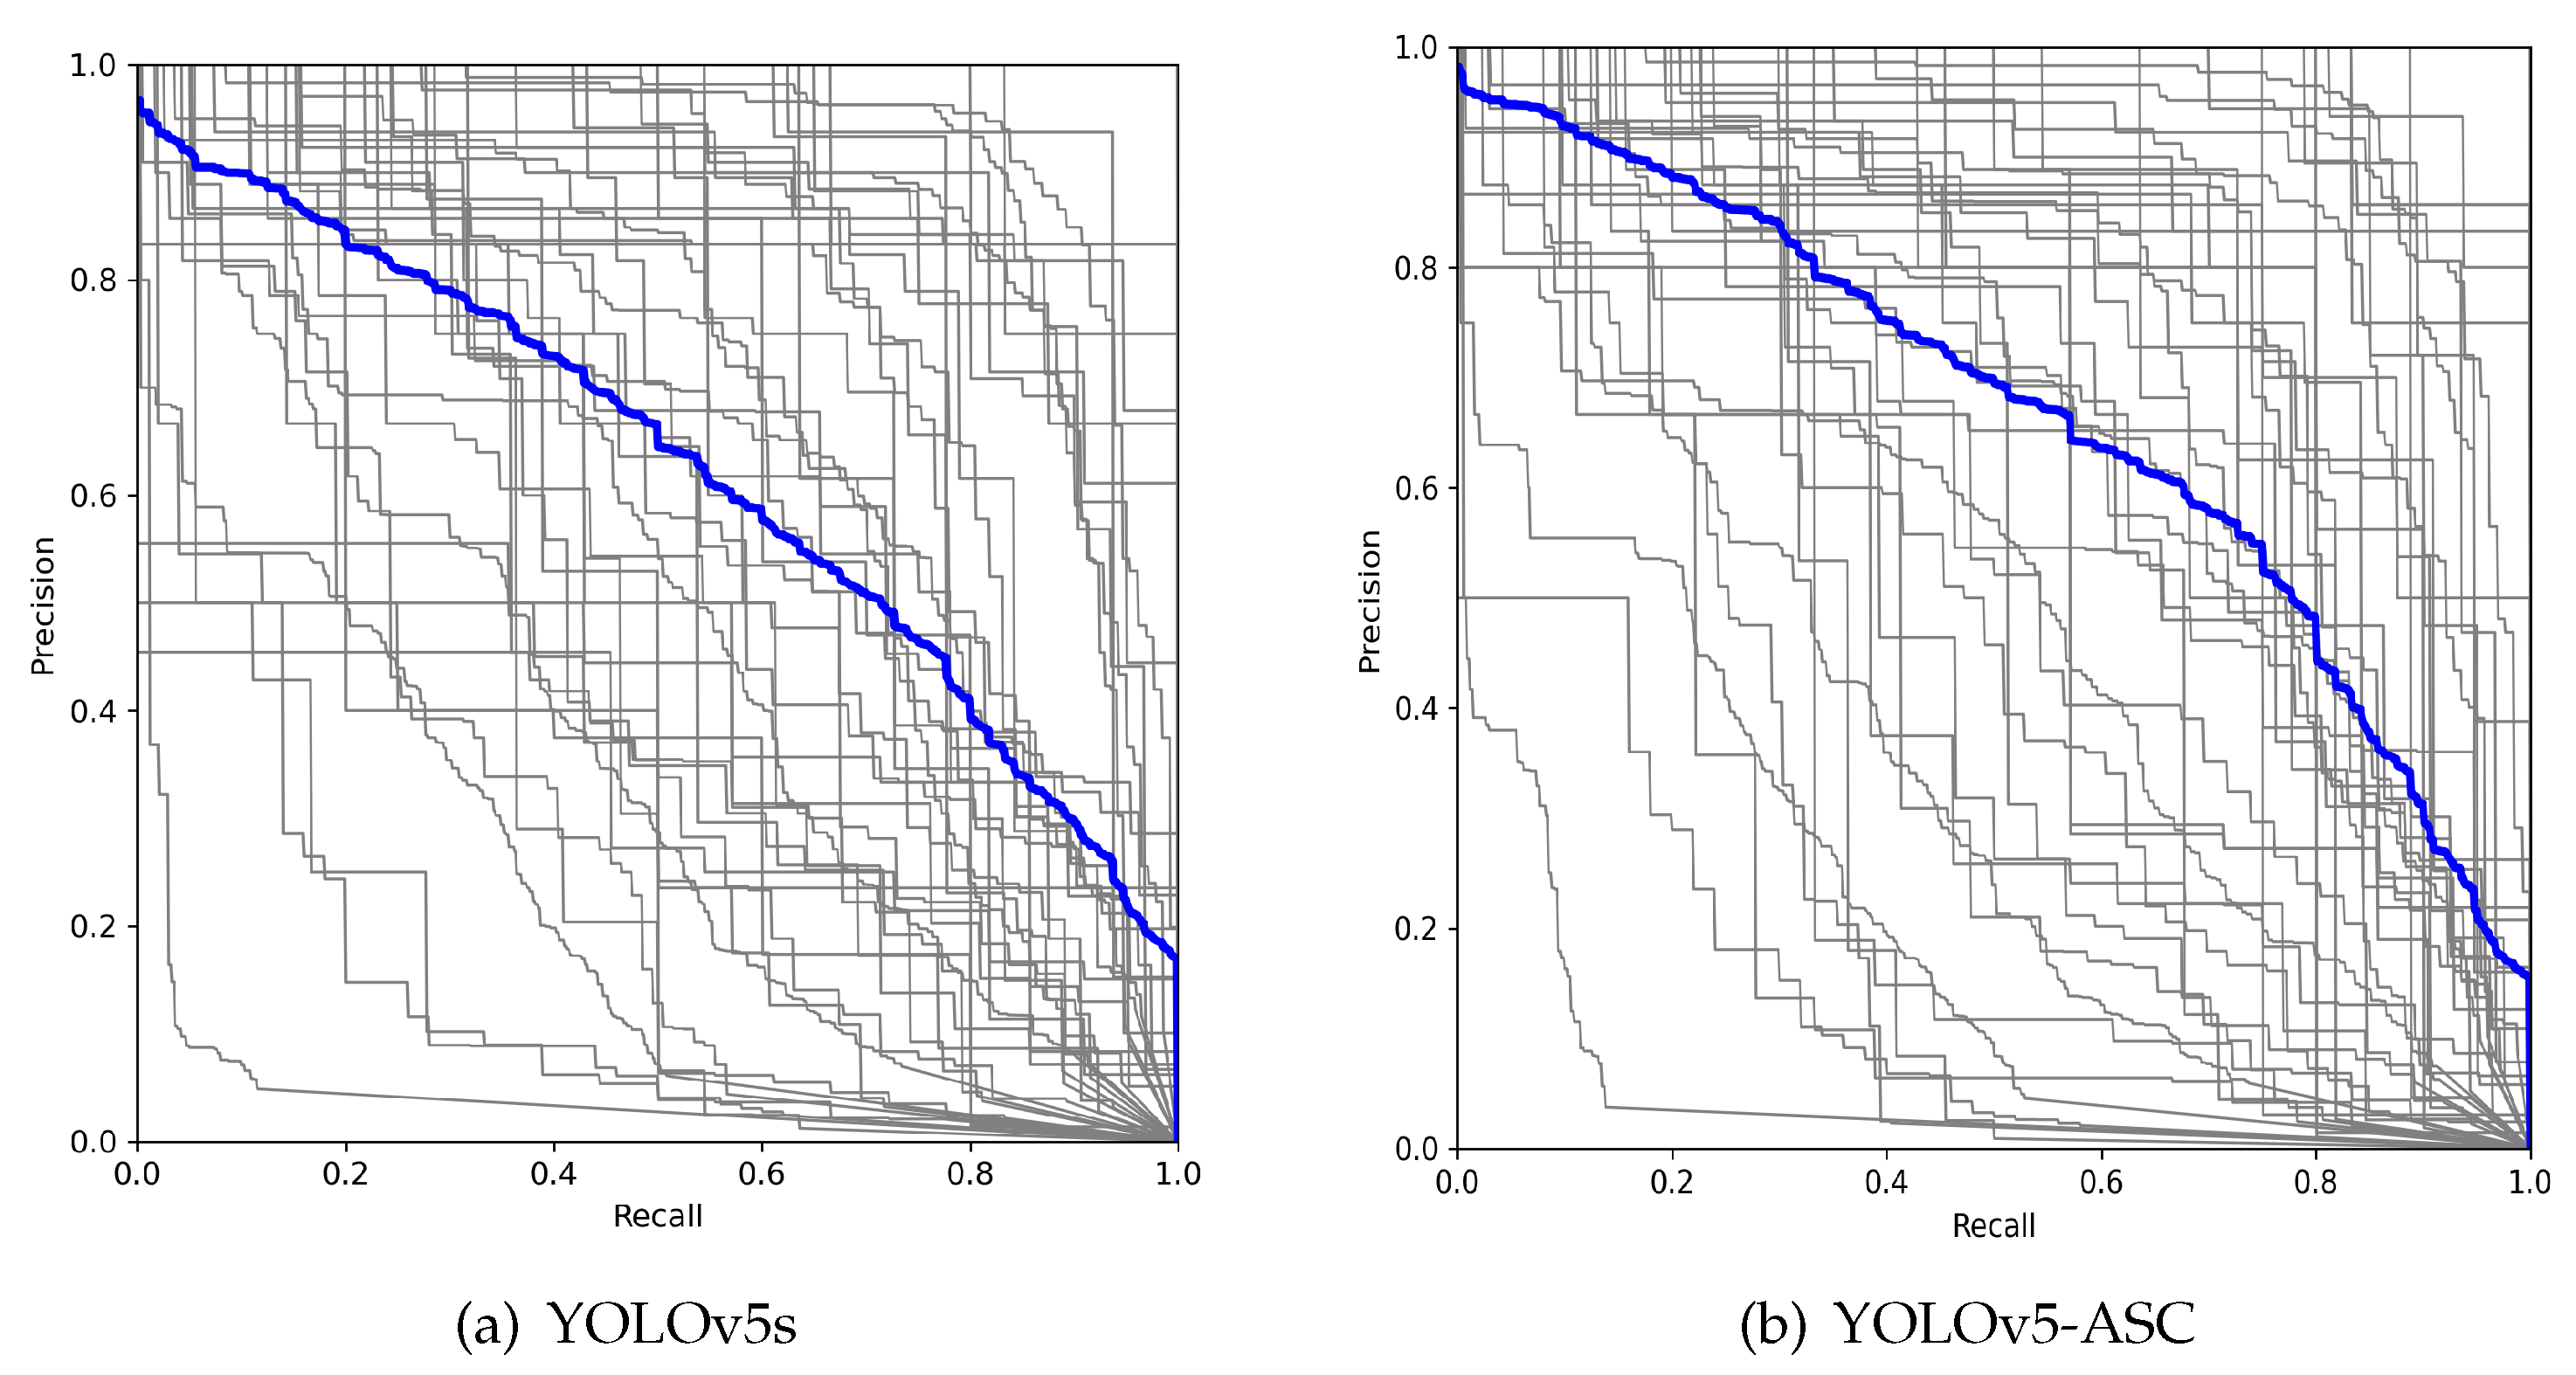
Compared to the original YOLOv5s model, the proposed model shows improvements across all aspects. The average precision is increased by 4.36%, and the accuracy is improved by 9.87 percentage points. Additionally, compared to our previously proposed YOLOv5-BSD algorithm, the new model exhibits significant enhancements in both performance and model parameters. The improved model requires only half the computational resources of YOLOv5-BSD while achieving a 1.91% increase in mAP@0.5 and a 7.4% improvement in accuracy.
When compared to the newer YOLOv8s model, the proposed model also shows strong competitiveness, outperforming it in terms of accuracy and mAP by 7.71 and 0.97 percentage points, respectively, with comparable parameter sizes. However, the proposed model demonstrates weaknesses in a broader mAP range and has a recall rate 3.17 percentage points lower than that of YOLOv8s. This might be due to the model overlooking a significant number of blurred targets, pointing to a potential direction for further optimization.
Time cost is a critical factor in maritime remote sensing applications, and the proposed model demonstrates a reasonable time cost. Firstly, compared to the original model, the computational cost of the proposed model has increased, with GFLOPs rising by 13.9 due to the incorporation of a more complex model structure. Secondly, compared to YOLOv5-BSD, a model with a similar detection focus, the proposed model achieves higher accuracy while requiring only 30.5 GFLOPs, which is just 88% of the computational cost of YOLOv5-BSD. Finally, compared to the newly proposed YOLOv8 model, the proposed model has a disadvantage in computational demand, with an additional 1.9 GFLOPs.
The proposed method not only demonstrates the performance advantage on the shipRSImageNet dataset, but also performs well on other maritime related datasets, and the experimental results are shown in
Table 6. The Singapore Maritime Dataset (SMD), a common maritime related dataset, focuses on video and image data for both coastal and offshore scenarios. iVision MRSSD is a ship remote sensing dataset acquired using synthetic aperture radar (SAR), which is closer to the target scenario of the proposed model. The proposed model has advantages over the original model on these two datasets, with mAP0.5 improving by 1.2% and 1.8%.
Table 7 presents the model’s detection performance across these object size categories. Compared to the original model, the proposed model shows varying degrees of performance improvement across different object sizes. For small objects, the proposed model demonstrates an approximately 2% overall improvement; however, the enhancement for small object detection is relatively modest compared to the other two categories. For medium-sized objects, the proposed model achieves the most significant improvement, with precision increasing by 8.73%. Large objects also see a notable enhancement, with precision improving by 2.17%.
In summary, the feature network proposed in this paper combines receptive field enhancement and deformable convolution, improving the ability to detect high-aspect-ratio targets and a large number of small objects. However, while it demonstrates improvements over the original model in detecting small targets, the overall performance remains suboptimal. Additionally, in scenarios with numerous targets, although the recognition accuracy has increased, there are still many undetected targets. These challenges highlight the direction for our future research.
Author Contributions
T.L.: Conceptualization, methodology, writing—original draft, software; X.J.: Formal analysis, writing—review and editing; T.S.: Methodology, supervision, validation, funding acquisition, writing—review; Q.C.: Visualization, software, data curation, investigation. All authors have read and agreed to the published version of the manuscript.
Funding
This research was funded by Shanghai Pujiang Program: 22PJD028.
Data Availability Statement
All data included in this study are available upon request by contact with the corresponding author.
Acknowledgments
I would like to thank my supervisors for their guidance and for their care and assistance with the thesis and all aspects of it. We thank the Innovation Academy for Microsatellites of Chinese Academy of Science for providing arithmetic support.
Conflicts of Interest
The authors declare no conflicts of interest.
Abbreviations
The following abbreviations are used in this manuscript:
| RFEM | Receptive Field Enhancement Module |
| ERFEM | Enhanced Receptive Field Enhancement Module |
| ARFEM | Attention-based Receptive Field Enhancement Module |
| DCN | Deformable Convolution Module |
| DCNv2 | Deformable Convolution Module v2 |
| SIoU | SCYLLA-IoU |
| CBAM | Convolutional Block Attention Module |
| SPPF | Spatial Pyramid Pooling Fast |
| CNN | Convolutional Neural Networks |
| IoU | Intersection over Union |
| YOLO | You Only Look Once |
| mAP | mean Average Precision |
| TP | true positive |
| FP | false positive |
| FN | false negative |
References
- Wang, Q.; Wang, J.; Wang, X.; Wu, L.; Feng, K.; Wang, G. A YOLOv7-Based Method for Ship Detection in Videos of Drones. J. Mar. Sci. Eng. 2024, 12, 1180. [Google Scholar] [CrossRef]
- Wang, W.; Zhang, X.; Sun, W.; Huang, M. A Novel Method of Ship Detection under Cloud Interference for Optical Remote Sensing Images. Remote Sens. 2022, 14, 3731. [Google Scholar] [CrossRef]
- Mishra, S.; Shalu, P.; Soman, D.; Singh, I. Advanced Ship Detection System Using Yolo V7. In Proceedings of the 2023 IEEE 7th Conference on Information and Communication Technology (CICT), Jabalpur, India, 15–17 December 2023; pp. 1–6. [Google Scholar] [CrossRef]
- Zhang, Z.; Zhang, L.; Wang, Y.; Feng, P.; He, R. ShipRSImageNet: A Large-Scale Fine-Grained Dataset for Ship Detection in High-Resolution Optical Remote Sensing Images. IEEE J. Sel. Top. Appl. Earth Obs. Remote Sens. 2021, 14, 8458–8472. [Google Scholar] [CrossRef]
- Zhuang, Y.; Li, L.; Chen, H. Small Sample Set Inshore Ship Detection From VHR Optical Remote Sensing Images Based on Structured Sparse Representation. IEEE J. Sel. Top. Appl. Earth Obs. Remote Sens. 2020, 13, 2145–2160. [Google Scholar] [CrossRef]
- Qin, P.; Cai, Y.; Liu, J.; Fan, P.; Sun, M. Multilayer Feature Extraction Network for Military Ship Detection from High-Resolution Optical Remote Sensing Images. IEEE J. Sel. Top. Appl. Earth Obs. Remote Sens. 2021, 14, 11058–11069. [Google Scholar] [CrossRef]
- Girshick, R. Fast R-CNN. In Proceedings of the IEEE International Conference on Computer Vision (ICCV), Santiago, Chile, 7–13 December 2015. [Google Scholar]
- Ren, S.; He, K.; Girshick, R.; Sun, J. Faster R-CNN: Towards Real-Time Object Detection with Region Proposal Networks. IEEE Trans. Pattern Anal. Mach. Intell. 2017, 39, 1137–1149. [Google Scholar] [CrossRef] [PubMed]
- Redmon, J.; Divvala, S.; Girshick, R.; Farhadi, A. You Only Look Once: Unified, Real-Time Object Detection. In Proceedings of the 2016 IEEE Conference on Computer Vision and Pattern Recognition (CVPR), Las Vegas, NV, USA, 26 June–1 July 2016; pp. 779–788. [Google Scholar] [CrossRef]
- Wang, C.Y.; Bochkovskiy, A.; Liao, H.Y.M. YOLOv7: Trainable Bag-of-Freebies Sets New State-of-the-Art for Real-Time Object Detectors. In Proceedings of the 2023 IEEE/CVF Conference on Computer Vision and Pattern Recognition (CVPR), Vancouver, BC, Canada, 17–24 June 2023; pp. 7464–7475. [Google Scholar] [CrossRef]
- Redmon, J.; Farhadi, A. YOLOv3: An Incremental Improvement. arXiv 2018, arXiv:1804.02767. [Google Scholar] [CrossRef]
- Redmon, J.; Farhadi, A. YOLO9000: Better, Faster, Stronger. In Proceedings of the 2017 IEEE Conference on Computer Vision and Pattern Recognition (CVPR), Honolulu, HI, USA, 21–26 July 2017; pp. 6517–6525. [Google Scholar] [CrossRef]
- Li, C.; Li, L.; Jiang, H.; Weng, K.; Geng, Y.; Li, L.; Ke, Z.; Li, Q.; Cheng, M.; Nie, W.; et al. YOLOv6: A Single-Stage Object Detection Framework for Industrial Applications. arXiv 2022, arXiv:2209.02976. [Google Scholar] [CrossRef]
- Bochkovskiy, A.; Wang, C.Y.; Liao, H.Y.M. YOLOv4: Optimal Speed and Accuracy of Object Detection. arXiv 2020, arXiv:2004.10934. [Google Scholar] [CrossRef]
- Liu, W.; Anguelov, D.; Erhan, D.; Szegedy, C.; Reed, S.; Fu, C.Y.; Berg, A.C. SSD: Single Shot MultiBox Detector. In Proceedings of the Computer Vision—ECCV, Amsterdam, The Netherlands, 8–10 and 15–16 October 2016; Leibe, B., Matas, J., Sebe, N., Welling, M., Eds.; Springer: Cham, Switzerland, 2016; pp. 21–37. [Google Scholar] [CrossRef]
- Ma, S.; Wang, W.; Pan, Z.; Hu, Y.; Zhou, G.; Wang, Q. A Recognition Model Incorporating Geometric Relationships of Ship Components. Remote Sens. 2023, 16, 130. [Google Scholar] [CrossRef]
- Liang, S.; Liu, X.; Yang, Z.; Liu, M.; Yin, Y. Offshore Ship Detection in Foggy Weather Based on Improved YOLOv8. J. Mar. Sci. Eng. 2024, 12, 1641. [Google Scholar] [CrossRef]
- Yu, Z.; Huang, H.; Chen, W.; Su, Y.; Liu, Y.; Wang, X. YOLO-FaceV2: A Scale and Occlusion Aware Face Detector. arXiv 2022. [Google Scholar] [CrossRef]
- Abhinaba, H.; Jidesh, P. Detection and Classification of Ships Using a Self-Attention Residual Network. In Proceedings of the 2022 IEEE 6th Conference on Information and Communication Technology (CICT), Gwalior, India, 18–20 November 2022; pp. 1–6. [Google Scholar] [CrossRef]
- Xiong, W.; Xiong, Z.; Cui, Y. An Explainable Attention Network for Fine-Grained Ship Classification Using Remote-Sensing Images. IEEE Trans. Geosci. Remote Sens. 2022, 60, 1–14. [Google Scholar] [CrossRef]
- Van Ricardo Zalukhu, B.; Wijayanto, A.W.; Habibie, M.I. Marine Vessels Detection on Very High-Resolution Remote Sensing Optical Satellites Using Object-Based Deep Learning. In Proceedings of the 2022 IEEE International Conference on Communication, Networks and Satellite (COMNETSAT), Solo, Indonesia, 3–5 November 2022; pp. 149–154. [Google Scholar] [CrossRef]
- Guo, B.; Zhang, R.; Guo, H.; Yang, W.; Yu, H.; Zhang, P.; Zou, T. Fine-Grained Ship Detection in High-Resolution Satellite Images With Shape-Aware Feature Learning. IEEE J. Sel. Top. Appl. Earth Obs. Remote Sens. 2023, 16, 1914–1926. [Google Scholar] [CrossRef]
- Chenguang, Z.; Guifa, T. Application of Improved YOLO V5s Model for Regional Poverty Assessment Using Remote Sensing Image Target Detection. Photogramm. Eng. Remote Sens. 2023, 89, 499–513. [Google Scholar] [CrossRef]
- He, K.; Gkioxari, G.; Dollar, P.; Girshick, R. Mask R-CNN. In Proceedings of the IEEE International Conference on Computer Vision, Venice, Italy, 22–29 October 2017; pp. 2961–2969. [Google Scholar]
- Dai, J.; Qi, H.; Xiong, Y.; Li, Y.; Zhang, G.; Hu, H.; Wei, Y. Deformable Convolutional Networks. In Proceedings of the IEEE International Conference on Computer Vision, Venice, Italy, 22–29 October 2017; pp. 764–773. [Google Scholar]
- Zhu, X.; Hu, H.; Lin, S.; Dai, J. Deformable ConvNets v2: More Deformable, Better Results. arXiv 2018, arXiv:1811.11168. [Google Scholar] [CrossRef]
- Woo, S.; Park, J.; Lee, J.Y.; Kweon, I.S. CBAM: Convolutional Block Attention Module. arXiv 2018, arXiv:1807.06521. [Google Scholar]
- Gevorgyan, Z. SIoU Loss: More Powerful Learning for Bounding Box Regression. arXiv 2022, arXiv:2205.12740. [Google Scholar] [CrossRef]
| Disclaimer/Publisher’s Note: The statements, opinions and data contained in all publications are solely those of the individual author(s) and contributor(s) and not of MDPI and/or the editor(s). MDPI and/or the editor(s) disclaim responsibility for any injury to people or property resulting from any ideas, methods, instructions or products referred to in the content. |
© 2025 by the authors. Licensee MDPI, Basel, Switzerland. This article is an open access article distributed under the terms and conditions of the Creative Commons Attribution (CC BY) license (https://creativecommons.org/licenses/by/4.0/).


