
Epidemic Modeling in Satellite Towns and Interconnected Cities: Data-Driven Simulation and Real-World Lockdown Validation

 ,
,  , , , and
Abstract

1. Introduction
- A new mathematical framework, namely, SCIRD (Susceptible–Confined–Infected–Recovered–Deceased) is proposed to address the dynamics of COVID-19 dissemination in small interconnected urban centers. Unlike most SIR-based proposals that do not simultaneously cope with population flows and lockdowns, our approach gathers both factors into a unified and practical framework.
- A comprehensive evaluation of the lockdown outcomes, providing a non-intrusive methodology to assess different quarantine schemes in two isolated urban centers. By taking real data from these regions, we determine the minimum duration of lockdowns to consistently reduce cases and deaths. We validate our model using real data from a lockdown case that took place in a Brazilian medium-sized city.
- The combined analysis of lockdowns and people’s mobility between satellite cities and small/medium-sized urban centers, as opposed to contexts studied in the scientific literature such as large metropolitan areas like state capitals. The calibration of mobility rates is performed from data locally collected from each interconnected city.
- A mathematical formulation capable of capturing the spread of COVID-19 for the challenging cases where the number of infected remains limited to dozens or, at most, hundreds amid a context of data scarcity.
2. Materials and Methods
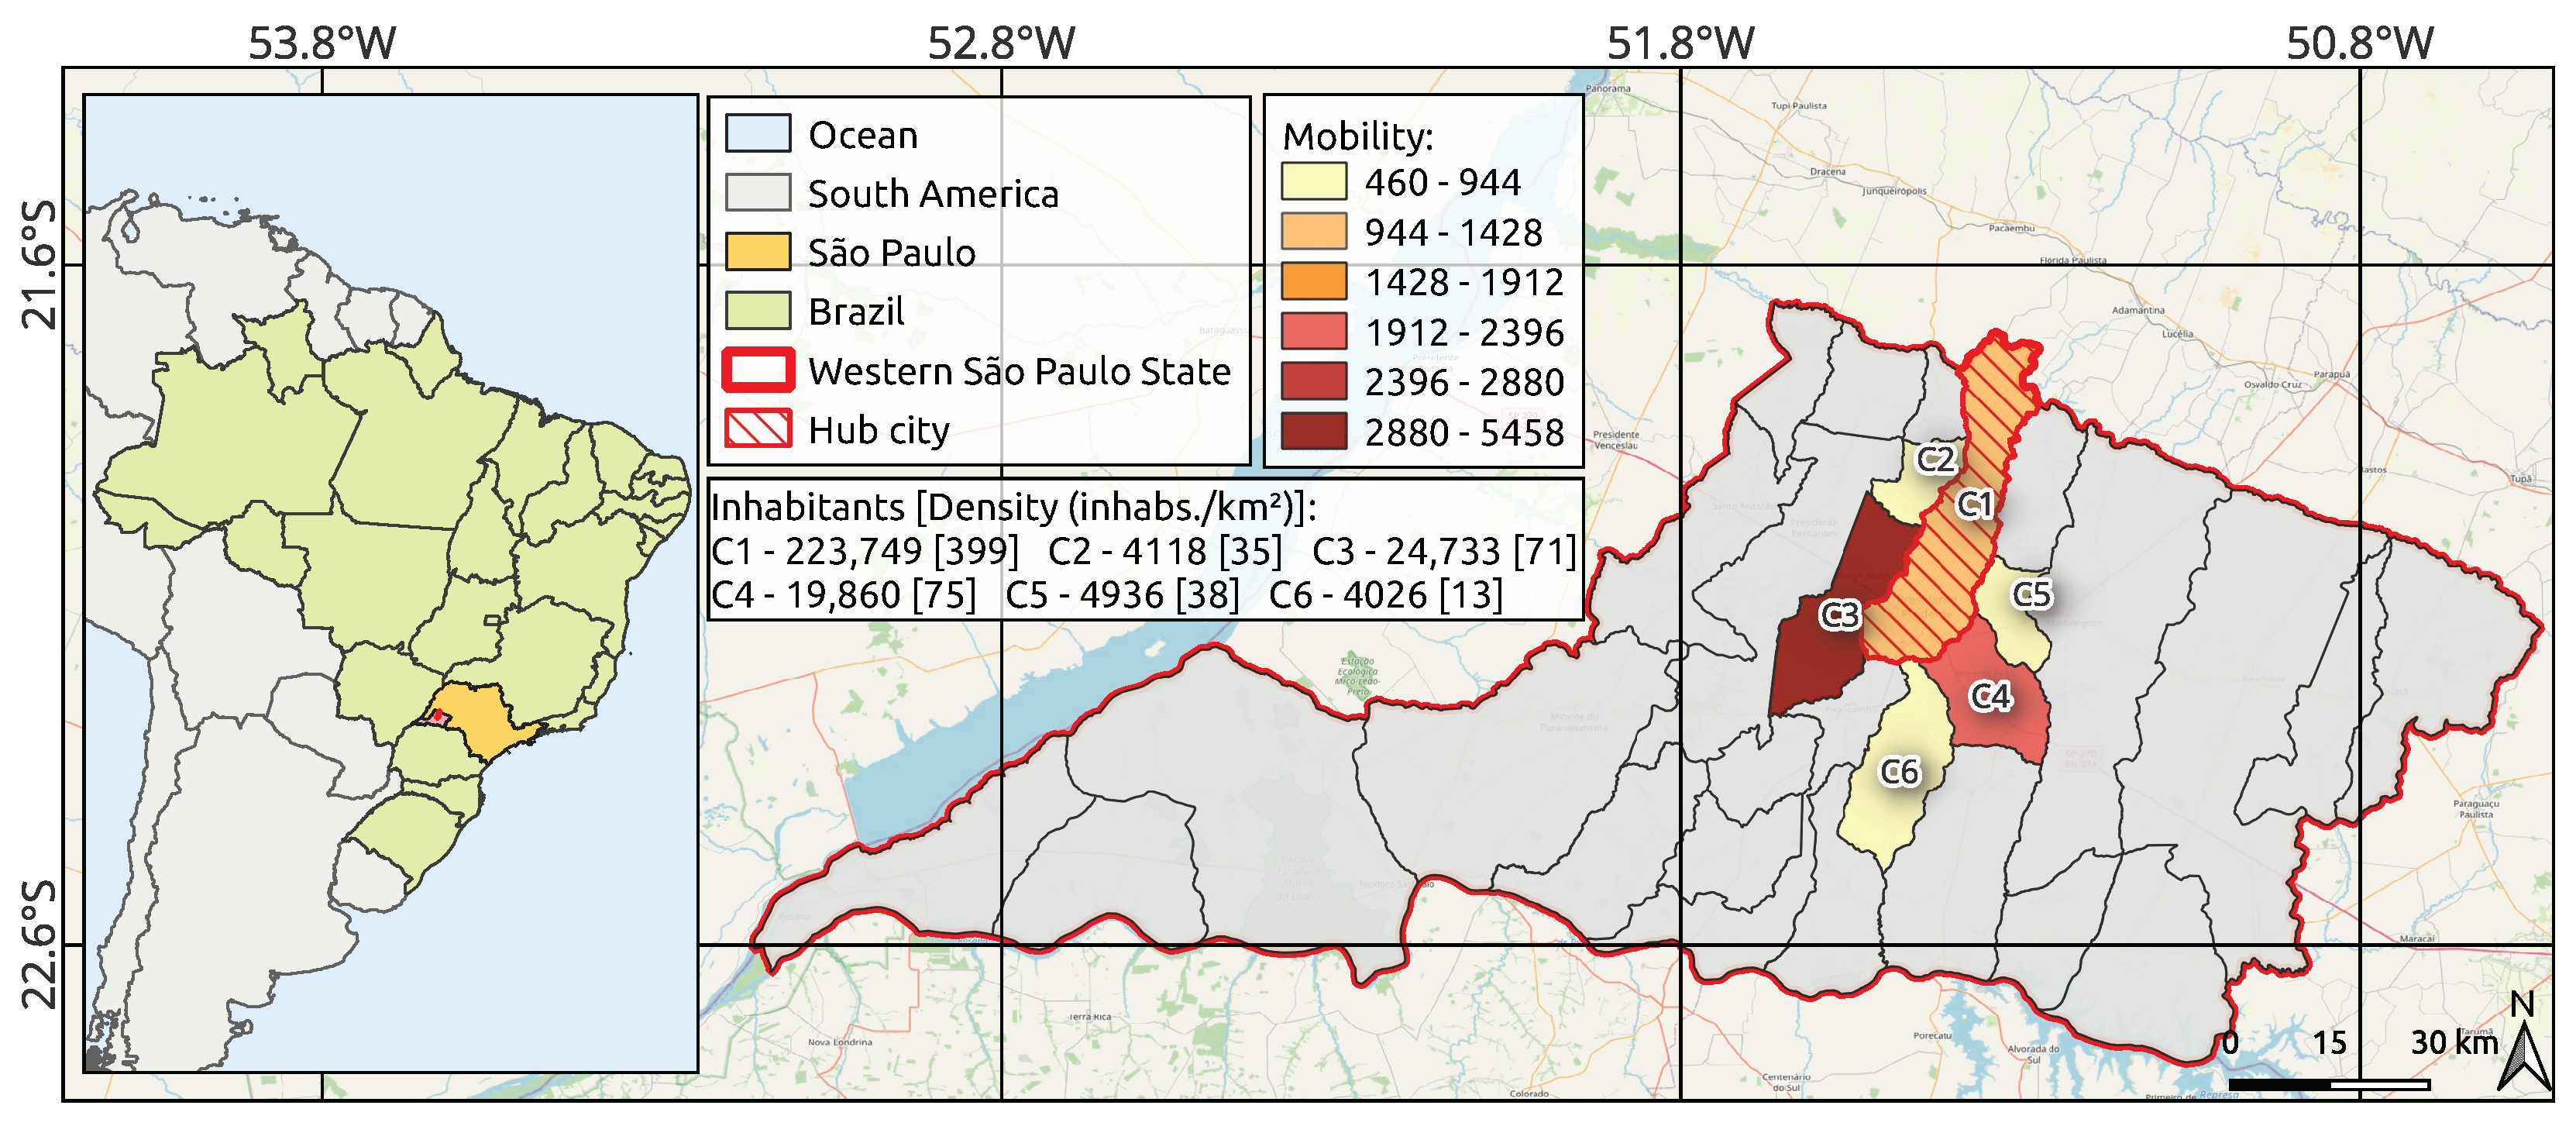
2.1. Study Area and Selection Criteria
- The region is the main urban hub in Northwest São Paulo, Brazil’s leading state, which accounts for 9.2% of the national GDP, ranking it ahead of countries like Poland, Sweden, Norway, Ireland, and Singapore [51,52]. The region is economically significant and acts as a primary transit hub for people.
- The region is a medium-sized center with high influence on neighboring cities [53]. This setting offers a hard-to-find case of COVID-19 outbreak with a major city and its satellite towns, free from the confounding effects of larger metropolitan zones.
- Unlike previous works that take the large metropolitan area of Wuhan (China) as a study case, which has 12 million inhabitants, our second study region, the Brazilian city of Araraquara, was chosen because it was the first mid-sized city (with fewer than 300,000 residents) in the world to implement a 10-day-long lockdown [54,55,56,57].
- There is a gap in the literature regarding studies focused on less populous and non-capital areas [30,50]. Indeed, a search in the Scopus database combining the terms “COVID-19”, “lockdown”, “small cities”, and “epidemiology model” yielded only six papers [44,58,59,60,61,62], none of which focused on modeling COVID-19 spread with short-range transmission between nearby cities like ours. Inspired by works based on global regions [32,33,34,35,36], our micro-regional-based approach can advance the literature, complementing existing macro-analytical studies.
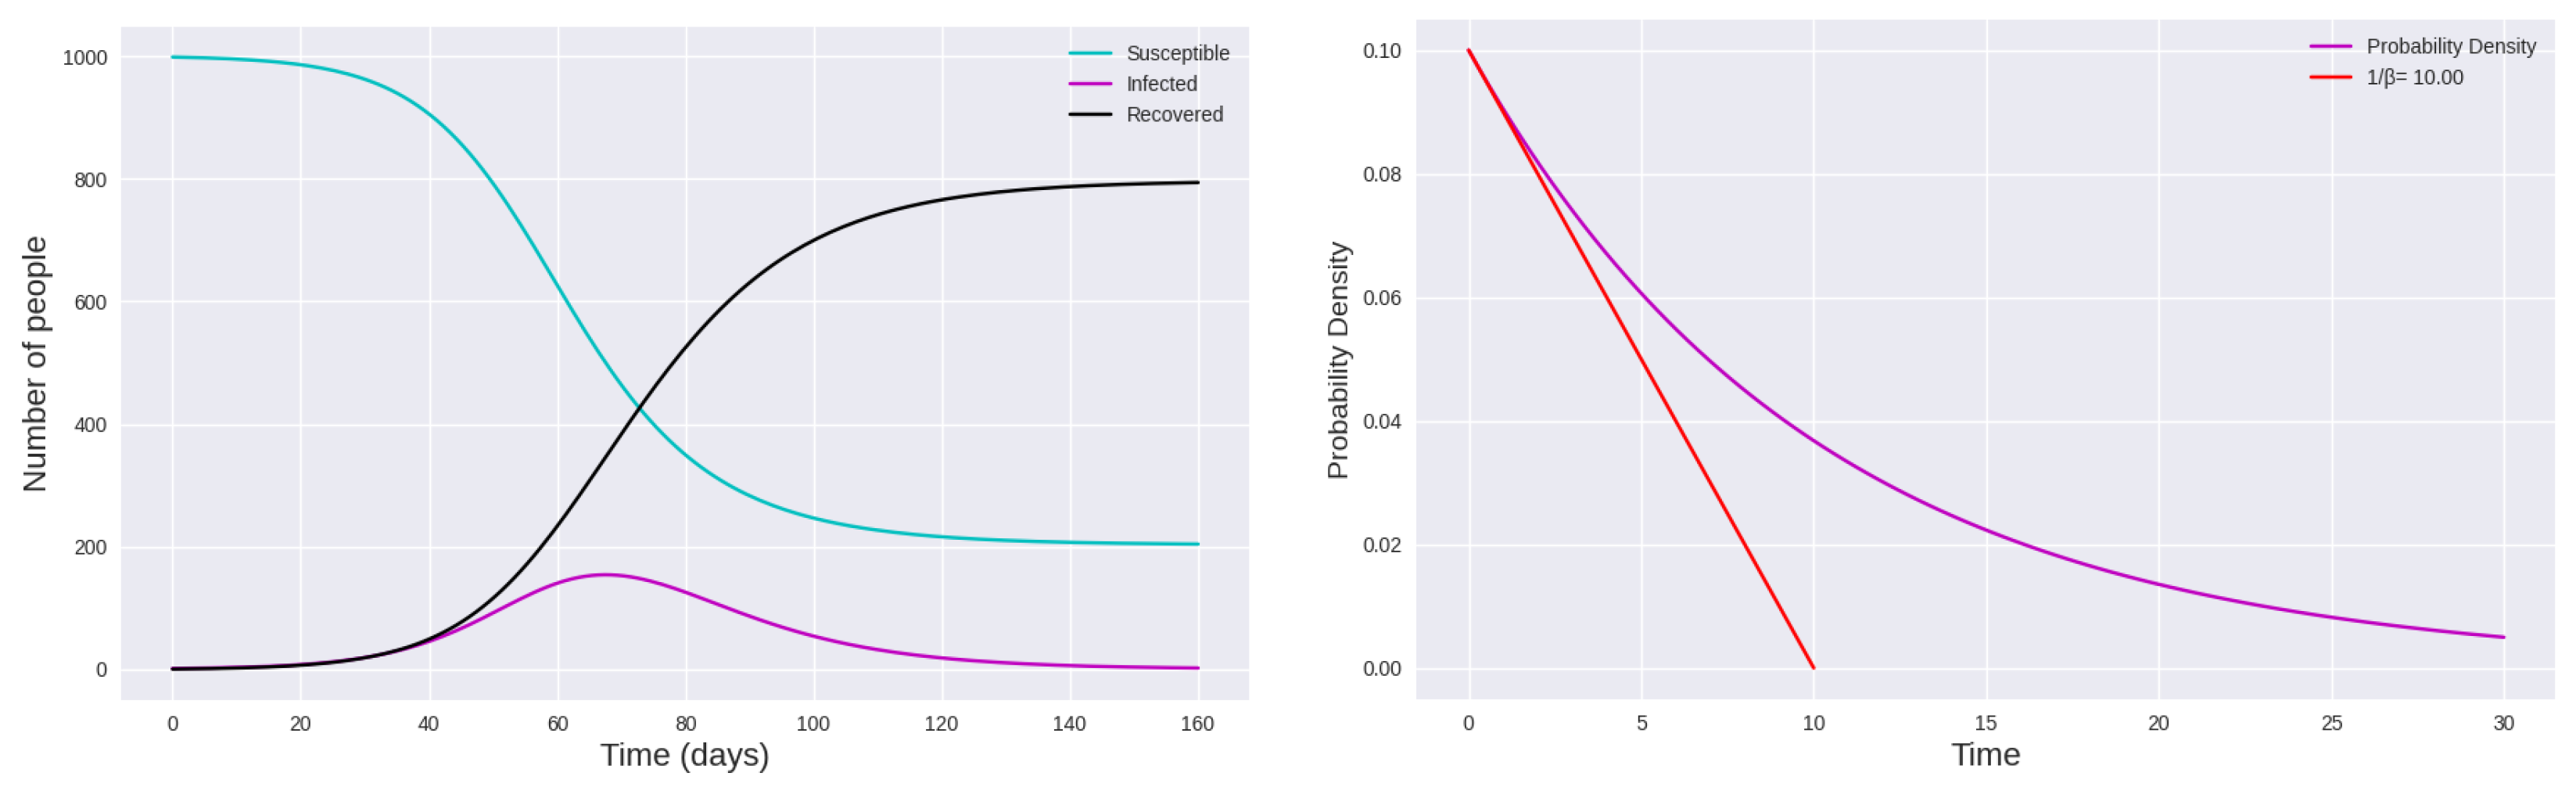
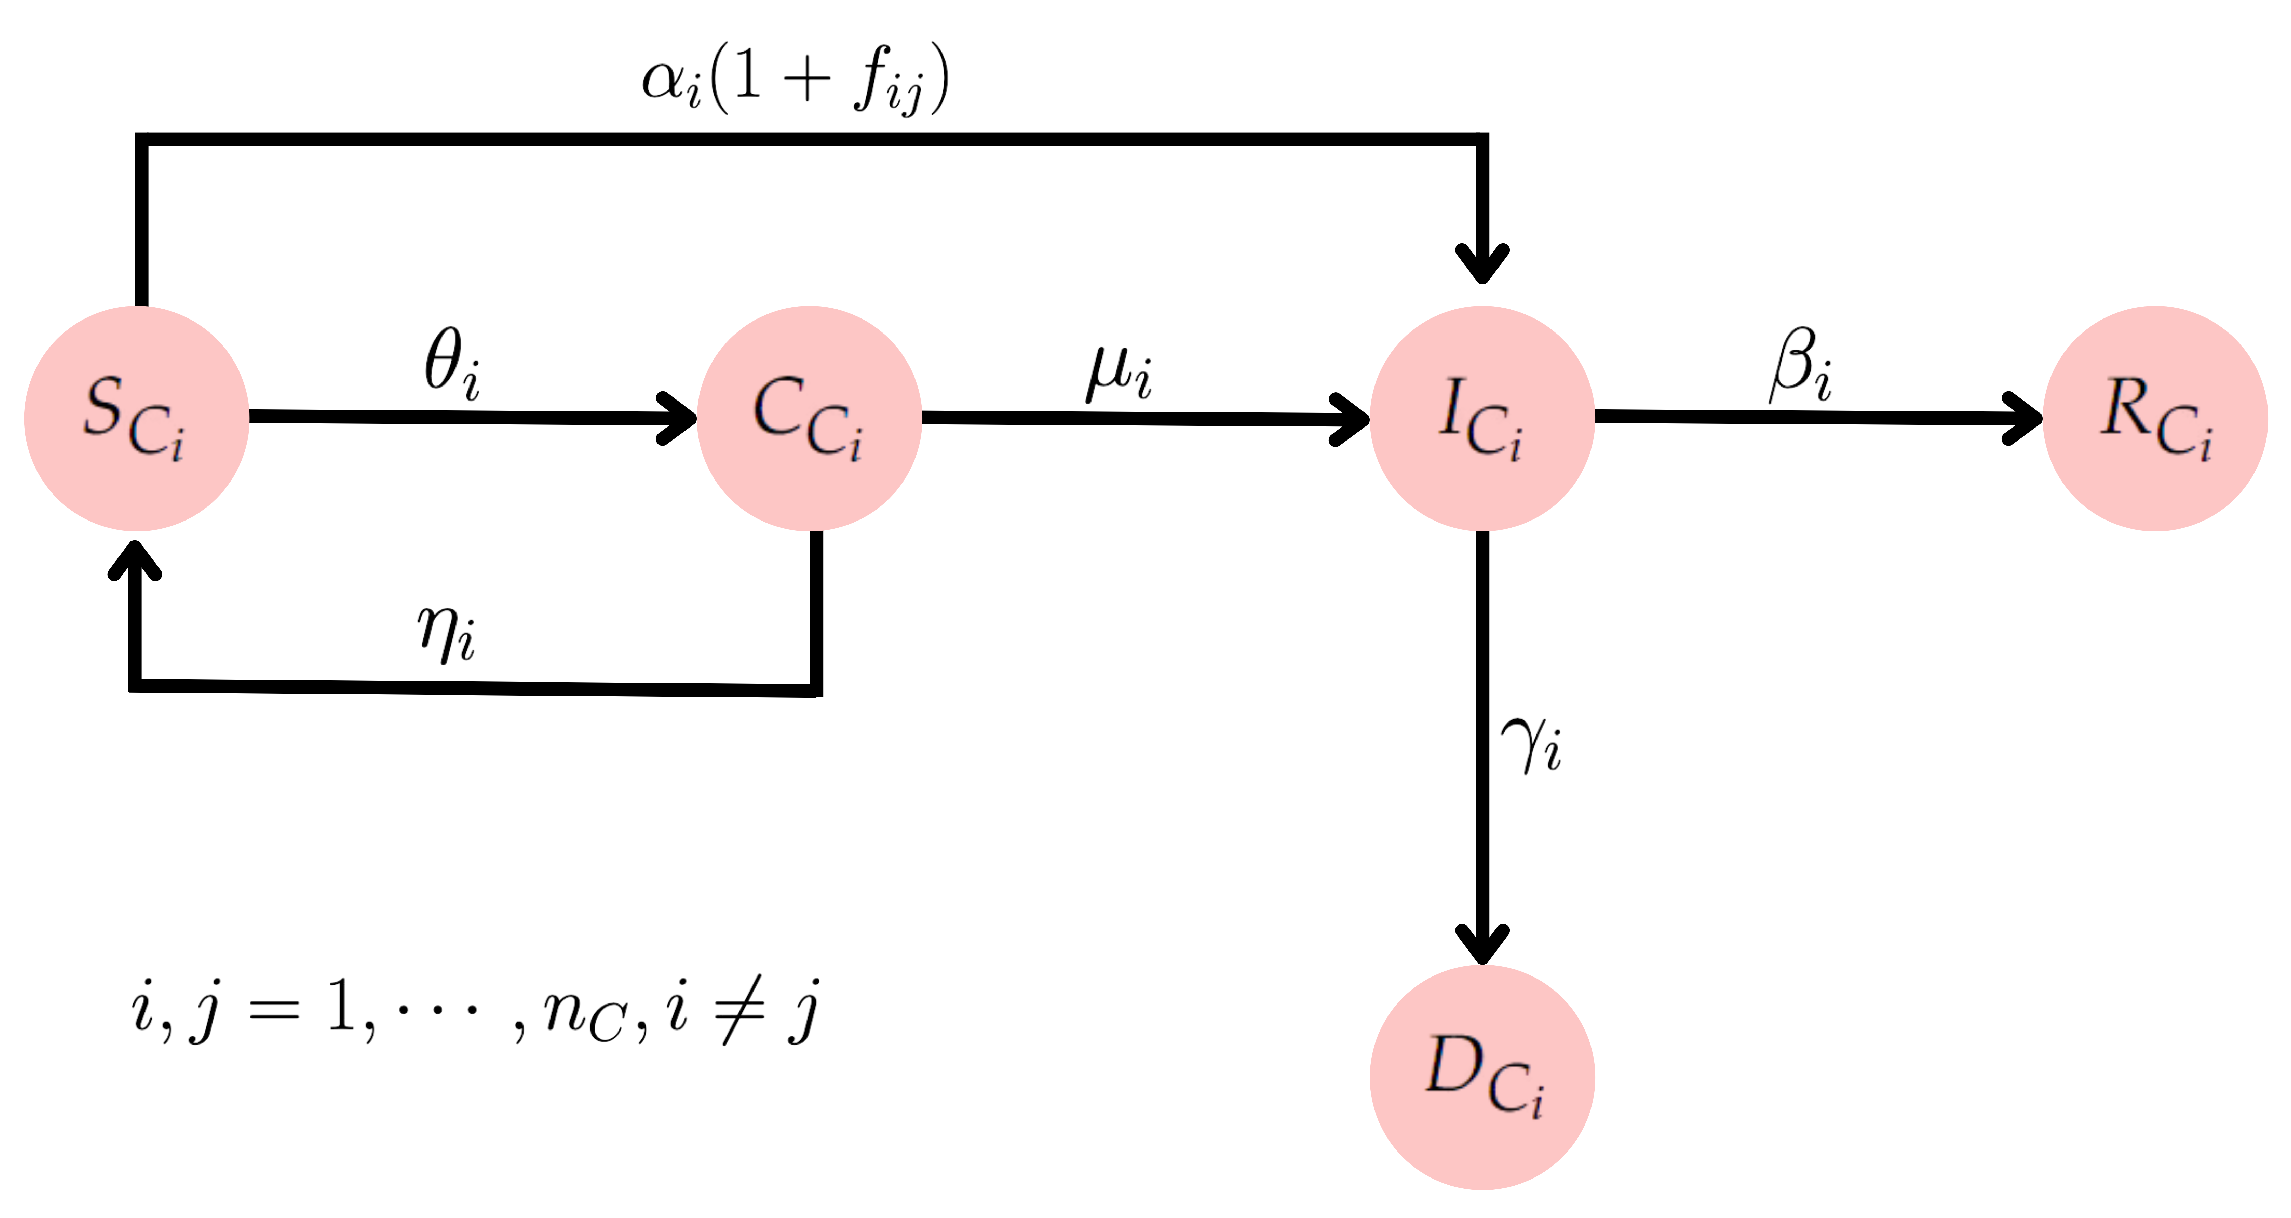
2.2. Integrating Mobility and Lockdown Strategies: A SCIRD-Driven Framework
- The increase in the compartment of infected is proportional to the number of infected and susceptible individuals.
- The rate at which the infected individuals move to the recovered compartment is proportional to the number of infected individuals.
- The incubation period is short, meaning a susceptible individual who contracts the disease starts transmitting it immediately.
- After recovering from COVID-19, individuals develop temporary immunity, i.e., they do not become reinfected within a period of less than 4 months [68].
2.3. Effective Reproduction Number
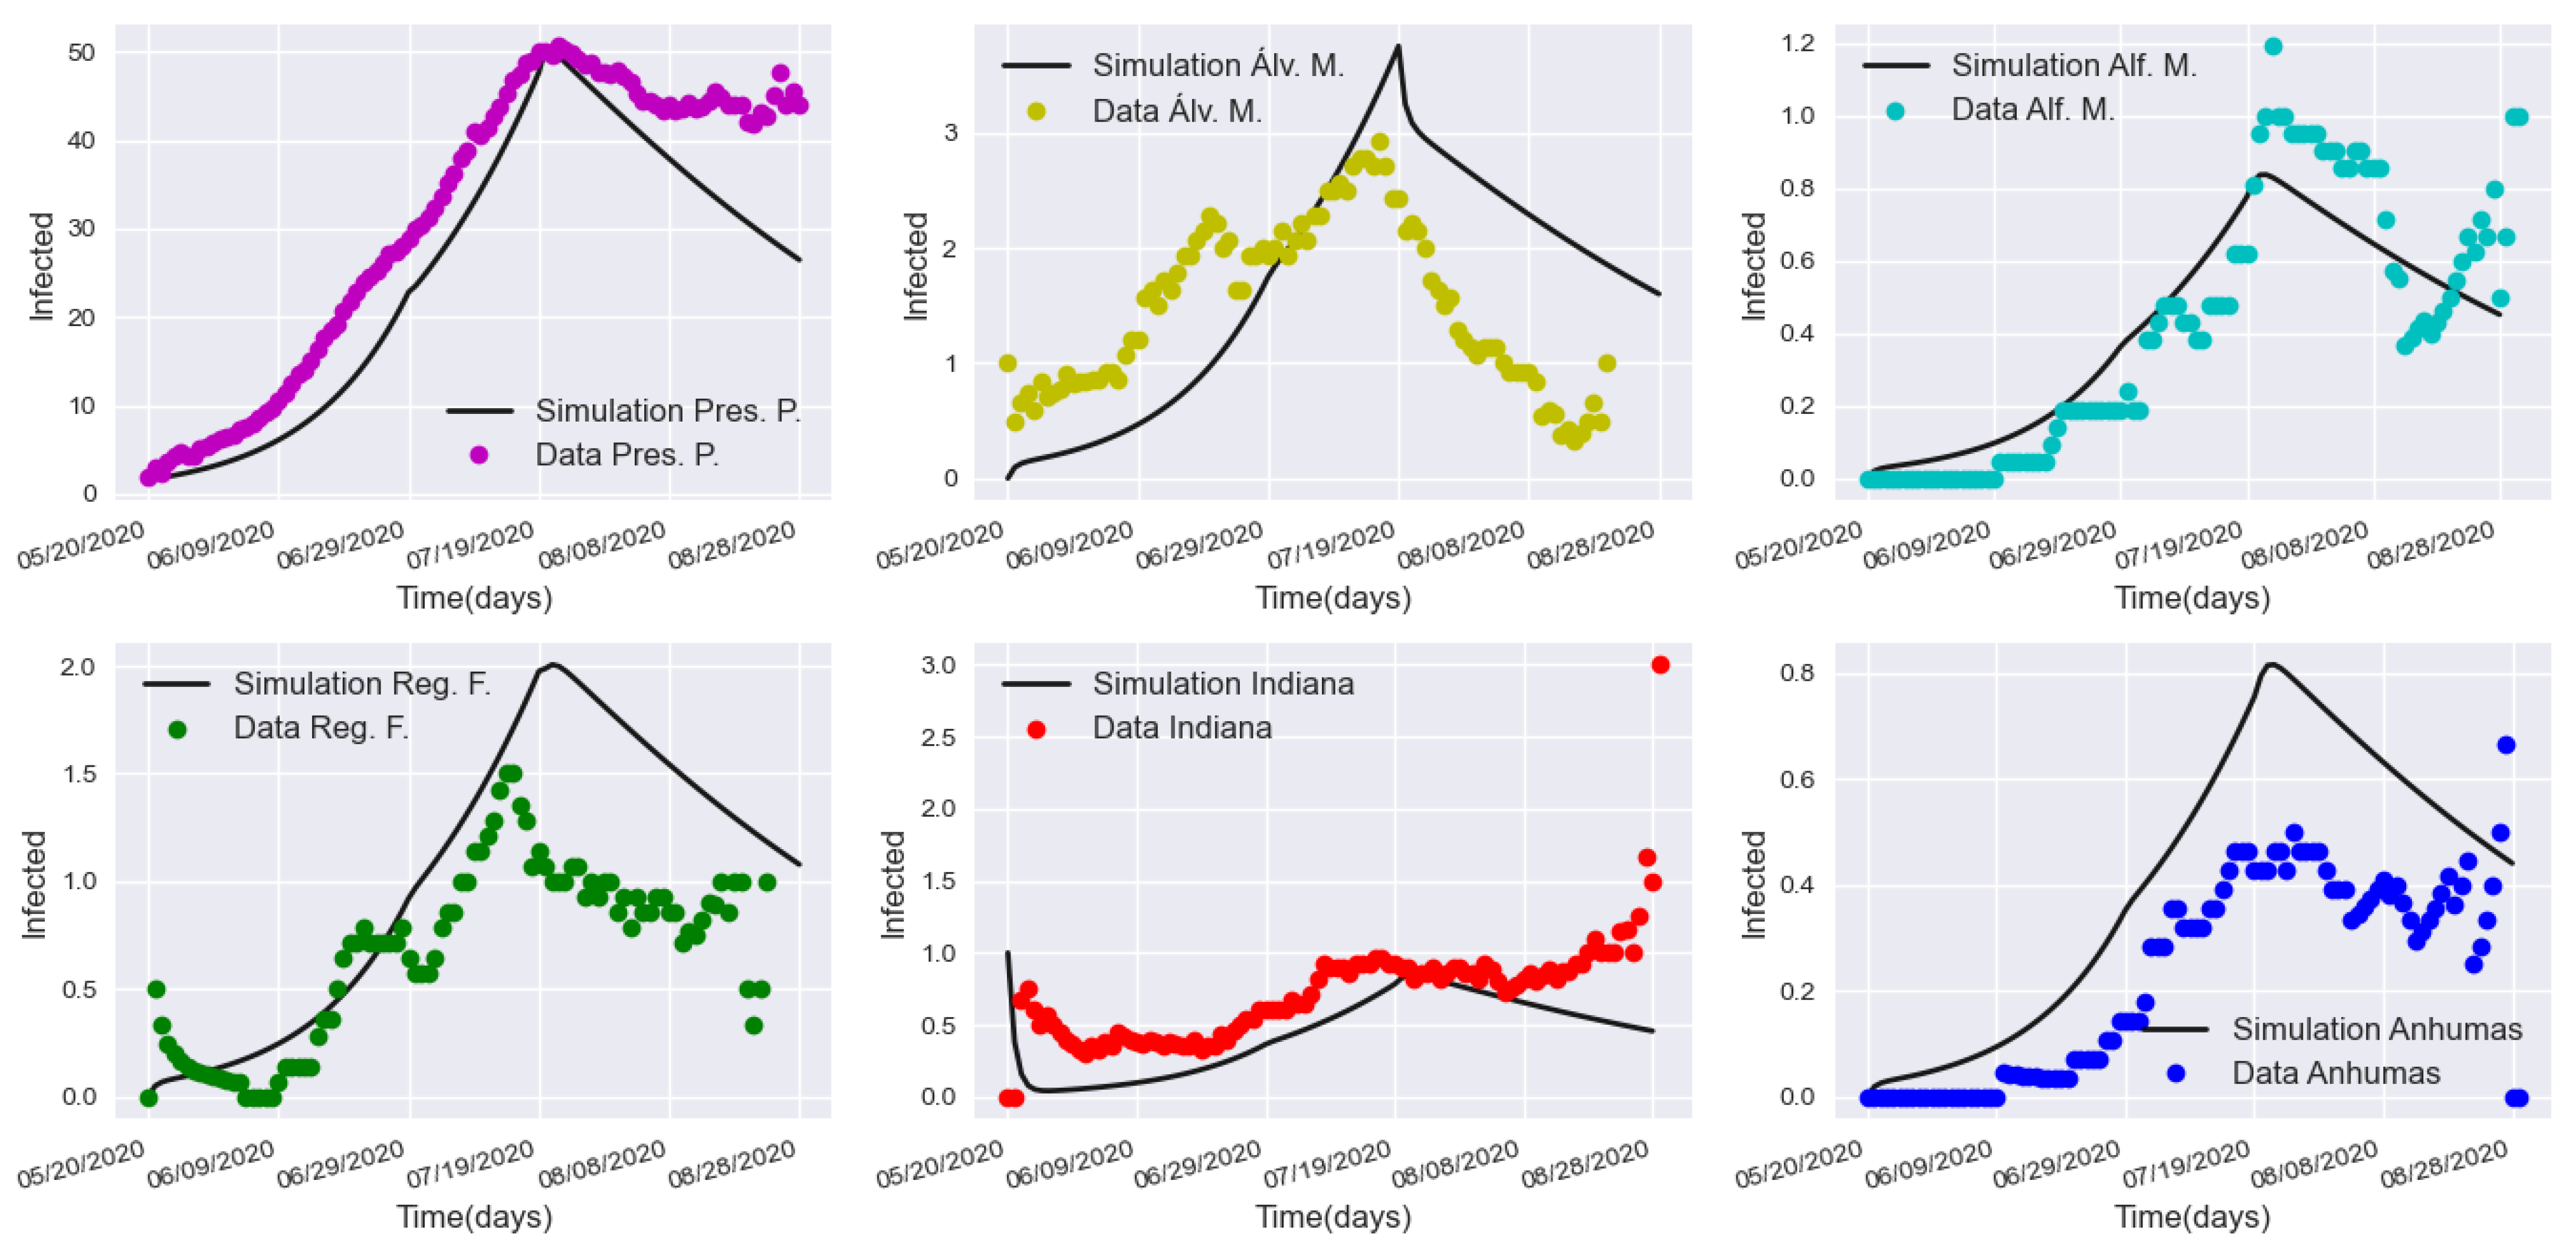
2.4. Data Sources and Parameter Calibration
- São Paulo State Data Analysis Website (SEADE government foundation) [74]: Time-series of confirmed cases and deaths for all cities in the study area (Figure 1) were acquired from the official data repository of São Paulo State government. For a technical note regarding data collection, aggregation, and processing, refer to [75], which includes the public GitHub repository maintained by the government agency.
- SP COVID-19 Info Tracker Platform [30]: Active cases and recoveries were downloaded from the Info Tracker platform, an open data-driven tool available for public authorities, society, and press agencies. More precisely, the number of recovered individuals at time t is estimated by assuming an average recovery time of days [76], i.e., subtracting the total number of deaths from the number of cases days ago, while the number of active cases (infected) at time t is obtained by subtracting the total number of deaths and recoveries from the total number of cases at time t [77].
- Brazilian Institute of Geography and Statistics (IBGE) [64]: Mobility rates related to the work and study activities for each satellite city and the target urban center. To explicitly determine the population mobility between cities, the urban displacement as originally measured and provided by the Brazilian Institute of Geography and Statistics (IBGE) [64,78] is employed. More specifically, the flow rate of people traveling daily from city i to j is computed as follows:where represents the number of people moving from cities i to j, and accounts for the total population of the origin municipality i [64].
2.5. Numerical Solution and Computational Aspects
2.6. Evaluation Metrics
3. Results and Validation
3.1. Sensitivity Analysis
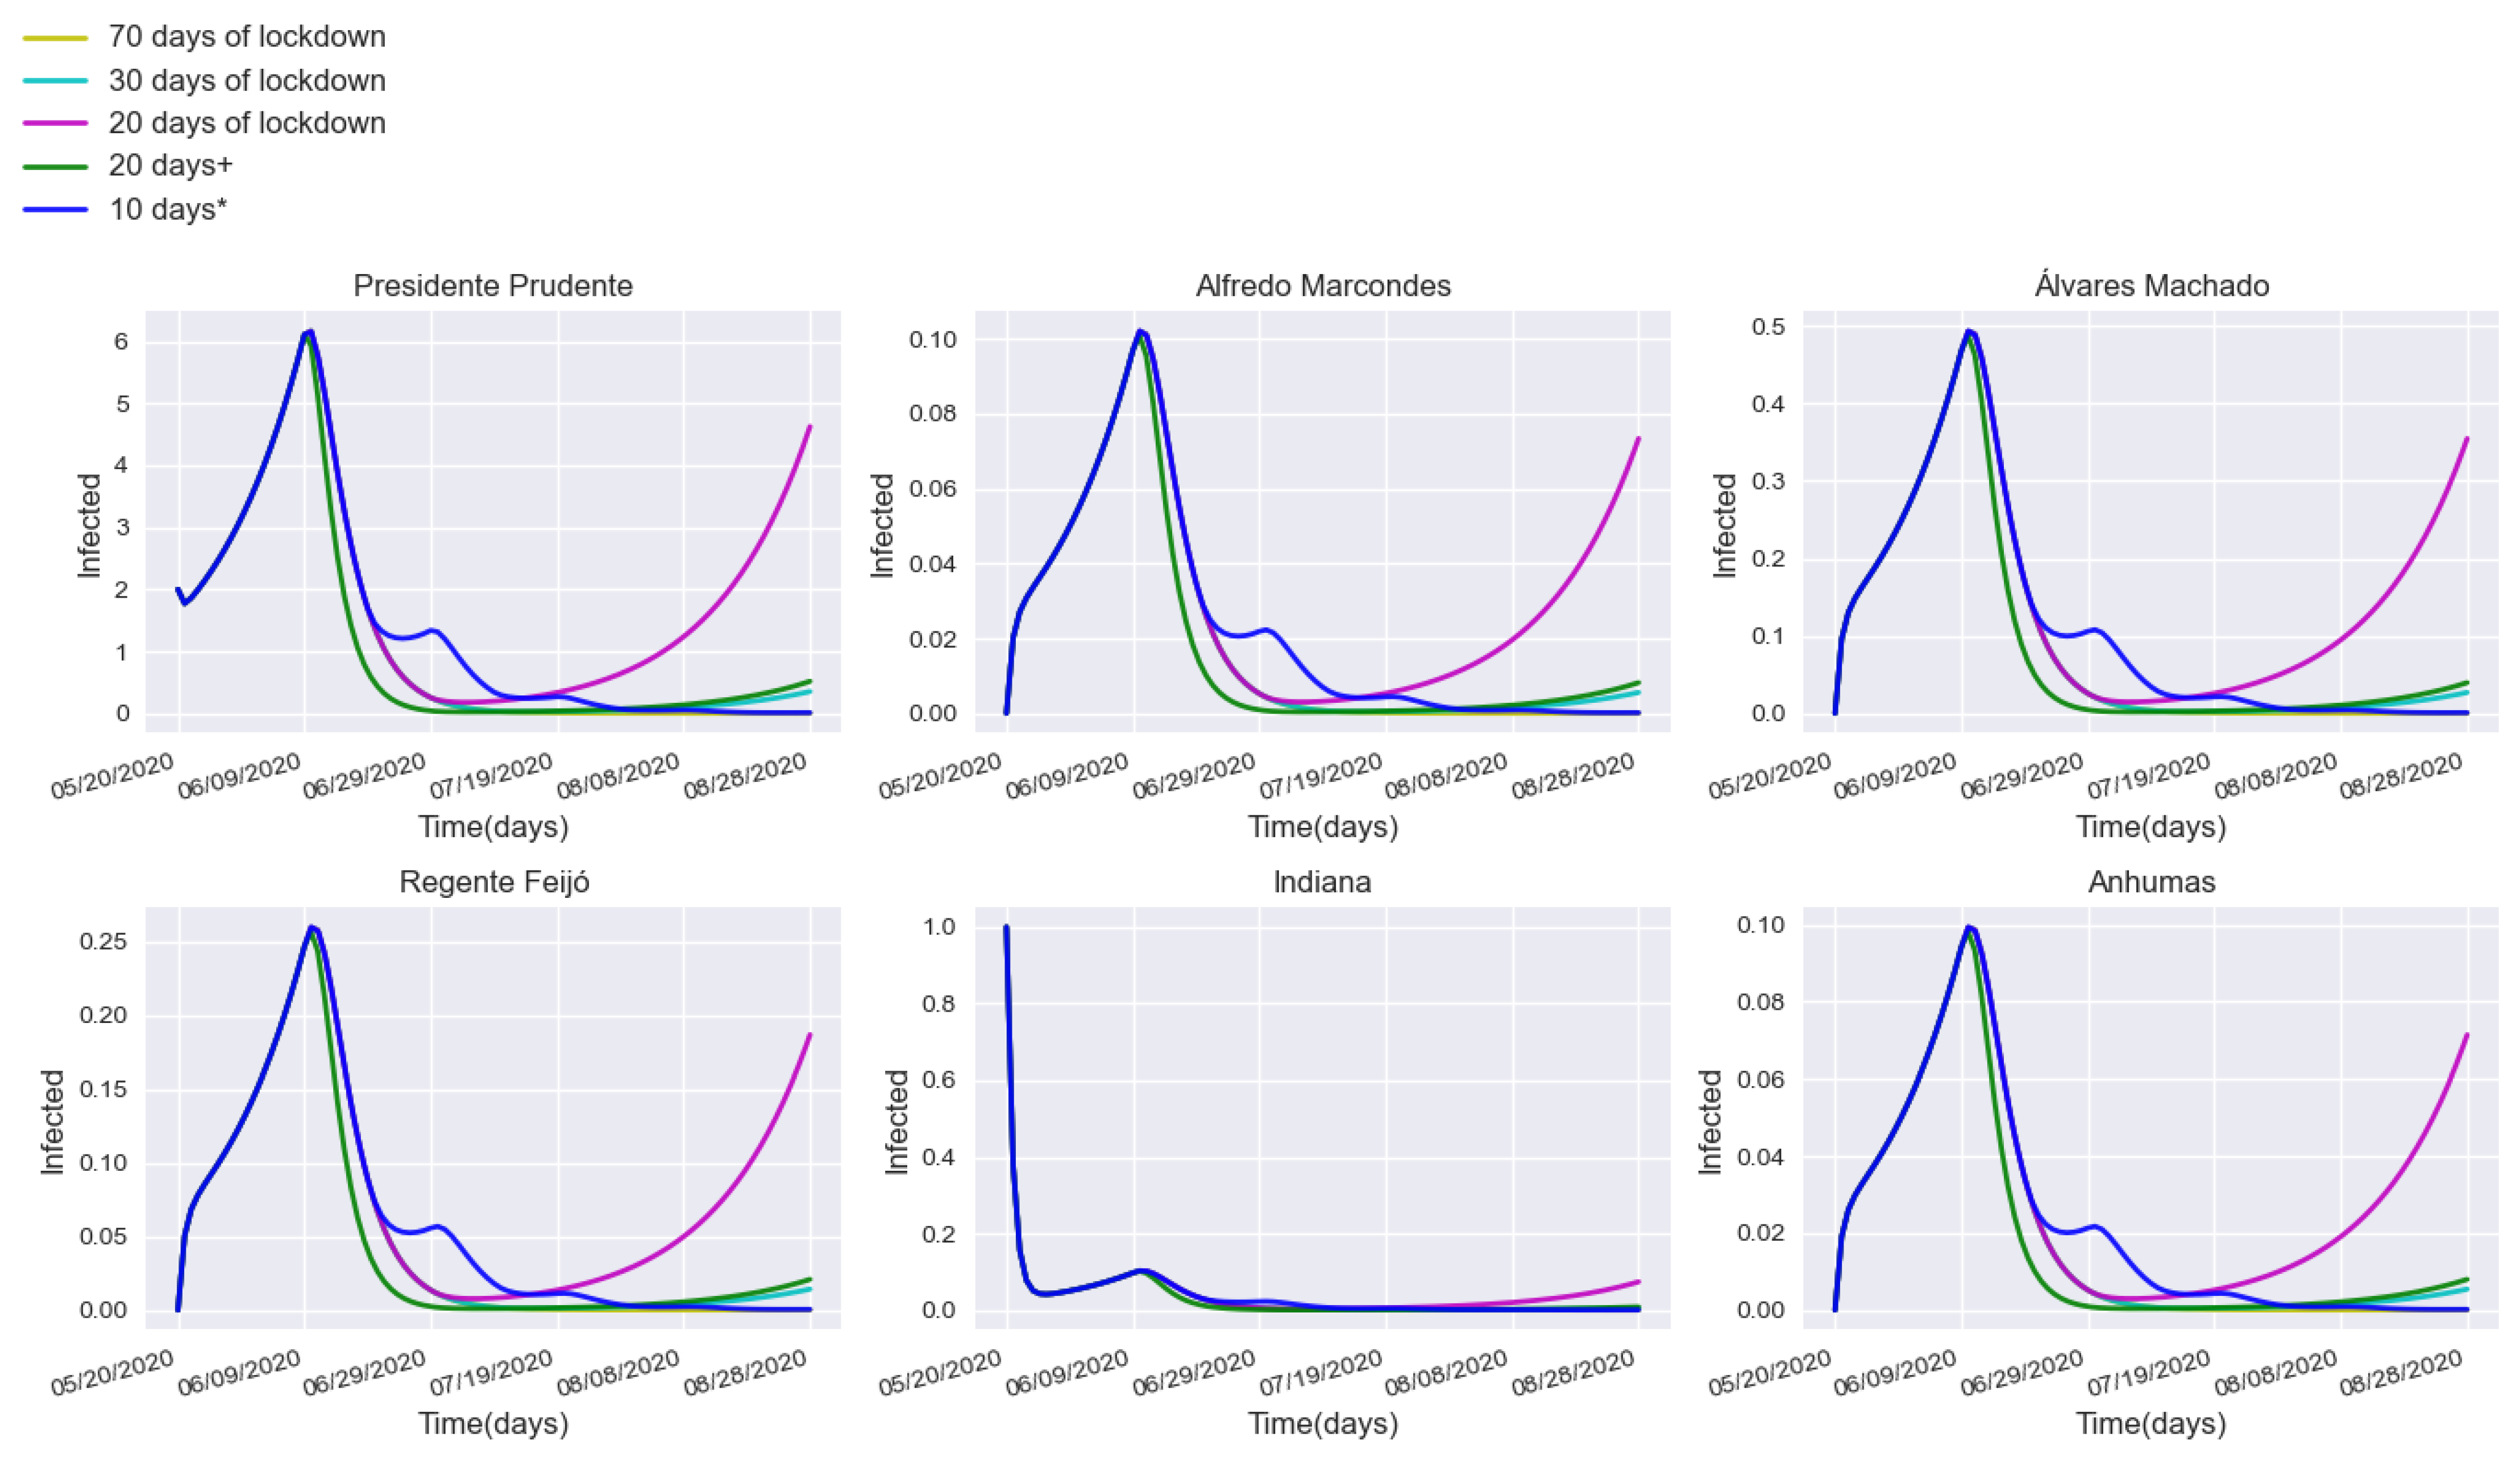
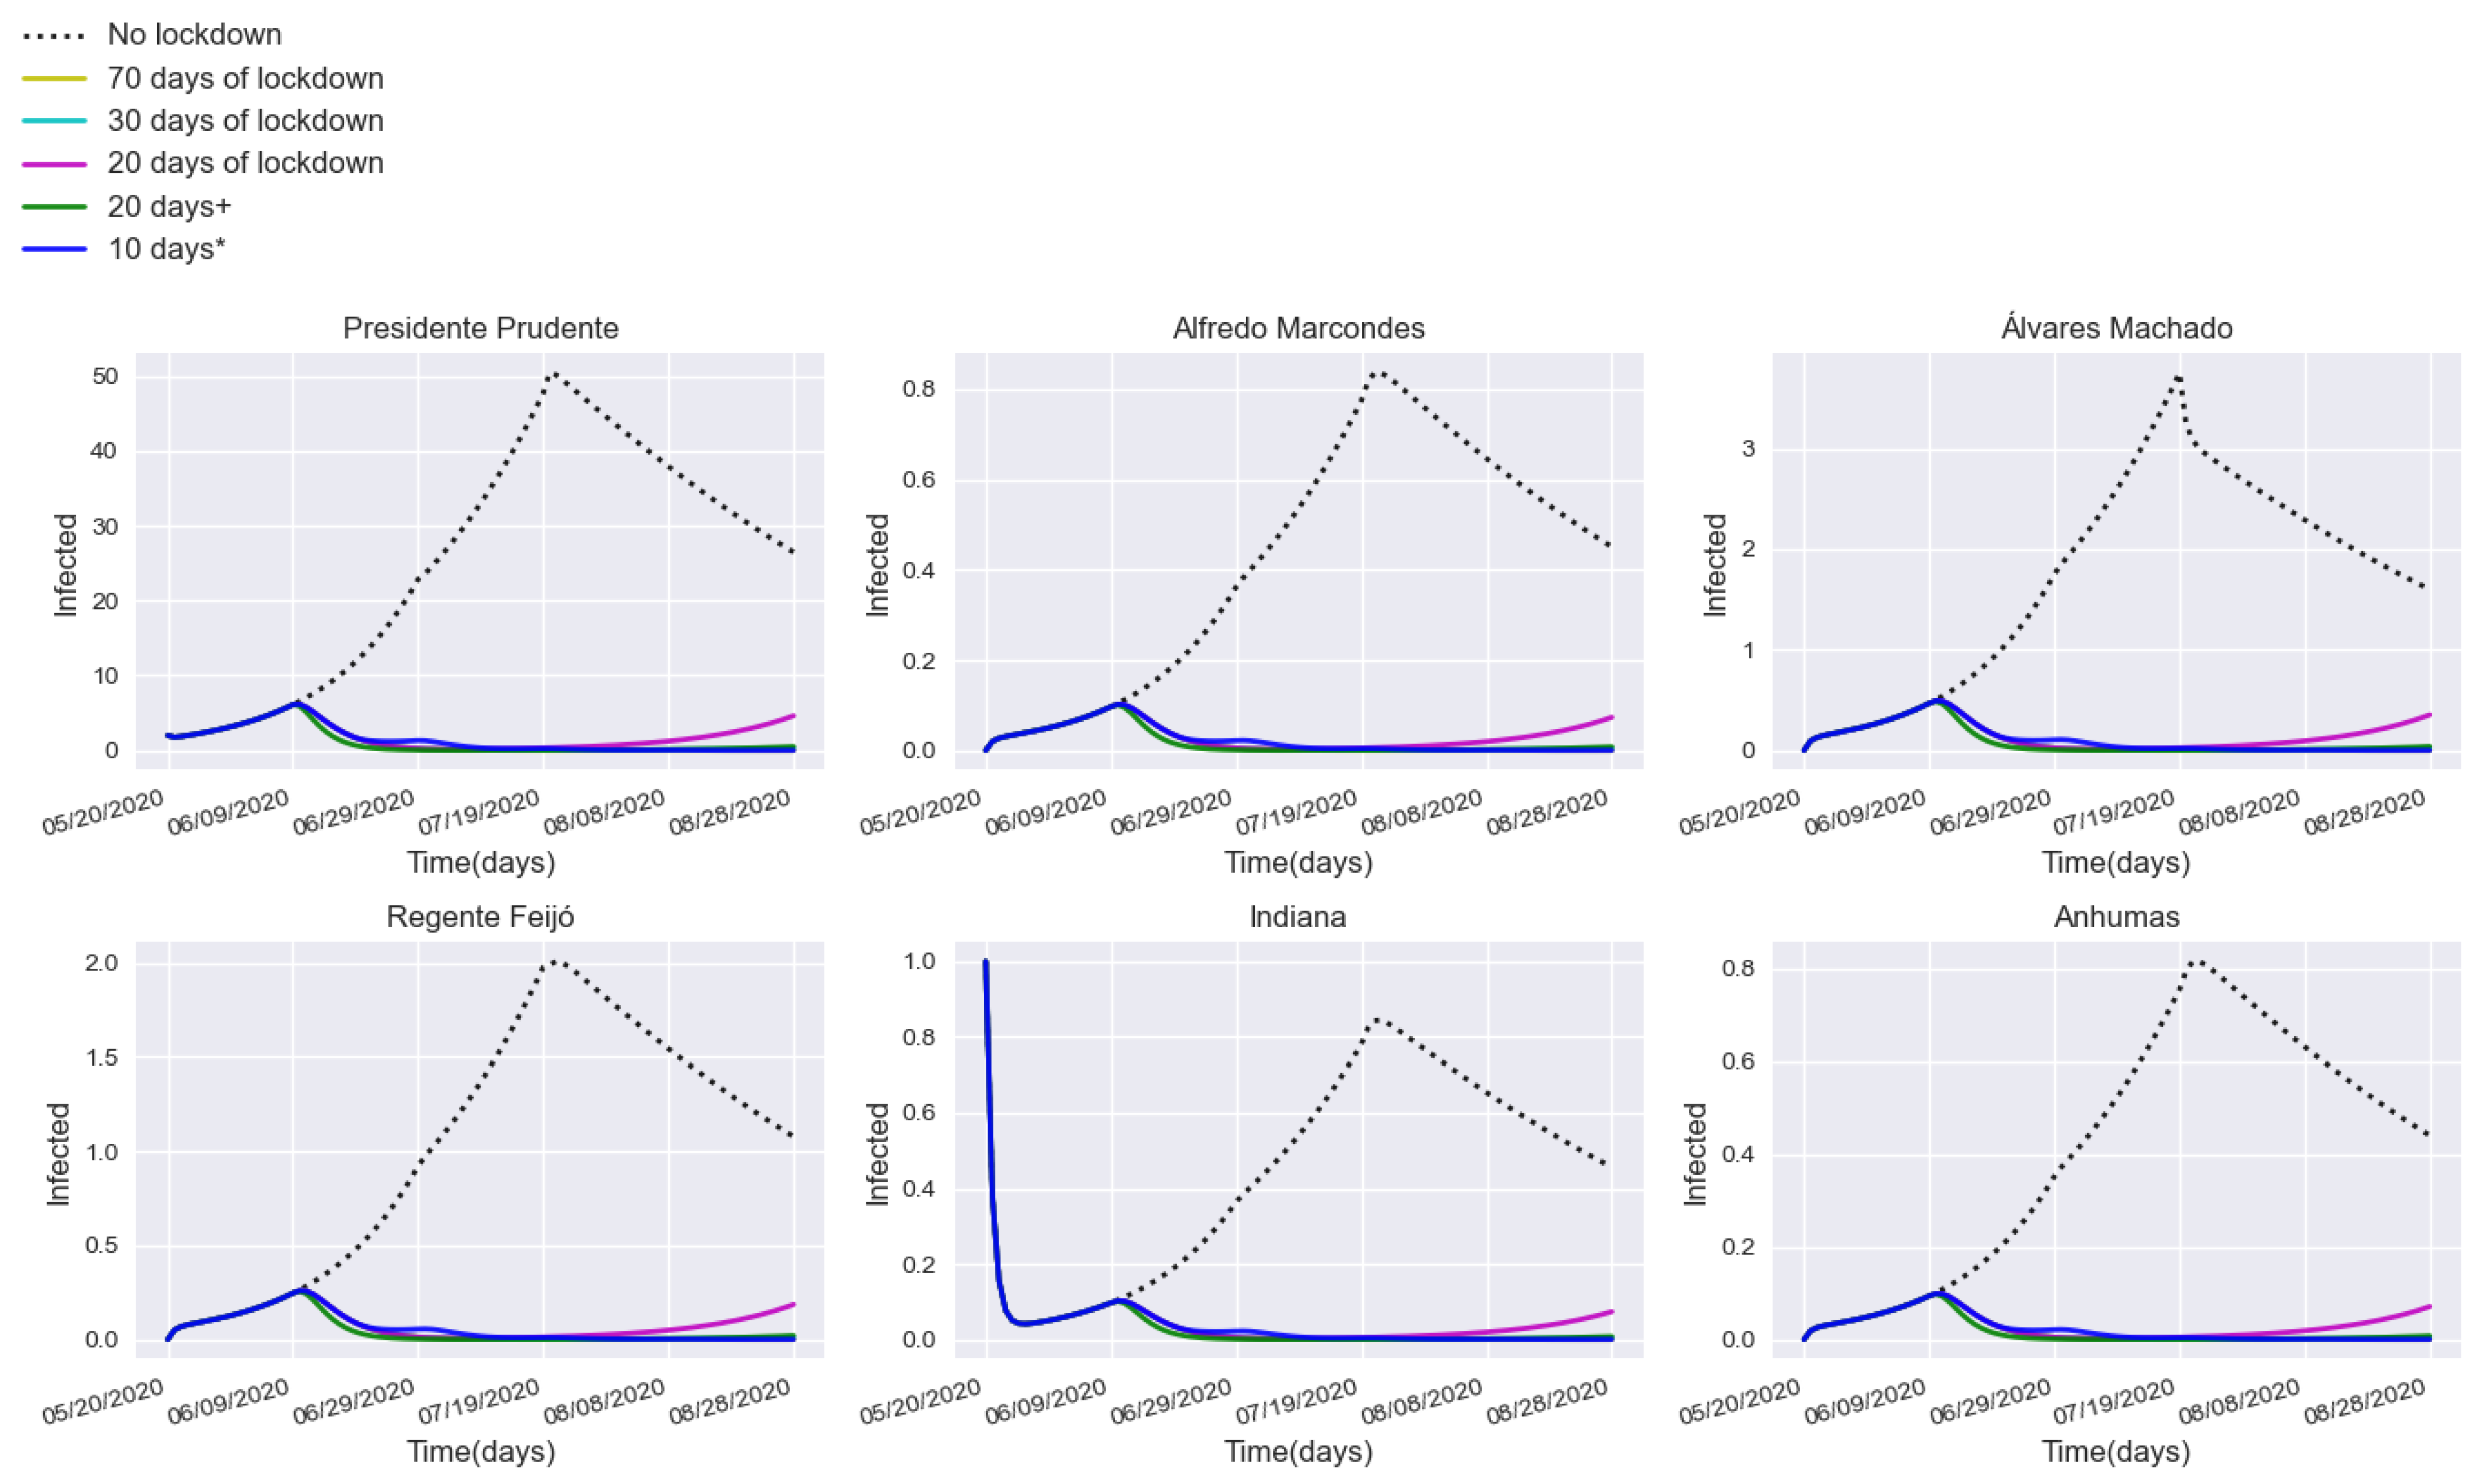
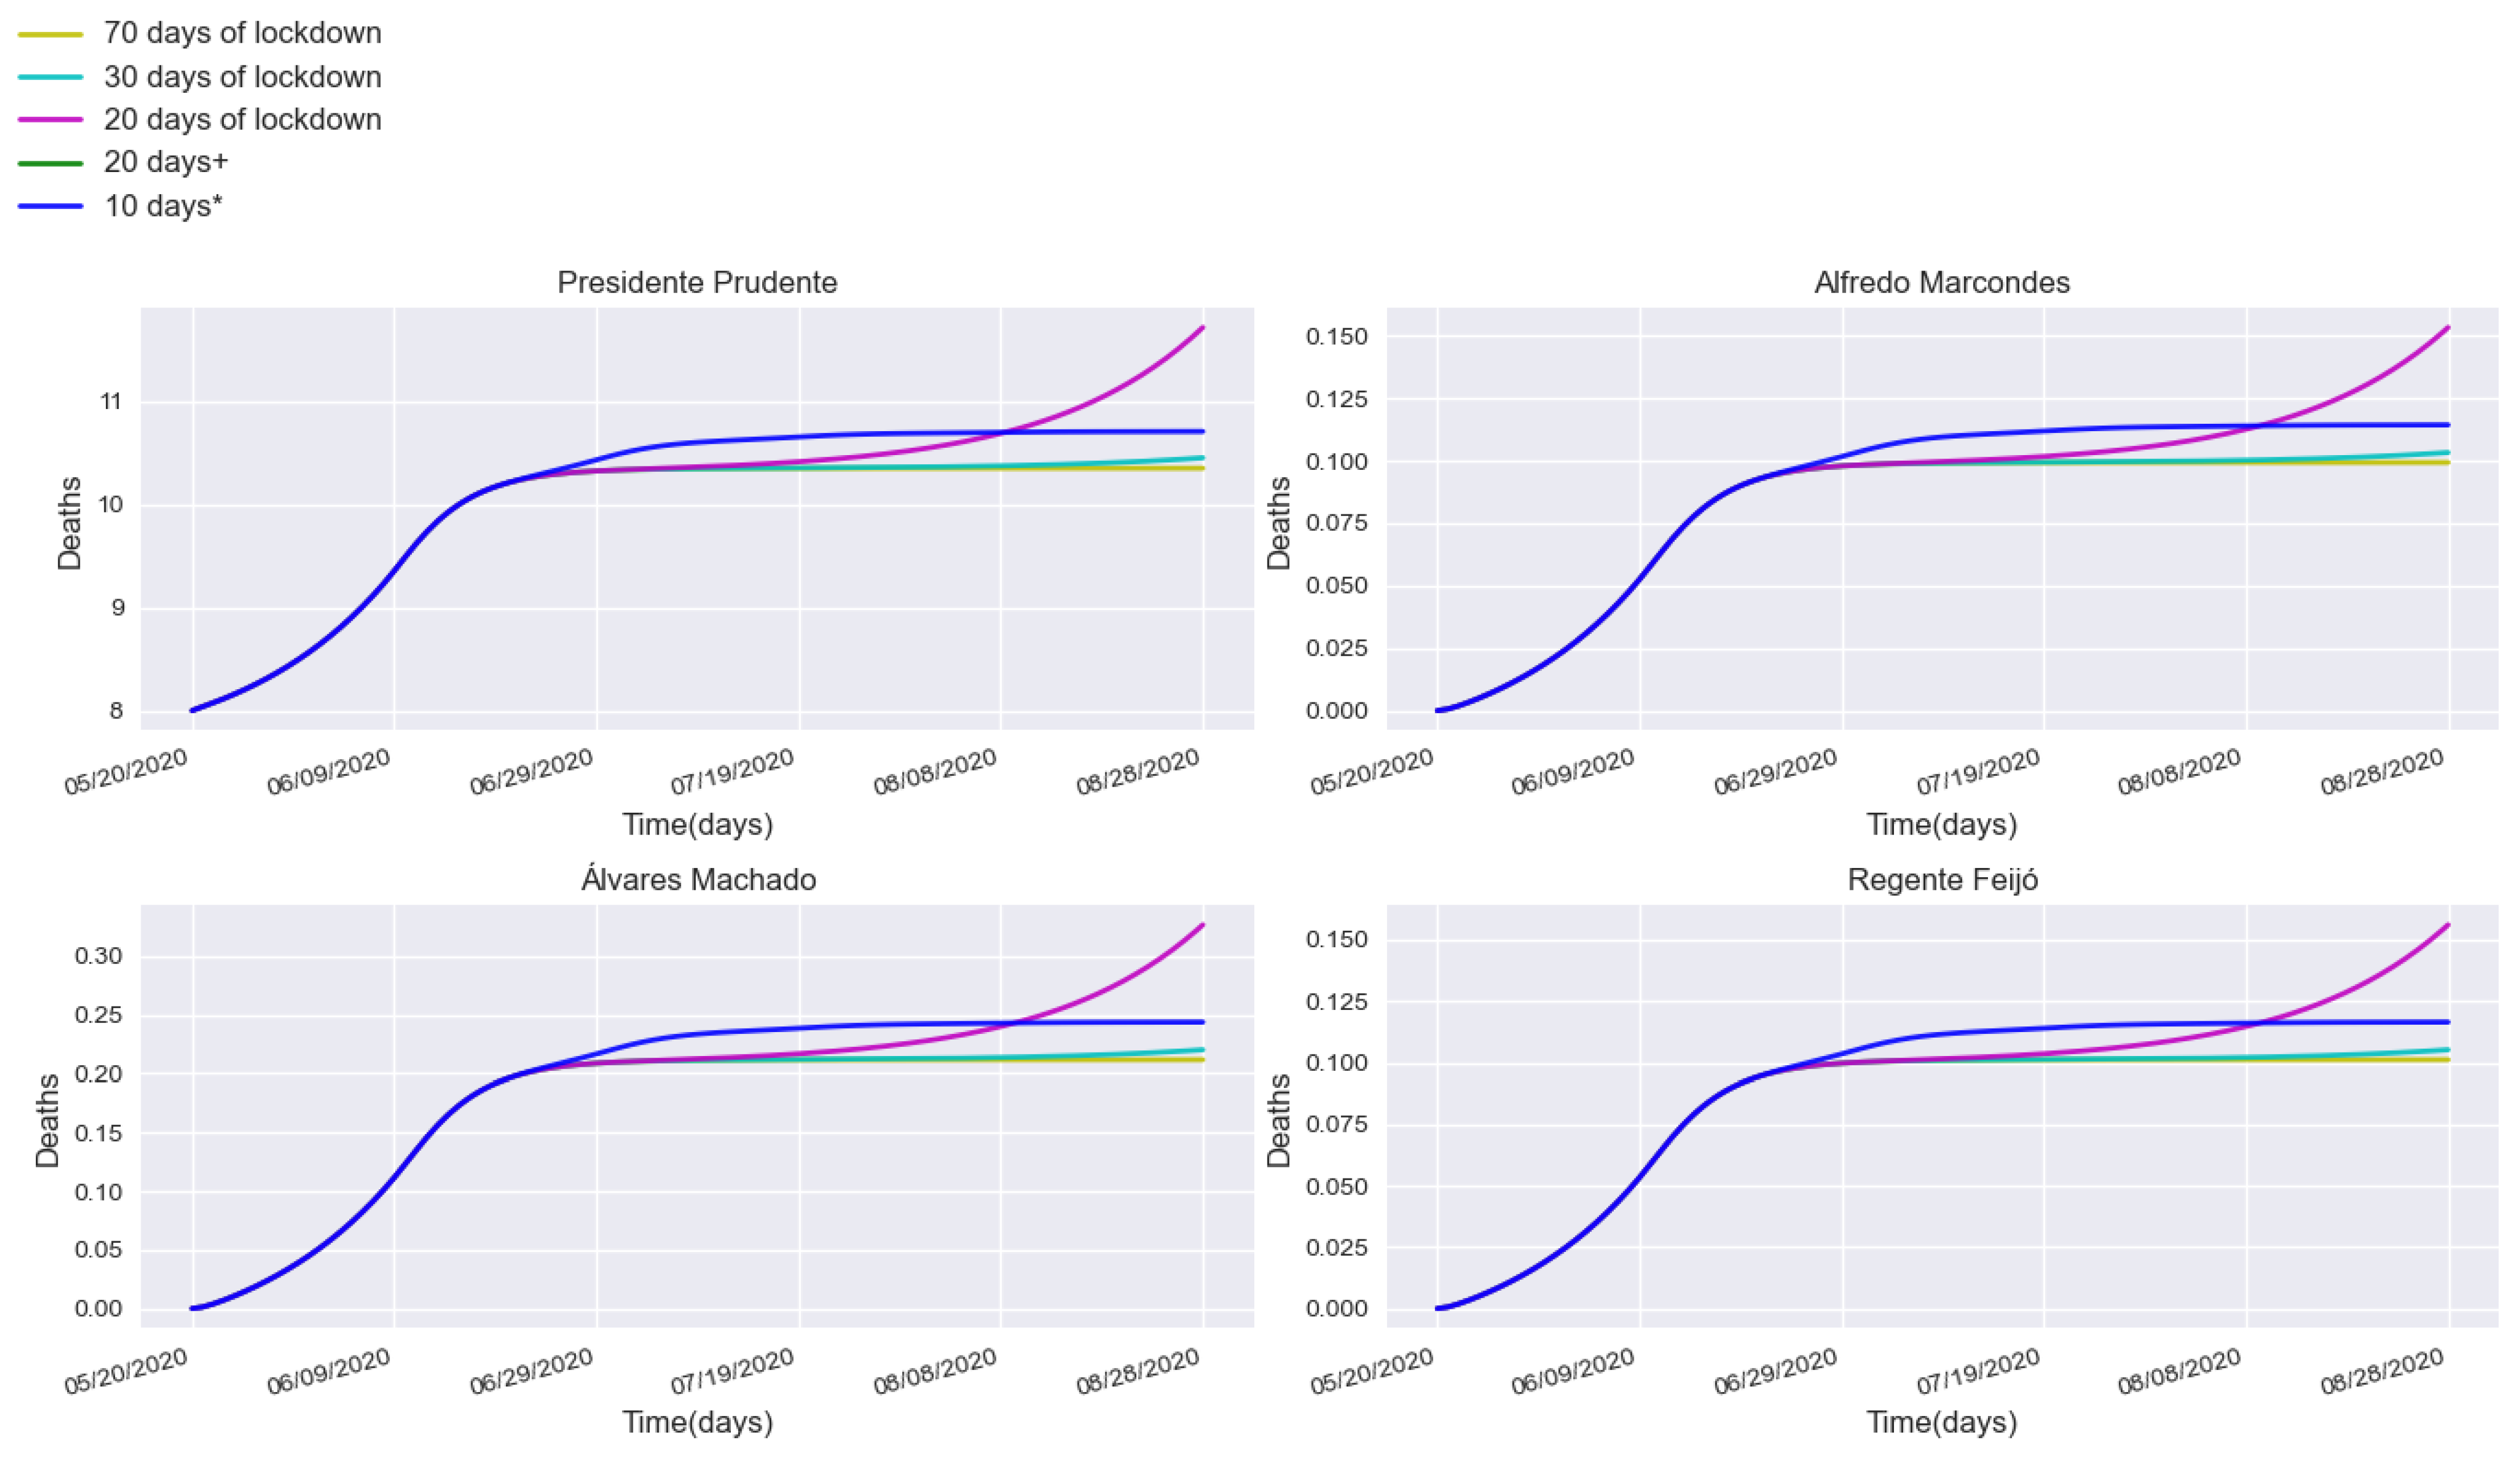
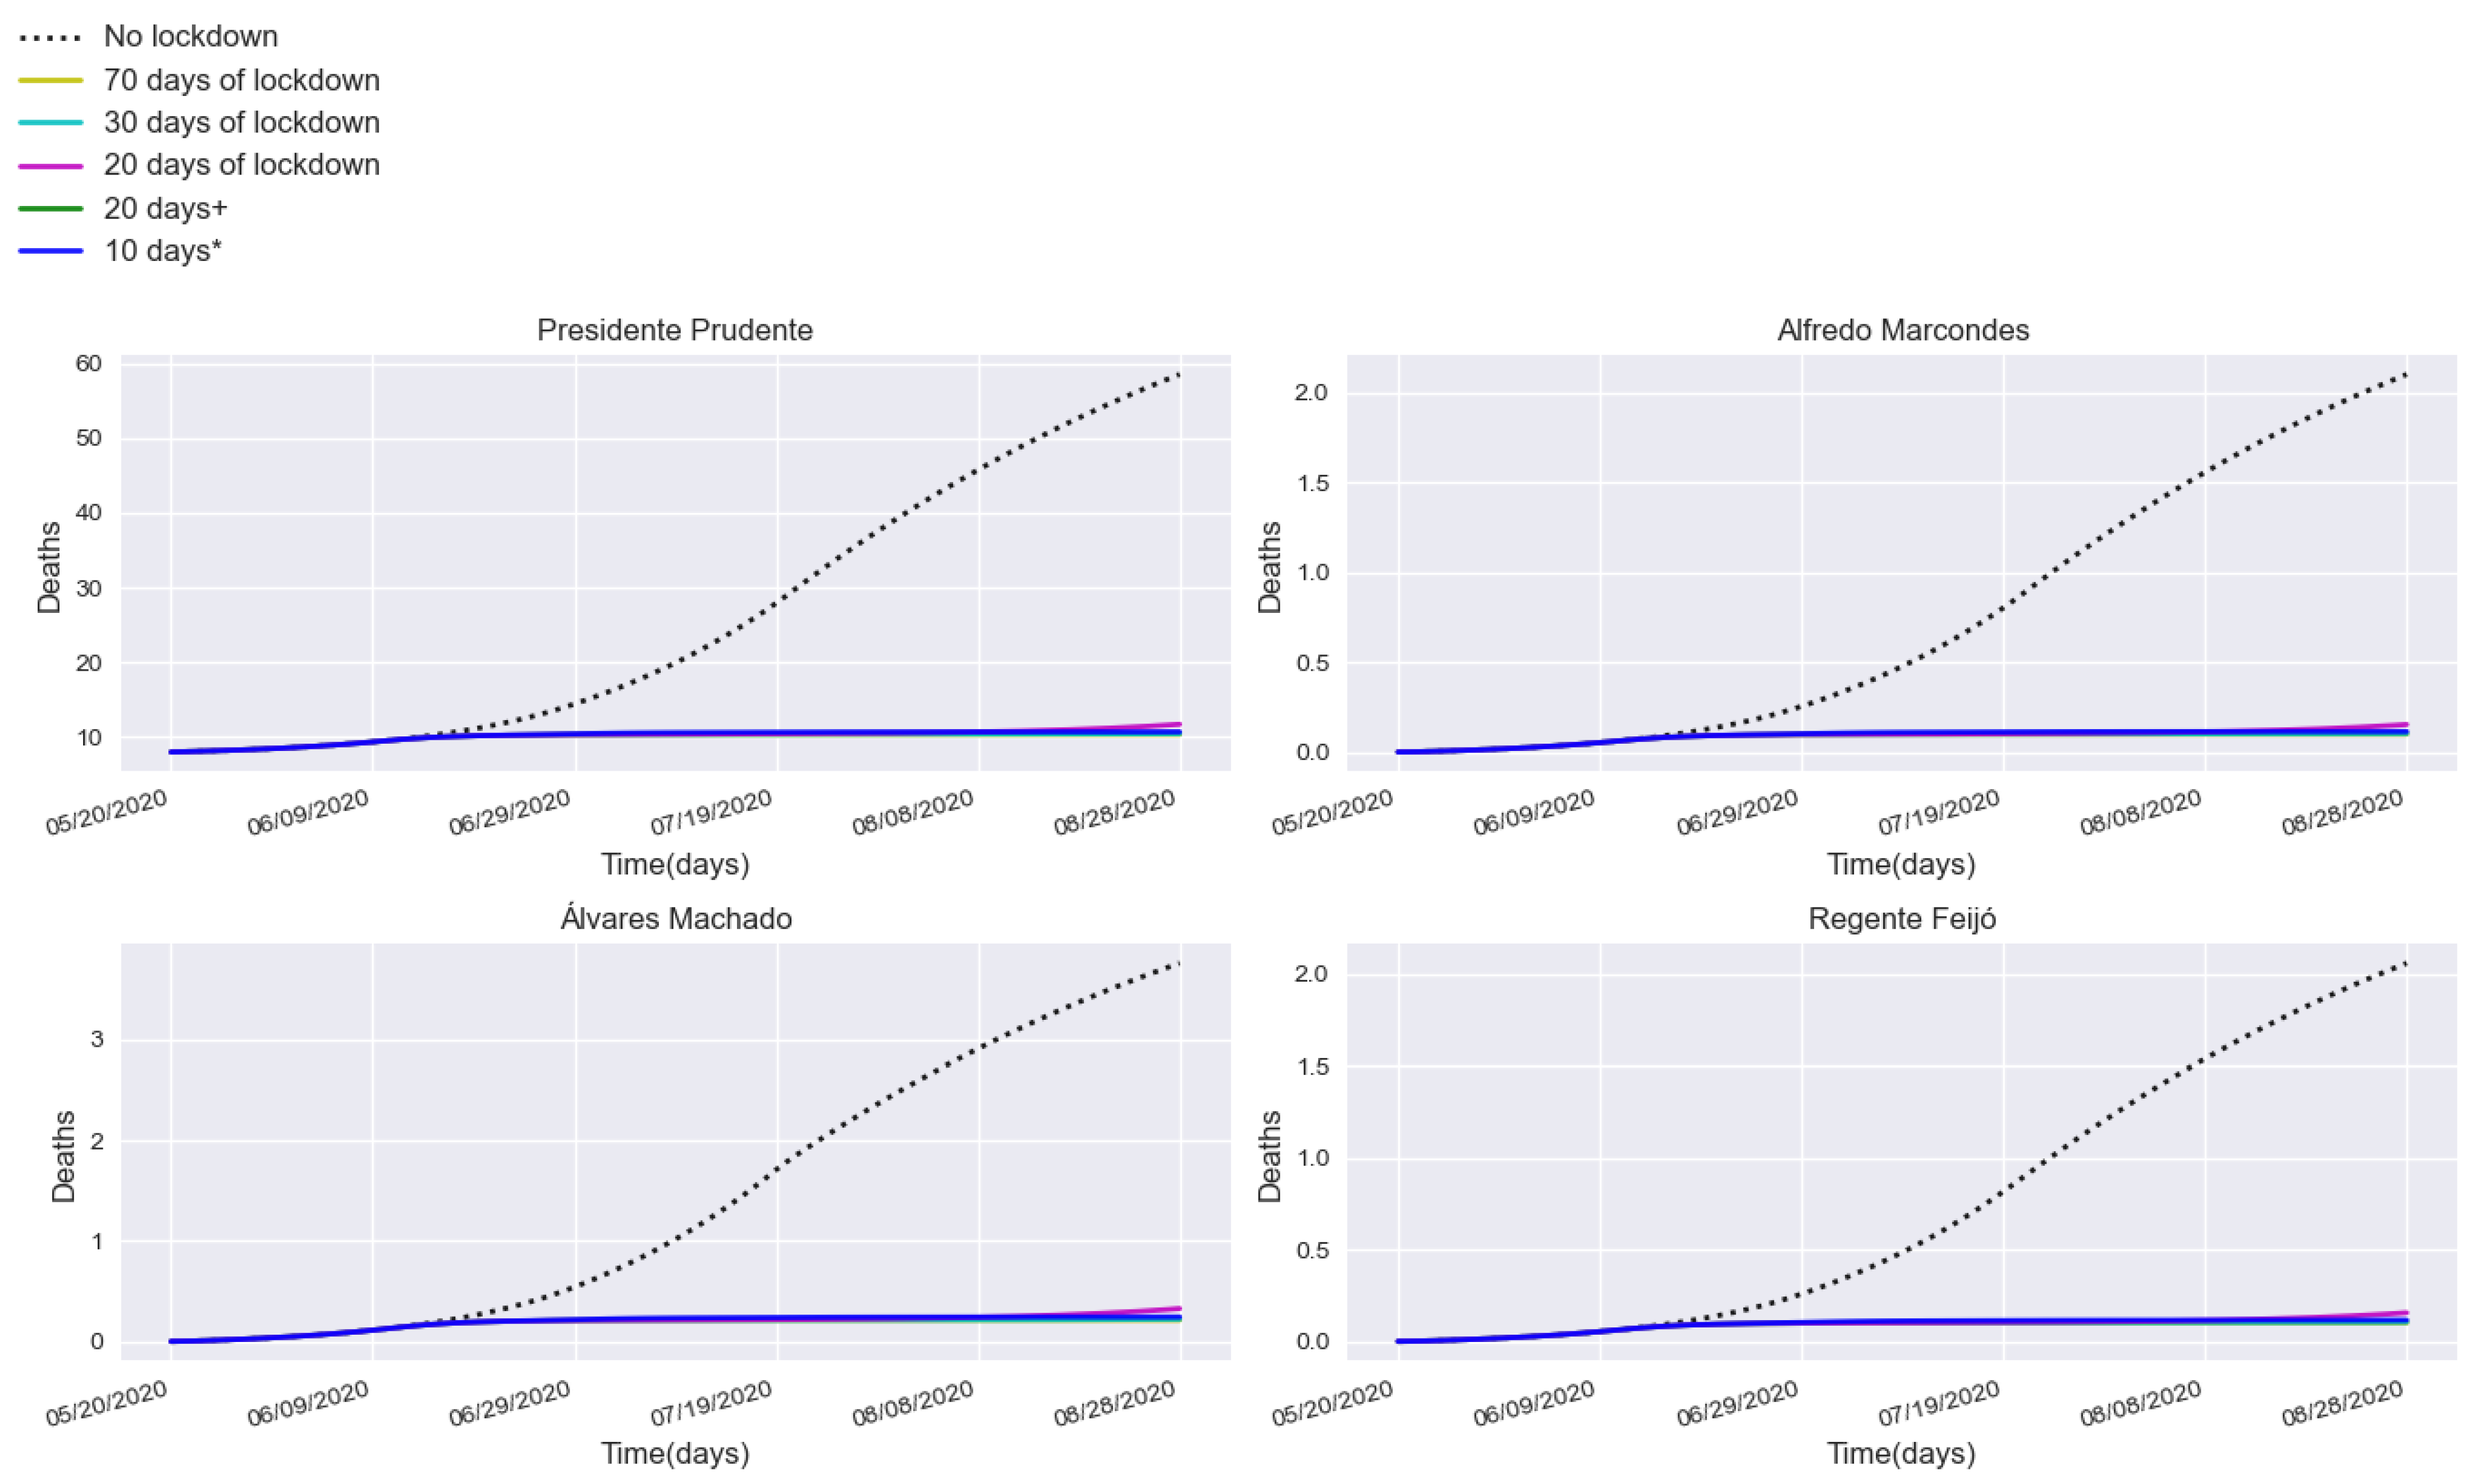
3.2. Assessing Quarantine Scenarios in Medium-Sized Urban Centers
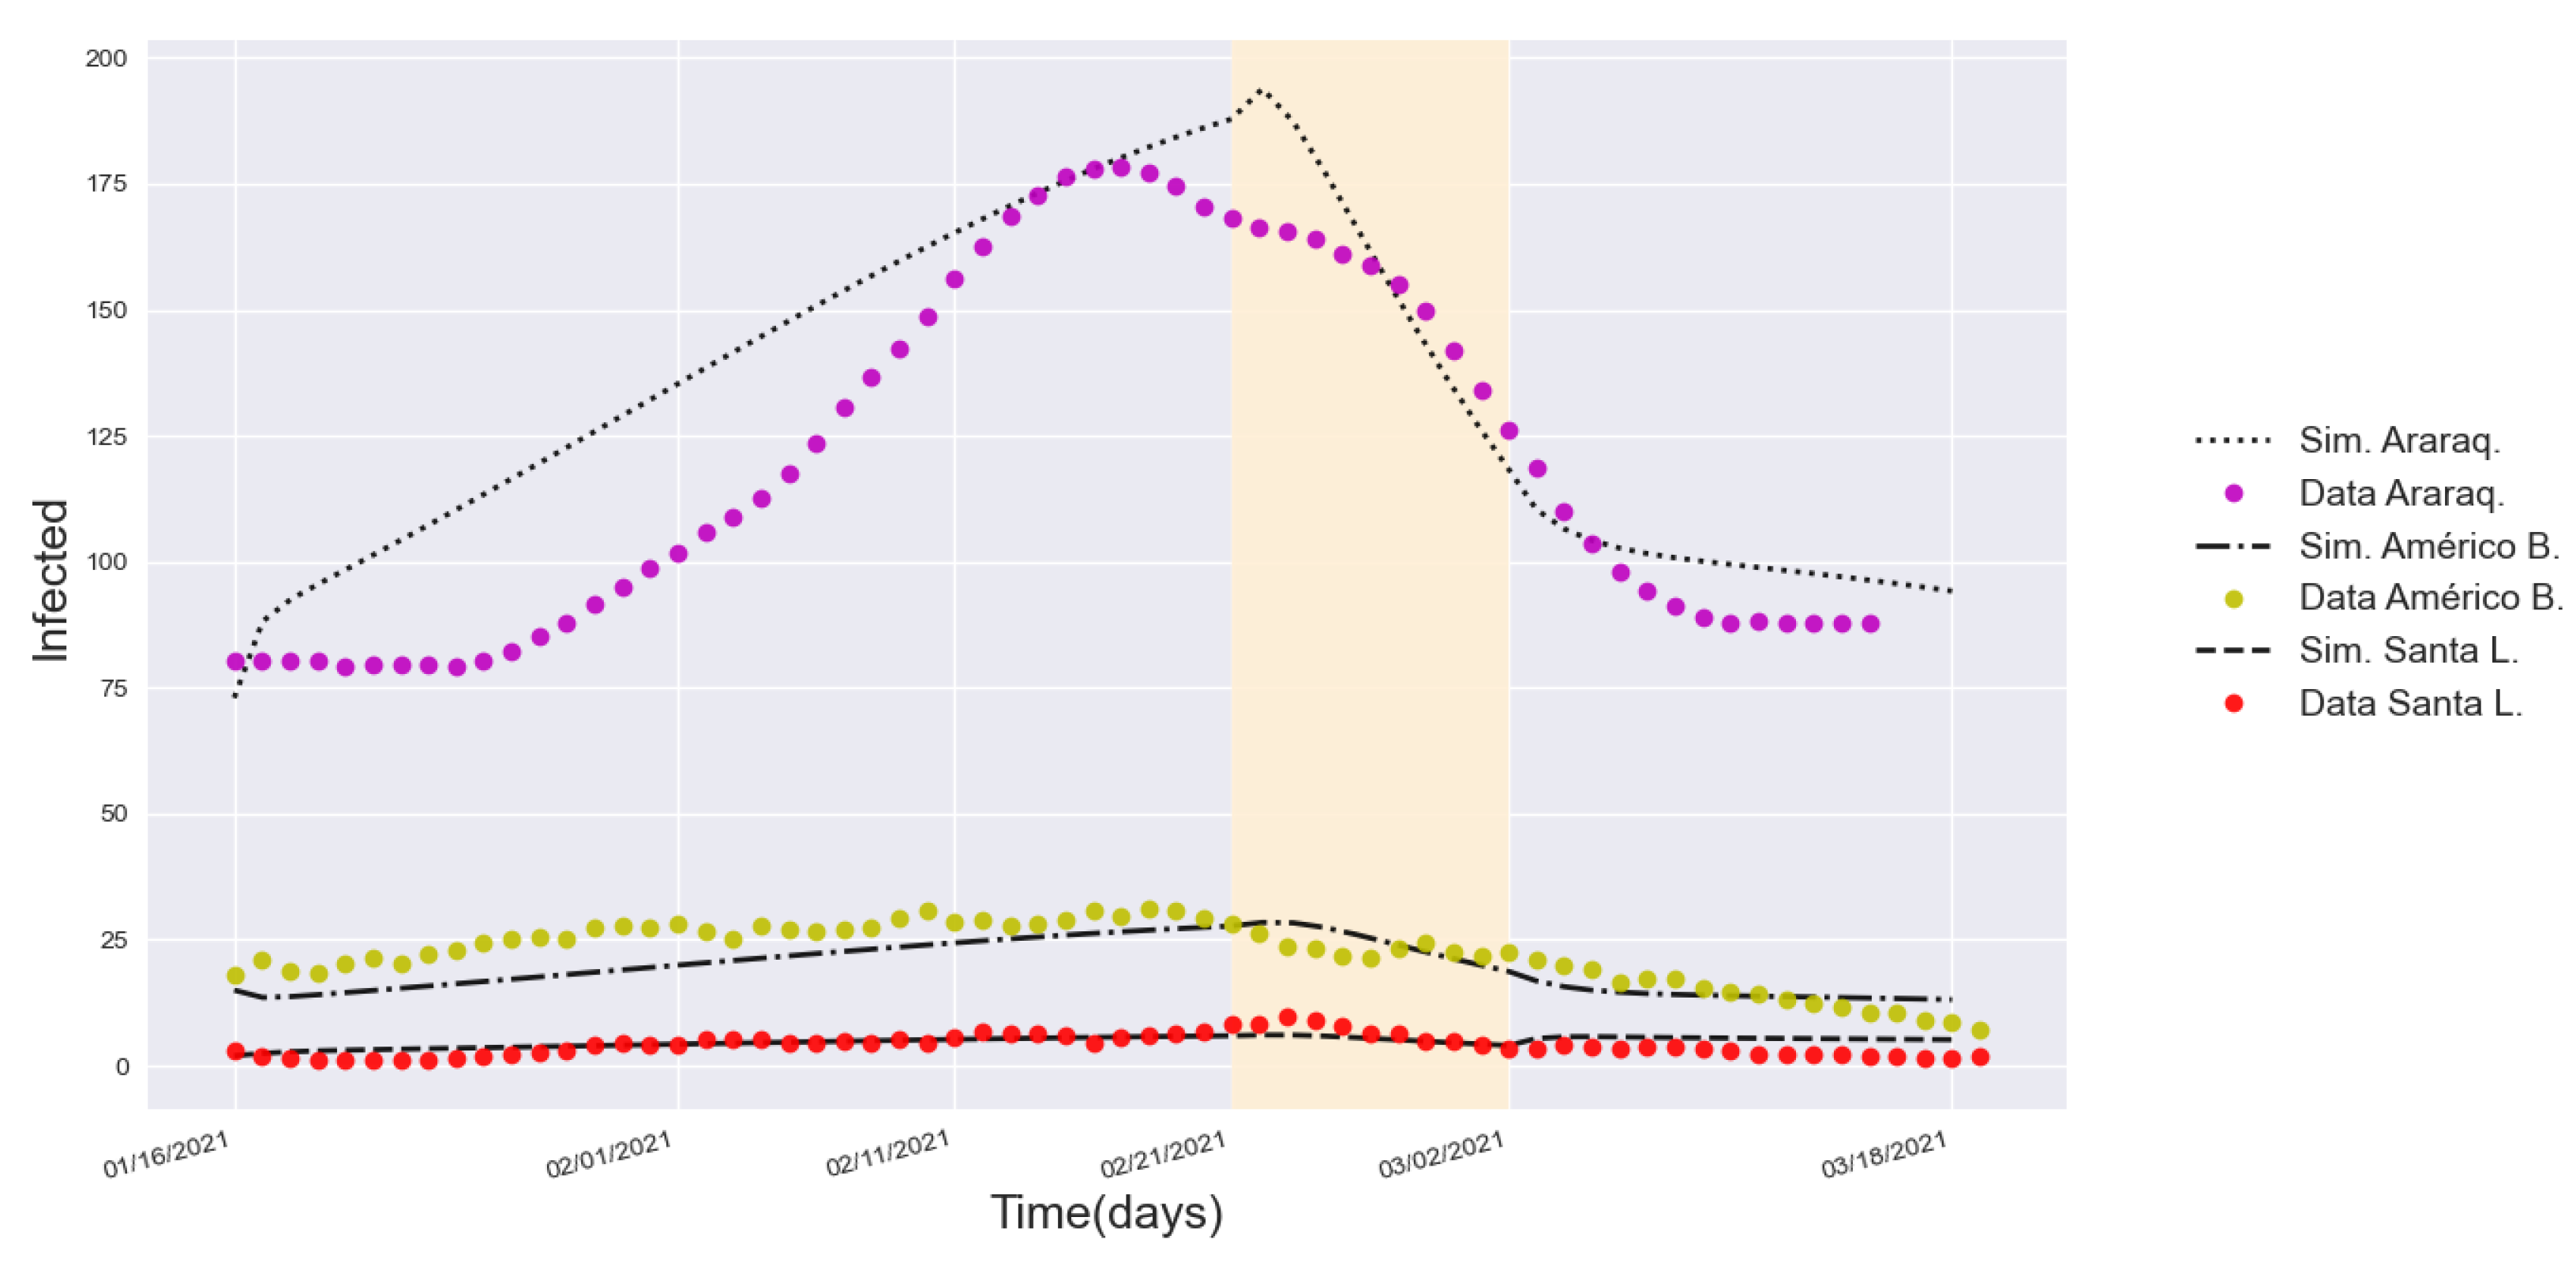
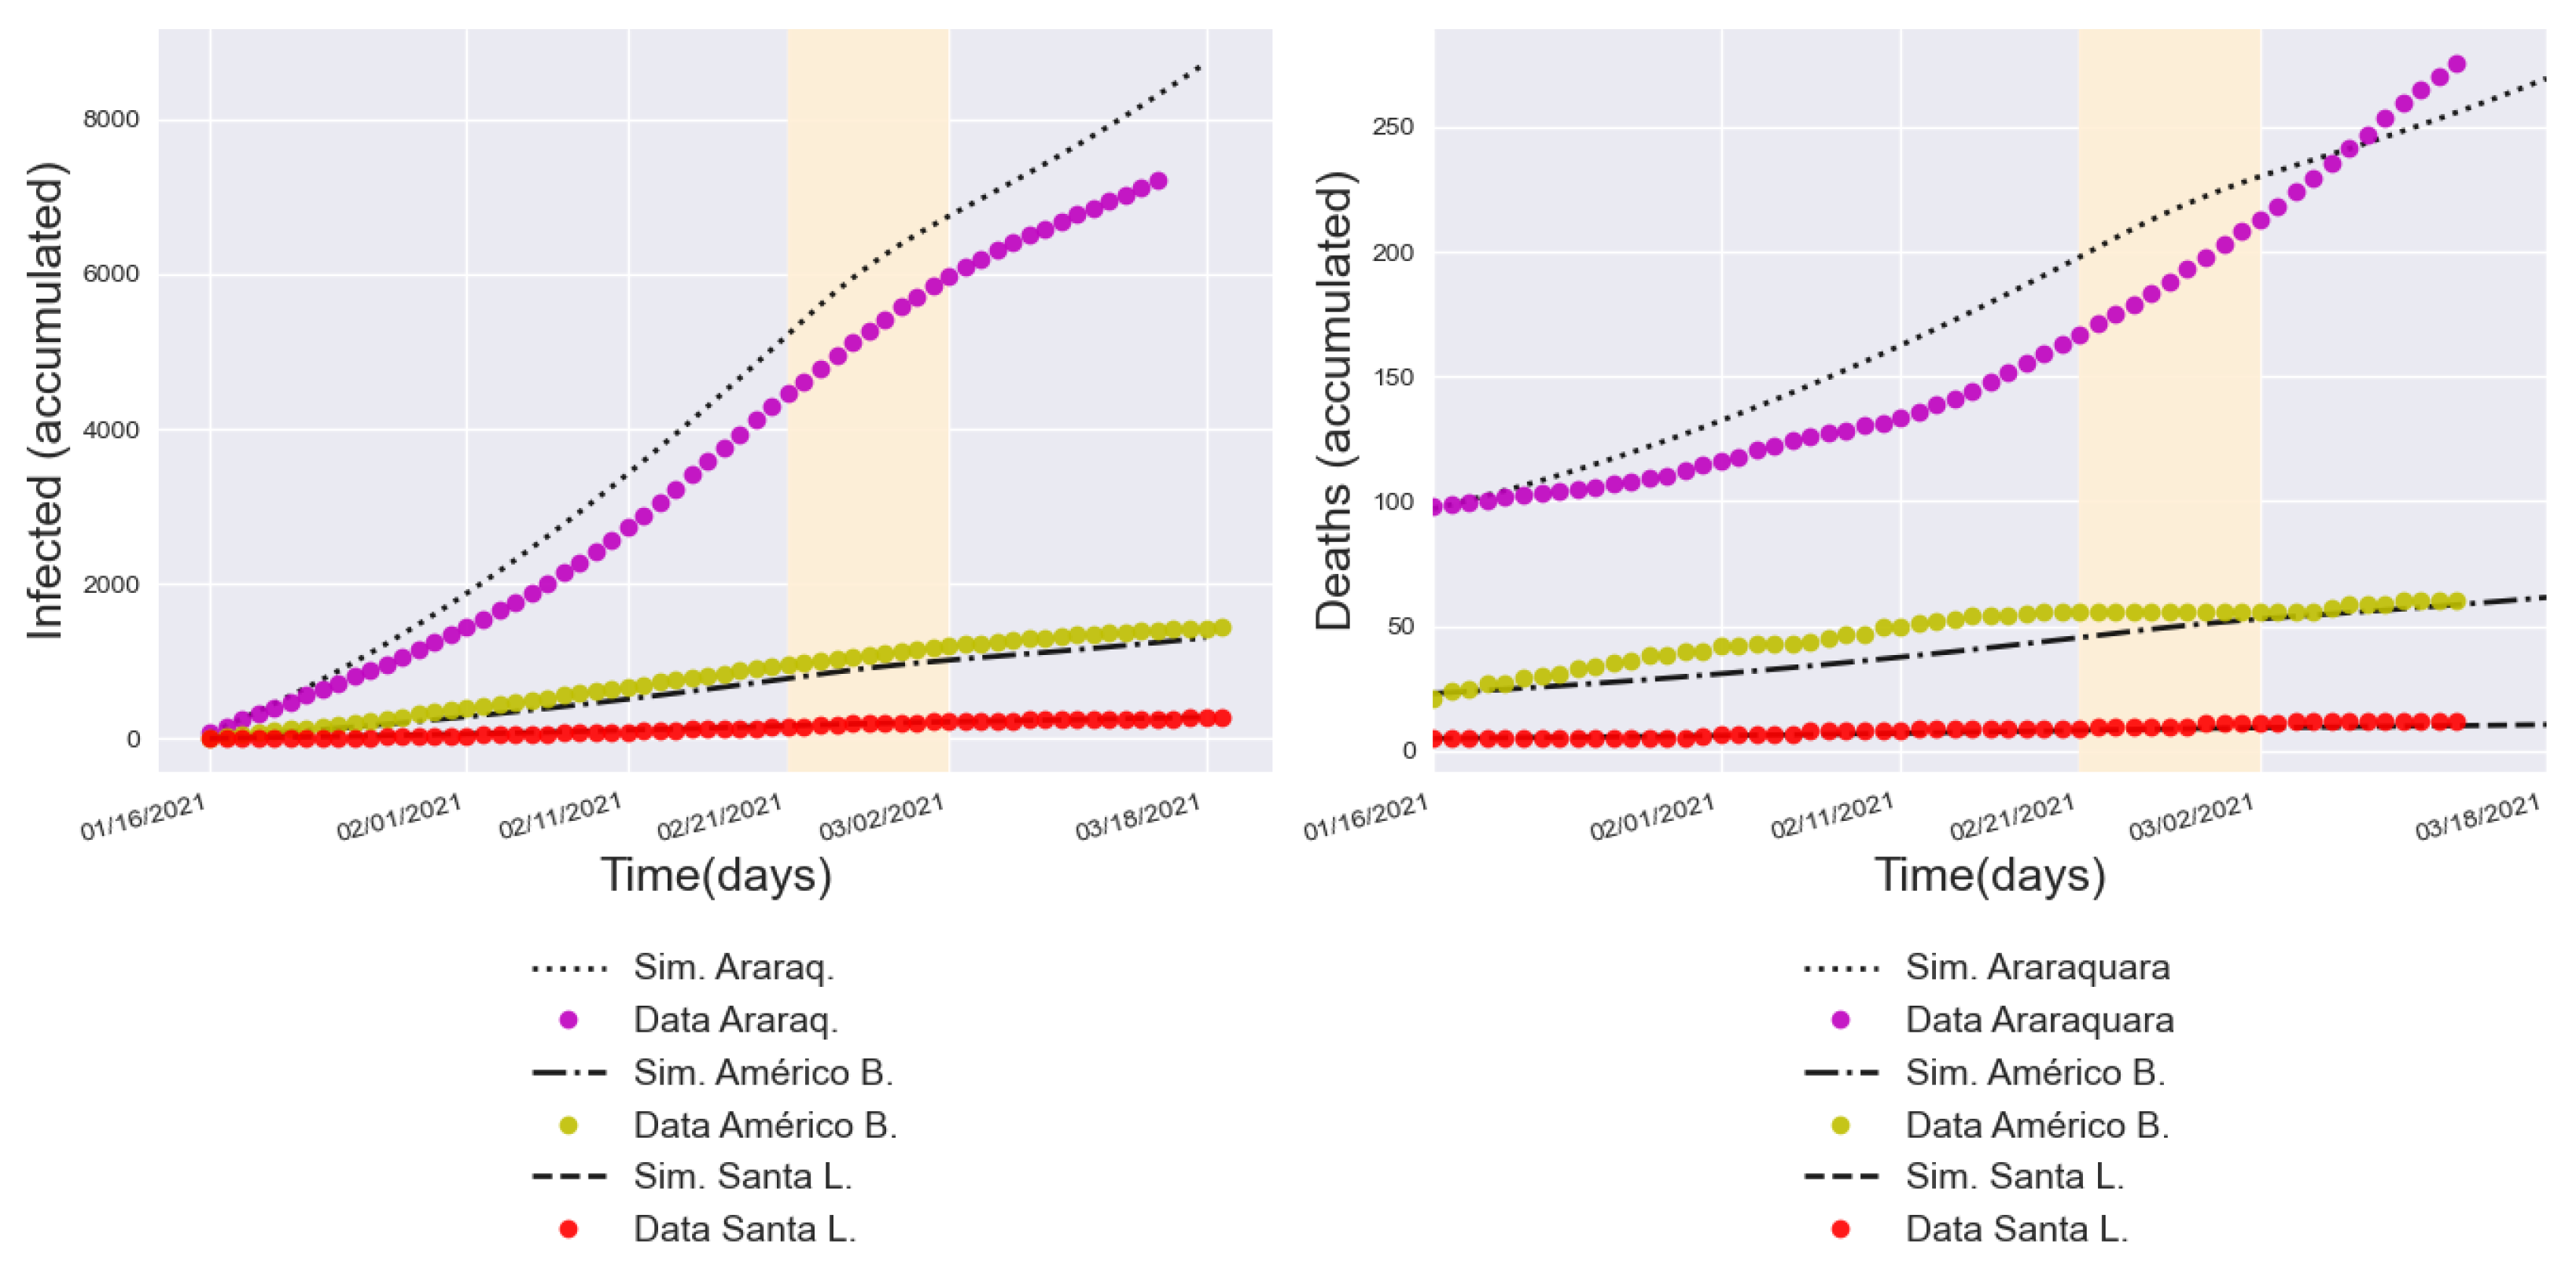
3.3. Validation with a Real Lockdown in a Medium-Sized Urban Center
4. Findings, Scope, and Limitations
5. Conclusions and Future Work
Author Contributions
Funding
Data Availability Statement
Conflicts of Interest
Appendix A. Parameter Descriptions

| Notation | Description | Value | Source |
|---|---|---|---|
| Number of susceptibles in (Presidente Prudente) at the initial time () | 223,677 | Database provided by [53] | |
| Number of susceptibles in (Alfredo Marcondes) at the initial time () | 4118 | Database provided by [53] | |
| Number of susceptibles in (Álvares Machado) at the initial time () | 24,729 | Database provided by [53] | |
| Number of susceptibles in (Regente Feijó) at the initial time () | 19,859 | Database provided by [53] | |
| Number of susceptibles in (Indiana) at the initial time () | 4936 | Database provided by [53] | |
| Number of susceptibles in (Anhumas) at the initial time () | 4026 | Database provided by [53] | |
| for | Infection rate of susceptibles in | Calibrated empirically starting as baseline the infection rate reported in [27] | |
| for | Infection rate of susceptibles in | Calibrated empirically starting with baseline of the infection rate reported in [27] | |
| for | Infection rate of susceptibles in | Calibrated empirically starting with baseline of the infection rate reported in [27] | |
| Infection rate of susceptibles in | Calibrated empirically starting with baseline of the infection rate reported in [27] | ||
| Infection rate of susceptibles in | Calibrated empirically starting with baseline of the infection rate reported in [27] | ||
| Infection rate of susceptibles in | Calibrated empirically starting with baseline of the infection rate reported in [27] | ||
| Infection rate of susceptibles in | Calibrated empirically starting with baseline of the infection rate reported in [27] | ||
| Infection rate of susceptibles in | Calibrated empirically starting with baseline of the infection rate reported in [27] | ||
| Number of infected individuals in at the initial time () | 2 | Filtered from data spreadsheets provided by [74] | |
| Number of infected individuals in at the initial time () | 0 | Filtered from data spreadsheets provided by [74] | |
| Number of infected individuals in at the initial time () | 0 | Filtered from data spreadsheets provided by [74] | |
| Number of infected individuals in at the initial time () | 0 | Filtered from data spreadsheets provided by [74] | |
| Number of infected individuals in at the initial time () | 1 | Filtered from data spreadsheets provided by [74] | |
| Number of infected individuals in at the initial time () | 0 | Filtered from data spreadsheets provided by [74] | |
| Total population in | 223,749 | Database provided by [53] | |
| Total population in | 4118 | Database provided by [53] | |
| Total population in | 24,733 | Database provided by [53] | |
| Total population in | 19,860 | Database provided by [53] | |
| Total population in | 4936 | Database provided by [53] | |
| Total population in | 4026 | Database provided by [53] | |
| Confinement rate of susceptibles in | Calculated based on the data reported in [70] | ||
| Rate at which the confined individuals become susceptible again in | 0.15 | By assumption, this rate is considered to be the same as the confinement rate | |
| Infection rate of confined individuals in | Calibrated empirically starting with baseline of the infection rate reported in [27] | ||
| Infection rate of confined individuals in | Calibrated empirically starting with baseline of the infection rate reported in [27] | ||
| Infection rate of confined individuals in | Calibrated empirically starting with baseline of the infection rate reported in [27] | ||
| Infection rate of confined individuals in | Calibrated empirically starting with baseline of the infection rate reported in [27] | ||
| Infection rate of confined individuals in | Calibrated empirically starting with baseline of the infection rate reported in [27] | ||
| Infection rate of confined individuals in | Calibrated empirically starting with baseline of the infection rate reported in [27] | ||
| Recovery rate of infected individuals in | 0.98 | Calculated by | |
| Mortality rate due to the disease in | 0.02 | Calibrated empirically until the curve matched the real cases | |
| Recovery rate of infected individuals in | 0.95 | Calculated by | |
| Mortality rate due to the disease in | 0.05 | Calibrated empirically until the curve matched the real cases | |
| Recovery rate of infected individuals in | 0.98 | Calculated by | |
| Mortality rate due to the disease in | 0.02 | Calibrated empirically until the curve matched the real cases | |
| Recovery rate of infected individuals in | 0.98 | Calculated by | |
| Mortality rate due to the disease in | 0.02 | Calibrated empirically until the curve matched the real cases | |
| Recovery rate of infected individuals in | 0.98 | Calculated by | |
| Mortality rate due to the disease in | 0.0 | Calibrated empirically until the curve matched the real cases | |
| Recovery rate of infected individuals in | 0.98 | Calculated by | |
| Mortality rate due to the disease in | 0.0 | Calibrated empirically until the curve matched the real cases |
References
- World Health Organization. WHO Declares Public Health Emergency on Novel Coronavirus. 2020. Available online: https://www.paho.org/en/news/30-1-2020-who-declares-public-health-emergency-novel-coronavirus (accessed on 30 September 2022).
- Cucinotta, D.; Vanelli, M. WHO Declares COVID-19 a Pandemic. Acta Biomed. Atenei Parm. 2020, 91, 157–160. [Google Scholar]
- Hegenberg, K.; Althammer, A.; Gehring, C.; Prueckner, S.; Trentzsch, H. Pre-hospital emergency medical services utilization amid COVID-19 in 2020: Descriptive study based on routinely collected dispatch data in Bavaria, Germany. Healthcare 2023, 11, 1983. [Google Scholar] [CrossRef] [PubMed]
- McKibbin, W.; Fernando, R. The global economic impacts of the COVID-19 pandemic. Econ. Model. 2023, 129, 106551. [Google Scholar] [CrossRef]
- Alizadeh, H.; Sharifi, A.; Damanbagh, S.; Nazarnia, H.; Nazarnia, M. Impacts of the COVID-19 pandemic on the social sphere and lessons for crisis management: A literature review. Nat. Hazards 2023, 117, 2139–2164. [Google Scholar] [CrossRef] [PubMed]
- Badalov, E.; Blackler, L.; Scharf, A.E.; Matsoukas, K.; Chawla, S.; Voigt, L.P.; Kuflik, A. COVID-19 double jeopardy: The overwhelming impact of the social determinants of health. Int. J. Equity Health 2022, 21, 76. [Google Scholar] [CrossRef]
- Berger, E.; Winkelmann, J.; Eckhardt, H.; Nimptsch, U.; Panteli, D.; Reichebner, C.; Rombey, T.; Busse, R. A country-level analysis comparing hospital capacity and utilisation during the first COVID-19 wave across Europe. Health Policy 2022, 126, 373–381. [Google Scholar] [CrossRef]
- Amuedo-Dorantes, C.; Borra, C.; Rivera-Garrido, N.; Sevilla, A. Early adoption of non-pharmaceutical interventions and COVID-19 mortality. Econ. Hum. Biol. 2021, 42, 101003. [Google Scholar] [CrossRef] [PubMed]
- Farsalinos, K.; Poulas, K.; Kouretas, D.; Vantarakis, A.; Leotsinidis, M.; Kouvelas, D.; Docea, A.O.; Kostoff, R.; Gerotziafas, G.T.; Antoniou, M.N.; et al. Improved strategies to counter the COVID-19 pandemic: Lockdowns vs. primary and community healthcare. Toxicol. Rep. 2021, 8, 1–9. [Google Scholar] [CrossRef] [PubMed]
- Herby, J.; Jonung, L.; Hanke, S.H. A Systematic Literature Review and Meta-Analysis of the Effects of Lockdowns on COVID-19 Mortality II. medRxiv 2023. [CrossRef]
- Adiga, A.; Dubhashi, D.; Lewis, B.; Marathe, M.; Venkatramanan, S.; Vullikanti, A. Mathematical Models for COVID-19 Pandemic: A Comparative Analysis. J. Indian Inst. Sci. 2020, 100, 793–807. [Google Scholar] [CrossRef]
- Singh, P.; Gupta, A. Generalized SIR (GSIR) epidemic model: An improved framework for the predictive monitoring of COVID-19 pandemic. ISA Trans. 2022, 124, 31–40. [Google Scholar] [CrossRef] [PubMed]
- Mohajan, H.K. Mathematical Analysis of SIR Model for COVID-19 Transmission. J. Innov. Med Res. 2022, 1, 1–18. [Google Scholar]
- Rapti, Z.; Cuevas-Maraver, J.; Kontou, E.; Liu, S.; Drossinos, Y.; Kevrekidis, P.; Barmann, M.; Chen, Q.; Kevrekidis, G. The Role of Mobility in the Dynamics of the COVID-19 Epidemic in Andalusia. Bull. Math. Biol. 2023, 85, 54. [Google Scholar] [CrossRef] [PubMed]
- Yousaf, M.; Zahir, S.; Riaz, M.; Hussain, S.M.; Shah, K. Statistical analysis of forecasting COVID-19 for upcoming month in Pakistan. Chaos Solitons Fractals 2020, 138, 109926. [Google Scholar] [CrossRef]
- Khan, R.U.; Almakdi, S.; Alshehri, M.; Kumar, R.; Ali, I.; Hussain, S.M.; Haq, A.U.; Khan, I.; Ullah, A.; Uddin, M.I. Probabilistic Approach to COVID-19 Data Analysis and Forecasting Future Outbreaks Using a Multi-Layer Perceptron Neural Network. Diagnostics 2022, 12, 2539. [Google Scholar] [CrossRef] [PubMed]
- Cooper, I.; Mondal, A.; Antonopoulos, C.G. A SIR model assumption for the spread of COVID-19 in different communities. Chaos Solitons Fractals 2020, 139, 110057. [Google Scholar] [CrossRef] [PubMed]
- Vidal Ledo, M.; Guinovart Díaz, R.; Baldoquín Rodríguez, W.; Valdivia Onega, N.C.; Morales Lezca, W. Mathematical Models for Epidemiological Control. Educ. Medica Super. 2020, 34, e2387. [Google Scholar]
- Patrão, M.; Reis, M. Analyzing the COVID-19 pandemic using SIR and SECIAR models. Biomatemática 2020, 30, 111–140. [Google Scholar]
- Grillo Ardila, E.K.; Santaella-Tenorio, J.; Guerrero, R.; Bravo, L.E. Mathematical model and COVID-19. Colomb. Medica 2020, 51, e4277. [Google Scholar] [CrossRef]
- Ibarra-Vega, D. Lockdown, one, two, none, or smart. Modeling containing COVID-19 infection. A conceptual model. Sci. Total Environ. 2020, 730, 138917. [Google Scholar] [CrossRef]
- Ndaïrou, F.; Area, I.; Nieto, J.J.; Torres, D.F. Mathematical modeling of COVID-19 transmission dynamics with a case study of Wuhan. Chaos Solitons Fractals 2020, 135, 109846. [Google Scholar] [CrossRef] [PubMed]
- He, Z.; Cai, Z. Quantifying the effect of quarantine control and optimizing its cost in COVID-19 pandemic. IEEE/ACM Trans. Comput. Biol. Bioinform. 2022, 21, 803–813. [Google Scholar] [CrossRef] [PubMed]
- Shi, W.; Tong, C.; Zhang, A.; Wang, B.; Shi, Z.; Yao, Y.; Jia, P. An extended Weight Kernel Density Estimation model forecasts COVID-19 onset risk and identifies spatiotemporal variations of lockdown effects in China. Commun. Biol. 2021, 4, 126. [Google Scholar]
- Zhou, Y.; Chen, Z.; Wu, X.; Tian, Z.; Ye, L.; Zheng, L. Retrospect: The Outbreak Evaluation of COVID-19 in Wuhan District of China. Healthcare 2021, 9, 61. [Google Scholar] [CrossRef] [PubMed]
- Spelta, A.; Flori, A.; Pierri, F.; Bonaccorsi, G.; Pammolli, F. After the lockdown: Simulating mobility, public health and economic recovery scenarios. Sci. Rep. 2021, 10, 16950. [Google Scholar] [CrossRef]
- Meyer, J.; Lima, M.; Espitia, C.; Longo, F.; Laiate, B.; Gois, A.; Kunz, C. Different Approaches to the Modelling of COVID-19. Trends Comput. Appl. Math. 2021, 22, 515–531. [Google Scholar] [CrossRef]
- Rosario, E.C.; Brandi, A.C.; Leal, S. Mathematical Modeling Applied to the Dynamics of COVID-19 in the State of Amapá and Metropolitan Region. Proc. Ser. Braz. Soc. Comput. Appl. Math. 2022, 9. [Google Scholar] [CrossRef]
- Amaral, F.; Casaca, W.; Oishi, C.M.; Cuminato, J.A. Simulating Immunization Campaigns and Vaccine Protection Against COVID-19 Pandemic in Brazil. IEEE Access 2021, 9, 126011–126022. [Google Scholar] [CrossRef]
- Amaral, F.; Casaca, W.; Oishi, C.M.; Cuminato, J.A. Towards Providing Effective Data-Driven Responses to Predict the COVID-19 in São Paulo and Brazil. Sensors 2021, 21, 540. [Google Scholar] [CrossRef]
- Rychtar, J.; Diagne, M.L.; Rwezaura, H.; Tchoumi, S.Y.; Tchuenche, J.M. A Mathematical Model of COVID-19 with Vaccination and Treatment. Comput. Math. Methods Med. 2021, 2021, 1250129. [Google Scholar]
- Costa, G.S.; Cota, W.; Ferreira, S.C. Metapopulation modeling of COVID-19 advancing into the countryside: An analysis of mitigation strategies for Brazil. medRxiv 2020. [Google Scholar] [CrossRef]
- Costa, G.S.; Cota, W.; Ferreira, S.C. Outbreak diversity in epidemic waves propagating through distinct geographical scales. Phys. Rev. Res. 2020, 2, 043306. [Google Scholar] [CrossRef]
- Kraemer, M.U.G.; Yang, C.H.; Gutierrez, B.; Wu, C.H.; Klein, B.; Pigott, D.M.; Open COVID-19 Data Working Group; du Plessis, L.; Faria, N.R.; Li, R.; et al. The effect of human mobility and control measures on the COVID-19 epidemic in China. Science 2020, 368, 493–497. [Google Scholar] [CrossRef]
- Chagas, E.T.C.; Barros, P.H.; Cardoso-Pereira, I.; Ponte, I.V.; Ximenes, P.; Figueiredo, F.; Murai, F.; Couto da Silva, A.P.; Almeida, J.M.; Loureiro, A.A.F.; et al. Effects of population mobility on the COVID-19 spread in Brazil. PLoS ONE 2021, 16, e0260610. [Google Scholar] [CrossRef]
- Ahmad, R.A.; Imron, M.A.; Ramadona, A.L.; Lathifah, N.; Azzahra, F.; Widyastuti, K.; Fuad, A. Modeling social interaction and metapopulation mobility of the COVID-19 pandemic in main cities of highly populated Java Island, Indonesia: An agent-based modeling approach. Front. Ecol. Evol. 2023, 10, 958651. [Google Scholar] [CrossRef]
- Choi, S.B.; Ahn, I. Forecasting imported COVID-19 cases in South Korea using mobile roaming data. PLoS ONE 2020, 15, e0241466. [Google Scholar]
- Zheng, Z.; Xie, Z.; Qin, Y.; Wang, K.; Yu, Y.; Fu, P. Exploring the influence of human mobility factors and spread prediction on early COVID-19 in the USA. BMC Public Health 2021, 21, 1–13. [Google Scholar]
- Shen, J. A recursive bifurcation model for early forecasting of COVID-19 virus spread in South Korea and Germany. Sci. Rep. 2020, 10, 20776. [Google Scholar] [CrossRef]
- Wang, X.S.; Wu, J.; Yang, Y. Richards model revisited: Validation by and application to infection dynamics. J. Theor. Biol. 2012, 313, 12–19. [Google Scholar] [CrossRef]
- Al-Dawsari, S.R.; Sultan, K.S. Modeling of daily confirmed Saudi COVID-19 cases using inverted exponential regression. Math. Biosci. Eng. 2021, 18, 2303–2330. [Google Scholar] [CrossRef]
- Fan, Q.; Li, Q.; Chen, Y.; Tang, J. Modeling COVID-19 spread using multi-agent simulation with small-world network approach. BMC Public Health 2024, 24, 672. [Google Scholar] [CrossRef] [PubMed]
- Silva, P.C.; Batista, P.V.; Lima, H.S.; Alves, M.A.; Guimarães, F.G.; Silva, R.C. COVID-ABS: An agent-based model of COVID-19 epidemic to simulate health and economic effects of social distancing interventions. Chaos Solitons Fractals 2020, 139, 110088. [Google Scholar] [CrossRef]
- Nitzsche, C.; Simm, S. Agent-based modeling to estimate the impact of lockdown scenarios and events on a pandemic exemplified on SARS-CoV-2. Sci. Rep. 2024, 14, 13391. [Google Scholar] [CrossRef]
- Capistran, M.A.; Capella, A.; Christen, J.A. Forecasting hospital demand in metropolitan areas during the current COVID-19 pandemic and estimates of lockdown-induced 2nd waves. PLoS ONE 2021, 16, e0245669. [Google Scholar] [CrossRef] [PubMed]
- Siam, Z.S.; Arifuzzaman, M.; Ahmed, M.S.; Khan, F.A.; Rashid, M.H.; Islam, M.S. Dynamics of COVID-19 transmission in Dhaka and Chittagong: Two business hubs of Bangladesh. Clin. Epidemiol. Glob. Health 2021, 10, 100684. [Google Scholar] [CrossRef] [PubMed]
- Krishnamurthy, K.; Ambikapathy, B.; Kumar, A.; De Britto, L. Prediction of the transition from subexponential to the exponential transmission of SARS-CoV-2 in Chennai, India: Epidemic nowcasting. JMIR Public Health Surveill. 2020, 6, e21152. [Google Scholar] [CrossRef]
- Silva, G.C.; Ribeiro, E.M.S. The impact of Brazil’s transport network on the spread of COVID-19. Sci. Rep. 2023, 13, 2240. [Google Scholar] [CrossRef]
- Peixoto, P.S.; Marcondes, D.; Peixoto, C.; Oliva, S.M. Modeling future spread of infections via mobile geolocation data and population dynamics. An application to COVID-19 in Brazil. PLoS ONE 2020, 15, e0235732. [Google Scholar] [CrossRef]
- Barsasella, D.; Iman, A.T.; Fadly, F.; Uddin, M.; Mohammed, A.; Shaik, T.; Saputra, H.; Malwade, S.; Dhar, E.; Zakiah; et al. Information Flow and Data Gaps in COVID-19 Recording and Reporting at National and Provincial Levels in Indonesia. Healthcare 2022, 10, 204. [Google Scholar] [CrossRef] [PubMed]
- Ferreira, I. PIB of Municipalities Shows That the Country’s Economy Continued to Decentralize in 2021. 2023. Available online: https://agenciadenoticias.ibge.gov.br/agencia-noticias/2012-agencia-de-noticias/noticias/38683-pib-dos-municipiosmostra-que-economia-do-pais-continuou-a-se-desconcentrar-em-2021#:~:text=S%C3%A3o%20Paulo%20(SP)%20concentrou%209,%25%20do%20PIB%20nacional%20em%202021,%20menos%20do%20que%20em%202020.&text=Onze%20munic%C3%ADpios%20responderam%20por%20quase,%25%20do%20PIB%20em%202021:%20S%C3%A3o%20Paulo%20(SP),%20Rio%20de%20Janeiro%20(RJ),%20Bras%C3%ADlia%20(DF)%20e%20Fortaleza%20(CE) (accessed on 2 August 2024).
- São Paulo is the 21st Largest Economy in the World. 2020. Available online: https://www.casacivil.sp.gov.br/sao-paulo-e-a-21a-maior-economia-do-mundo/ (accessed on 2 August 2024).
- Brazilian Institute of Geography and Statistics (IBGE). Demographic Census 2022. 2022. Available online: https://censo2022.ibge.gov.br/panorama/?utm_source=ibge&utm_medium=home&utm_campaign=portal (accessed on 16 January 2024).
- Colnago, M.; Casaca, W.; Oishi, C.M.; Amaral, F.V.; Cuminato, J.A. Lockdown against Covid-19: Does it work or not? A case study with the municipality of Araraquara. Proc. Ser. Braz. Soc. Comput. Appl. Math. 2021, 8, 0429. [Google Scholar]
- Figueiredo Filho, D.B.; Silva, L.E.d.O. Social distancing and severe acute respiratory syndrome coronavirus 2 transmission: A case study from Araraquara, São Paulo, Brazil. J. Braz. Soc. Trop. Med. 2021, 54, e0197-2021. [Google Scholar] [CrossRef] [PubMed]
- Santos Francisco, B.; Bueno Dutra, F.; Carvalho-Batista, A.; Gordo Peres Francisco, F.; Sciacio Ghidini, M.; de Souza Cardoso, R.; Conceição Márquez Piña Rodrigues, F. Social isolation measures cause reduction in the contamination and deaths by COVID-19? The case of the municipality of Araraquara, SP, Brazil. Interfaces Científicas-Saúde E Ambiente 2021, 8, 233–249. [Google Scholar]
- Aragão, D.P.; Junior, A.G.d.S.; Mondini, A.; Distante, C.; Gonçalves, L.M.G. COVID-19 Patterns in Araraquara, Brazil: A Multimodal Analysis. Int. J. Environ. Res. Public Health 2023, 20, 4740. [Google Scholar] [CrossRef] [PubMed]
- Watson, S.I.; Diggle, P.J.; Chipeta, M.G.; Lilford, R.J. Spatiotemporal analysis of the first wave of COVID-19 hospitalisations in Birmingham, UK. BMJ Open 2021, 11, e050574. [Google Scholar] [CrossRef] [PubMed]
- Zhang, Y.; Shi, L.; Chen, H.; Wang, X.; Sun, G. Hubei’s Core Response Policies in the Early Stage of COVID-19. BioMed Res. Int. 2021, 2021, 6610045. [Google Scholar] [CrossRef]
- Barbarossa, M.V.; Bogya, N.; Dénes, A.; Röst, G.; Varma, H.V.; Vizi, Z. Fleeing lockdown and its impact on the size of epidemic outbreaks in the source and target regions—A COVID-19 lesson. Sci. Rep. 2021, 11, 9233. [Google Scholar]
- Cavany, S.M.; España, G.; Vazquez-Prokopec, G.M.; Scott, T.W.; Alex Perkins, T. Pandemic-associated mobility restrictions could cause increases in dengue virus transmission. PLoS Neglected Trop. Dis. 2021, 15, e0009603. [Google Scholar] [CrossRef] [PubMed]
- Brethouwer, J.T.; van de Rijt, A.; Lindelauf, R.; Fokkink, R. “Stay nearby or get checked”: A COVID-19 control strategy. Infect. Dis. Model. 2021, 6, 36–45. [Google Scholar]
- Ferreira, S.A.S. Dilemmas and Impacts of Prison Units in Pontal do Paranapanema: A Case Study in the Municipality of Marabá Paulista. Master’s Thesis, Universidade do Oeste Paulista, Presidente Prudente, Brazil, 2017; 128p. [Google Scholar]
- Brazilian Institute of Geography and Statistics (IBGE). Continuous Cartographic Bases. 2022. Available online: https://www.ibge.gov.br/geociencias/cartas-e-mapas/bases-cartograficas-continuas.html (accessed on 14 January 2023).
- Brazilian Institute of Geography and Statistics (IBGE). Population Arrangements and Urban Concentrations in Brazil. 2022. Available online: https://www.ibge.gov.br/apps/arranjos_populacionais/2022/ (accessed on 16 January 2023).
- Kermack, W.O.; McKendrick, A.G. A Contribution to the Mathematical Theory of Epidemics. Proc. R. Soc. London. Ser. A Contain. Pap. A Math. Phys. Character 1927, 115, 700–721. [Google Scholar]
- Tang, L.; Zhou, Y.; Wang, L.; Purkayastha, S.; Zhang, L.; He, J.; Wang, F.; Song, P.X.K. A review of multi-compartment infectious disease models. Int. Stat. Rev. 2020, 88, 462–513. [Google Scholar]
- Townsend, J.P.; Hassler, H.B.; Wang, Z.; Miura, S.; Singh, J.; Kumar, S.; Ruddle, N.H.; Galvani, A.P.; Dornburg, A. The durability of immunity against reinfection by SARS-CoV-2: A comparative evolutionary study. Lancet Microbe 2021, 2, e666–e675. [Google Scholar] [CrossRef] [PubMed]
- Leiva, G.d.C.; Sathler, D.; Orrico Filho, R.D. Urban Structure and Population Mobility: Implications for Social Distancing and the Spread of COVID-19. Rev. Bras. Estud. Popul. 2020, 37, e0118. [Google Scholar]
- Intelligent Monitoring System of the São Paulo State Government (SIMI-SP). Adherence to Social Isolation in SP. 2020. Available online: https://www.saopaulo.sp.gov.br/coronavirus/isolamento/ (accessed on 2 January 2023).
- Garrido, J.M.; Martínez-Rodríguez, D.; Rodríguez-Serrano, F.; Pérez-Villares, J.M.; Ferreiro-Marzal, A.; Jiménez-Quin tana, M.M.; Study Group COVID-19 Granada; Villanueva, R.J. Mathematical model optimized for prediction and health care planning for COVID-19. Med. Intensiv. (Engl. Ed.) 2022, 46, 248–258. [Google Scholar]
- Murray, J.D. Mathematical Biology; Springer: Berlin/Heidelberg, Germany, 1990. [Google Scholar]
- van den Driessche, P.; Watmough, J. Reproduction numbers and sub-threshold endemic equilibria for compartmental models of disease transmission. Math. Biosci. 2002, 180, 29–48. [Google Scholar] [CrossRef] [PubMed]
- Sao Paulo Sate Government (SEADE). Against the New Coronavirus-Complete Bulletin. 2020. Available online: https://www.seade.gov.br (accessed on 4 December 2022).
- Sao Paulo Sate Government (SEADE). Tehnical Notes. 2020. Available online: https://coronavirus.seade.gov.br (accessed on 15 July 2024).
- Bi, Q.; Wu, Y.; Mei, S.; Ye, C.; Zou, X.; Zhang, Z.; Liu, X.; Wei, L.; Truelove, S.A.; Zhang, T.; et al. Epidemiology and transmission of COVID-19 in 391 cases and 1286 of their close contacts in Shenzhen, China: A retrospective cohort study. Lancet Infect. Dis. 2020, 20, 911–919. [Google Scholar] [CrossRef] [PubMed]
- University of Melbourne. Coronavirus 10-Day Forecast Project. 2020. Available online: http://covid19forecast.science.unimelb.edu.au/#about (accessed on 15 July 2024).
- IBGE (Brazilian Institute of Geography and Statistics). Population Arrangements and Urban Concentrations in Brazil, 2nd ed.; IBGE: Rio de Janeiro, Brazil, 2016. [Google Scholar]
- Müller-Komorowska, D. Differential Equations with SciPy–Odeint or solve_ivp. 2021. Available online: https://danielmuellerkomorowska.com/2021/02/16/differential-equations-with-scipy-odeint-or-solve_ivp/ (accessed on 29 November 2022).
- Butcher, J.C. Numerical Methods for Ordinary Differential Equations; John Wiley & Sons: Hoboken, NJ, USA, 2016. [Google Scholar]
- Cash, J.R. Backward Differentiation Formulae. In Encyclopedia of Applied and Computational Mathematics; Springer: Berlin/Heidelberg, Germany, 2015; pp. 97–101. [Google Scholar]
- Nguyen, Q. Hands-on Application Development with PyCharm: Accelerate Your Python Applications Using Practical Coding Techniques in PyCharm; Packt Publishing Ltd.: Birmingham, UK, 2019. [Google Scholar]
- McKinney, W. Data Structures for Statistical Computing in Python. In Proceedings of the 9th Python in Science Conference, Austin, TX, USA, 28 June–3 July 2010; pp. 56–61. [Google Scholar]
- Hunter, J.; Dale, D.; Firing, E. Matplotlib: Python Plotting. 2012. Available online: https://matplotlib.org/ (accessed on 29 November 2022).
- de Myttenaere, A.; Golden, B.; Le Grand, B.; Rossi, F. Mean Absolute Percentage Error for regression models. Neurocomputing 2016, 192, 38–48. [Google Scholar] [CrossRef]
- Chicco, D.; Warrens, M.; Jurman, G. The coefficient of determination R-squared is more informative than SMAPE, MAE, MAPE, MSE and RMSE in regression analysis evaluation. PeerJ Comput. Sci. 2021, 7, e623. [Google Scholar] [CrossRef] [PubMed]
- Tang, B.; Zhou, W.; Wang, X.; Wu, H.; Xiao, Y. Controlling Multiple COVID-19 Epidemic Waves: An Insight from a Multi-scale Model Linking the Behaviour Change Dynamics to the Disease Transmission Dynamics. Bull. Math. Biol. 2022, 84, 106. [Google Scholar] [CrossRef]
- Mema, B.; Tosuni, S. Implementation of Mathematics Model in Public Health: Albanian Case Study. Smart Cities Reg. Dev. (SCRD) J. 2024, 8, 41–54. [Google Scholar] [CrossRef]
- Liu, Y.; Gayle, A.; Wilder-Smith, A.; Rocklöv, J. The reproductive number of COVID-19 is higher compared to SARS coronavirus. J. Travel. Med. 2020, 27, taaa021. [Google Scholar] [CrossRef]
- Ferguson, N.M.; Laydon, D.; Nedjati-Gilani, G.; Imai, N.; Ainslie, K.; Baguelin, M.; Bhatia, S.; Boonyasiri, A.; Cucunubá, Z.; Cuomo-Dannenburg, G.; et al. Report 9: Impact of Non-Pharmaceutical Interventions (NPIs) to Reduce COVID-19 Mortality and Healthcare Demand; Imperial College London: London, UK, 2020. [Google Scholar]
- Varela, H. The Importance of Isolation and Why We Need to Study Araraquara and São Carlos-Jornal da USP. 2021. Available online: https://jornal.usp.br/?p=396566 (accessed on 2 January 2023).
- Bajomo, M.; Ogbeyemi, A.; Zhang, W. A systems dynamics approach to the management of material procurement for Engineering, Procurement and Construction industry. Int. J. Prod. Econ. 2022, 244, 108390. [Google Scholar] [CrossRef]
- Wang, J.; Wang, H.; Ding, J.; Furuta, K.; Kanno, T.; Ip, W.; Zhang, W. On domain modelling of the service system with its application to enterprise information systems. Enterp. Inf. Syst. 2016, 10, 1–16. [Google Scholar] [CrossRef]


| Notation | Description |
|---|---|
| Number of cities | |
| Notation for city i | |
| Total population in at time t | |
| Number of susceptible individuals in at time t | |
| Number of infected individuals in at time t | |
| Number of confined individuals in at time t | |
| Number of deaths in at time t | |
| Number of recovered individuals in at time t | |
| Flow rate of people traveling from to every day | |
| Infection rate of susceptible individuals in | |
| Confinement rate of susceptible individuals in | |
| Rate at which confined individuals revert to being susceptible in | |
| Infection rate of confined individuals in | |
| Recovery rate of infected individuals in | |
| Mortality rate in |
| Week | Weekly Cases | ||||
|---|---|---|---|---|---|
| No Lock. | Lock. 70 | Lock. 30 | Lock. 20 | Lock. 10 * | |
| 1 | 18 | 18 | 18 | 18 | 18 |
| 2 | 27 | 27 | 27 | 27 | 27 |
| 3 | 43 | 43 | 43 | 43 | 43 |
| 4 | 66 | 38 | 38 | 38 | 37 |
| 5 | 108 | 12 | 12 | 12 | 13 |
| 6 | 170 | 3 | 3 | 3 | 10 |
| 7 | 226 | 1 | 1 | 2 | 7 |
| 8 | 299 | 1 | 0 | 1 | 2 |
| 9 | 382 | 0 | 0 | 2 | 2 |
| 10 | 381 | 0 | 0 | 2 | 1 |
| 11 | 341 | 0 | 0 | 3 | 0 |
| 12 | 303 | 0 | 0 | 4 | 0 |
| 13 | 268 | 0 | 0 | 5 | 0 |
| 14 | 235 | 0 | 0 | 6 | 0 |
| Week | Accumulated Deaths | ||||
|---|---|---|---|---|---|
| No Lock. | Lock. 70 | Lock. 30 | Lock. 20 | Lock. 10 * | |
| 1 | 57 | 57 | 57 | 57 | 57 |
| 2 | 60 | 60 | 60 | 60 | 60 |
| 3 | 65 | 65 | 65 | 65 | 65 |
| 4 | 72 | 71 | 71 | 71 | 71 |
| 5 | 85 | 74 | 74 | 74 | 74 |
| 6 | 104 | 75 | 75 | 75 | 76 |
| 7 | 130 | 75 | 75 | 75 | 77 |
| 8 | 169 | 75 | 75 | 75 | 77 |
| 9 | 216 | 75 | 75 | 75 | 78 |
| 10 | 267 | 75 | 75 | 76 | 78 |
| 11 | 319 | 75 | 75 | 76 | 78 |
| 12 | 365 | 75 | 75 | 76 | 78 |
| 13 | 406 | 75 | 75 | 76 | 78 |
| 14 | 442 | 75 | 75 | 77 | 78 |
| Period | City | Infected | Infected (Accum.) | Deaths (Accum.) | |||
|---|---|---|---|---|---|---|---|
| MAPE | NRMSE | MAPE | NRMSE | MAPE | NRMSE | ||
| Lockdown | 11.44% | 0.197 | 11.03% | 0.467 | 13.38% | 0.895 | |
| 2.79% | 0.322 | 18.06% | 0.789 | 13.76% | 0.952 | ||
| 1.73% | 1.006 | 6.91% | 0.281 | 14.39% | 1.218 | ||
| After lockdown | 11.96% | 0.639 | 10.79% | 0.757 | 2.77% | 0.298 | |
| 2.68% | 0.617 | 10.73% | 0.627 | 2.61% | 0.369 | ||
| 1.96% | 1.185 | 3.75% | 0.270 | 21.13% | 3.103 | ||
| Period | City | Infected | Infected (Accum.) | ||
|---|---|---|---|---|---|
| MAPE | NRMSE | MAPE | NRMSE | ||
| Lockdown | 19.23% | 0.208 | 26.87% | 1.372 | |
| 7.36% | 0.112 | 24.11% | 1.233 | ||
| 34.39% | 0.474 | 32.67% | 1.010 | ||
| After lockdown | 61.24% | 0.614 | 18.13% | 1.892 | |
| 47.52% | 0.472 | 17.40% | 1.244 | ||
| 77.85% | 0.745 | 23.80% | 1.596 | ||
Disclaimer/Publisher’s Note: The statements, opinions and data contained in all publications are solely those of the individual author(s) and contributor(s) and not of MDPI and/or the editor(s). MDPI and/or the editor(s) disclaim responsibility for any injury to people or property resulting from any ideas, methods, instructions or products referred to in the content. |
© 2025 by the authors. Licensee MDPI, Basel, Switzerland. This article is an open access article distributed under the terms and conditions of the Creative Commons Attribution (CC BY) license (https://creativecommons.org/licenses/by/4.0/).
Share and Cite
Ferreira, R.S.; Casaca, W.; Meyer, J.F.C.A.; Colnago, M.; Dias, M.A.; Negri, R.G. Epidemic Modeling in Satellite Towns and Interconnected Cities: Data-Driven Simulation and Real-World Lockdown Validation. Information 2025, 16, 299. https://doi.org/10.3390/info16040299
Ferreira RS, Casaca W, Meyer JFCA, Colnago M, Dias MA, Negri RG. Epidemic Modeling in Satellite Towns and Interconnected Cities: Data-Driven Simulation and Real-World Lockdown Validation. Information. 2025; 16(4):299. https://doi.org/10.3390/info16040299
Chicago/Turabian StyleFerreira, Rafaella S., Wallace Casaca, João F. C. A. Meyer, Marilaine Colnago, Mauricio A. Dias, and Rogério G. Negri. 2025. "Epidemic Modeling in Satellite Towns and Interconnected Cities: Data-Driven Simulation and Real-World Lockdown Validation" Information 16, no. 4: 299. https://doi.org/10.3390/info16040299
APA StyleFerreira, R. S., Casaca, W., Meyer, J. F. C. A., Colnago, M., Dias, M. A., & Negri, R. G. (2025). Epidemic Modeling in Satellite Towns and Interconnected Cities: Data-Driven Simulation and Real-World Lockdown Validation. Information, 16(4), 299. https://doi.org/10.3390/info16040299