Article

Epidemic Modeling in Satellite Towns and Interconnected Cities: Data-Driven Simulation and Real-World Lockdown Validation

by
Rafaella S. Ferreira
1,*,
Wallace Casaca
1,
João F. C. A. Meyer
2,
Marilaine Colnago
1,
Mauricio A. Dias
3 and
Rogério G. Negri
4
1
São Paulo State University (UNESP), Institute of Biosciences, Humanities and Exact Sciences (IBILCE), São José do Rio Preto 15054-000, SP, Brazil
2
State University of Campinas (UNICAMP), Institute of Mathematics, Statistics and Scientific Computing (IMECC), Campinas 13083-859, SP, Brazil
3
São Paulo State University (UNESP), Faculty of Science and Technology (FCT), Presidente Prudente 19060-900, SP, Brazil
4
São Paulo State University (UNESP), Science and Technology Institute (ICT), São José dos Campos 12245-000, SP, Brazil
*
Author to whom correspondence should be addressed.
Information 2025, 16(4), 299; https://doi.org/10.3390/info16040299
Submission received: 4 March 2025 / Revised: 27 March 2025 / Accepted: 29 March 2025 / Published: 8 April 2025

Abstract

:
Understanding the effectiveness of different quarantine strategies is crucial for controlling the spread of COVID-19, particularly in regions with limited data. This study presents a SCIRD-inspired model to simulate the transmission dynamics of COVID-19 in medium-sized cities and their surrounding satellite towns. Unlike previous works that focus primarily on large urban centers or homogeneous populations, our approach incorporates intercity mobility and evaluates the impact of spatially differentiated interventions. By analyzing lockdown strategies implemented during the first year of the pandemic, we demonstrate that short, localized lockdowns are highly effective in reducing virus propagation, while intermittent restrictions balance public health concerns with socioeconomic demands. A key contribution of this study is the validation of the epidemic model using real-world data from the 2021 lockdown that occurred in a medium-sized city, confirming its predictive accuracy and adaptability to different contexts. Additionally, we provide a detailed analysis of how mobility patterns between municipalities influence infection spread, offering a more comprehensive mathematical framework for decision-making. These findings advance the understanding of epidemic control in regions with sparse data and provide evidence-based insights to inform public health policies in similar contexts.

Graphical Abstract

1. Introduction

COVID-19 is a respiratory infection disease caused by the SARS-CoV-2 virus, first identified in Wuhan, China, in December 2019. On 30 January 2020, the World Health Organization (WHO) declared the COVID-19 outbreak to be a public health emergency of international concern [1], and on 11 March 2020, it was declared a pandemic [2]. Since then, the virus has been responsible for the deaths of millions of people worldwide, leading to one of the largest global pandemics in the past century. Beyond the alarming death toll, the coronavirus crisis posed negative impacts on the healthcare, economic, and social spheres [3,4,5]. It strained the healthcare system, culminating in hospital overload and the creation of several ICU beds in response to the fast-escalating demand [6,7].
During the first years of the pandemic, i.e., the most critical period when vaccination was not yet available, the WHO recommended Non-Pharmaceutical Interventions (NPIs) [8], such as social distancing, mask-wearing, and the implementation of public policies at various levels to collectively stop the virus. One of the more stringent strategies adopted in some countries was the implementation of lockdowns, allowing only essential services to operate, with the primary goal of reducing hospital admissions and deaths [9,10].
Given the gravity of the coronavirus emergency worldwide, it has been imperative to develop new mathematical models to drive intervention strategies and virus control measures for health and public bodies. These include the mathematical modeling of coronavirus spread at both regional and national levels, thereby supporting decision-making protocols [11,12,13,14,15,16].
Among the key epidemic modeling approaches, the SIR (Susceptible–Infected–Recovered) approach stands out as one of the seminal methods. The rationale behind SIR is to place people into disease-related compartments, enabling a simplified yet insightful representation of the epidemic dynamics [17]. Building upon this well-established model, several extensions have been proposed to tackle COVID-19 dissemination. For example, Ledo et al. [18] introduced the exposed class (E) into the SIR formulation, along with specific characteristics related to virus containment, giving rise to the SEIS model. Patrão and Reis [19] presented a SIR-type approach that poses herd immunity while still assessing the strain on the healthcare system through repeated cycles of social isolation and reopening. Ardila et al. [20] formulated a SIR-inspired model to obtain the interactions and dynamics of SARS-CoV-2 in a general sense. They pointed out that their biggest challenge was the lack of up-to-date data, which are essential for estimating rates and parameters. Ibarra-Vega [21] proposed a SIR-based method where hospital capacity, contact with infected, and fatalities were accommodated into specific compartments. Using piecewise functions, they modeled lockdown impacts, revealing a significant decrease in infections. Despite the relevant contributions, the previously discussed works focused more on theoretical advancements than on validating their models with real-world pandemic data.
The COVID-19 pandemic has also prompted extensive research on modeling and forecasting the virus’s spread, taking real-world data and focusing on the effectiveness of NPIs such as lockdowns, mobility restrictions, and quarantine policies. Ndaïrou et al. [22] mathematically modeled the first real-world COVID-19 lockdown in Wuhan, China, while He and Cai [23] assessed the efficacy of quarantine measures in Wuhan, Italy, South Korea, and the United States using a hybrid epidemiological and neural network model, highlighting the importance of early, stringent interventions in curbing the virus’s spread while minimizing societal costs. Shi et al. [24] further investigated the spatiotemporal effects of the Wuhan lockdown on COVID-19 onset risk across Chinese cities. Their extended Weight Kernel Density Estimation model revealed that the lockdown delayed peak risk by 1–2 days and reduced risk values by up to 21.3% in some regions, demonstrating the effectiveness of large-scale mobility restrictions. Likewise, Zhou et al. [25] analyzed the COVID-19 outbreak in Wuhan by applying a SEIR-type model, concluding that the local government implemented effective measures, including lockdown and public awareness campaigns, effectively prevented a more severe outbreak. The impact of lockdowns was also studied by Spelta et al. [26], who used human mobility data to model the virus spread with a metapopulation-type SIR model in Italy. Along the same line, Meyer et al. [27] explored the SIR-based models SIRD, SEIRD, SCAIRD, SCEIRD, and SCEAIRD, demonstrating that they yield similar results. Their study was also able to predict a second wave of the disease, albeit milder than the first. While the aforementioned studies yield satisfactory results when modeling the COVID-19 spread with quarantines, they predominantly deal with the issue from a macro-metric (national/provincial) perspective, including very large cities. In contrast, the approach proposed in this paper is specifically tailored to handle the complexities of influx/outflux of people between satellite cities linked to a medium-sized urban center, particularly where data availability may be very limited.
Focusing on the Brazilian pandemic context as the main goal of the work, Rosario et al. [28] proposed two mathematical SIRS-based variants, applying diffusion and advection equations, to study their equilibrium points in the state of Amapá, Brazil. To validate their results, they took real data provided by local health surveillance authorities. Amaral et al. [29] formulated a hybrid methodology that combines a SIRD-based method with machine learning strategies to fit the transient coefficients of their mathematical model for infections, recoveries, deaths, and reproduction number. In a similar fashion, the same authors, in [30], introduced a data-driven methodology to assess the influence of vaccines administered in Brazil during the second wave of COVID-19, demonstrating that a low/moderate efficacy in the shots can be compensated by immunizing a larger portion of the population more rapidly. Another work that addresses the dynamics of COVID-19 after vaccination was presented by Rychtar et al. [31], where the authors pointed out the importance of not only immunization but also the ongoing NPIs for pandemic control, including the possibility of lockdowns, even among immunized populations. Despite their significant findings, it is important to emphasize that the above-described papers do not account for people’s mobility, restricting their analyses to a national or macro-regional context.
The role of mobility was investigated by Costa et al. [32], where a metapopulation approach taking as input influx data from the examined cities was proposed. In their method, the population was divided into patches, representing geographical regions where each patch has its fixed population that can interact with others. Despite producing feasible outputs, their approach assumes fixed populations for these patches, imposing a uniform behavior between them, thus keeping constant the mobility rates. In [33], the same authors addressed the issue of uniformity in the rates by considering two data modalities: pendular modeling, where individuals travel back and forth in short periods for study or work, and aerial translation; however, the interaction between regions remains on a macro-scale, hindering more local analyses of how an isolated center can influence the small towns around it. In the same vein, Kraemer et al. [34] employed transportation data to explore people’s movements across different geographical areas and their impact on virus dissemination; however, no daily displacement was considered when modeling the problem. Meanwhile, Chagas et al. [35] used Waze’s traffic data to simulate the virus spread in very large metropolises, such as São Paulo and Rio de Janeiro, where extensive datasets such as Waze’s data are available. Ahmad et al. [36] developed a dissemination model that also takes mobility as input, incorporating both locomotion and individual interactions influenced by social classes. Although their approach can map the disease’s evolution efficiently, the authors highlighted the importance of including subpopulations, such as neighboring towns, when simulating local disease peaks, since their model was applied more broadly for highly populated cities on Java Island, Indonesia. Choi and Ahn [37] developed a risk score using mobile roaming data, confirmed cases, and government response indices to predict imported COVID-19 cases in South Korea. Their study demonstrated that a linear regression model incorporating the risk score outperformed traditional statistical models, particularly the Autoregressive Integrated Moving Average (ARIMA) model. Similarly, Zheng et al. [38] explored the influence of human mobility factors on COVID-19 spread in the United States, using a SIRD model that incorporated lockdown and riot data. Their findings emphasized the geographical proximity of outbreaks and the correlation between recreational activities and infection rates during lockdowns.
In addition to mobility- and intervention-driven studies, researchers have developed alternative modeling techniques to predict COVID-19 transmission dynamics. For example, Shen [39] proposed a recursive bifurcation model for early forecasting of virus spread in South Korea and Germany, which outperformed traditional logistic and Richards-type models [40]. Al-Dawsari and Sultan [41] applied inverted exponential regression models to analyze daily COVID-19 cases in Saudi Arabia, incorporating variables such as recovered cases, curfew hours, and environmental factors. Their Bayesian regression approach provided accurate predictions, aiding decision-makers in resource allocation. In a similar vein, Fan et al. [42] introduced a multi-agent simulation model with a small-world network approach to simulate COVID-19 spread in urban settings, showing that early lockdowns could reduce infections by 40.35%. Other agent-based simulation approaches have also been proposed in the COVID-19 literature, such as the work of Silva et al. [43], who used an agent-driven SEIR model to assess pandemic mitigation strategies in Brazil. Another notable method was proposed by Nitzsche and Simm [44], who modified the SEIR model to integrate agent-based data by converting agent states into SEIR states to simulate Germany’s initial pandemic wave. Although our SCIRD framework is a compartment-based model, it shares conceptual similarities with agent-based systems. For instance, lockdown strategies in SCIRD can be interpreted as emergent outcomes of agent-like interactions, where population confinement dynamically influences disease spread.
While most studies concentrate on macro-metric data, including the many country-level studies reviewed above, regional studies have also provided significant insights into the patterns of COVID-19 transmission. In this spirit, Capistran et al. [45] developed a SEIRD-based model to predict hospital demand in Mexican metropolitan areas, incorporating asymptomatic cases, hospital dynamics, and lockdown effects. Their Bayesian framework provided probabilistic forecasts to support healthcare planning. Similarly, Siam et al. [46] presented a data-driven forecasting model to assess the spread of COVID-19 in the cities of Dhaka and Chittagong, Bangladesh, under flexible quarantine conditions. Their findings predicted significant mortality rates, emphasizing the need for balanced public health and economic policies. Krishnamurthy et al. [47] analyzed the transition from subexponential to exponential transmission in the city of Chennai, India, using probabilistic models to assess the risk of secondary infections in public transport systems. Their approach provided critical insights for public health planning.
As pointed out in [6,21,48], the COVID-19 dissemination occurred mainly through transportation networks and flows. These include mobility networks, which formed a rapid pathway for the virus circulation. In Brazil, the disease initially appeared in the two largest cities of the country, São Paulo and Rio de Janeiro, functioning as “dissemination hubs” to other small- and medium-sized urban centers [49]. However, unlike the Brazilian cities with major international airport hubs, here we are interested in analyzing relatively small regions isolated from very large urban conglomerates. Particularly, our focus lies in modeling the dynamics between central medium-sized cities and their neighboring towns, exploring the disease propagation and mobility aspects across these areas. We also aim to assess and understand how measures like lockdowns and reducing long-distance flows can serve as preventive strategies for controlling the virus spread in such regional urban centers. Another concern is that achieving a more realistic mathematical solution may depend on the availability of comprehensive, integrated datasets locally acquired from these specific small and mid-range cities [50], posing a challenge in the Brazilian scenario [30].
Therefore, in this paper, we propose a new SIR-inspired mathematical framework that tackles most of the issues raised above. Specifically, we address the problem by introducing the so-called SCIRD (Susceptible–Confined–Infected–Recovered–Deceased) model, which incorporates the flow of individuals traveling daily between satellite cities and a major urban center, allowing for a more accurate and comprehensive assessment of the disease’s impacts in a challenging context with limited data, including most isolated populations in the interior of Brazil. In contrast to most studies that explore large metropolitan areas like state capitals, our approach focuses on urban centers of intermediary size (e.g., cities until 250,000 inhabitants) that play a pivotal role in shaping the dynamics of their neighborhood towns. Additionally, in our modeling, we calibrate the mobility rates based on data collected on-site from each interconnected town, resulting in a more realistic scenario of the virus’s spread for the region under study. By simulating the effects of lockdown restrictions on both the central city and its surrounding smaller towns, our SCIRD-based approach provides an effective way of understanding and simulating potential quarantines in an isolated regional center. As a result, the mathematical model allows for capturing the spread of the disease in cities with small populations with/without lockdown implementation, where the number of cases may remain limited to dozens or, at most, hundreds amid a context with limited data availability.
As proof of the validity of our framework, we demonstrate its application on the Brazilian regional centers of Presidente Prudente and Araraquara, with the potential for extension to other urban centers of the country. In particular, we show that the results generated by the model are closely aligned with a real case of lockdown that occurred in one of the studied regions.
The main contributions of this paper can be summarized as follows:
  • A new mathematical framework, namely, SCIRD (Susceptible–Confined–Infected–Recovered–Deceased) is proposed to address the dynamics of COVID-19 dissemination in small interconnected urban centers. Unlike most SIR-based proposals that do not simultaneously cope with population flows and lockdowns, our approach gathers both factors into a unified and practical framework.
  • A comprehensive evaluation of the lockdown outcomes, providing a non-intrusive methodology to assess different quarantine schemes in two isolated urban centers. By taking real data from these regions, we determine the minimum duration of lockdowns to consistently reduce cases and deaths. We validate our model using real data from a lockdown case that took place in a Brazilian medium-sized city.
  • The combined analysis of lockdowns and people’s mobility between satellite cities and small/medium-sized urban centers, as opposed to contexts studied in the scientific literature such as large metropolitan areas like state capitals. The calibration of mobility rates is performed from data locally collected from each interconnected city.
  • A mathematical formulation capable of capturing the spread of COVID-19 for the challenging cases where the number of infected remains limited to dozens or, at most, hundreds amid a context of data scarcity.

2. Materials and Methods

2.1. Study Area and Selection Criteria

As mentioned earlier, our goal is to assess the impact of both mobility and lockdown aspects on medium-sized urban centers, including their surrounding (satellites) cities. To perform such an analysis, we first selected the municipality of Presidente Prudente, located in the state of São Paulo, Brazil. This choice took into consideration the total number of smaller towns in the vicinity of this regional urban center and their dependence on it for significant commuting flows related to work and education activities.
Among the key reasons for selecting this urban region, we highlight the following scientific, socioeconomic, and objective criteria:
  • The region is the main urban hub in Northwest São Paulo, Brazil’s leading state, which accounts for 9.2% of the national GDP, ranking it ahead of countries like Poland, Sweden, Norway, Ireland, and Singapore [51,52]. The region is economically significant and acts as a primary transit hub for people.
  • The region is a medium-sized center with high influence on neighboring cities [53]. This setting offers a hard-to-find case of COVID-19 outbreak with a major city and its satellite towns, free from the confounding effects of larger metropolitan zones.
  • Unlike previous works that take the large metropolitan area of Wuhan (China) as a study case, which has 12 million inhabitants, our second study region, the Brazilian city of Araraquara, was chosen because it was the first mid-sized city (with fewer than 300,000 residents) in the world to implement a 10-day-long lockdown [54,55,56,57].
  • There is a gap in the literature regarding studies focused on less populous and non-capital areas [30,50]. Indeed, a search in the Scopus database combining the terms “COVID-19”, “lockdown”, “small cities”, and “epidemiology model” yielded only six papers [44,58,59,60,61,62], none of which focused on modeling COVID-19 spread with short-range transmission between nearby cities like ours. Inspired by works based on global regions [32,33,34,35,36], our micro-regional-based approach can advance the literature, complementing existing macro-analytical studies.
The municipality of Presidente Prudente ( C 1 ) is located in the state of São Paulo, Brazil, and covers an area of 560.64 km2, with an urbanization rate of 97.96% and a population density of 396 hab/km2, along with an estimated population of 225,668 inhabitants [53]. In the urban hierarchy, it is considered a Regional Capital and follows trends of industrialization and urbanization similar to metropolises. As a medium-sized city, it holds a central position in connecting smaller towns to its urban area, standing as the largest city in the region, located approximately 200 km away from another city of similar size [63].
As neighboring satellite cities, five towns were selected sharing a common characteristic: a significant flow of people from each town to the larger city. According to the Brazilian Institute of Geography and Statistics (IBGE) [64], the nearby municipalities of Alfredo Marcondes ( C 2 ), Álvares Machado ( C 3 ), Regente Feijó ( C 4 ), Indiana ( C 5 ), and Anhumas ( C 6 ) are the ones exhibiting the highest flow. This justifies our selection, aiming to incorporate the circulation of individuals from these adjacent cities to the urban center. The locations and commuting indices are shown in Figure 1, based on collected data from IBGE [64,65], where C i represents each city i, i = 1 , , 6 .

2.2. Integrating Mobility and Lockdown Strategies: A SCIRD-Driven Framework

Let N be the size of the total population we intend to mathematically model. The well-known SIR model [66] can be written in terms of the following linear system of Ordinary Differential Equations (ODEs):
d S d t = α S I , d I d t = α S I β I , d R d t = β I ,
where α > 0 accounts for the infection rate and β > 0 represents the removal rate of the infected. Here, S = S ( t ) , I = I ( t ) , and R = R ( t ) give the total of susceptible, infected, and recovered individuals, respectively, as time ( t ) varies, and N = S ( t ) + I ( t ) + R ( t ) .
Figure 2 (left) plots the dynamics of the SIR model as determined by Equation (1) for a given set of parameters α and β . The x-axis stands for the fraction of susceptible individuals S, while the y-axis sets the portion of infected individuals I. The percentage rate of individuals transitioning from infected to removed is given by β I , which corresponds to assuming that the probability density function of the time a person remains infected is β e β t . It is observed that the average infection duration is given by 1 β , which can be seen in Figure 2 (right).
From the SIR-type model (Equation (1)), other compartment-driven approaches can be formulated by incorporating new features such as quarantines and mobility. Particularly, in this paper, we design a SIR-based modeling that unifies mobility and lockdown intervals by accommodating new compartments into Equation (1), leading to the so-called SCIRD framework. These new groups cover the population that succumbs to the disease, denoted here as D ( t ) , as well as individuals who are confined, represented by C ( t ) . Notice that confined individuals are those who stayed home throughout the entire lockdown.
In the proposed SCIRD framework, we keep as constant the population while introducing a small group of infected individuals, with a portion of them choosing to confine themselves during a certain period of quarantine. To properly model the contagion over time, we assume that the individuals are divided into five compartments: susceptible individuals S (those prone to infection due to the absence of preventive measures, such as confinement or lack of immunity, for example), confined individuals C, infected I, recovered R, and deceased D.
Considering S ( t ) , C ( t ) , I ( t ) , R ( t ) , and D ( t ) as the number of individuals in each compartment of the model and introducing a flow of people traveling from their satellite towns to the urban center, we follow [27,67] and take the following assumptions concerning the COVID-19 disease:
  • The increase in the compartment of infected is proportional to the number of infected and susceptible individuals.
  • The rate at which the infected individuals move to the recovered compartment is proportional to the number of infected individuals.
  • The incubation period is short, meaning a susceptible individual who contracts the disease starts transmitting it immediately.
  • After recovering from COVID-19, individuals develop temporary immunity, i.e., they do not become reinfected within a period of less than 4 months [68].
Additionally, mobility is another key factor to take into consideration when modeling virus dissemination [69]. As emphasized in [34], incorporating aggregated mobility data significantly improved the model’s forecasts, a premise that also holds for our epidemic model, enhancing its fit with the provided observations.
The people’s behavior, i.e., how they respond to mobility restrictions, can also influence the disease spread. However, mathematically measuring this behavior is challenging due to human subjective choices, particularly during the COVID-19 outbreak, where responses like adherence to social distancing, mask-wearing, and vaccination vary widely among individuals and regions. One effective way to gauge this is by employing the social isolation rate [70], an official index computed by the São Paulo State Government, used to guide public policies during the pandemic. This index tracks the integrated movement of mobile phones for each state and regional city by using phone locations as mapped by the major telecom operators [70]. During the study period, the isolation index indicated a slight decrease in mobility from pre-pandemic levels in the central city of Presidente Prudente, with fluctuations mostly between 34% and 40%. In the city of Araraquara, the index predominantly ranged between 42% and 51% during the lockdown period, suggesting different responses to mobility restrictions as imposed by the quarantine [70].
Therefore, we mathematically formulate our integrated mobility–quarantine model of COVID-19 dissemination by taking the following system of ODEs:
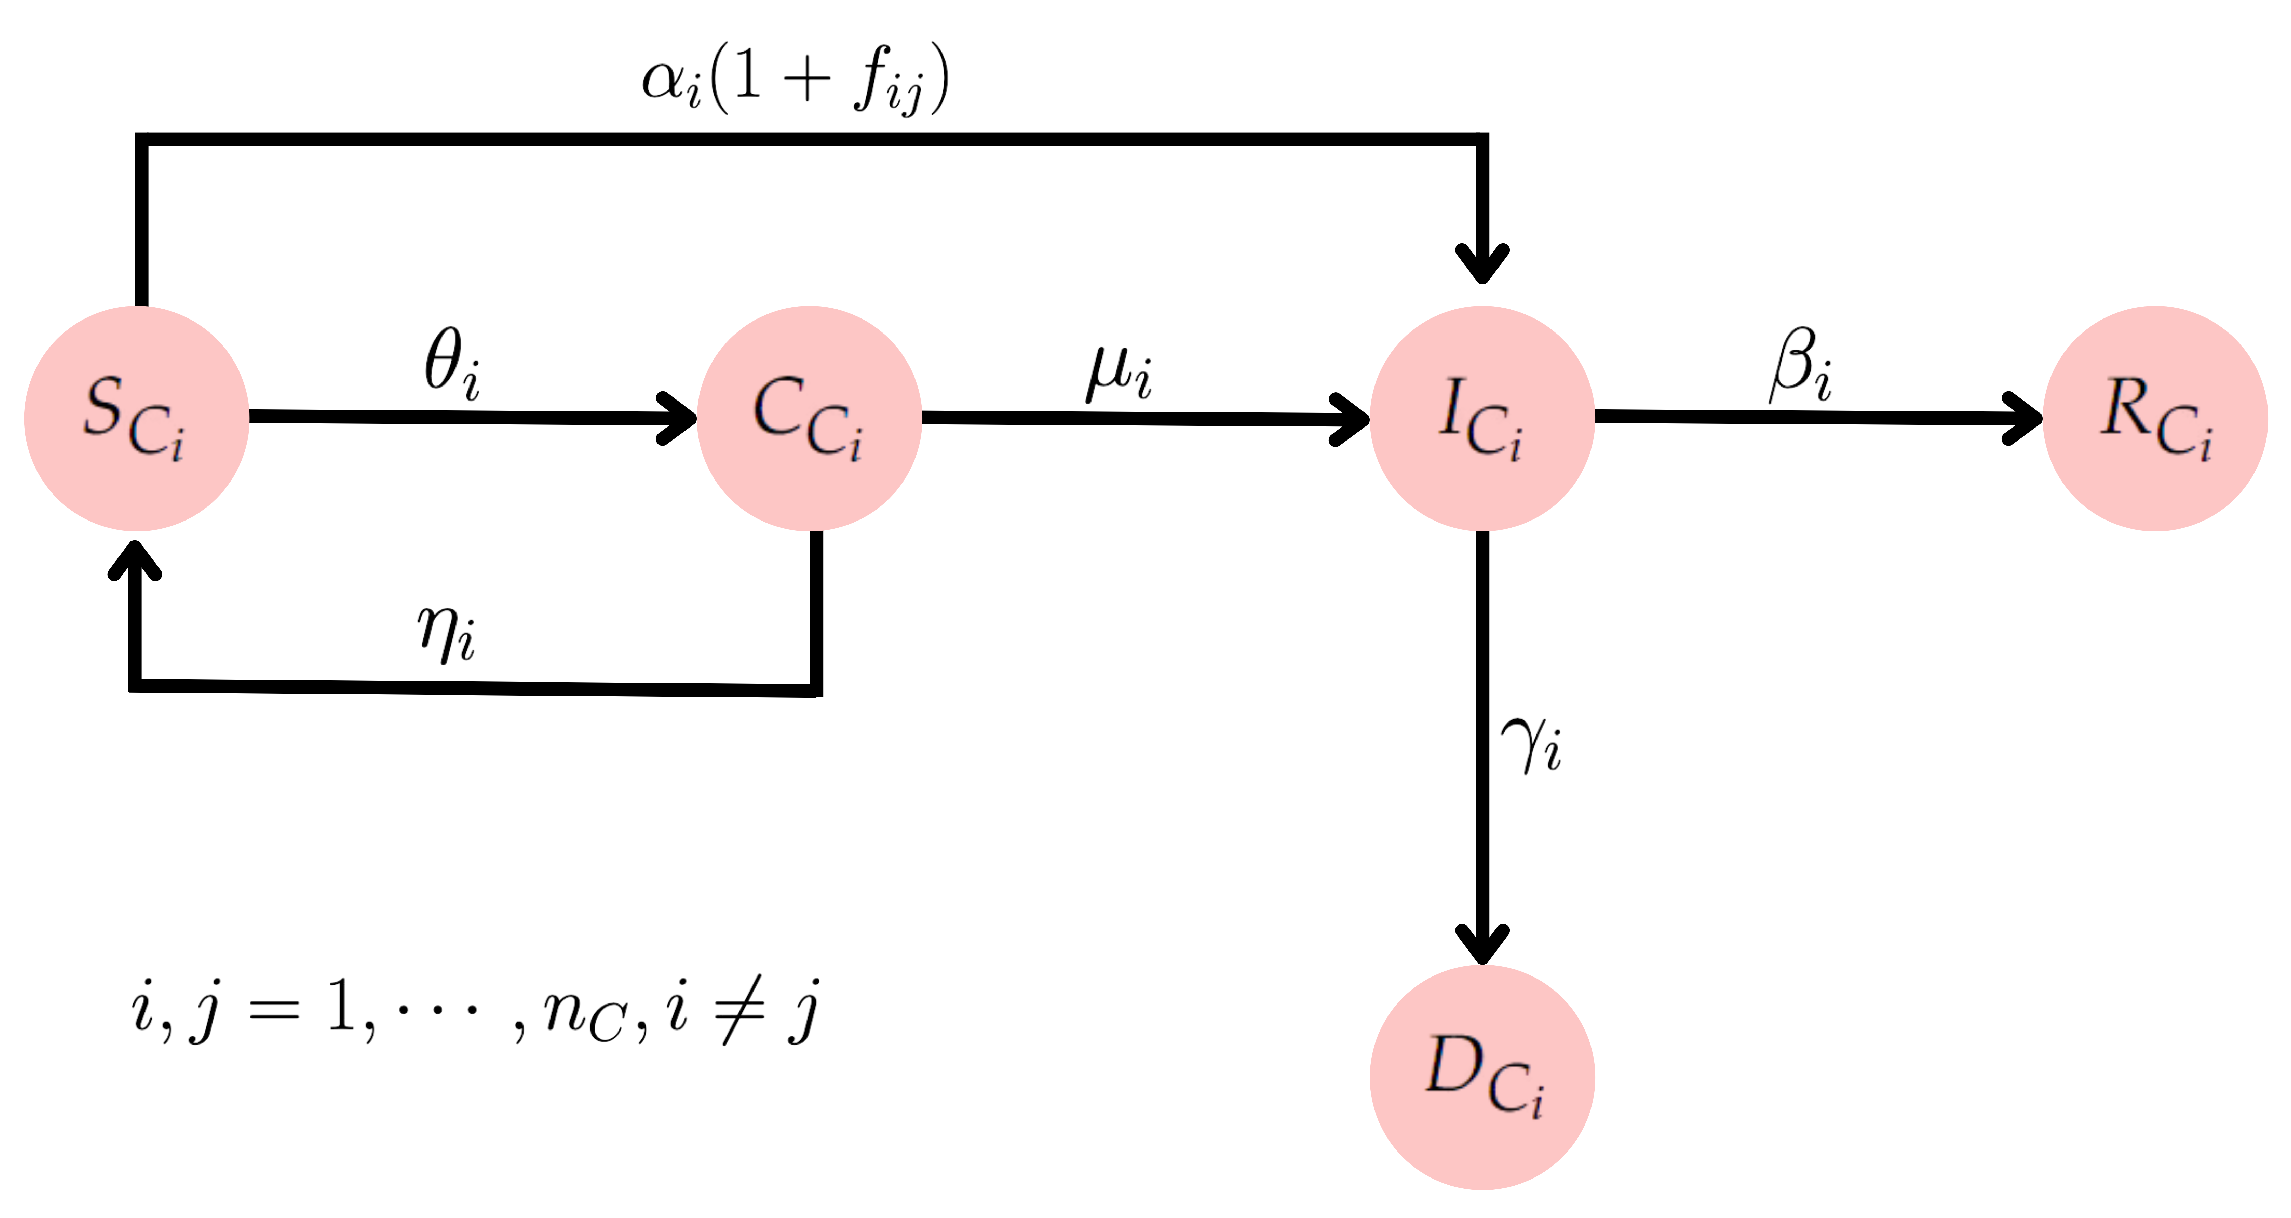
d S C i d t = α i S C i I C i N C i θ i S C i + η i C C i i , j = 1 i j n C f i j S C i α i I C j d C C i d t = θ i S C i μ i C C i I C i η i C C i d I C i d t = α i S C i I C i N C i + μ i C C i I C i β i I C i γ i I C i + i , j = 1 i j n C f i j S C i α i I C j d R C i d t = β i I C i d D C i d t = γ i I C i
where i j i , j = 1 n C f i j S C i α i I C j accounts for the susceptible individuals from city i becoming infected in city j due to the flow between municipalities f i j , thus moving from the susceptible compartment to the infected one. Parameter f i j denotes the percentage of people who commute daily from C i to C j , calculated relative to the population originating from C i . In our approach, these commuters become infected upon contact with an infected individual from C j . Once infected, they return to their home in C i , where they are subsequently accounted for in the model.
A visual schematization of the compartment interactions is illustrated in Figure 3, while the description of the terms present in Equation (2) is summarized in Table 1.
By imposing non-negative solutions for the people compartments S C i , C C i , I C i , R C i , D C i , and providing N C i as the population sizes for each city C i , i = 1 , 2 , , n C , the following expression holds:
N C i = S C i ( t ) + C C i ( t ) + I C i ( t ) + R C i ( t ) + D C i ( t ) ,
where S C i , C C i , I C i , R C i , and D C i are limited by the upper bound of the total population of each city C i . Notice that in Equation (2), we normalize the susceptible group that contracts the infection by N C i to avoid numerical inconsistencies [71].

2.3. Effective Reproduction Number

A pivotal parameter when describing epidemics is the effective reproduction number, denoted as R t ( t ) , which establishes the number of secondary infections produced by an individual infected with the primary infection in a fully susceptible population [30,72]. In the classic SIR model, R t ( t ) is mathematically determined as follows:
R t ( t ) = α ( t ) β S 0 .
In Equation (4), if R t ( t ) > 1 , the epidemic occurs, indicating that each infected individual, on average, is transmitting the disease to more than one other individual. On the other hand, if R t ( t ) < 1 , the disease tends to die out, as each infected person, on average, is infecting fewer than one person.
In our SCIRD modeling, individuals in quarantine still have a chance of getting infected, albeit a low one. Therefore, in the spirit of [73], we can mathematically determine R t ( t ) i for each city i by employing the following expression:
R t ( t ) i = α i ( t ) β i + γ i 1 N C i + i , j = 1 i j n C f i j S C i + α C i ( t ) β i + γ i C C i .
Equation (5) allows us to explicitly compute the effective reproduction number, taking into account both local transmission within the city and infections from other linked cities due to human mobility, thus providing a powerful mathematical tool to measure the intensity and trend of the infection curves in interconnected urban epidemiology.

2.4. Data Sources and Parameter Calibration

In order to obtain real COVID-19 data, which include an appropriate set of parameters to run our mathematical framework, we collected data from three public Brazilian repositories, generating an integrated database. Below, we describe the datasets employed in our assessments and simulations.
  • São Paulo State Data Analysis Website (SEADE government foundation) [74]: Time-series of confirmed cases and deaths for all cities in the study area (Figure 1) were acquired from the official data repository of São Paulo State government. For a technical note regarding data collection, aggregation, and processing, refer to [75], which includes the public GitHub repository maintained by the government agency.
  • SP COVID-19 Info Tracker Platform [30]: Active cases and recoveries were downloaded from the Info Tracker platform, an open data-driven tool available for public authorities, society, and press agencies. More precisely, the number of recovered individuals at time t is estimated by assuming an average recovery time of T a = 21 days [76], i.e., subtracting the total number of deaths from the number of cases T a days ago, while the number of active cases (infected) at time t is obtained by subtracting the total number of deaths and recoveries from the total number of cases at time t [77].
  • Brazilian Institute of Geography and Statistics (IBGE) [64]: Mobility rates related to the work and study activities for each satellite city and the target urban center. To explicitly determine the population mobility between cities, the urban displacement as originally measured and provided by the Brazilian Institute of Geography and Statistics (IBGE) [64,78] is employed. More specifically, the flow rate of people traveling daily from city i to j is computed as follows:
    f i j = P i j × 100 N C i ,
    where P i j represents the number of people moving from cities i to j, and N C i accounts for the total population of the origin municipality i [64].
In addition to obtaining specific pandemic data from the above-indicated repositories, we took basic parameters from the specialized literature [27], while others were manually calibrated to ensure consistency with the reality of the pandemic in the studied region. These parameters can be consulted in Appendix A, along with the data source and the calibration methodology used.

2.5. Numerical Solution and Computational Aspects

Once we have defined the parameters associated with each city C i , including the daily transit of people between their home and work/school as taken from the Brazilian Institute of Geography and Statistics (IBGE) [64], we solve Equation (2) in a numerical fashion.
In order to obtain a valid discrete solution, we run the well-established solver Livermore Solver of Ordinary Differential Equations with Automatic Method Switching (LSDOA) [79], which is implemented in the Python library scipy and employs robust numerical methods like Adams [80] and the Backward Differentiation Formula (BDF) [81].
Aiming at coding and executing our computational prototype of the SCIRD model, we took the Google Colaboratory platform, a cloud-based service that allows users to program in Python directly within their browser. This platform provides access to a wide range of libraries and tools without requiring installation. Additionally, we took the PyCharm IDE [82] to design our experiments and solution approach. Lastly, to perform simulations and create graphical visualizations, we employed the Pandas [83] and Matplotlib [84] Python libraries.

2.6. Evaluation Metrics

To quantitatively assess the accuracy of the epidemiological models, we computed three popular evaluation metrics: Mean Absolute Percentage Error (MAPE) [85], Normalized Root Mean Square Error (NRMSE) [30], and the Coefficient of Determination ( R 2 ) [86], which are mathematically calculated as follows:
( 1 ) M A P E = 1 n i = 1 n Y i Y ^ i Y i × 100 ,
where Y i and Y ^ i denote the reference and predicted values. MAPE is a widely used metric for evaluating prediction accuracy by measuring the average percentage difference between predicted and actual values. It is particularly useful in forecasting models, providing an intuitive sense of error magnitude relative to observed values.
( 2 ) N R M S E = 1 n i = 1 n ( Y i Y ^ i ) 2 Y ¯ ,
where Y ¯ stands for the mean of the n reference values. NRMSE normalizes the mean squared error by the mean of the actual values, enabling more balanced comparisons between different datasets.
( 3 ) R 2 = 1 i = 1 n ( Y i Y ^ i ) 2 i = 1 n ( Y i Y ¯ ) 2 ,
The R 2 score evaluates how well the predictions explain the variability of the actual values, ranging from 0 to 1 for a perfect fit [86], while negative values indicate that the model performs worse than simply using the mean of the actual values as a prediction.

3. Results and Validation

In this section, we present the results obtained by our SCIRD-based framework when applied to model the spread of COVID-19 in the selected medium-sized urban conglomerates under different lockdown scenarios. The assessments conducted include several simulated scenarios involving people’s mobility and lockdown implementation as a preventive measure. The feasibility and accuracy of our SCIRD-based model are also validated by modeling a real case of a lockdown that occurred in a Brazilian medium-sized city during February 2021 [55,56].

3.1. Sensitivity Analysis

Aiming at investigating the model’s sensitivity with regard to the disease transmission rate, we follow [87,88] and take different values for α while examining the infected curves and the reproduction number, R t . Figure 4 shows the generated curves for the six studied cities, where the magenta dashed curve corresponds to the higher transmission rate and the cyan one to the lower rate. Notice that the model is sensitive to changes in the transmission rate, a crucial parameter. For the central city, C 1 , the R t begins at 2.06 and then decreases to 0.84 when α = 0.18 × 10 3 . Such a variation in R t aligns with [89], where the authors assessed the sensitivity of the reproductive number for COVID-19, analyzing how minor changes in transmission-related parameters can significantly influence case projections and public health strategies. This underscores the importance of small behavioral changes, such as mask-wearing, social distancing, and lockdowns, which can affect case numbers [90].

3.2. Assessing Quarantine Scenarios in Medium-Sized Urban Centers

To evaluate the impact of COVID-19 in the first selected non-metropolitan urban area and its neighboring satellite cities, we run our methodology, taking data samples from 20 May 2020 to 19 September 2020, totaling four months of the pandemic. Different periods of confinement were also adopted in our simulations, as well as distinct parameters settings.
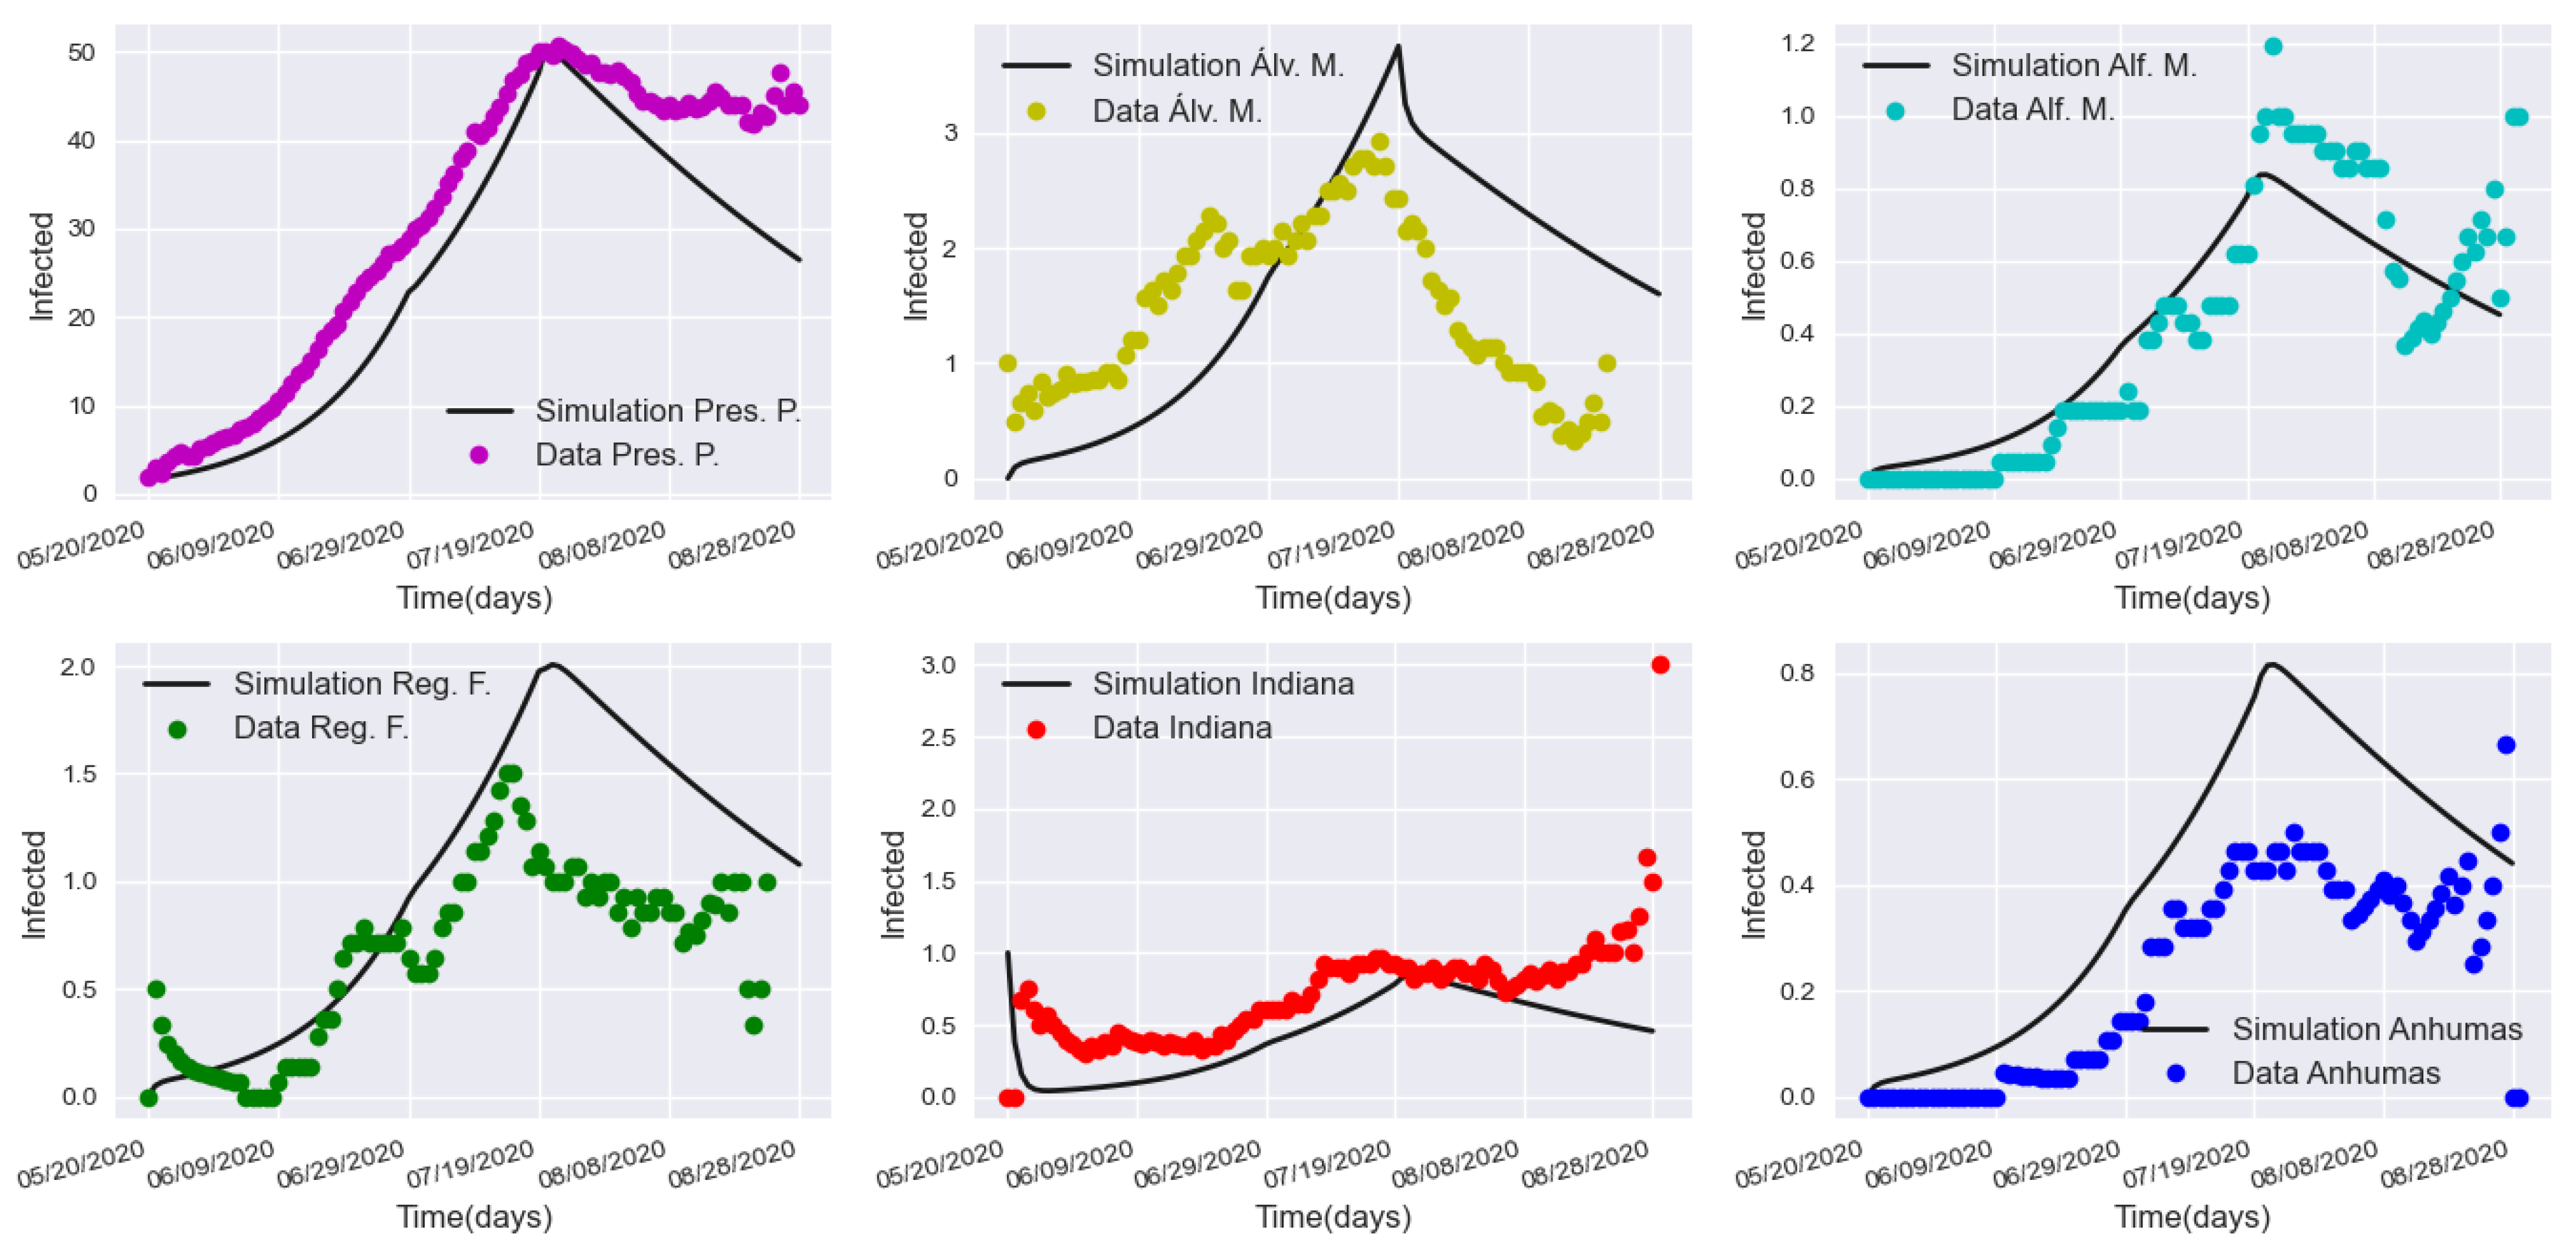
We first simulated the cases of infected individuals without including any lockdown measures in order to calibrate our parameters using the data. Specifically, the compartment for confined individuals was set to zero until the curves of new daily cases and accumulated deaths aligned as closely as possible with the real data collected for each city studied. This step involved directly comparing the raw data with the corresponding curves generated by the model, as shown in Figure 5 and Figure 6. Following this, the infection and mortality rates were estimated based on the obtained epidemic curves.
It is worth noting that the cities of Anhumas and Indiana, as illustrated in Figure 6, did not report any deaths during the study period, resulting in their curves remaining at zero. As can be visually verified from most of the plots, the simulated outputs are qualitatively close to the moving average of the cases and deaths, allowing us to perform a more realistic, fully data-driven parameter calibration.
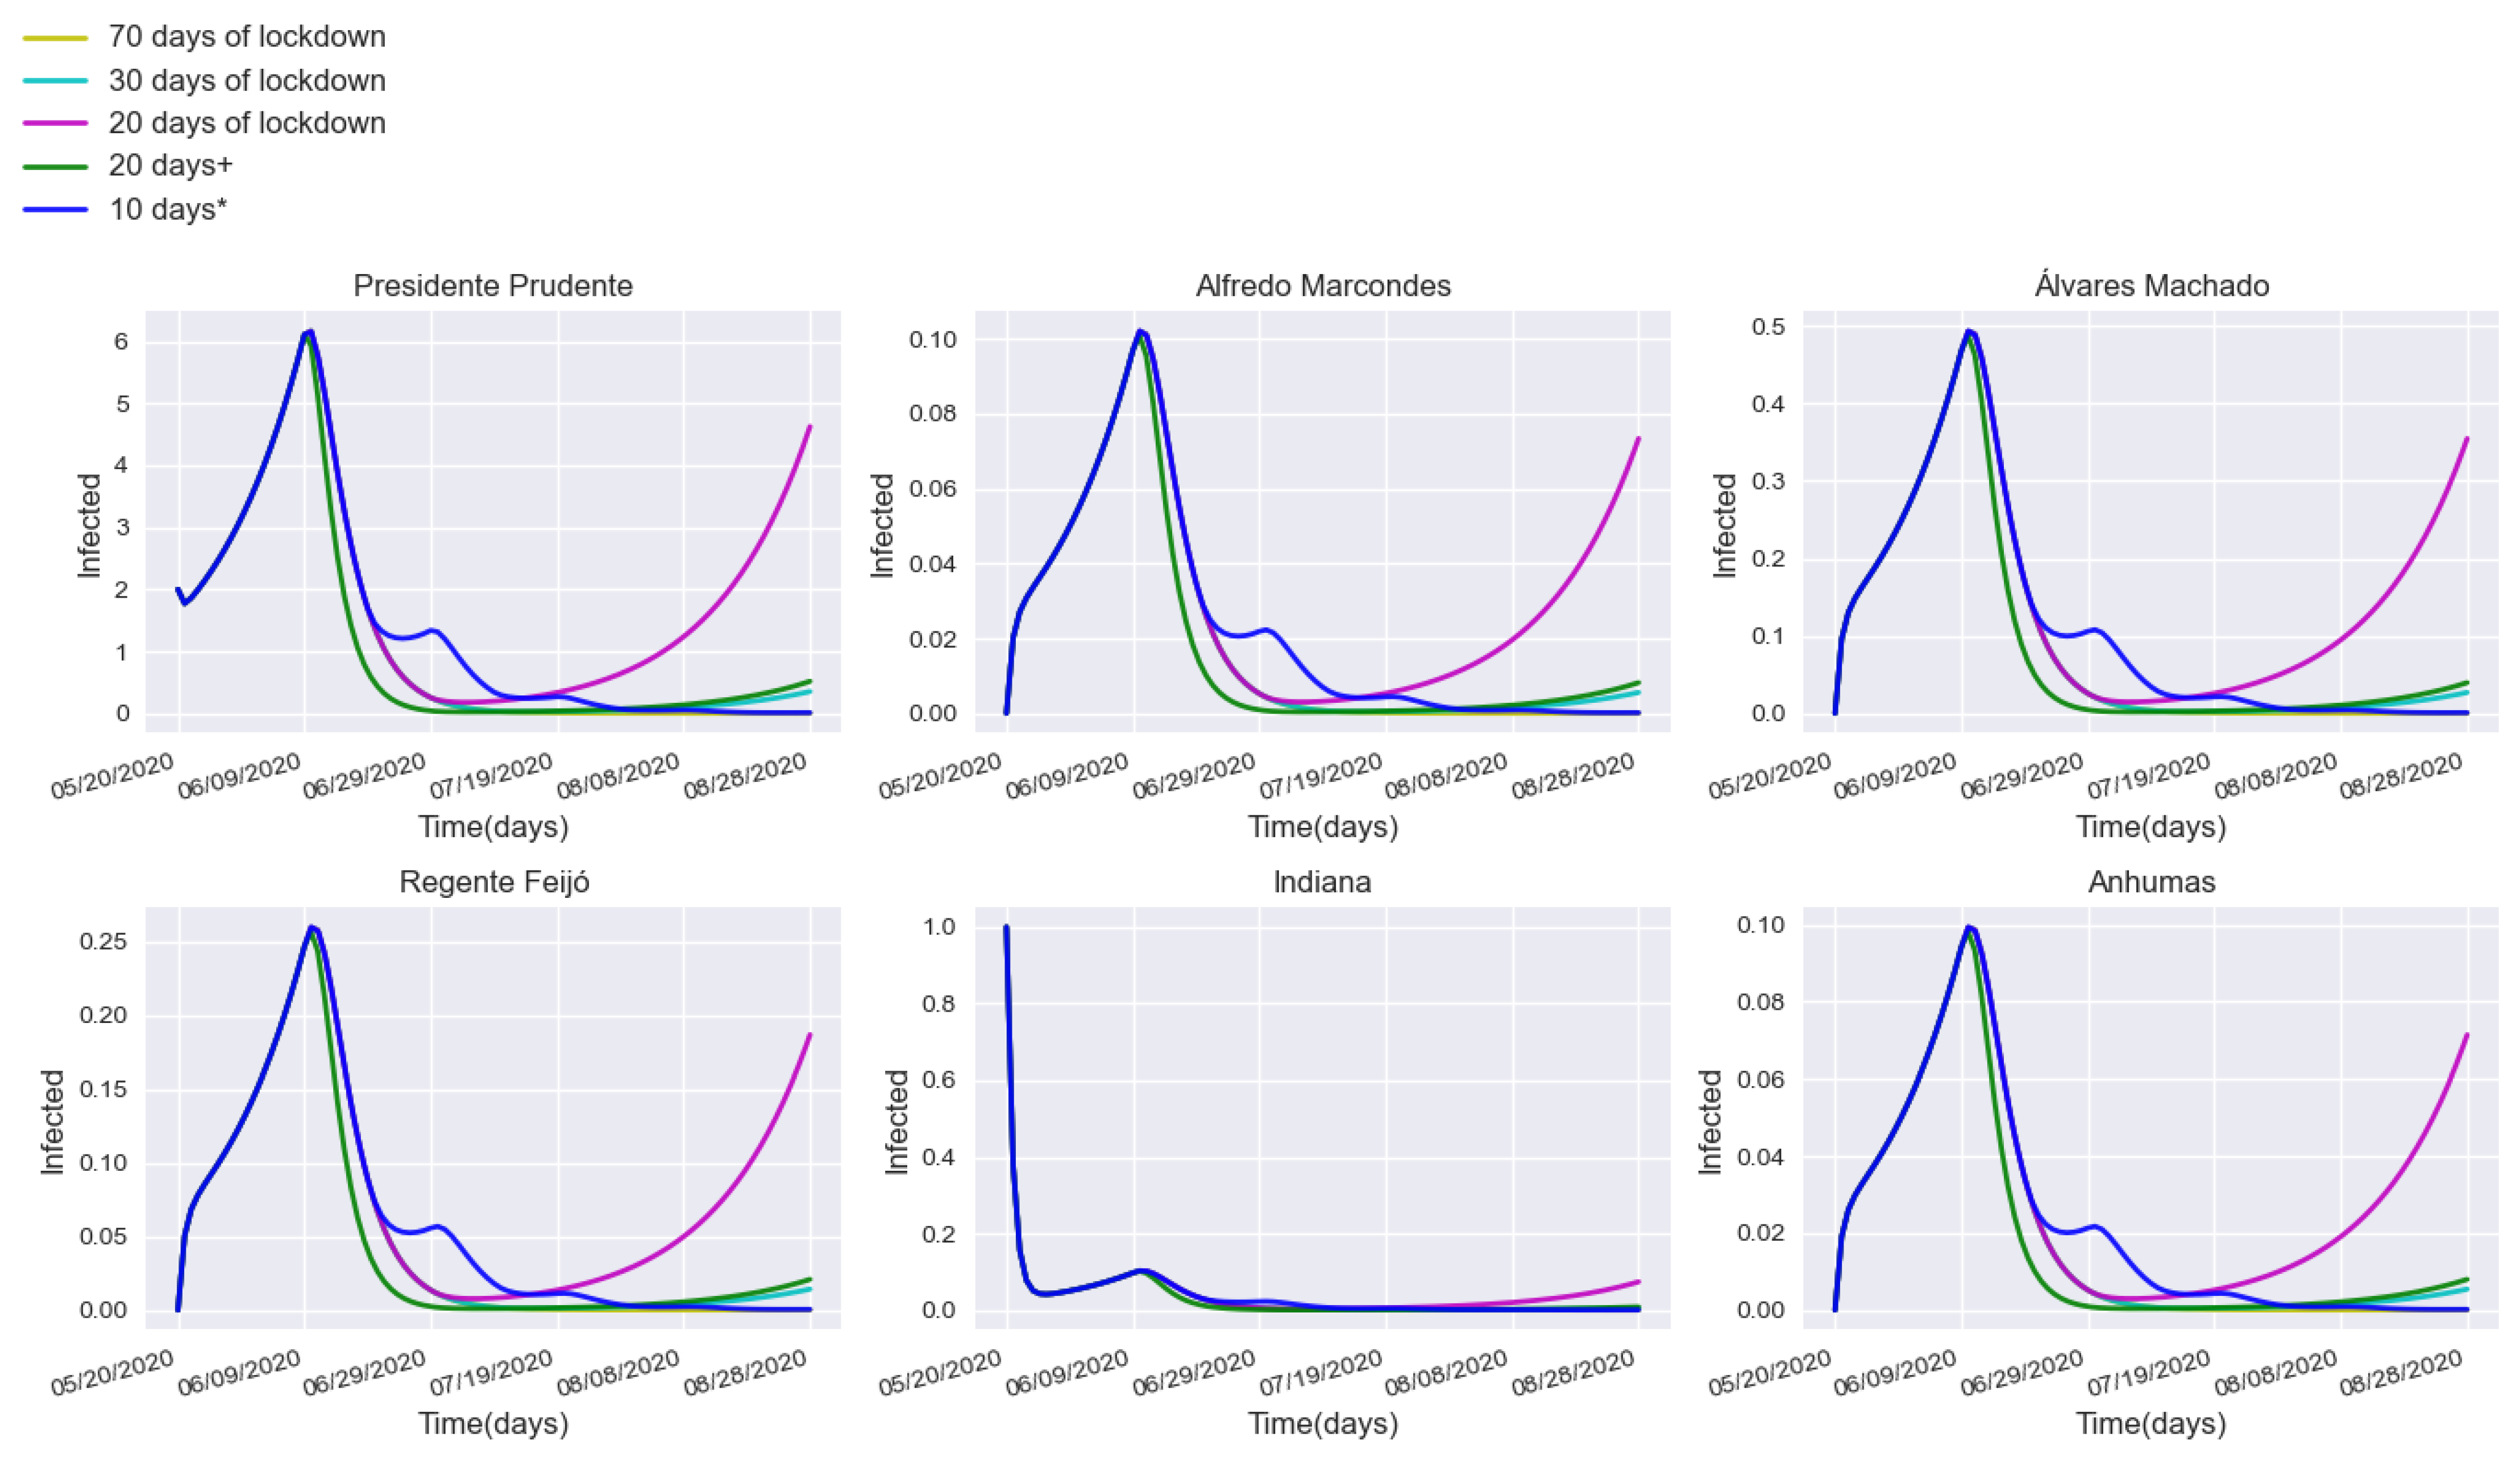
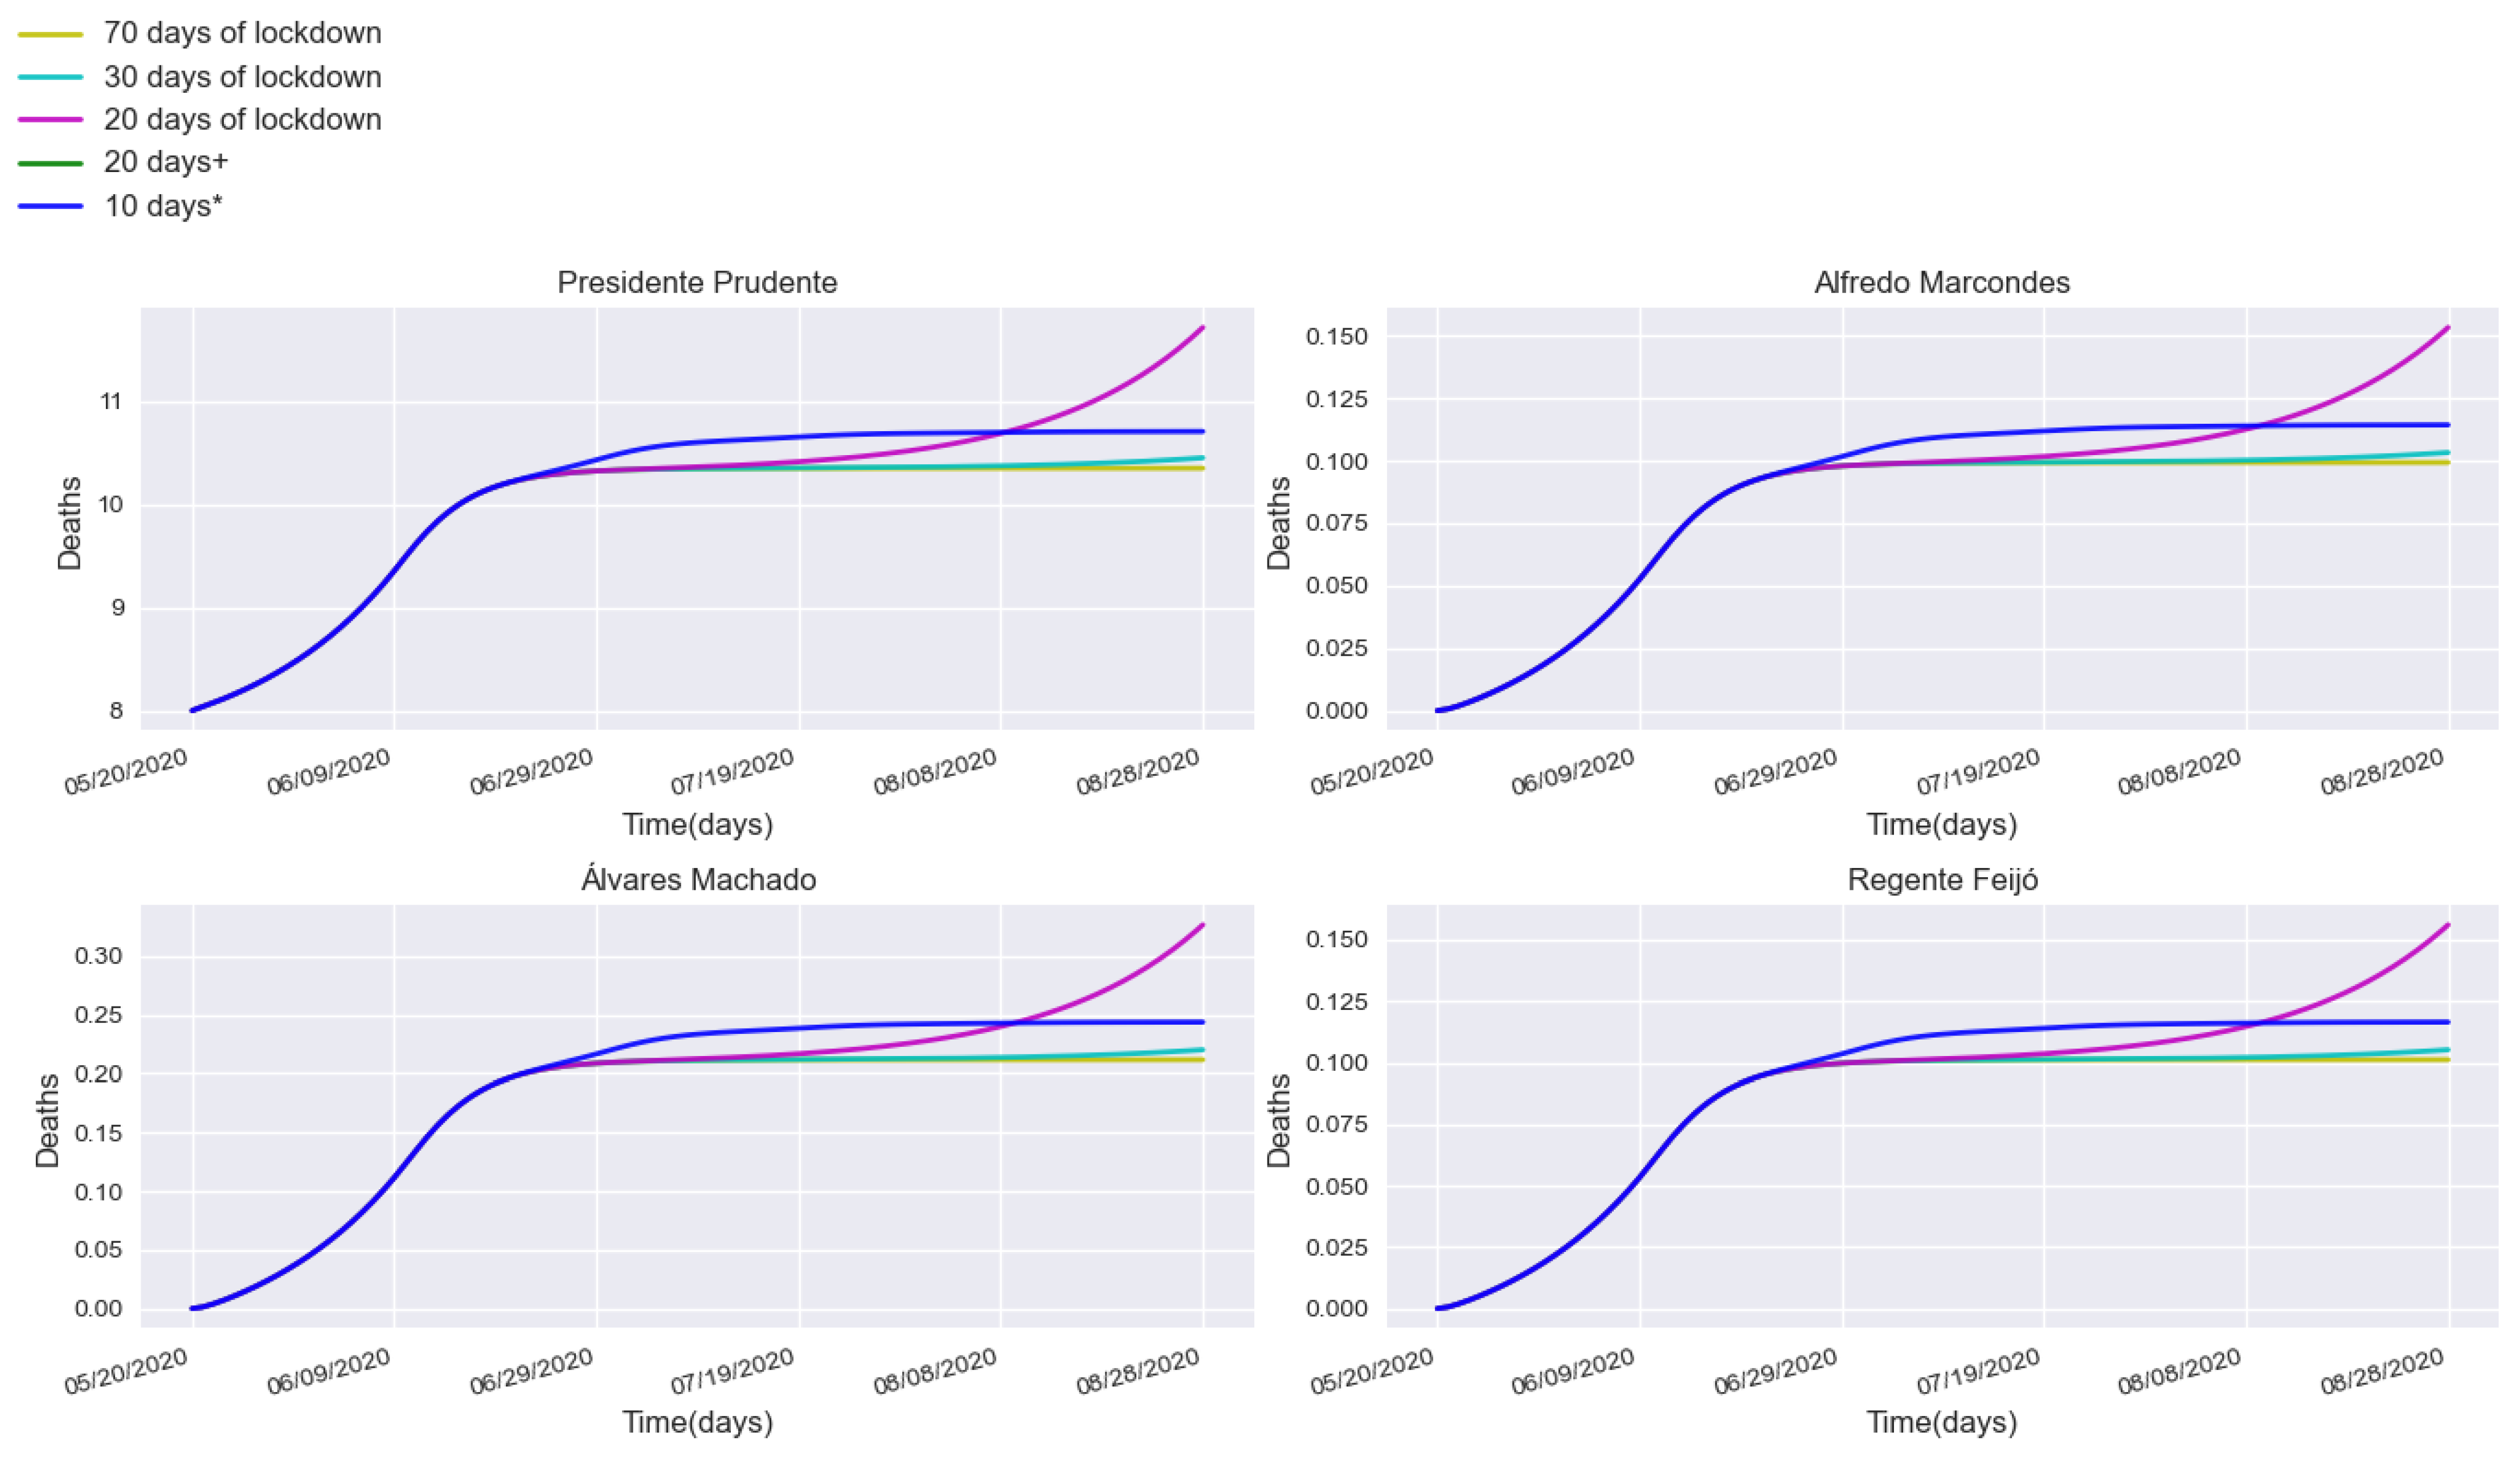
In the first study scenario, we carried out several simulations with different blocking intervals, 70, 30, and 20 days, quarantining a portion of 100,000 individuals in the central city. The choice for the number of people in quarantine was guided by a real lockdown implemented in the Brazilian city of Araraquara [70], a medium-sized city comparable in population size to the primary area under study. Additionally, we simulated a 20-day interval with a higher confinement rate, i.e., we confined around 125,000 individuals, referred to as 20 days+. Note that in this first battery of experiments, confinement was applied specifically to the central city of Presidente Prudente.
Figure 7 shows comparisons of various blocking regimens. As can be seen, after the 20-day lockdown, cases start to rise rapidly; however, when a quarantine strategy with a higher confinement rate is implemented, the curve takes longer to increase again, decreasing quickly. Furthermore, 20-day confinements with higher confinement rates and 30-day lockdowns closely resemble the 70-day curve, which is a prolonged period, potentially impacting the country’s economy negatively [4].
These simulations demonstrate that initially, new infection rates rise; however, with the introduction of lockdown measures, there is a notable reduction in new cases across all analyzed cities. Another observed trend is that after the quarantine period ends, infection curves begin to rise again for shorter lockdown durations.
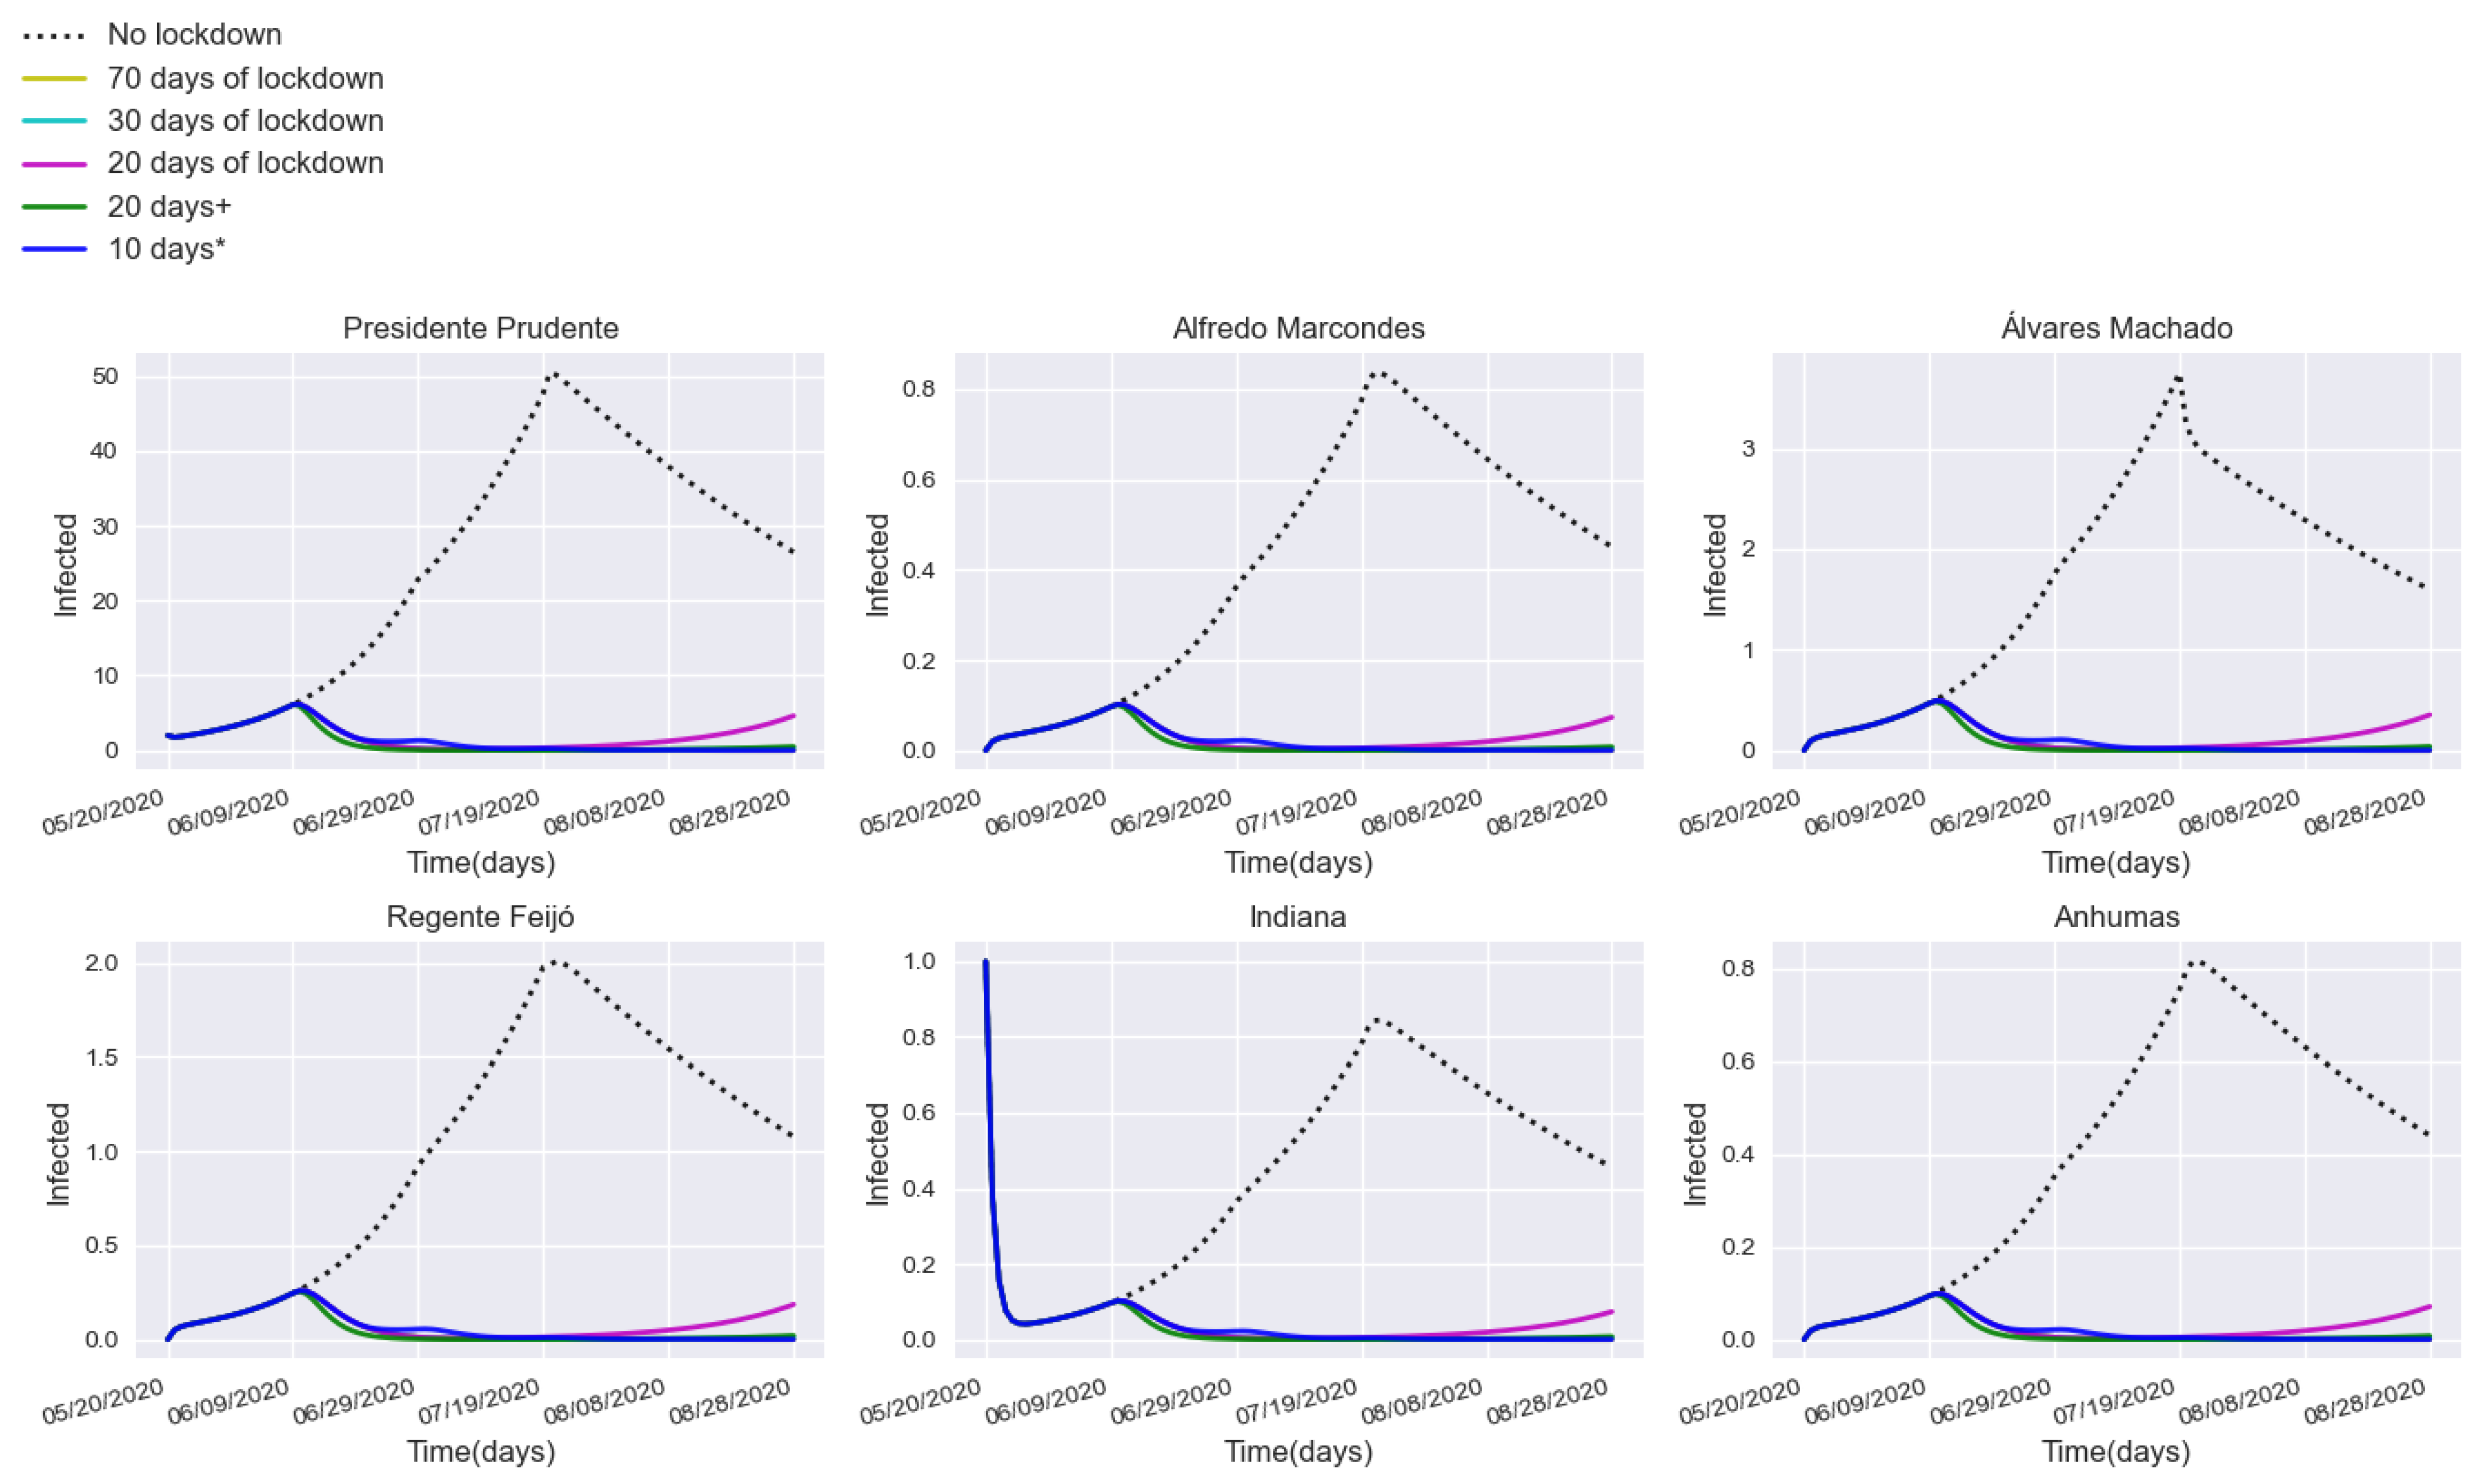
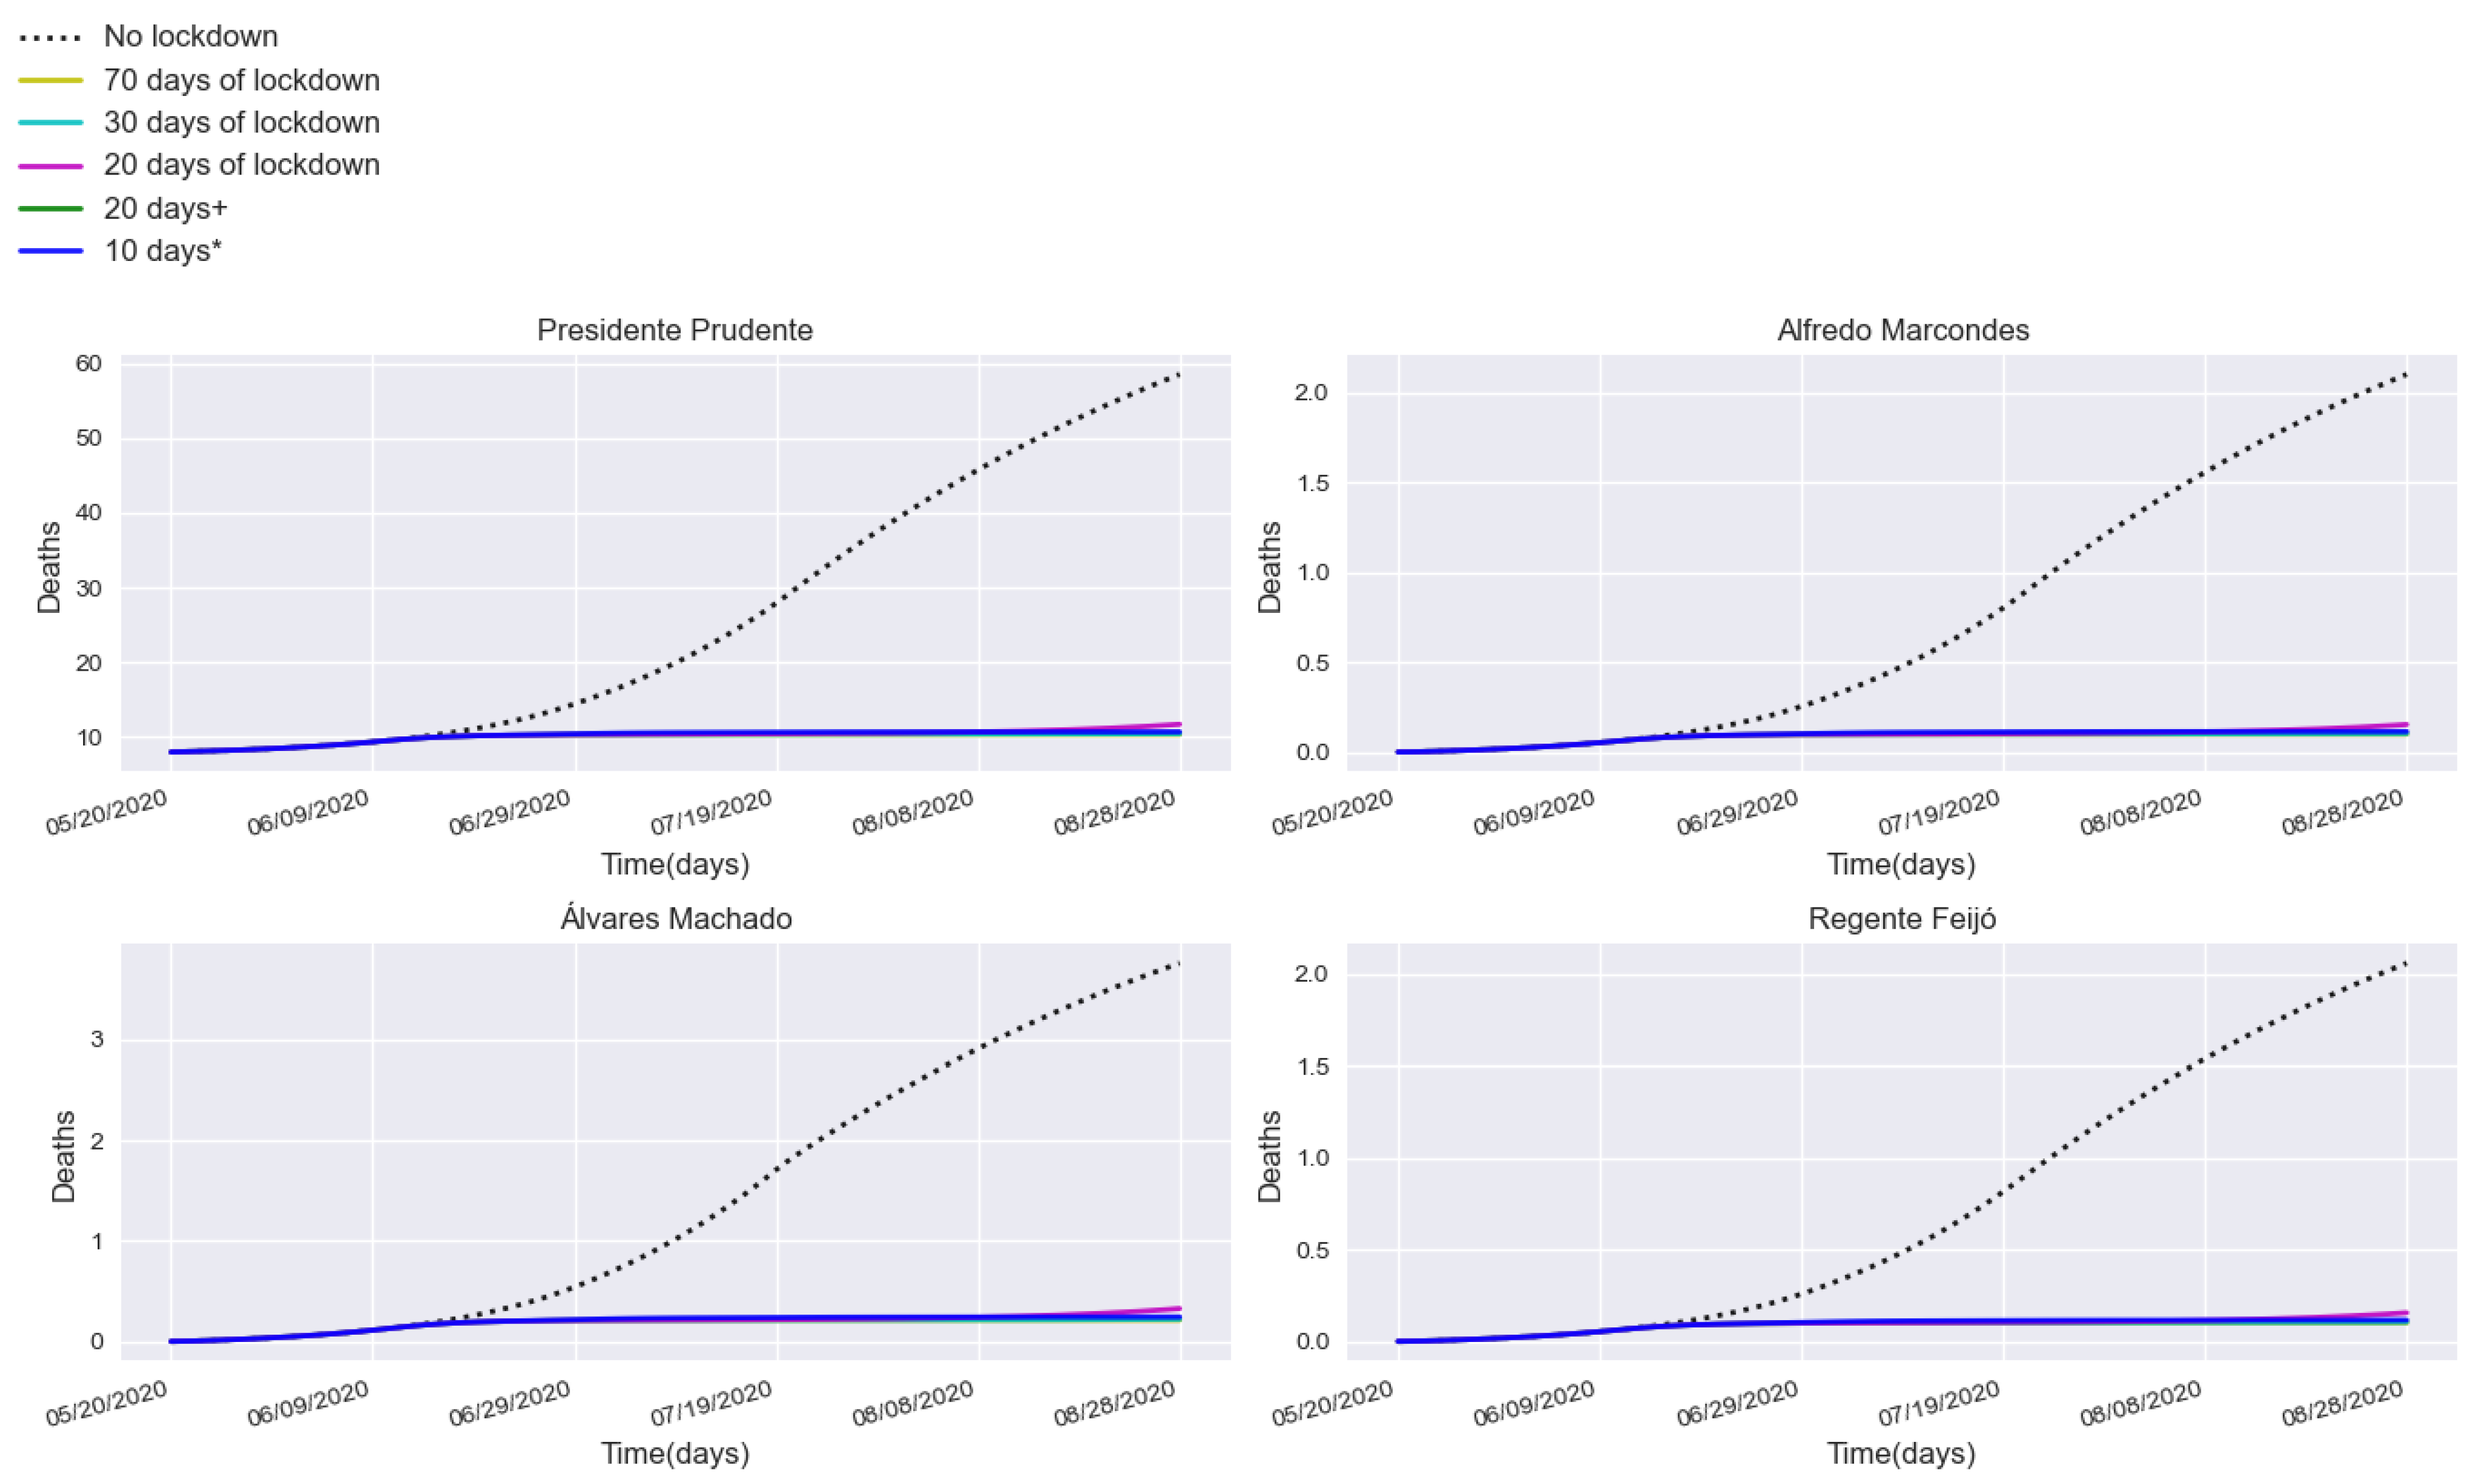
Figure 8 shows the comparisons of the infected curves when our model is applied with and without an intervention measure (lockdown). From the plotted results, one can verify that all confinement regimens highly contributed to reducing the number of contagious with COVID-19 in all investigated cities. Moreover, it can be observed that no matter how short the confinement duration is, it plays a crucial role in mitigating the number of infected, especially in the hub city.
As previously discussed, the implementation of quarantines can significantly reduce the number of new COVID-19 cases, hence flatting the curve of accumulated deaths, as shown in Figure 9. Notice that no simulations were conducted for the satellite cities of Indiana and Anhumas, as they did not report any deaths during this specific range of the pandemic. As observed, the fatality curve remains consistently flattened after 15 days for most quarantine periods except for the 20-day regimen, which begins to grow again after three months. However, comparisons without implementing lockdown, as depicted in Figure 10, reveal that even a shorter confinement period can prevent an explosion of deaths. It is important to highlight that an intermittent quarantine regimen has proven to be effective in halting the transmission of the disease (see the blue curve in Figure 9). This represents a viable alternative that strikes a balance between economic openness and partial confinements.
Table 2 and Table 3 gather the total weekly cases and accumulated deaths from the six studied cities combined. The shorter 20-day lockdown reduced both infections and COVID-19 deaths, whereas longer periods did not lead to a proportionate decrease, indicating that excessively long quarantines may not be necessary. Furthermore, intermittent quarantines (10 days *) have delivered a workable strategy for controlling virus spread, resulting in a drastic reduction in cases and deaths by the fourth week compared to the absence of lockdown. The 70-, 30-, and 20-day quarantine regimens also yielded comparable results in terms of cases and deaths.

3.3. Validation with a Real Lockdown in a Medium-Sized Urban Center

According to Varela [91], one effective method to simplify analyses related to the COVID-19 pandemic is to compare the impact of lockdown between urban regions with similar populations and demographic characteristics. Taking such a premise into consideration, we assessed whether the proposed SCIRD approach reflects reality well by applying it to real data collected from a regional center that implemented a lockdown during a short pandemic period. In addition, we compared the SCIRD model with the traditional SIR model, using the same dataset from the selected city to assess whether our model provides a better fit. For this validation, we selected the municipality of Araraquara, located in the state of São Paulo, Brazil.
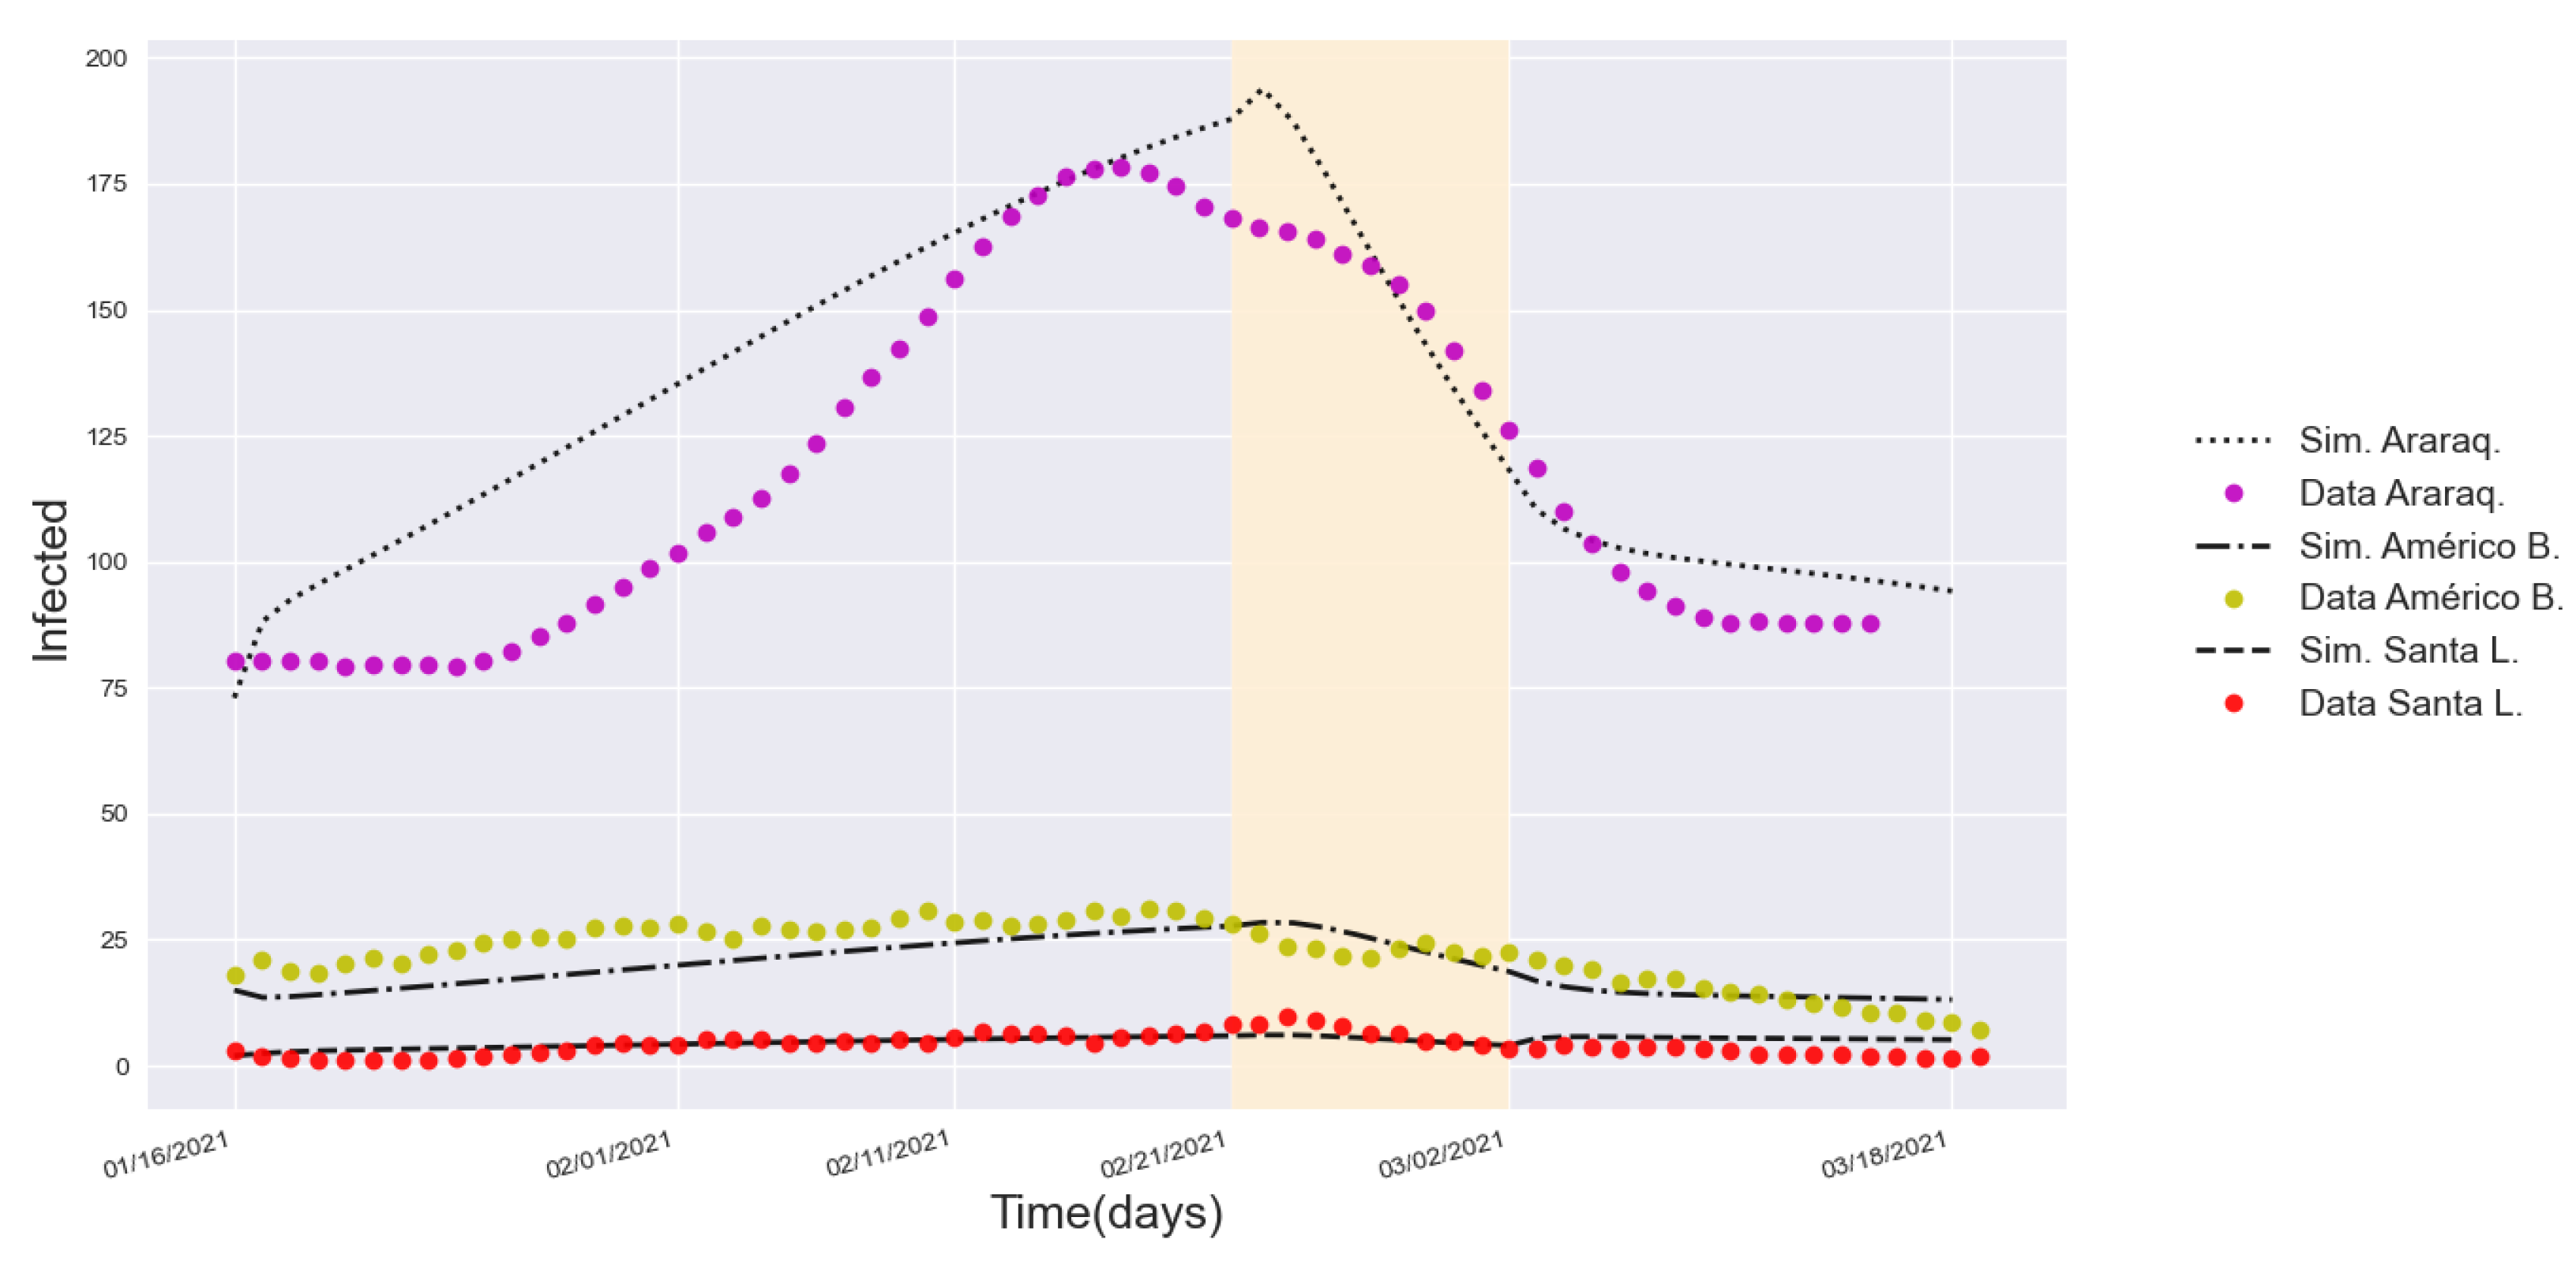
In late December 2020, the Brazilian city of Araraquara experienced a record number of new daily COVID-19 cases, which continued to increase uncontrollably, resulting in a significant rise in new deaths [55,57]. With the healthcare system nearing collapse within weeks, the municipality implemented a ten-day continuous confinement from 21 February to 2 March 2021, becoming the first Brazilian city with over 100,000 inhabitants to declare a continuous lockdown state [54]. Therefore, in order to experimentally validate the fitting level and robustness of our SCIRD-based approach, we accessed the data collection as previously described in Section 2.4 for the hub city of Araraquara as well as the satellite towns of Américo Brasiliense and Santa Lúcia.
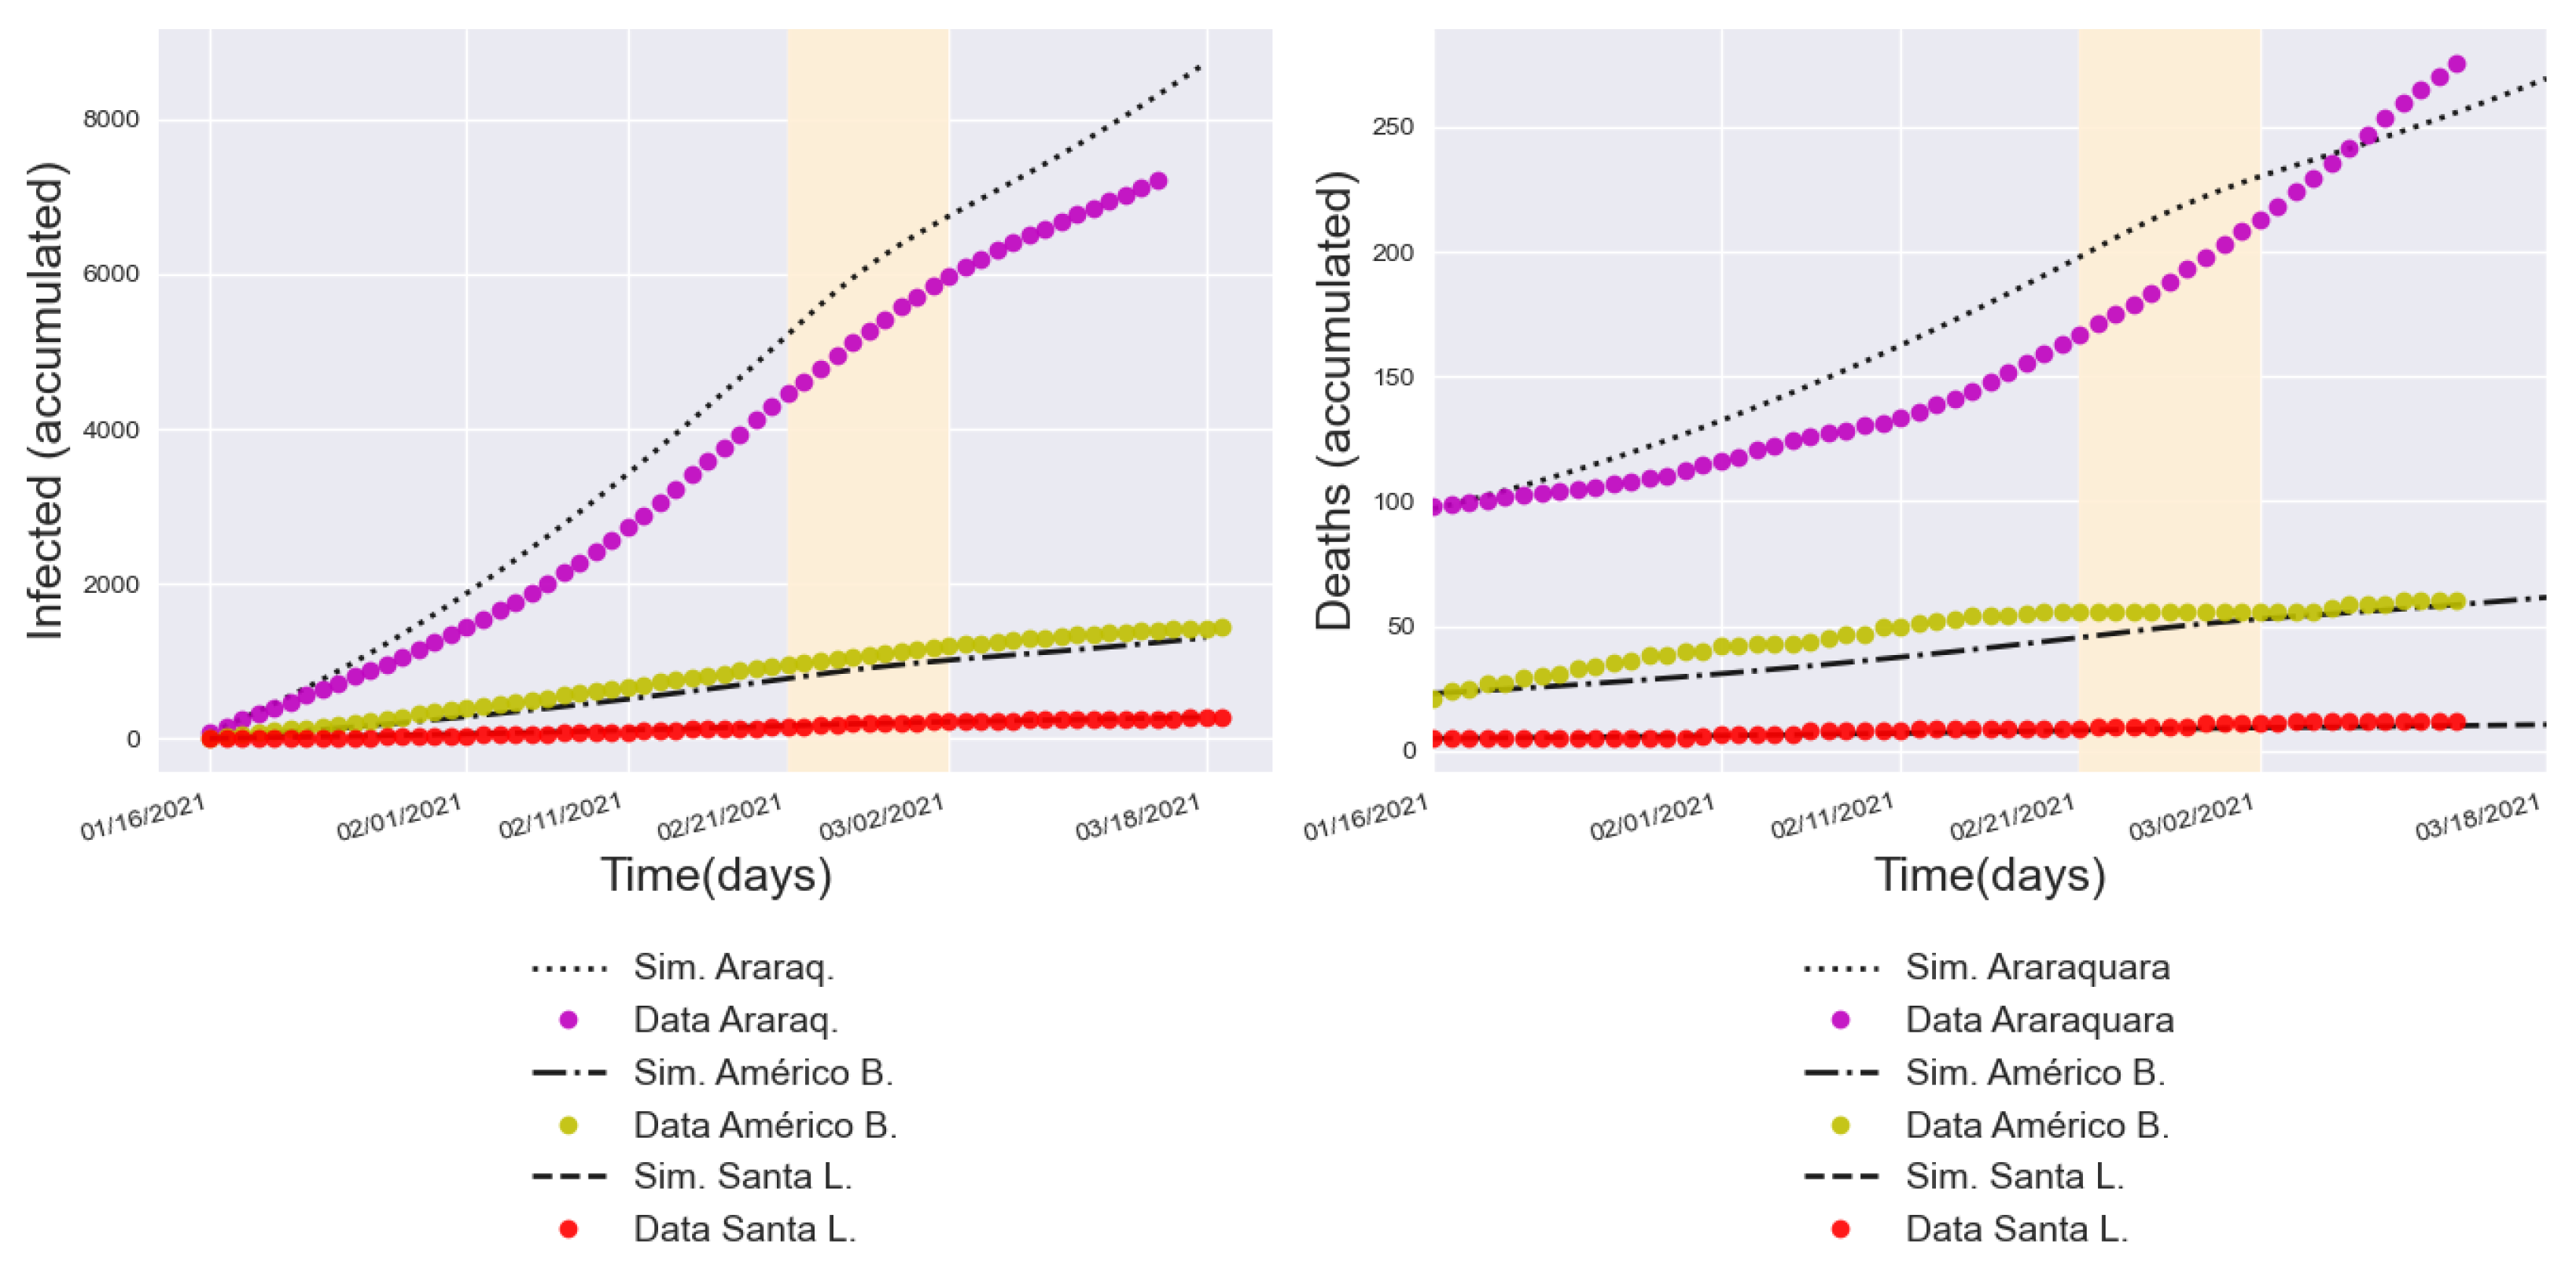
Figure 11 shows the daily infection curves, while Figure 12 displays the accumulated cases and deaths during the period when a full lockdown was implemented in Araraquara. The curves generated by our SCIRD model accurately fit those representing the real data for all examined municipalities, reflecting the trends of increase, stabilization, and decrease, as displayed in Figure 11. Furthermore, the decline that occurred during the 10 days of lockdown was also satisfactorily captured by our approach, regardless of the population size of each city.
It is worth highlighting that the lockdown implemented in the city of Araraquara, even for a full 10-day period, significantly contributed to controlling the critical situation of the COVID-19 case explosion within this urban population, including the satellite towns. Indeed, the role of lockdown was also confirmed in other related studies [54,91], which conducted comparative analyses between the Brazilian cities of Araraquara and São Carlos. These municipalities, initially sharing similar disease dynamics, experienced divergent pandemic situations, with a substantial decline in cases observed in Araraquara after the lockdown, while São Carlos continued to experience higher case numbers and deaths [54,91].
Table 4 summarizes the MAPE and NRMSE scores for each city in the urban conglomerate of Araraquara during the 10-day period of strict lockdown (21 February 2021, to 2 March 2021) and the subsequent 10 days after confinement (3 March 2021, to 13 March 2021). From the tabulated results, one can observe that the MAPE and NRMSE scores for Araraquara during and after the lockdown indicate high accuracy in fitting both infected and deaths, with the lowest and highest MAPE reaching around 3% and 13%, respectively. The evaluation metrics for Américo Brasiliense and Santa Lúcia during both periods suggest very low errors for infections, averaging around 3% in most measurements. The only exception was the MAPE of Américo Brasiliense (18%). Regarding deaths, both MAPE and NRMSE achieved values slightly above 10% and 1.0 during the lockdown period but dropped drastically to around 3% and 0.3 in the subsequent period. In contrast, Table 5 presents the corresponding metrics for the popular SIR baseline model, which demonstrates a suboptimal fit. During the lockdown period, the SIR model shows notably higher errors: for Araraquara City, the MAPE for infections is 19.23%, compared to 11.44% for our SCIRD approach, while for accumulated cases, it reaches 26.87% against 11.03% for SCIRD. The NRMSE values further highlight the constraints of the SIR model, with values of 0.208 for infections and 1.372 for accumulated cases, compared to 0.197 and 0.467 for SCIRD. After the lockdown, in Araraquara, the MAPE for infections rises to 61.24% for the SIR model, while for accumulated cases, it remains high at 18.13%, compared to 11.96% and 10.79% for the SCIRD model. Similar trends are observed in other municipalities, further highlighting the SIR model’s limitations in capturing post-lockdown dynamics.
Figure 13 and Figure 14 present the Q-Q (quantile–quantile) plots for infected and deaths obtained by the SCIRD model in each city C i within the urban conglomerate of Araraquara. As these plots exhibit distributions closely following the reference line (in red), they indicate a strong statistical fit to the theoretical (expected) distribution. The coefficient of determination, R 2 , further emphasized the accuracy of these fits, ranging between 0.92 and 0.95 across all analyzed cases. As a consequence, the high R 2 scores denote robust linear relationships between observed and expected values, validating our SCIRD model’s accuracy in capturing the dynamics of COVID-19 cases across the cities during and after the strict lockdown period.

4. Findings, Scope, and Limitations

The results presented in Section 3 attest to the effectiveness of our SCIRD model, a compartment-based framework designed to mathematically model and assess the impact of non-pharmacological interventions on COVID-19 in smaller interurban centers.
By evaluating and simulating the virus spread in two distinct Brazilian urban regions as case studies, the current model was capable of effectively capturing the dynamics of the disease in small- to medium-sized cities, accounting for the combined effects of intercity mobility and lockdown rules. Moreover, our analysis revealed that implementing short or regularly scheduled quarantines can lead to a significant reduction in both the number of cases and fatalities, especially in the satellite towns surrounding the central city. Specifically, the epidemic curves show a notable drop in new COVID-19 cases, with numbers potentially falling to just a few new infections per week following a 20-day lockdown in contrast to the peak of approximately 400 new cases.
Concerning the contributions to the field, mathematical modeling of COVID-19 dynamics in smaller urban areas remains under-researched in the literature. Our search in the Scopus database using the terms “COVID-19”, “lockdown”, “small cities”, and “epidemiology model” found only six works, none of which focused on modeling COVID-19 spread with short-range transmission between nearby small cities similar to ours.
Although our mathematical approach offers a practical, real-data-validated strategy for modeling COVID-19 dissemination in small/medium-sized urban locations, there are important exogenous issues that must be considered when applying our framework. These considerations are crucial to understanding the full scope and potential of the model. First, the quality of collected data may affect the model’s effectiveness. While our research is grounded in official sources such as the São Paulo State Government (SEADE) [75] and the Brazilian Institute of Geography and Statistics (IBGE) [64], we did not address the specifics of each data processing method used by these institutions for data collection, cleaning, and organization. Instead, we relied on the data provided by their platforms as valid inputs, in line with standard practice in COVID-19 studies [27,28,29,32,48]. The accuracy of the model depends on the data’s reliability, and biases in these sources may influence the predictions. Second, the model is based on simplifying assumptions, such as homogeneous mixing within each region and fixed mobility rates between cities. These assumptions make the model tractable and applicable to a wide range of urban settings, but they may limit its precision in regions with more heterogeneous populations or varying mobility patterns. These simplifications are crucial for model development but could affect its realism in specific contexts.
Another important limitation is that the model does not account for evolving factors, such as changing vaccination rates, the emergence of new virus variants (e.g., the Omicron variant), or seasonal effects, which could vary depending on the period in which the simulations were conducted. These factors can significantly alter the trajectory of the pandemic. While the model offers a snapshot based on the current dynamics, future work could integrate these evolving elements to improve the model’s ability to predict future scenarios more accurately.
The generalization of the results to other regions requires careful analysis of local urban structures and mobility patterns. We applied the model to two Brazilian urban regions with distinct characteristics: Presidente Prudente and Araraquara. These regions differ in population sizes, mobility flows, and other social factors, so applying the model to other regions would require adjusting assumptions to match the specific conditions of each new context.
Lastly, although not the main focus of this study, the economic perspective of the pandemic is essential. Our simulations suggest that intermittent lockdowns with reopening every 10 days offer a promising strategy for balancing public health concerns with economic flexibility. However, incorporating economic variables into the model would require significant methodological adjustments, which fall outside the scope of this paper. Combining epidemiological and economic analysis would provide a more comprehensive understanding of the pandemic’s full impact on the studied regions.

5. Conclusions and Future Work

In this paper, we presented a new SIR-inspired mathematical framework, namely, SCIRD (Susceptible–Confined–Infected–Recovered–Deceased), designed to model the dynamics of COVID-19 while simultaneously incorporating intercity mobility and lockdown regimens. In contrast to most existing works that typically focus on understanding the virus spread in large urban conglomerates, we specifically tackled the challenge of modeling the dissemination of COVID-19 in medium-sized urban regions, including not only the hub city but also its neighboring towns.
From the assessments and simulations discussed in Section 3 for two Brazilian urban regions as case studies, we found that implementing a short- or regular-duration quarantine as an intervention measure can significantly reduce the number of cases and deaths caused by the disease. In more quantitative terms, our results indicate a substantial decrease in the number of new COVID-19 cases, potentially dropping to only a few new infections per week after a 20-day lockdown instead of reaching around 400 new ones at the peak of the disease. This reduction helps prevent deaths while keeping the public healthcare system from collapsing.
Another finding is that the implementation of specific strategies, such as the reduction of flow of people and open-and-closed confinement schemes, reduced the number of cases in the major city itself and mitigated the spread of the virus in surrounding towns and locations. For instance, the total number of deaths decreased from 442 to 78 when an intermittent quarantine measure was incorporated into our modeling approach.
As demonstrated by the validation analysis with a real lockdown case, the current SCIRD framework succeeded well in capturing the real data as verified in the medium-sized urban region of Araraquara and its neighboring towns, proving to be effective for dealing with real scenarios. The quantitative results for this case study achieved MAPE values of around 11.00% for the hub city and 2.50% for the satellite towns concerning daily cases. The R 2 scores also indicate a strong statistical fit between the observed and the estimated values.
For future work, we plan to explore the potential of adapting a domain-based modeling approach, such as the one presented in [92]. In this approach, we would first define the state variables of the system (e.g., infection rate, mobility patterns, lockdown policies) and then model the dynamic relationships between these variables to simulate different containment strategies. This could provide valuable insights into optimizing public health interventions, particularly in the context of COVID-19. Additionally, we aim to examine the so-called Function–Behavior–Structure (FBS) ontology to reinterpret the SCIRD compartments, drawing inspiration from previous works in other fields [93], in order to uncover the underlying principles of epidemic dynamics. Specifically, by mapping the SCIRD model to the FBS ontology, we hope to gain a deeper understanding of the system’s objectives, behaviors, and structures—ultimately enhancing our ability to evaluate and optimize containment strategies, such as lockdown measures.

Author Contributions

Conceptualization—R.S.F., W.C., J.F.C.A.M., M.C., M.A.D. and R.G.N.; investigation—R.S.F., W.C., J.F.C.A.M. and M.C.; methodology—R.S.F., W.C., J.F.C.A.M. and M.C.; validation—R.S.F., W.C., M.C. and R.G.N.; resources—R.S.F., M.A.D. and R.G.N.; funding acquisition—W.C. and M.A.D.; writing—original draft—R.S.F. and W.C. All authors have read and agreed to the published version of the manuscript.

Funding

This research was supported by the São Paulo State University, the São Paulo Research Foundation (FAPESP), grants 2013/07375-0, 2023/14427-8 and 2024/01610-1, the National Council for Scientific and Technological Development (CNPq), grants 316228/2021-4 and 305220/2022-5, and the Coordination for the Improvement of Higher Education Personnel (CAPES) – financing Code 001.

Data Availability Statement

The data used for this work are publicly available and are gathered at: https://github.com/Raffa-Silva/Data_COVID-19 (accessed on 18 March 2025).

Conflicts of Interest

The authors declare no conflicts of interest. The funders had no role in the design of the study; in the collection, analyses, or interpretation of data; in the writing of the manuscript, or in the decision to publish the results.

Appendix A. Parameter Descriptions

Table A1. Parameters of the S C I R D model used when modeling our experiments.
NotationDescriptionValueSource
S C 1 ( t ) Number of susceptibles in C 1 (Presidente Prudente) at the initial time ( t = 0 )223,677Database provided by [53]
S C 2 ( t ) Number of susceptibles in C 2 (Alfredo Marcondes) at the initial time ( t = 0 )4118Database provided by [53]
S C 3 ( t ) Number of susceptibles in C 3 (Álvares Machado) at the initial time ( t = 0 )24,729Database provided by [53]
S C 4 ( t ) Number of susceptibles in C 4 (Regente Feijó) at the initial time ( t = 0 )19,859Database provided by [53]
S C 5 ( t ) Number of susceptibles in C 5 (Indiana) at the initial time ( t = 0 )4936Database provided by [53]
S C 6 ( t ) Number of susceptibles in C 6 (Anhumas) at the initial time ( t = 0 )4026Database provided by [53]
α 1 for 0 < t < 40 Infection rate of susceptibles in C 1 0.18 × 10 3 Calibrated empirically starting as baseline the infection rate reported in [27]
α 1 for 40 < t < 60 Infection rate of susceptibles in C 1 0.171 × 10 3 Calibrated empirically starting with baseline of the infection rate reported in [27]
α 1 for 60 < t < 100 Infection rate of susceptibles in C 1 0.15 × 10 3 Calibrated empirically starting with baseline of the infection rate reported in [27]
α 2 Infection rate of susceptibles in C 2 0.15 × 10 6 Calibrated empirically starting with baseline of the infection rate reported in [27]
α 3 Infection rate of susceptibles in C 3 0.1 × 10 6 Calibrated empirically starting with baseline of the infection rate reported in [27]
α 4 Infection rate of susceptibles in C 4 0.12 × 10 6 Calibrated empirically starting with baseline of the infection rate reported in [27]
α 5 Infection rate of susceptibles in C 5 0.19 × 10 6 Calibrated empirically starting with baseline of the infection rate reported in [27]
α 6 Infection rate of susceptibles in C 6 0.23 × 10 6 Calibrated empirically starting with baseline of the infection rate reported in [27]
I C 1 ( t ) Number of infected individuals in C 1 at the initial time ( t = 0 )2Filtered from data spreadsheets provided by [74]
I C 2 ( t ) Number of infected individuals in C 2 at the initial time ( t = 0 )0Filtered from data spreadsheets provided by [74]
I C 3 ( t ) Number of infected individuals in C 3 at the initial time ( t = 0 )0Filtered from data spreadsheets provided by [74]
I C 4 ( t ) Number of infected individuals in C 4 at the initial time ( t = 0 )0Filtered from data spreadsheets provided by [74]
I C 5 ( t ) Number of infected individuals in C 5 at the initial time ( t = 0 )1Filtered from data spreadsheets provided by [74]
I C 6 ( t ) Number of infected individuals in C 6 at the initial time ( t = 0 )0Filtered from data spreadsheets provided by [74]
N C 1 ( t ) Total population in C 1 223,749Database provided by [53]
N C 2 ( t ) Total population in C 2 4118Database provided by [53]
N C 3 ( t ) Total population in C 3 24,733Database provided by [53]
N C 4 ( t ) Total population in C 4 19,860Database provided by [53]
N C 5 ( t ) Total population in C 5 4936Database provided by [53]
N C 6 ( t ) Total population in C 6 4026Database provided by [53]
θ 1 Confinement rate of susceptibles in C 1 0.15 Calculated based on the data reported in [70]
η 1 Rate at which the confined individuals become susceptible again in C 1 0.15By assumption, this rate is considered to be the same as the confinement rate
α c 1 Infection rate of confined individuals in C 1 0.33 × 10 9 Calibrated empirically starting with baseline of the infection rate reported in [27]
α c 2 Infection rate of confined individuals in C 2 0.33 × 10 9 Calibrated empirically starting with baseline of the infection rate reported in [27]
α c 3 Infection rate of confined individuals in C 3 0.33 × 10 9 Calibrated empirically starting with baseline of the infection rate reported in [27]
α c 4 Infection rate of confined individuals in C 4 0.33 × 10 9 Calibrated empirically starting with baseline of the infection rate reported in [27]
α c 5 Infection rate of confined individuals in C 5 0.33 × 10 9 Calibrated empirically starting with baseline of the infection rate reported in [27]
α c 6 Infection rate of confined individuals in C 6 0.33 × 10 9 Calibrated empirically starting with baseline of the infection rate reported in [27]
β 1 Recovery rate of infected individuals in C 1 0.98Calculated by 1 γ 1
γ 1 Mortality rate due to the disease in C 1 0.02Calibrated empirically until the curve matched the real cases
β 2 Recovery rate of infected individuals in C 2 0.95Calculated by 1 γ 2
γ 2 Mortality rate due to the disease in C 2 0.05Calibrated empirically until the curve matched the real cases
β 3 Recovery rate of infected individuals in C 3 0.98Calculated by 1 γ 3
γ 3 Mortality rate due to the disease in C 3 0.02Calibrated empirically until the curve matched the real cases
β 4 Recovery rate of infected individuals in C 4 0.98Calculated by 1 γ 4
γ 4 Mortality rate due to the disease in C 4 0.02Calibrated empirically until the curve matched the real cases
β 5 Recovery rate of infected individuals in C 5 0.98Calculated by 1 γ 5
γ 5 Mortality rate due to the disease in C 5 0.0Calibrated empirically until the curve matched the real cases
β 6 Recovery rate of infected individuals in C 6 0.98Calculated by 1 γ 6
γ 6 Mortality rate due to the disease in C 6 0.0Calibrated empirically until the curve matched the real cases

References

  1. World Health Organization. WHO Declares Public Health Emergency on Novel Coronavirus. 2020. Available online: https://www.paho.org/en/news/30-1-2020-who-declares-public-health-emergency-novel-coronavirus (accessed on 30 September 2022).
  2. Cucinotta, D.; Vanelli, M. WHO Declares COVID-19 a Pandemic. Acta Biomed. Atenei Parm. 2020, 91, 157–160. [Google Scholar]
  3. Hegenberg, K.; Althammer, A.; Gehring, C.; Prueckner, S.; Trentzsch, H. Pre-hospital emergency medical services utilization amid COVID-19 in 2020: Descriptive study based on routinely collected dispatch data in Bavaria, Germany. Healthcare 2023, 11, 1983. [Google Scholar] [CrossRef] [PubMed]
  4. McKibbin, W.; Fernando, R. The global economic impacts of the COVID-19 pandemic. Econ. Model. 2023, 129, 106551. [Google Scholar] [CrossRef]
  5. Alizadeh, H.; Sharifi, A.; Damanbagh, S.; Nazarnia, H.; Nazarnia, M. Impacts of the COVID-19 pandemic on the social sphere and lessons for crisis management: A literature review. Nat. Hazards 2023, 117, 2139–2164. [Google Scholar] [CrossRef] [PubMed]
  6. Badalov, E.; Blackler, L.; Scharf, A.E.; Matsoukas, K.; Chawla, S.; Voigt, L.P.; Kuflik, A. COVID-19 double jeopardy: The overwhelming impact of the social determinants of health. Int. J. Equity Health 2022, 21, 76. [Google Scholar] [CrossRef]
  7. Berger, E.; Winkelmann, J.; Eckhardt, H.; Nimptsch, U.; Panteli, D.; Reichebner, C.; Rombey, T.; Busse, R. A country-level analysis comparing hospital capacity and utilisation during the first COVID-19 wave across Europe. Health Policy 2022, 126, 373–381. [Google Scholar] [CrossRef]
  8. Amuedo-Dorantes, C.; Borra, C.; Rivera-Garrido, N.; Sevilla, A. Early adoption of non-pharmaceutical interventions and COVID-19 mortality. Econ. Hum. Biol. 2021, 42, 101003. [Google Scholar] [CrossRef] [PubMed]
  9. Farsalinos, K.; Poulas, K.; Kouretas, D.; Vantarakis, A.; Leotsinidis, M.; Kouvelas, D.; Docea, A.O.; Kostoff, R.; Gerotziafas, G.T.; Antoniou, M.N.; et al. Improved strategies to counter the COVID-19 pandemic: Lockdowns vs. primary and community healthcare. Toxicol. Rep. 2021, 8, 1–9. [Google Scholar] [CrossRef] [PubMed]
  10. Herby, J.; Jonung, L.; Hanke, S.H. A Systematic Literature Review and Meta-Analysis of the Effects of Lockdowns on COVID-19 Mortality II. medRxiv 2023. [CrossRef]
  11. Adiga, A.; Dubhashi, D.; Lewis, B.; Marathe, M.; Venkatramanan, S.; Vullikanti, A. Mathematical Models for COVID-19 Pandemic: A Comparative Analysis. J. Indian Inst. Sci. 2020, 100, 793–807. [Google Scholar] [CrossRef]
  12. Singh, P.; Gupta, A. Generalized SIR (GSIR) epidemic model: An improved framework for the predictive monitoring of COVID-19 pandemic. ISA Trans. 2022, 124, 31–40. [Google Scholar] [CrossRef] [PubMed]
  13. Mohajan, H.K. Mathematical Analysis of SIR Model for COVID-19 Transmission. J. Innov. Med Res. 2022, 1, 1–18. [Google Scholar]
  14. Rapti, Z.; Cuevas-Maraver, J.; Kontou, E.; Liu, S.; Drossinos, Y.; Kevrekidis, P.; Barmann, M.; Chen, Q.; Kevrekidis, G. The Role of Mobility in the Dynamics of the COVID-19 Epidemic in Andalusia. Bull. Math. Biol. 2023, 85, 54. [Google Scholar] [CrossRef] [PubMed]
  15. Yousaf, M.; Zahir, S.; Riaz, M.; Hussain, S.M.; Shah, K. Statistical analysis of forecasting COVID-19 for upcoming month in Pakistan. Chaos Solitons Fractals 2020, 138, 109926. [Google Scholar] [CrossRef]
  16. Khan, R.U.; Almakdi, S.; Alshehri, M.; Kumar, R.; Ali, I.; Hussain, S.M.; Haq, A.U.; Khan, I.; Ullah, A.; Uddin, M.I. Probabilistic Approach to COVID-19 Data Analysis and Forecasting Future Outbreaks Using a Multi-Layer Perceptron Neural Network. Diagnostics 2022, 12, 2539. [Google Scholar] [CrossRef] [PubMed]
  17. Cooper, I.; Mondal, A.; Antonopoulos, C.G. A SIR model assumption for the spread of COVID-19 in different communities. Chaos Solitons Fractals 2020, 139, 110057. [Google Scholar] [CrossRef] [PubMed]
  18. Vidal Ledo, M.; Guinovart Díaz, R.; Baldoquín Rodríguez, W.; Valdivia Onega, N.C.; Morales Lezca, W. Mathematical Models for Epidemiological Control. Educ. Medica Super. 2020, 34, e2387. [Google Scholar]
  19. Patrão, M.; Reis, M. Analyzing the COVID-19 pandemic using SIR and SECIAR models. Biomatemática 2020, 30, 111–140. [Google Scholar]
  20. Grillo Ardila, E.K.; Santaella-Tenorio, J.; Guerrero, R.; Bravo, L.E. Mathematical model and COVID-19. Colomb. Medica 2020, 51, e4277. [Google Scholar] [CrossRef]
  21. Ibarra-Vega, D. Lockdown, one, two, none, or smart. Modeling containing COVID-19 infection. A conceptual model. Sci. Total Environ. 2020, 730, 138917. [Google Scholar] [CrossRef]
  22. Ndaïrou, F.; Area, I.; Nieto, J.J.; Torres, D.F. Mathematical modeling of COVID-19 transmission dynamics with a case study of Wuhan. Chaos Solitons Fractals 2020, 135, 109846. [Google Scholar] [CrossRef] [PubMed]
  23. He, Z.; Cai, Z. Quantifying the effect of quarantine control and optimizing its cost in COVID-19 pandemic. IEEE/ACM Trans. Comput. Biol. Bioinform. 2022, 21, 803–813. [Google Scholar] [CrossRef] [PubMed]
  24. Shi, W.; Tong, C.; Zhang, A.; Wang, B.; Shi, Z.; Yao, Y.; Jia, P. An extended Weight Kernel Density Estimation model forecasts COVID-19 onset risk and identifies spatiotemporal variations of lockdown effects in China. Commun. Biol. 2021, 4, 126. [Google Scholar]
  25. Zhou, Y.; Chen, Z.; Wu, X.; Tian, Z.; Ye, L.; Zheng, L. Retrospect: The Outbreak Evaluation of COVID-19 in Wuhan District of China. Healthcare 2021, 9, 61. [Google Scholar] [CrossRef] [PubMed]
  26. Spelta, A.; Flori, A.; Pierri, F.; Bonaccorsi, G.; Pammolli, F. After the lockdown: Simulating mobility, public health and economic recovery scenarios. Sci. Rep. 2021, 10, 16950. [Google Scholar] [CrossRef]
  27. Meyer, J.; Lima, M.; Espitia, C.; Longo, F.; Laiate, B.; Gois, A.; Kunz, C. Different Approaches to the Modelling of COVID-19. Trends Comput. Appl. Math. 2021, 22, 515–531. [Google Scholar] [CrossRef]
  28. Rosario, E.C.; Brandi, A.C.; Leal, S. Mathematical Modeling Applied to the Dynamics of COVID-19 in the State of Amapá and Metropolitan Region. Proc. Ser. Braz. Soc. Comput. Appl. Math. 2022, 9. [Google Scholar] [CrossRef]
  29. Amaral, F.; Casaca, W.; Oishi, C.M.; Cuminato, J.A. Simulating Immunization Campaigns and Vaccine Protection Against COVID-19 Pandemic in Brazil. IEEE Access 2021, 9, 126011–126022. [Google Scholar] [CrossRef]
  30. Amaral, F.; Casaca, W.; Oishi, C.M.; Cuminato, J.A. Towards Providing Effective Data-Driven Responses to Predict the COVID-19 in São Paulo and Brazil. Sensors 2021, 21, 540. [Google Scholar] [CrossRef]
  31. Rychtar, J.; Diagne, M.L.; Rwezaura, H.; Tchoumi, S.Y.; Tchuenche, J.M. A Mathematical Model of COVID-19 with Vaccination and Treatment. Comput. Math. Methods Med. 2021, 2021, 1250129. [Google Scholar]
  32. Costa, G.S.; Cota, W.; Ferreira, S.C. Metapopulation modeling of COVID-19 advancing into the countryside: An analysis of mitigation strategies for Brazil. medRxiv 2020. [Google Scholar] [CrossRef]
  33. Costa, G.S.; Cota, W.; Ferreira, S.C. Outbreak diversity in epidemic waves propagating through distinct geographical scales. Phys. Rev. Res. 2020, 2, 043306. [Google Scholar] [CrossRef]
  34. Kraemer, M.U.G.; Yang, C.H.; Gutierrez, B.; Wu, C.H.; Klein, B.; Pigott, D.M.; Open COVID-19 Data Working Group; du Plessis, L.; Faria, N.R.; Li, R.; et al. The effect of human mobility and control measures on the COVID-19 epidemic in China. Science 2020, 368, 493–497. [Google Scholar] [CrossRef]
  35. Chagas, E.T.C.; Barros, P.H.; Cardoso-Pereira, I.; Ponte, I.V.; Ximenes, P.; Figueiredo, F.; Murai, F.; Couto da Silva, A.P.; Almeida, J.M.; Loureiro, A.A.F.; et al. Effects of population mobility on the COVID-19 spread in Brazil. PLoS ONE 2021, 16, e0260610. [Google Scholar] [CrossRef]
  36. Ahmad, R.A.; Imron, M.A.; Ramadona, A.L.; Lathifah, N.; Azzahra, F.; Widyastuti, K.; Fuad, A. Modeling social interaction and metapopulation mobility of the COVID-19 pandemic in main cities of highly populated Java Island, Indonesia: An agent-based modeling approach. Front. Ecol. Evol. 2023, 10, 958651. [Google Scholar] [CrossRef]
  37. Choi, S.B.; Ahn, I. Forecasting imported COVID-19 cases in South Korea using mobile roaming data. PLoS ONE 2020, 15, e0241466. [Google Scholar]
  38. Zheng, Z.; Xie, Z.; Qin, Y.; Wang, K.; Yu, Y.; Fu, P. Exploring the influence of human mobility factors and spread prediction on early COVID-19 in the USA. BMC Public Health 2021, 21, 1–13. [Google Scholar]
  39. Shen, J. A recursive bifurcation model for early forecasting of COVID-19 virus spread in South Korea and Germany. Sci. Rep. 2020, 10, 20776. [Google Scholar] [CrossRef]
  40. Wang, X.S.; Wu, J.; Yang, Y. Richards model revisited: Validation by and application to infection dynamics. J. Theor. Biol. 2012, 313, 12–19. [Google Scholar] [CrossRef]
  41. Al-Dawsari, S.R.; Sultan, K.S. Modeling of daily confirmed Saudi COVID-19 cases using inverted exponential regression. Math. Biosci. Eng. 2021, 18, 2303–2330. [Google Scholar] [CrossRef]
  42. Fan, Q.; Li, Q.; Chen, Y.; Tang, J. Modeling COVID-19 spread using multi-agent simulation with small-world network approach. BMC Public Health 2024, 24, 672. [Google Scholar] [CrossRef] [PubMed]
  43. Silva, P.C.; Batista, P.V.; Lima, H.S.; Alves, M.A.; Guimarães, F.G.; Silva, R.C. COVID-ABS: An agent-based model of COVID-19 epidemic to simulate health and economic effects of social distancing interventions. Chaos Solitons Fractals 2020, 139, 110088. [Google Scholar] [CrossRef]
  44. Nitzsche, C.; Simm, S. Agent-based modeling to estimate the impact of lockdown scenarios and events on a pandemic exemplified on SARS-CoV-2. Sci. Rep. 2024, 14, 13391. [Google Scholar] [CrossRef]
  45. Capistran, M.A.; Capella, A.; Christen, J.A. Forecasting hospital demand in metropolitan areas during the current COVID-19 pandemic and estimates of lockdown-induced 2nd waves. PLoS ONE 2021, 16, e0245669. [Google Scholar] [CrossRef] [PubMed]
  46. Siam, Z.S.; Arifuzzaman, M.; Ahmed, M.S.; Khan, F.A.; Rashid, M.H.; Islam, M.S. Dynamics of COVID-19 transmission in Dhaka and Chittagong: Two business hubs of Bangladesh. Clin. Epidemiol. Glob. Health 2021, 10, 100684. [Google Scholar] [CrossRef] [PubMed]
  47. Krishnamurthy, K.; Ambikapathy, B.; Kumar, A.; De Britto, L. Prediction of the transition from subexponential to the exponential transmission of SARS-CoV-2 in Chennai, India: Epidemic nowcasting. JMIR Public Health Surveill. 2020, 6, e21152. [Google Scholar] [CrossRef]
  48. Silva, G.C.; Ribeiro, E.M.S. The impact of Brazil’s transport network on the spread of COVID-19. Sci. Rep. 2023, 13, 2240. [Google Scholar] [CrossRef]
  49. Peixoto, P.S.; Marcondes, D.; Peixoto, C.; Oliva, S.M. Modeling future spread of infections via mobile geolocation data and population dynamics. An application to COVID-19 in Brazil. PLoS ONE 2020, 15, e0235732. [Google Scholar] [CrossRef]
  50. Barsasella, D.; Iman, A.T.; Fadly, F.; Uddin, M.; Mohammed, A.; Shaik, T.; Saputra, H.; Malwade, S.; Dhar, E.; Zakiah; et al. Information Flow and Data Gaps in COVID-19 Recording and Reporting at National and Provincial Levels in Indonesia. Healthcare 2022, 10, 204. [Google Scholar] [CrossRef] [PubMed]
  51. Ferreira, I. PIB of Municipalities Shows That the Country’s Economy Continued to Decentralize in 2021. 2023. Available online: https://agenciadenoticias.ibge.gov.br/agencia-noticias/2012-agencia-de-noticias/noticias/38683-pib-dos-municipiosmostra-que-economia-do-pais-continuou-a-se-desconcentrar-em-2021#:~:text=S%C3%A3o%20Paulo%20(SP)%20concentrou%209,%25%20do%20PIB%20nacional%20em%202021,%20menos%20do%20que%20em%202020.&text=Onze%20munic%C3%ADpios%20responderam%20por%20quase,%25%20do%20PIB%20em%202021:%20S%C3%A3o%20Paulo%20(SP),%20Rio%20de%20Janeiro%20(RJ),%20Bras%C3%ADlia%20(DF)%20e%20Fortaleza%20(CE) (accessed on 2 August 2024).
  52. São Paulo is the 21st Largest Economy in the World. 2020. Available online: https://www.casacivil.sp.gov.br/sao-paulo-e-a-21a-maior-economia-do-mundo/ (accessed on 2 August 2024).
  53. Brazilian Institute of Geography and Statistics (IBGE). Demographic Census 2022. 2022. Available online: https://censo2022.ibge.gov.br/panorama/?utm_source=ibge&utm_medium=home&utm_campaign=portal (accessed on 16 January 2024).
  54. Colnago, M.; Casaca, W.; Oishi, C.M.; Amaral, F.V.; Cuminato, J.A. Lockdown against Covid-19: Does it work or not? A case study with the municipality of Araraquara. Proc. Ser. Braz. Soc. Comput. Appl. Math. 2021, 8, 0429. [Google Scholar]
  55. Figueiredo Filho, D.B.; Silva, L.E.d.O. Social distancing and severe acute respiratory syndrome coronavirus 2 transmission: A case study from Araraquara, São Paulo, Brazil. J. Braz. Soc. Trop. Med. 2021, 54, e0197-2021. [Google Scholar] [CrossRef] [PubMed]
  56. Santos Francisco, B.; Bueno Dutra, F.; Carvalho-Batista, A.; Gordo Peres Francisco, F.; Sciacio Ghidini, M.; de Souza Cardoso, R.; Conceição Márquez Piña Rodrigues, F. Social isolation measures cause reduction in the contamination and deaths by COVID-19? The case of the municipality of Araraquara, SP, Brazil. Interfaces Científicas-Saúde E Ambiente 2021, 8, 233–249. [Google Scholar]
  57. Aragão, D.P.; Junior, A.G.d.S.; Mondini, A.; Distante, C.; Gonçalves, L.M.G. COVID-19 Patterns in Araraquara, Brazil: A Multimodal Analysis. Int. J. Environ. Res. Public Health 2023, 20, 4740. [Google Scholar] [CrossRef] [PubMed]
  58. Watson, S.I.; Diggle, P.J.; Chipeta, M.G.; Lilford, R.J. Spatiotemporal analysis of the first wave of COVID-19 hospitalisations in Birmingham, UK. BMJ Open 2021, 11, e050574. [Google Scholar] [CrossRef] [PubMed]
  59. Zhang, Y.; Shi, L.; Chen, H.; Wang, X.; Sun, G. Hubei’s Core Response Policies in the Early Stage of COVID-19. BioMed Res. Int. 2021, 2021, 6610045. [Google Scholar] [CrossRef]
  60. Barbarossa, M.V.; Bogya, N.; Dénes, A.; Röst, G.; Varma, H.V.; Vizi, Z. Fleeing lockdown and its impact on the size of epidemic outbreaks in the source and target regions—A COVID-19 lesson. Sci. Rep. 2021, 11, 9233. [Google Scholar]
  61. Cavany, S.M.; España, G.; Vazquez-Prokopec, G.M.; Scott, T.W.; Alex Perkins, T. Pandemic-associated mobility restrictions could cause increases in dengue virus transmission. PLoS Neglected Trop. Dis. 2021, 15, e0009603. [Google Scholar] [CrossRef] [PubMed]
  62. Brethouwer, J.T.; van de Rijt, A.; Lindelauf, R.; Fokkink, R. “Stay nearby or get checked”: A COVID-19 control strategy. Infect. Dis. Model. 2021, 6, 36–45. [Google Scholar]
  63. Ferreira, S.A.S. Dilemmas and Impacts of Prison Units in Pontal do Paranapanema: A Case Study in the Municipality of Marabá Paulista. Master’s Thesis, Universidade do Oeste Paulista, Presidente Prudente, Brazil, 2017; 128p. [Google Scholar]
  64. Brazilian Institute of Geography and Statistics (IBGE). Continuous Cartographic Bases. 2022. Available online: https://www.ibge.gov.br/geociencias/cartas-e-mapas/bases-cartograficas-continuas.html (accessed on 14 January 2023).
  65. Brazilian Institute of Geography and Statistics (IBGE). Population Arrangements and Urban Concentrations in Brazil. 2022. Available online: https://www.ibge.gov.br/apps/arranjos_populacionais/2022/ (accessed on 16 January 2023).
  66. Kermack, W.O.; McKendrick, A.G. A Contribution to the Mathematical Theory of Epidemics. Proc. R. Soc. London. Ser. A Contain. Pap. A Math. Phys. Character 1927, 115, 700–721. [Google Scholar]
  67. Tang, L.; Zhou, Y.; Wang, L.; Purkayastha, S.; Zhang, L.; He, J.; Wang, F.; Song, P.X.K. A review of multi-compartment infectious disease models. Int. Stat. Rev. 2020, 88, 462–513. [Google Scholar]
  68. Townsend, J.P.; Hassler, H.B.; Wang, Z.; Miura, S.; Singh, J.; Kumar, S.; Ruddle, N.H.; Galvani, A.P.; Dornburg, A. The durability of immunity against reinfection by SARS-CoV-2: A comparative evolutionary study. Lancet Microbe 2021, 2, e666–e675. [Google Scholar] [CrossRef] [PubMed]
  69. Leiva, G.d.C.; Sathler, D.; Orrico Filho, R.D. Urban Structure and Population Mobility: Implications for Social Distancing and the Spread of COVID-19. Rev. Bras. Estud. Popul. 2020, 37, e0118. [Google Scholar]
  70. Intelligent Monitoring System of the São Paulo State Government (SIMI-SP). Adherence to Social Isolation in SP. 2020. Available online: https://www.saopaulo.sp.gov.br/coronavirus/isolamento/ (accessed on 2 January 2023).
  71. Garrido, J.M.; Martínez-Rodríguez, D.; Rodríguez-Serrano, F.; Pérez-Villares, J.M.; Ferreiro-Marzal, A.; Jiménez-Quin tana, M.M.; Study Group COVID-19 Granada; Villanueva, R.J. Mathematical model optimized for prediction and health care planning for COVID-19. Med. Intensiv. (Engl. Ed.) 2022, 46, 248–258. [Google Scholar]
  72. Murray, J.D. Mathematical Biology; Springer: Berlin/Heidelberg, Germany, 1990. [Google Scholar]
  73. van den Driessche, P.; Watmough, J. Reproduction numbers and sub-threshold endemic equilibria for compartmental models of disease transmission. Math. Biosci. 2002, 180, 29–48. [Google Scholar] [CrossRef] [PubMed]
  74. Sao Paulo Sate Government (SEADE). Against the New Coronavirus-Complete Bulletin. 2020. Available online: https://www.seade.gov.br (accessed on 4 December 2022).
  75. Sao Paulo Sate Government (SEADE). Tehnical Notes. 2020. Available online: https://coronavirus.seade.gov.br (accessed on 15 July 2024).
  76. Bi, Q.; Wu, Y.; Mei, S.; Ye, C.; Zou, X.; Zhang, Z.; Liu, X.; Wei, L.; Truelove, S.A.; Zhang, T.; et al. Epidemiology and transmission of COVID-19 in 391 cases and 1286 of their close contacts in Shenzhen, China: A retrospective cohort study. Lancet Infect. Dis. 2020, 20, 911–919. [Google Scholar] [CrossRef] [PubMed]
  77. University of Melbourne. Coronavirus 10-Day Forecast Project. 2020. Available online: http://covid19forecast.science.unimelb.edu.au/#about (accessed on 15 July 2024).
  78. IBGE (Brazilian Institute of Geography and Statistics). Population Arrangements and Urban Concentrations in Brazil, 2nd ed.; IBGE: Rio de Janeiro, Brazil, 2016. [Google Scholar]
  79. Müller-Komorowska, D. Differential Equations with SciPy–Odeint or solve_ivp. 2021. Available online: https://danielmuellerkomorowska.com/2021/02/16/differential-equations-with-scipy-odeint-or-solve_ivp/ (accessed on 29 November 2022).
  80. Butcher, J.C. Numerical Methods for Ordinary Differential Equations; John Wiley & Sons: Hoboken, NJ, USA, 2016. [Google Scholar]
  81. Cash, J.R. Backward Differentiation Formulae. In Encyclopedia of Applied and Computational Mathematics; Springer: Berlin/Heidelberg, Germany, 2015; pp. 97–101. [Google Scholar]
  82. Nguyen, Q. Hands-on Application Development with PyCharm: Accelerate Your Python Applications Using Practical Coding Techniques in PyCharm; Packt Publishing Ltd.: Birmingham, UK, 2019. [Google Scholar]
  83. McKinney, W. Data Structures for Statistical Computing in Python. In Proceedings of the 9th Python in Science Conference, Austin, TX, USA, 28 June–3 July 2010; pp. 56–61. [Google Scholar]
  84. Hunter, J.; Dale, D.; Firing, E. Matplotlib: Python Plotting. 2012. Available online: https://matplotlib.org/ (accessed on 29 November 2022).
  85. de Myttenaere, A.; Golden, B.; Le Grand, B.; Rossi, F. Mean Absolute Percentage Error for regression models. Neurocomputing 2016, 192, 38–48. [Google Scholar] [CrossRef]
  86. Chicco, D.; Warrens, M.; Jurman, G. The coefficient of determination R-squared is more informative than SMAPE, MAE, MAPE, MSE and RMSE in regression analysis evaluation. PeerJ Comput. Sci. 2021, 7, e623. [Google Scholar] [CrossRef] [PubMed]
  87. Tang, B.; Zhou, W.; Wang, X.; Wu, H.; Xiao, Y. Controlling Multiple COVID-19 Epidemic Waves: An Insight from a Multi-scale Model Linking the Behaviour Change Dynamics to the Disease Transmission Dynamics. Bull. Math. Biol. 2022, 84, 106. [Google Scholar] [CrossRef]
  88. Mema, B.; Tosuni, S. Implementation of Mathematics Model in Public Health: Albanian Case Study. Smart Cities Reg. Dev. (SCRD) J. 2024, 8, 41–54. [Google Scholar] [CrossRef]
  89. Liu, Y.; Gayle, A.; Wilder-Smith, A.; Rocklöv, J. The reproductive number of COVID-19 is higher compared to SARS coronavirus. J. Travel. Med. 2020, 27, taaa021. [Google Scholar] [CrossRef]
  90. Ferguson, N.M.; Laydon, D.; Nedjati-Gilani, G.; Imai, N.; Ainslie, K.; Baguelin, M.; Bhatia, S.; Boonyasiri, A.; Cucunubá, Z.; Cuomo-Dannenburg, G.; et al. Report 9: Impact of Non-Pharmaceutical Interventions (NPIs) to Reduce COVID-19 Mortality and Healthcare Demand; Imperial College London: London, UK, 2020. [Google Scholar]
  91. Varela, H. The Importance of Isolation and Why We Need to Study Araraquara and São Carlos-Jornal da USP. 2021. Available online: https://jornal.usp.br/?p=396566 (accessed on 2 January 2023).
  92. Bajomo, M.; Ogbeyemi, A.; Zhang, W. A systems dynamics approach to the management of material procurement for Engineering, Procurement and Construction industry. Int. J. Prod. Econ. 2022, 244, 108390. [Google Scholar] [CrossRef]
  93. Wang, J.; Wang, H.; Ding, J.; Furuta, K.; Kanno, T.; Ip, W.; Zhang, W. On domain modelling of the service system with its application to enterprise information systems. Enterp. Inf. Syst. 2016, 10, 1–16. [Google Scholar] [CrossRef]
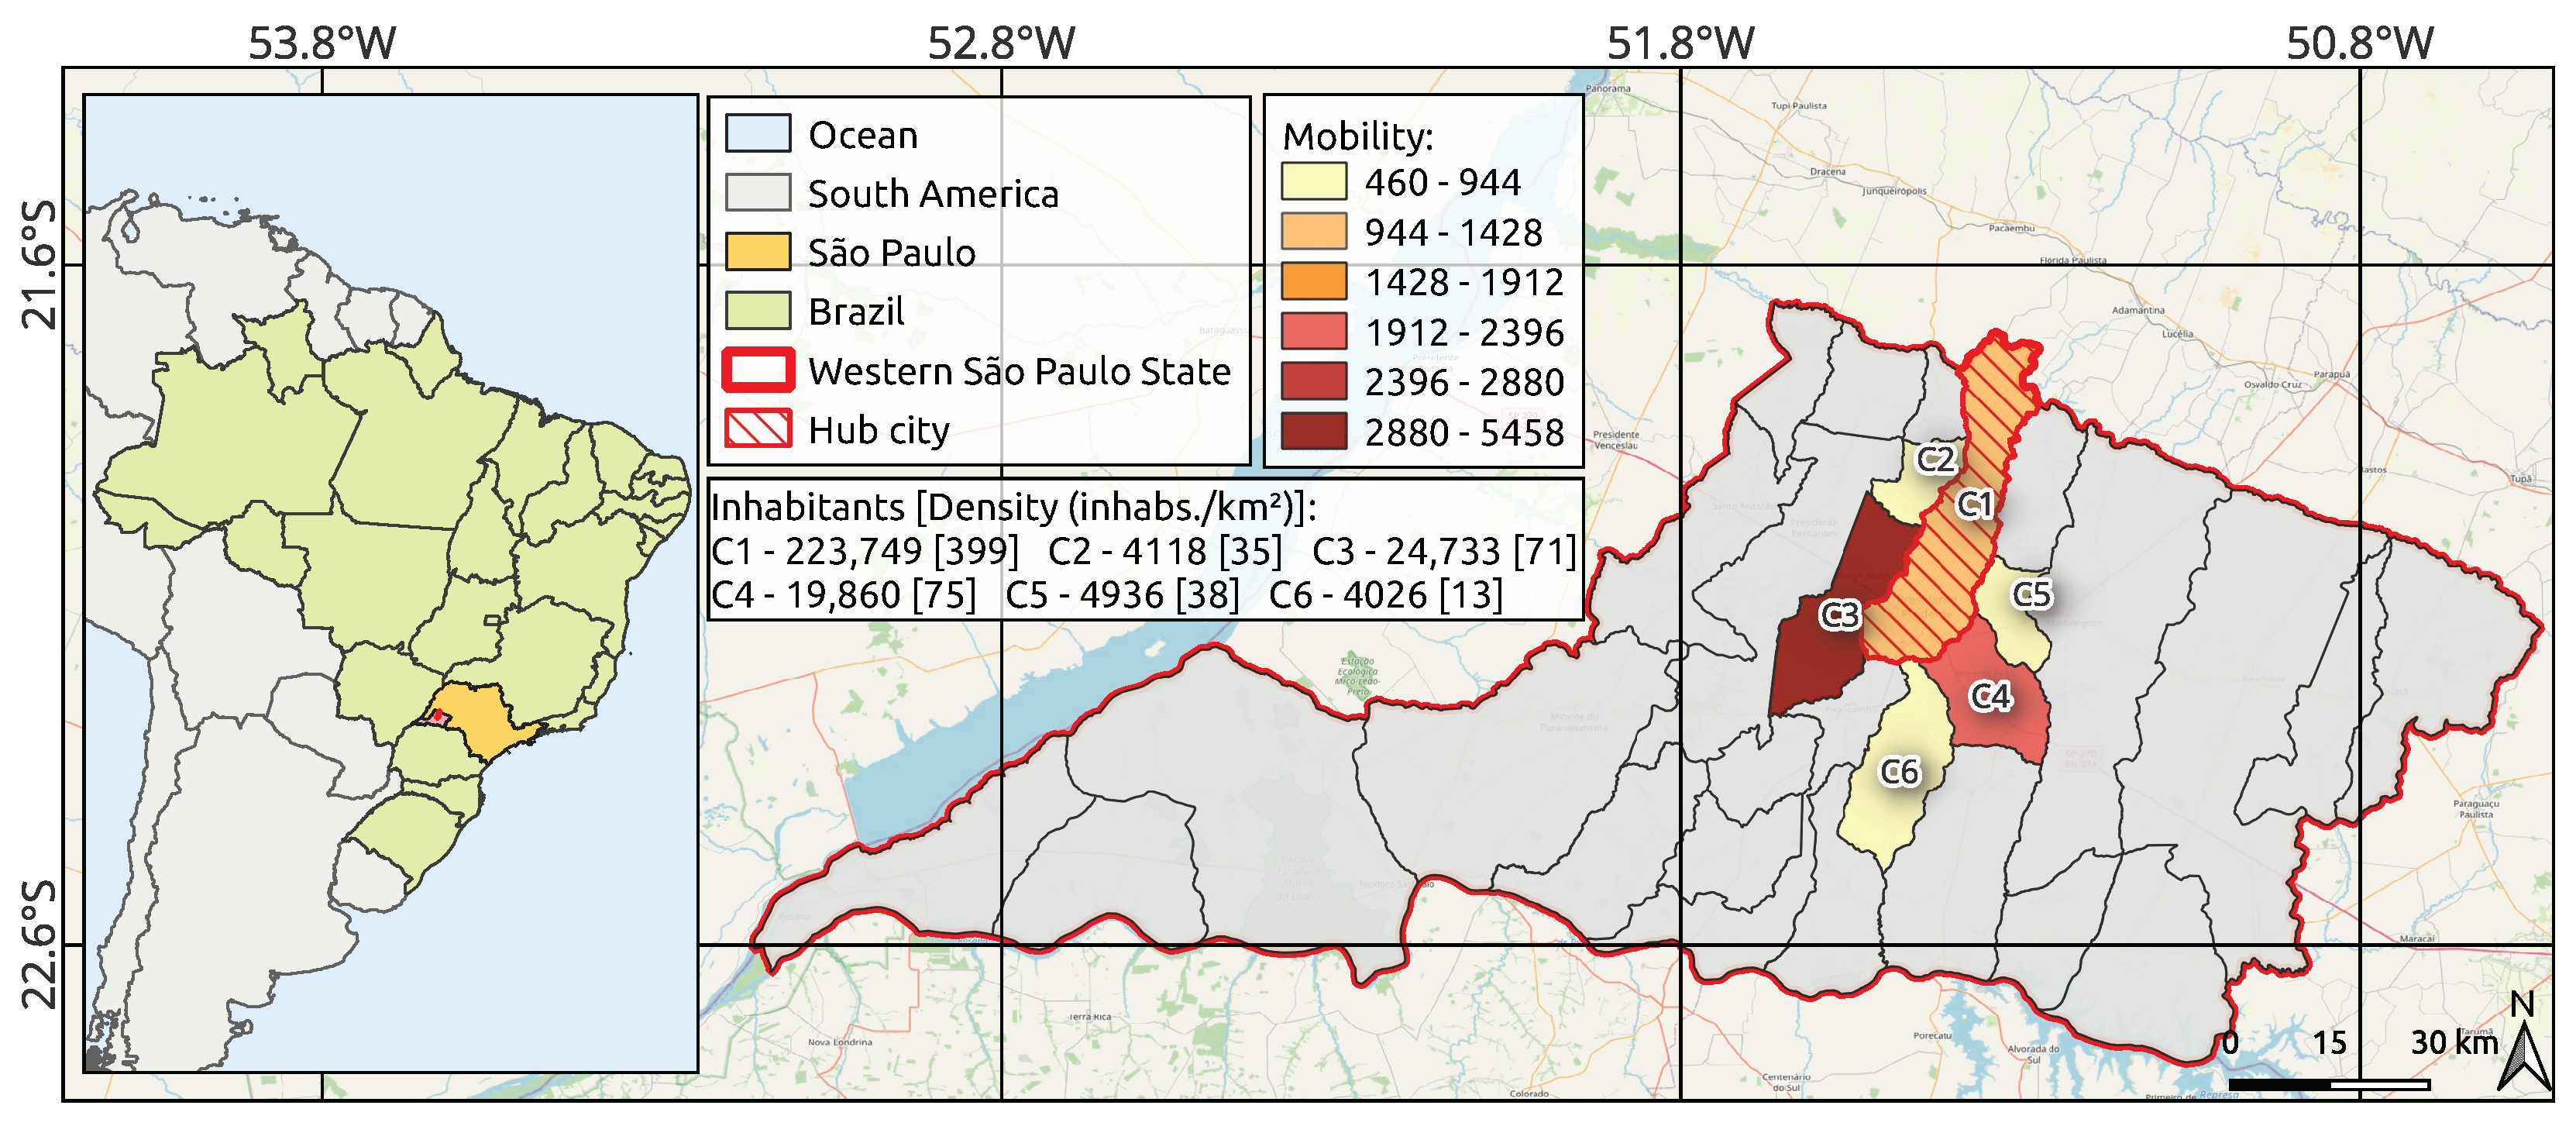
Figure 1. Study area, including the mobility rates for work/study activities.
Information 16 00299 g001
Figure 2. (Left) Dynamics of the well-posed SIR model, and (right) the probability density function related to the infection duration.
Information 16 00299 g002
Figure 3. Visual representation of the interactions between the SCIRD compartments.
Information 16 00299 g003
Figure 4. Sensitivity analysis of transmission rate.
Information 16 00299 g004
Figure 5. Plot of real data and SCIRD-generated curves for confirmed cases.
Information 16 00299 g005
Figure 6. Plot of real data and SCIRD-generated curves for the cumulative number of deaths.
Information 16 00299 g006
Figure 7. Evaluation of effect of multiple lockdown scenarios on COVID-19 infections in the examined cities.
Information 16 00299 g007
Figure 8. Evaluation of the intervention-free scenario against different lockdown strategies.
Information 16 00299 g008
Figure 9. Evaluation of effect of multiple lockdown scenarios on COVID-19 deaths in the examined cities.
Information 16 00299 g009
Figure 10. Evaluation of the effect of the intervention-free scenario against different lockdown strategies for the COVID-19 deaths.
Information 16 00299 g010
Figure 11. Comparison of the number of daily infected people (black instances) obtained by our SCIRD model with the real data (colored instances) from Araraquara and its neighboring towns during the lockdown period, indicated by the shaded area in the plot.
Information 16 00299 g011
Figure 12. Comparison of the accumulated cases and deaths (black instances) obtained by our SCIRD model with the real data (colored instances) from Araraquara and its neighboring cities during the lockdown period, indicated by the shaded area in the plots.
Information 16 00299 g012
Figure 13. Q-Q plot for infected across each city C i .
Information 16 00299 g013
Figure 14. Q-Q plot for deaths across each city C i .
Information 16 00299 g014
Table 1. Mathematical notation.
NotationDescription
n C Number of cities
C i Notation for city i
N C i ( t ) Total population in C i at time t
S C i ( t ) Number of susceptible individuals in C i at time t
I C i ( t ) Number of infected individuals in C i at time t
C C i ( t ) Number of confined individuals in C i at time t
D C i ( t ) Number of deaths in C i at time t
R C i ( t ) Number of recovered individuals in C i at time t
f i j Flow rate of people traveling from C i to C j every day
α i Infection rate of susceptible individuals in C i
θ i Confinement rate of susceptible individuals in C i
η i Rate at which confined individuals revert to being susceptible in C i
μ i Infection rate of confined individuals in C i
β i Recovery rate of infected individuals in C i
γ i Mortality rate in C i
Table 2. Comparison of lockdown effect on infectious cases in the studied urban center.
WeekWeekly Cases
No Lock. Lock. 70 Lock. 30 Lock. 20 Lock. 10 *
11818181818
22727272727
34343434343
46638383837
510812121213
617033310
72261127
82991012
93820022
103810021
113410030
123030040
132680050
142350060
Table 3. Comparison of lockdown effect on deaths in the studied urban center.
WeekAccumulated Deaths
No Lock. Lock. 70 Lock. 30 Lock. 20 Lock. 10 *
15757575757
26060606060
36565656565
47271717171
58574747474
610475757576
713075757577
816975757577
921675757578
1026775757678
1131975757678
1236575757678
1340675757678
1444275757778
Table 4. MAPE and NRMSE averages for the municipalities of Araraquara ( C 1 ), Américo Brasiliense ( C 2 ), and Santa Lúcia ( C 3 ) for the proposed model.
Period CityInfectedInfected (Accum.)Deaths (Accum.)
MAPE NRMSE MAPE NRMSE MAPE NRMSE
Lockdown C 1 11.44%0.19711.03%0.46713.38%0.895
C 2 2.79%0.32218.06%0.78913.76%0.952
C 3 1.73%1.0066.91%0.28114.39%1.218
After lockdown C 1 11.96%0.63910.79%0.7572.77%0.298
C 2 2.68%0.61710.73%0.6272.61%0.369
C 3 1.96%1.1853.75%0.27021.13%3.103
Table 5. MAPE and NRMSE averages for the municipalities of Araraquara ( C 1 ), Américo Brasiliense ( C 2 ), and Santa Lúcia ( C 3 ) for the SIR model.
Period CityInfectedInfected (Accum.)
MAPE NRMSE MAPE NRMSE
Lockdown C 1 19.23%0.20826.87%1.372
C 2 7.36%0.11224.11%1.233
C 3 34.39%0.47432.67%1.010
After lockdown C 1 61.24%0.61418.13%1.892
C 2 47.52%0.47217.40%1.244
C 3 77.85%0.74523.80%1.596
Disclaimer/Publisher’s Note: The statements, opinions and data contained in all publications are solely those of the individual author(s) and contributor(s) and not of MDPI and/or the editor(s). MDPI and/or the editor(s) disclaim responsibility for any injury to people or property resulting from any ideas, methods, instructions or products referred to in the content.