

Schema Understandability: A Comprehensive Empirical Study of Requirements Metrics


Abstract
1. Introduction
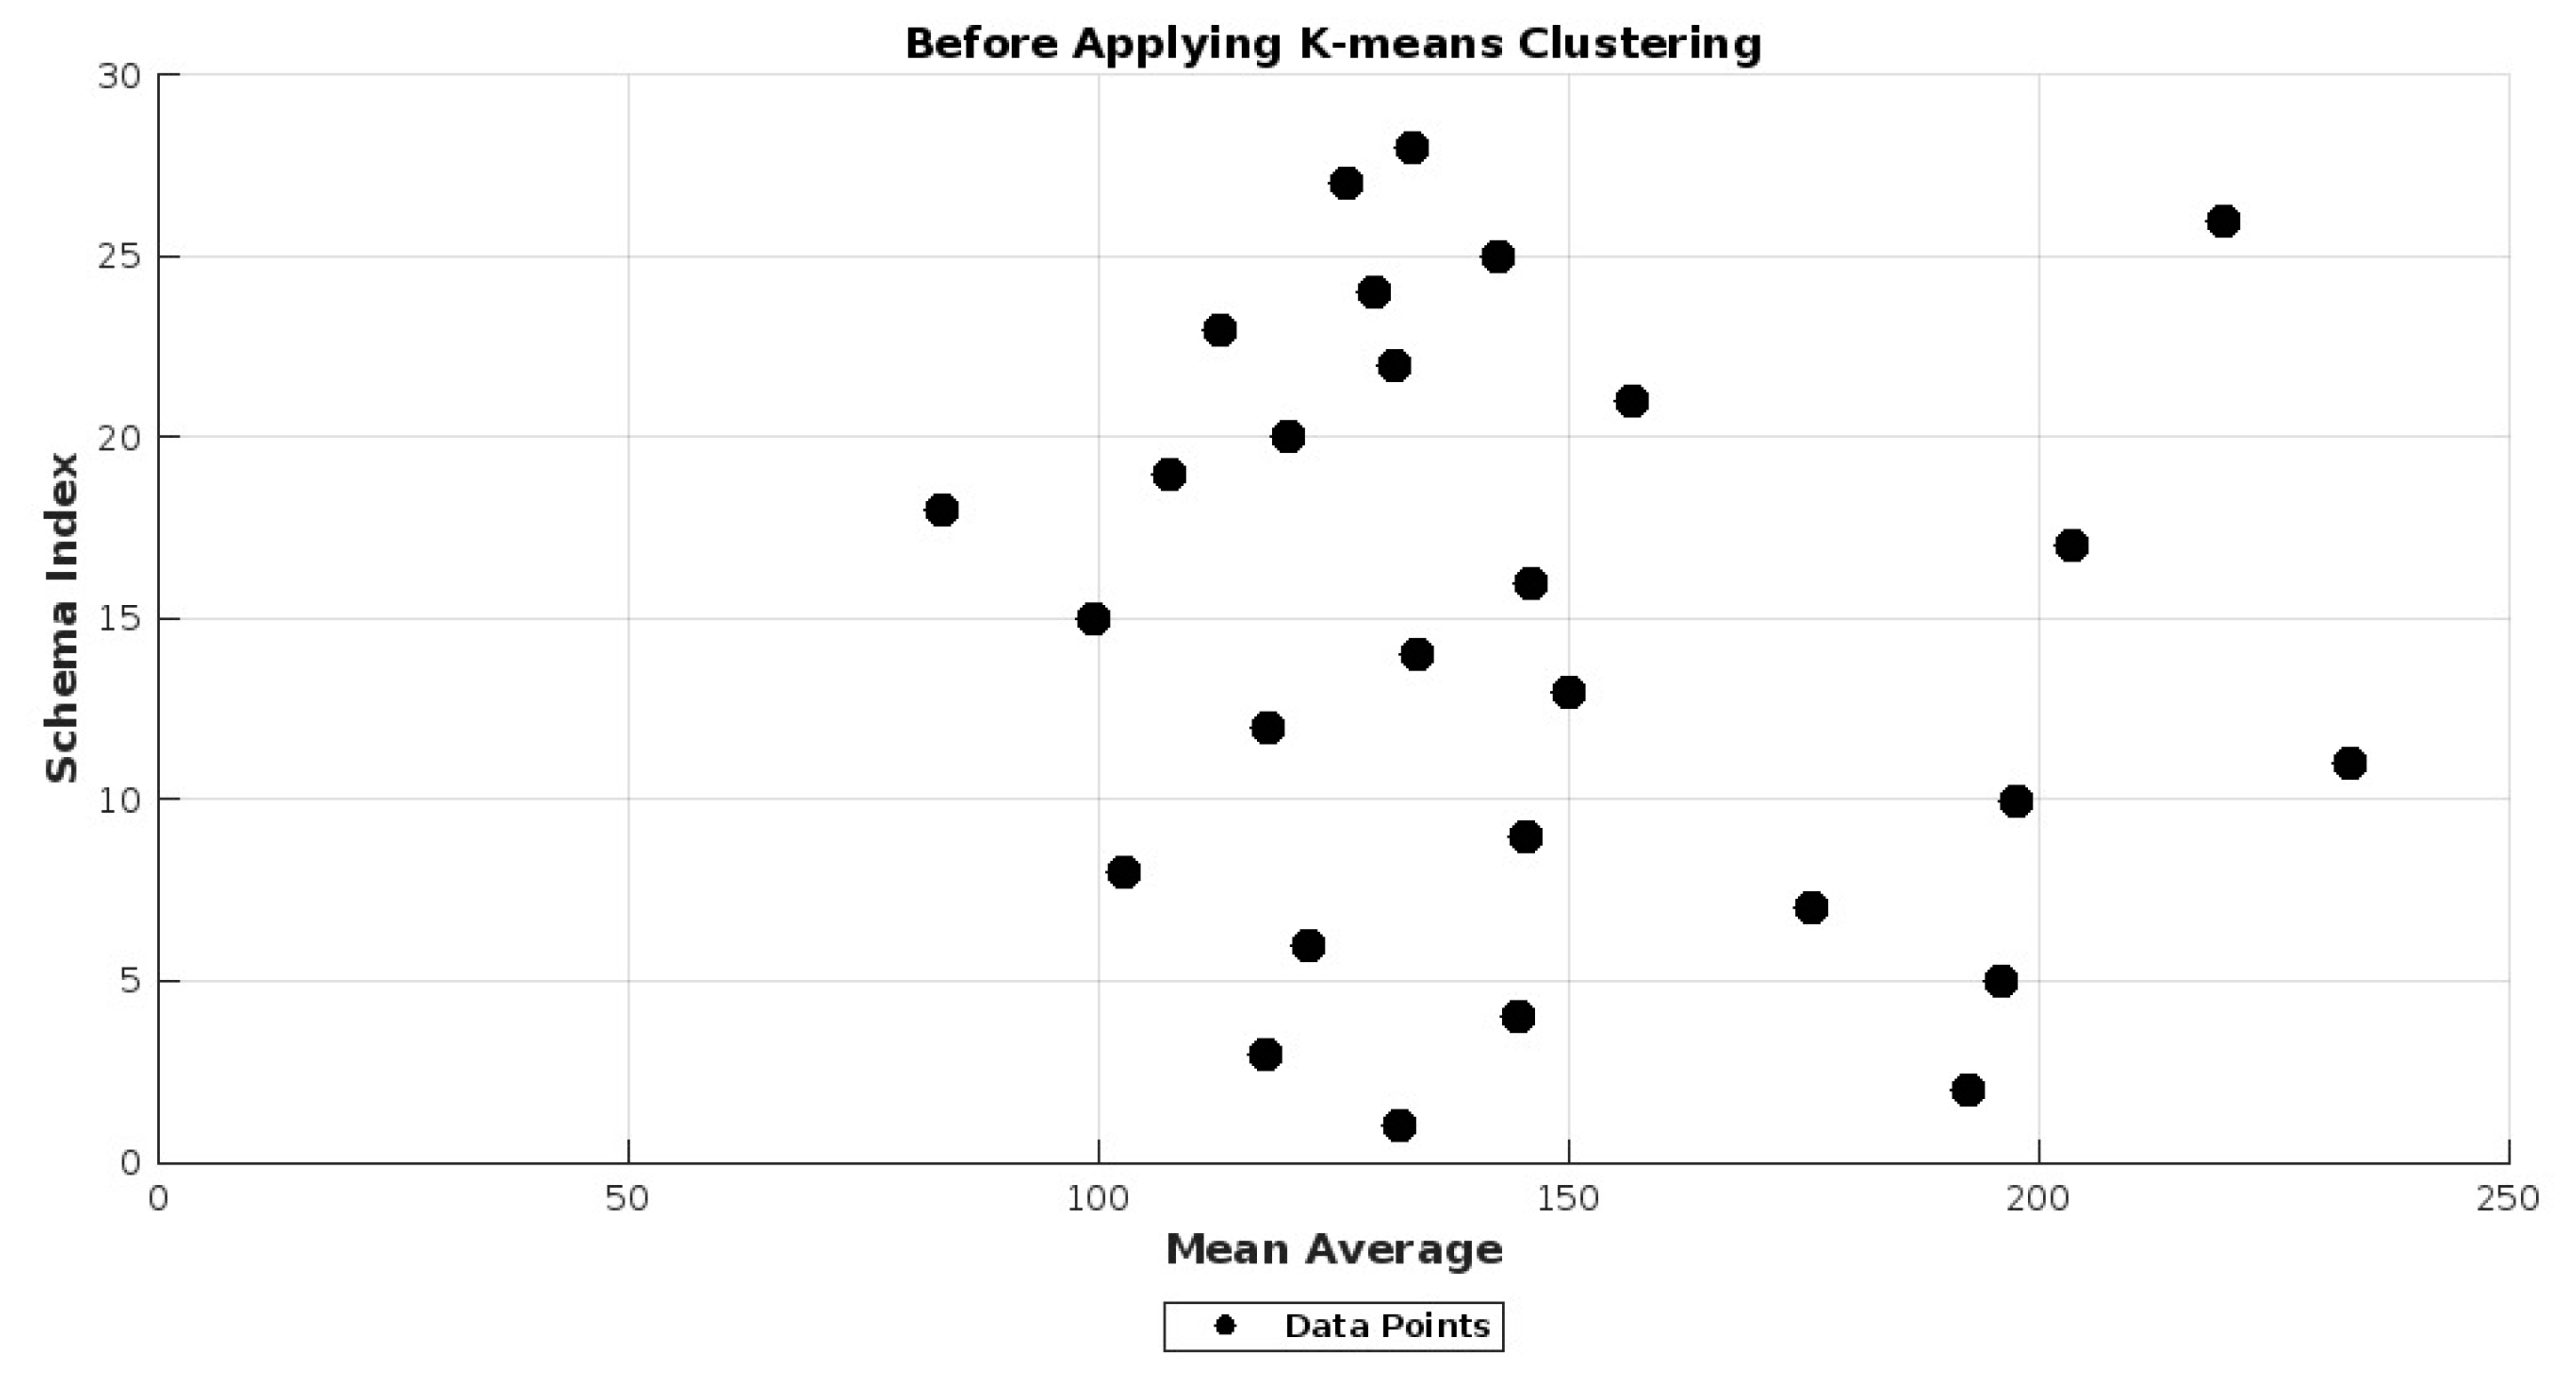
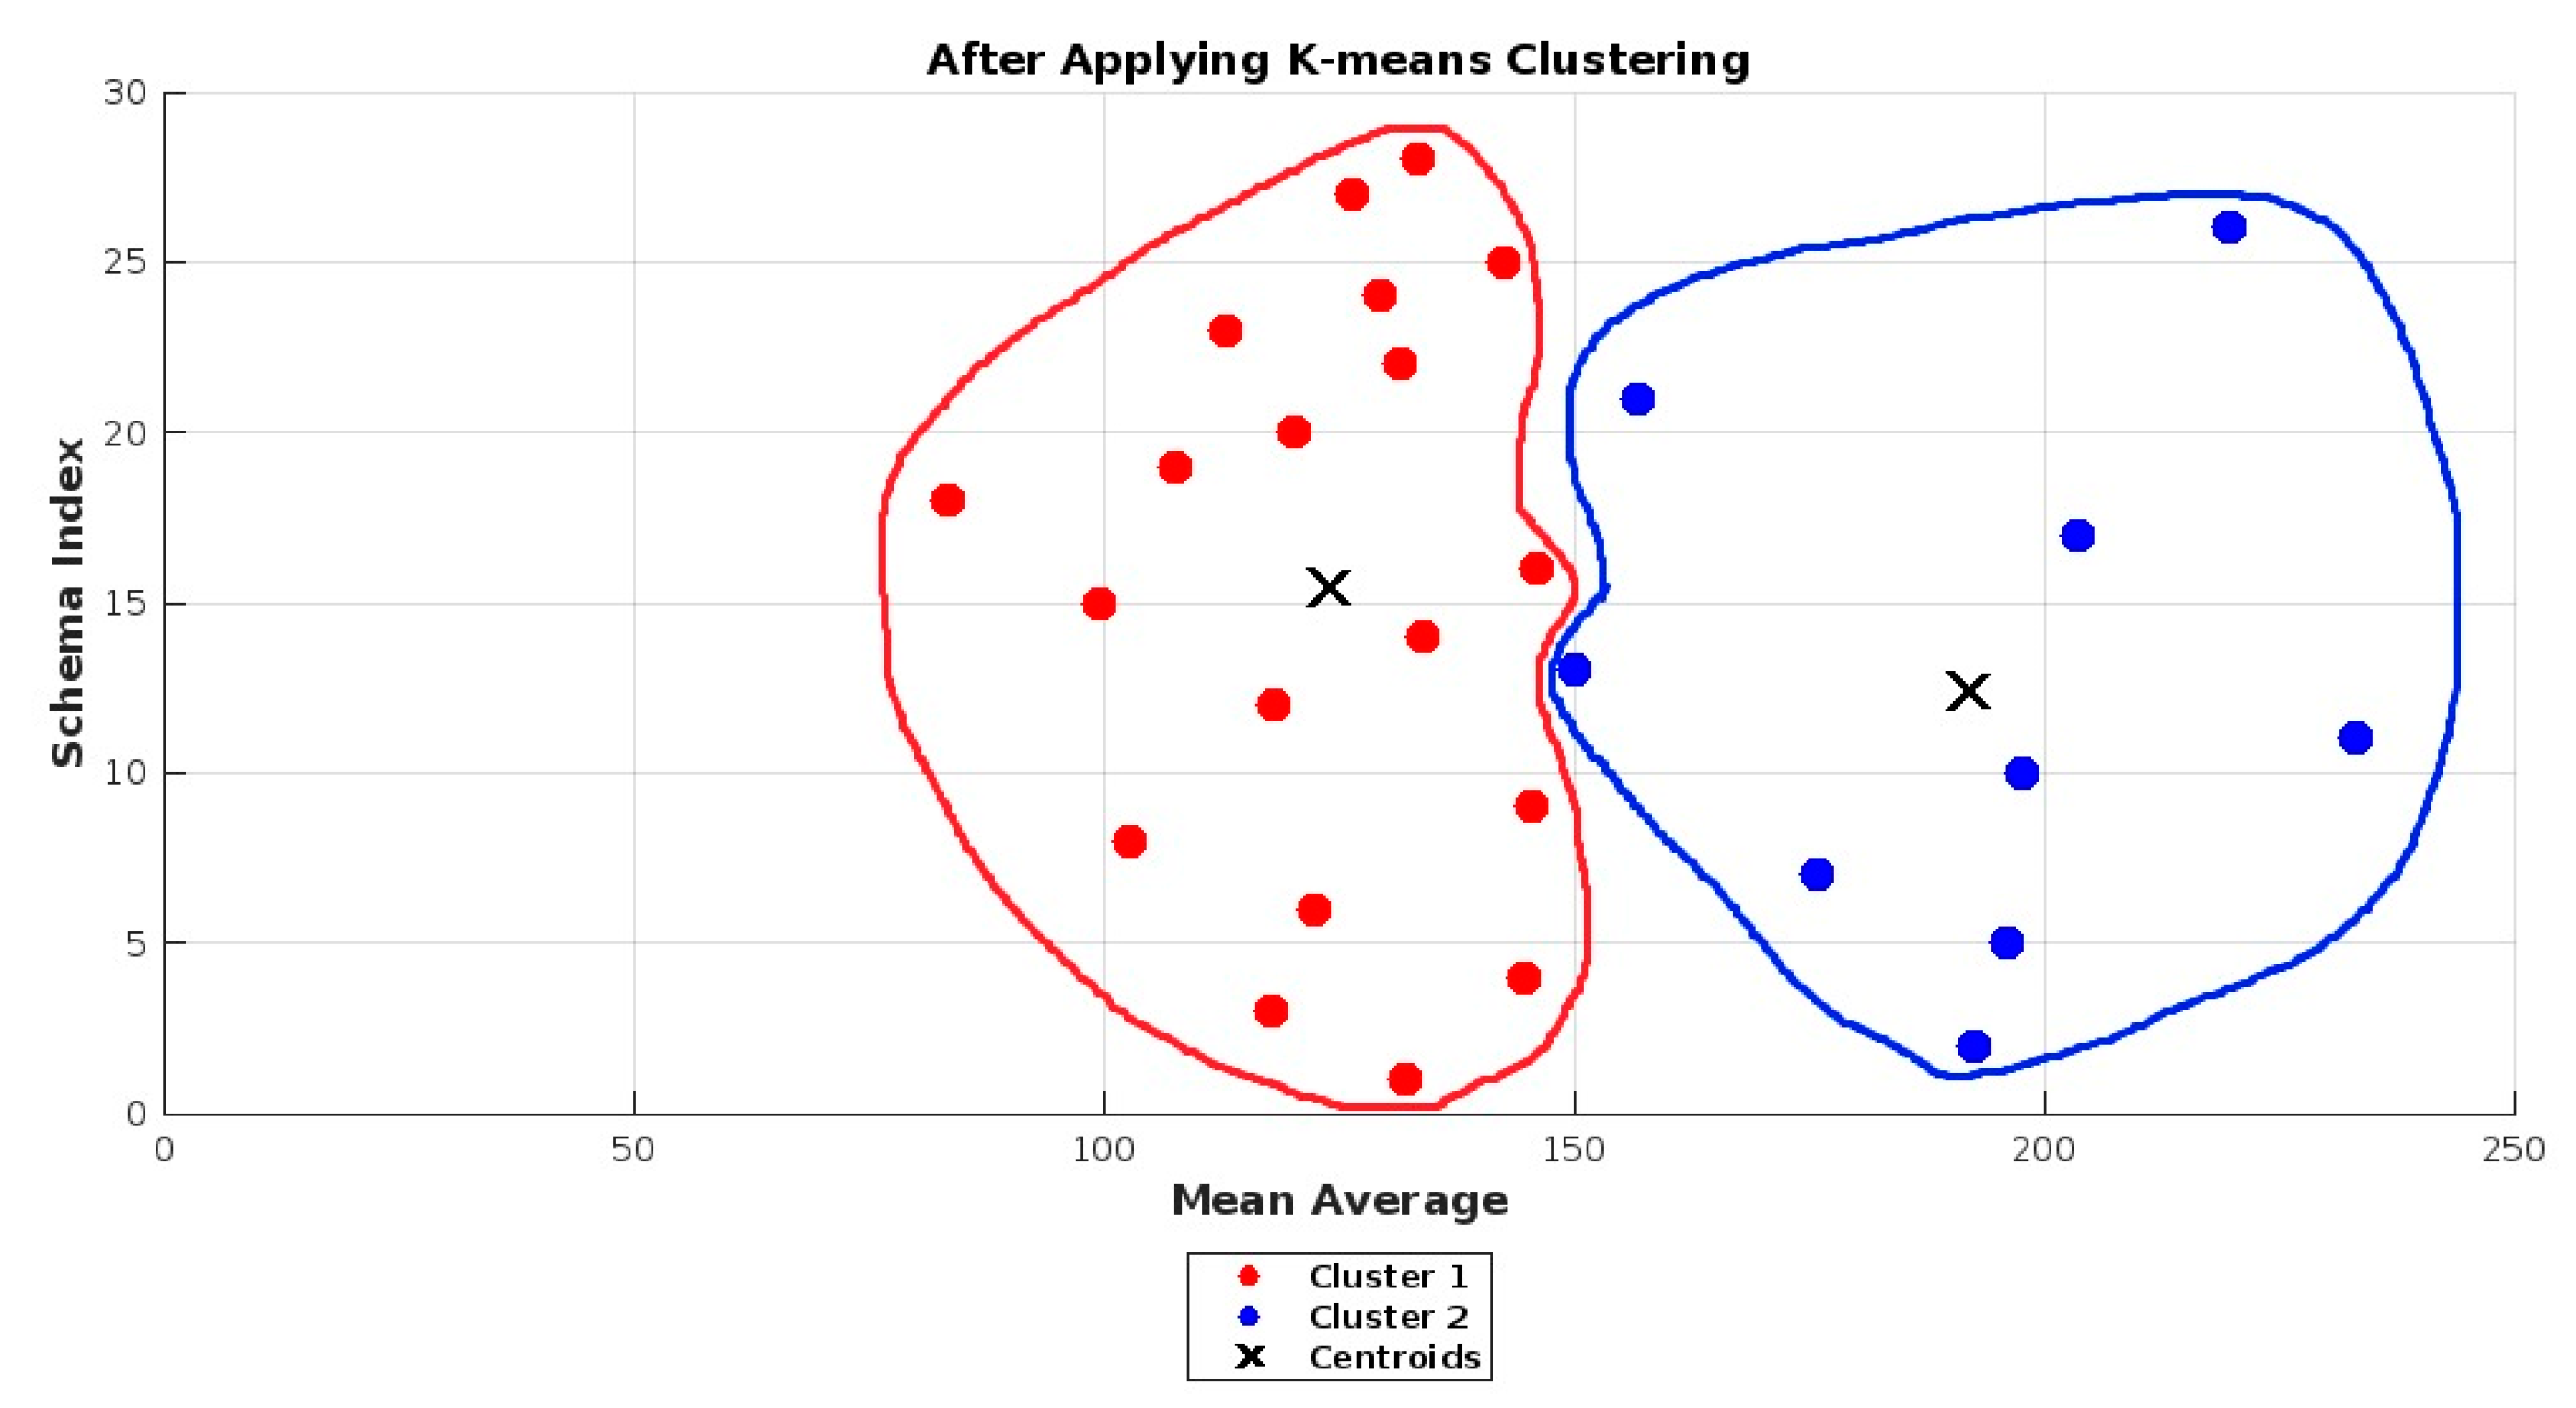
- This study includes 28 requirements schemas which have been classified into two clusters, i.e., understandable and non-understandable, through the k-means clustering technique.
- Following this, a statistical technique, i.e., logistic regression (LR), has been employed including both univariate and multivariate analysis of requirements metrics for predicting schema understandability.
- Furthermore, as part of our study, five machine learning (ML) techniques have been implemented: naive bayes classifier (NB), linear discriminant analysis (LDA) with decision tree (DT), reinforcement learning (RL), voting rule (VR), and a hybrid (combination of RL + VR). These techniques also involve univariate and multivariate analyses of requirements metrics to predict schema understandability and to investigate their capability in creating accurate predictive models.
- Moreover, the assessment and comparison of these predictive models are performed by calculating different performance parameters including accuracy, specificity, sensitivity, and area under curve (AUC) obtained from the receiver operating characteristics (ROC) curve. The results shows that a hybrid classifier (combining reinforcement learning and voting rule) significantly outperforms other techniques to predict DW requirements schema understandability.
2. Related Work
3. Requirements Metrics Used in This Study
4. Empirical Study
4.1. Experimental Design
4.1.1. Goal Definition
- to study the metrics for DW requirements schemas
- for the purpose of predicting the understandability of DW requirements schemas
- with respect to the performance of statistical (LR) and ML (NB, LDA with DT, RL, VR and hybrid (RL + VR)) techniques
- from the perspective of scientists/scholars/researchers
- in the context of students/subjects (graduate and postgraduate)
4.1.2. Subjects
4.1.3. Experimental Variables
4.1.4. Formulation of Hypothesis
- Null hypothesis (H0): In this case, the understandability of the DW requirements schemas is not significantly impacted by the individual requirements metrics.
- Alternative hypothesis from (H1) to (H17): Here, the understandability of the DW requirements schemas is significantly impacted by all completeness and traceability requirements metrics.
- Alternative hypothesis (H18): In this case, the understandability of the DW requirements schemas is significantly impacted by some or all combined requirements metrics.
4.1.5. Data Collection
- Start time (in seconds) -____________ End time (in seconds) -________________
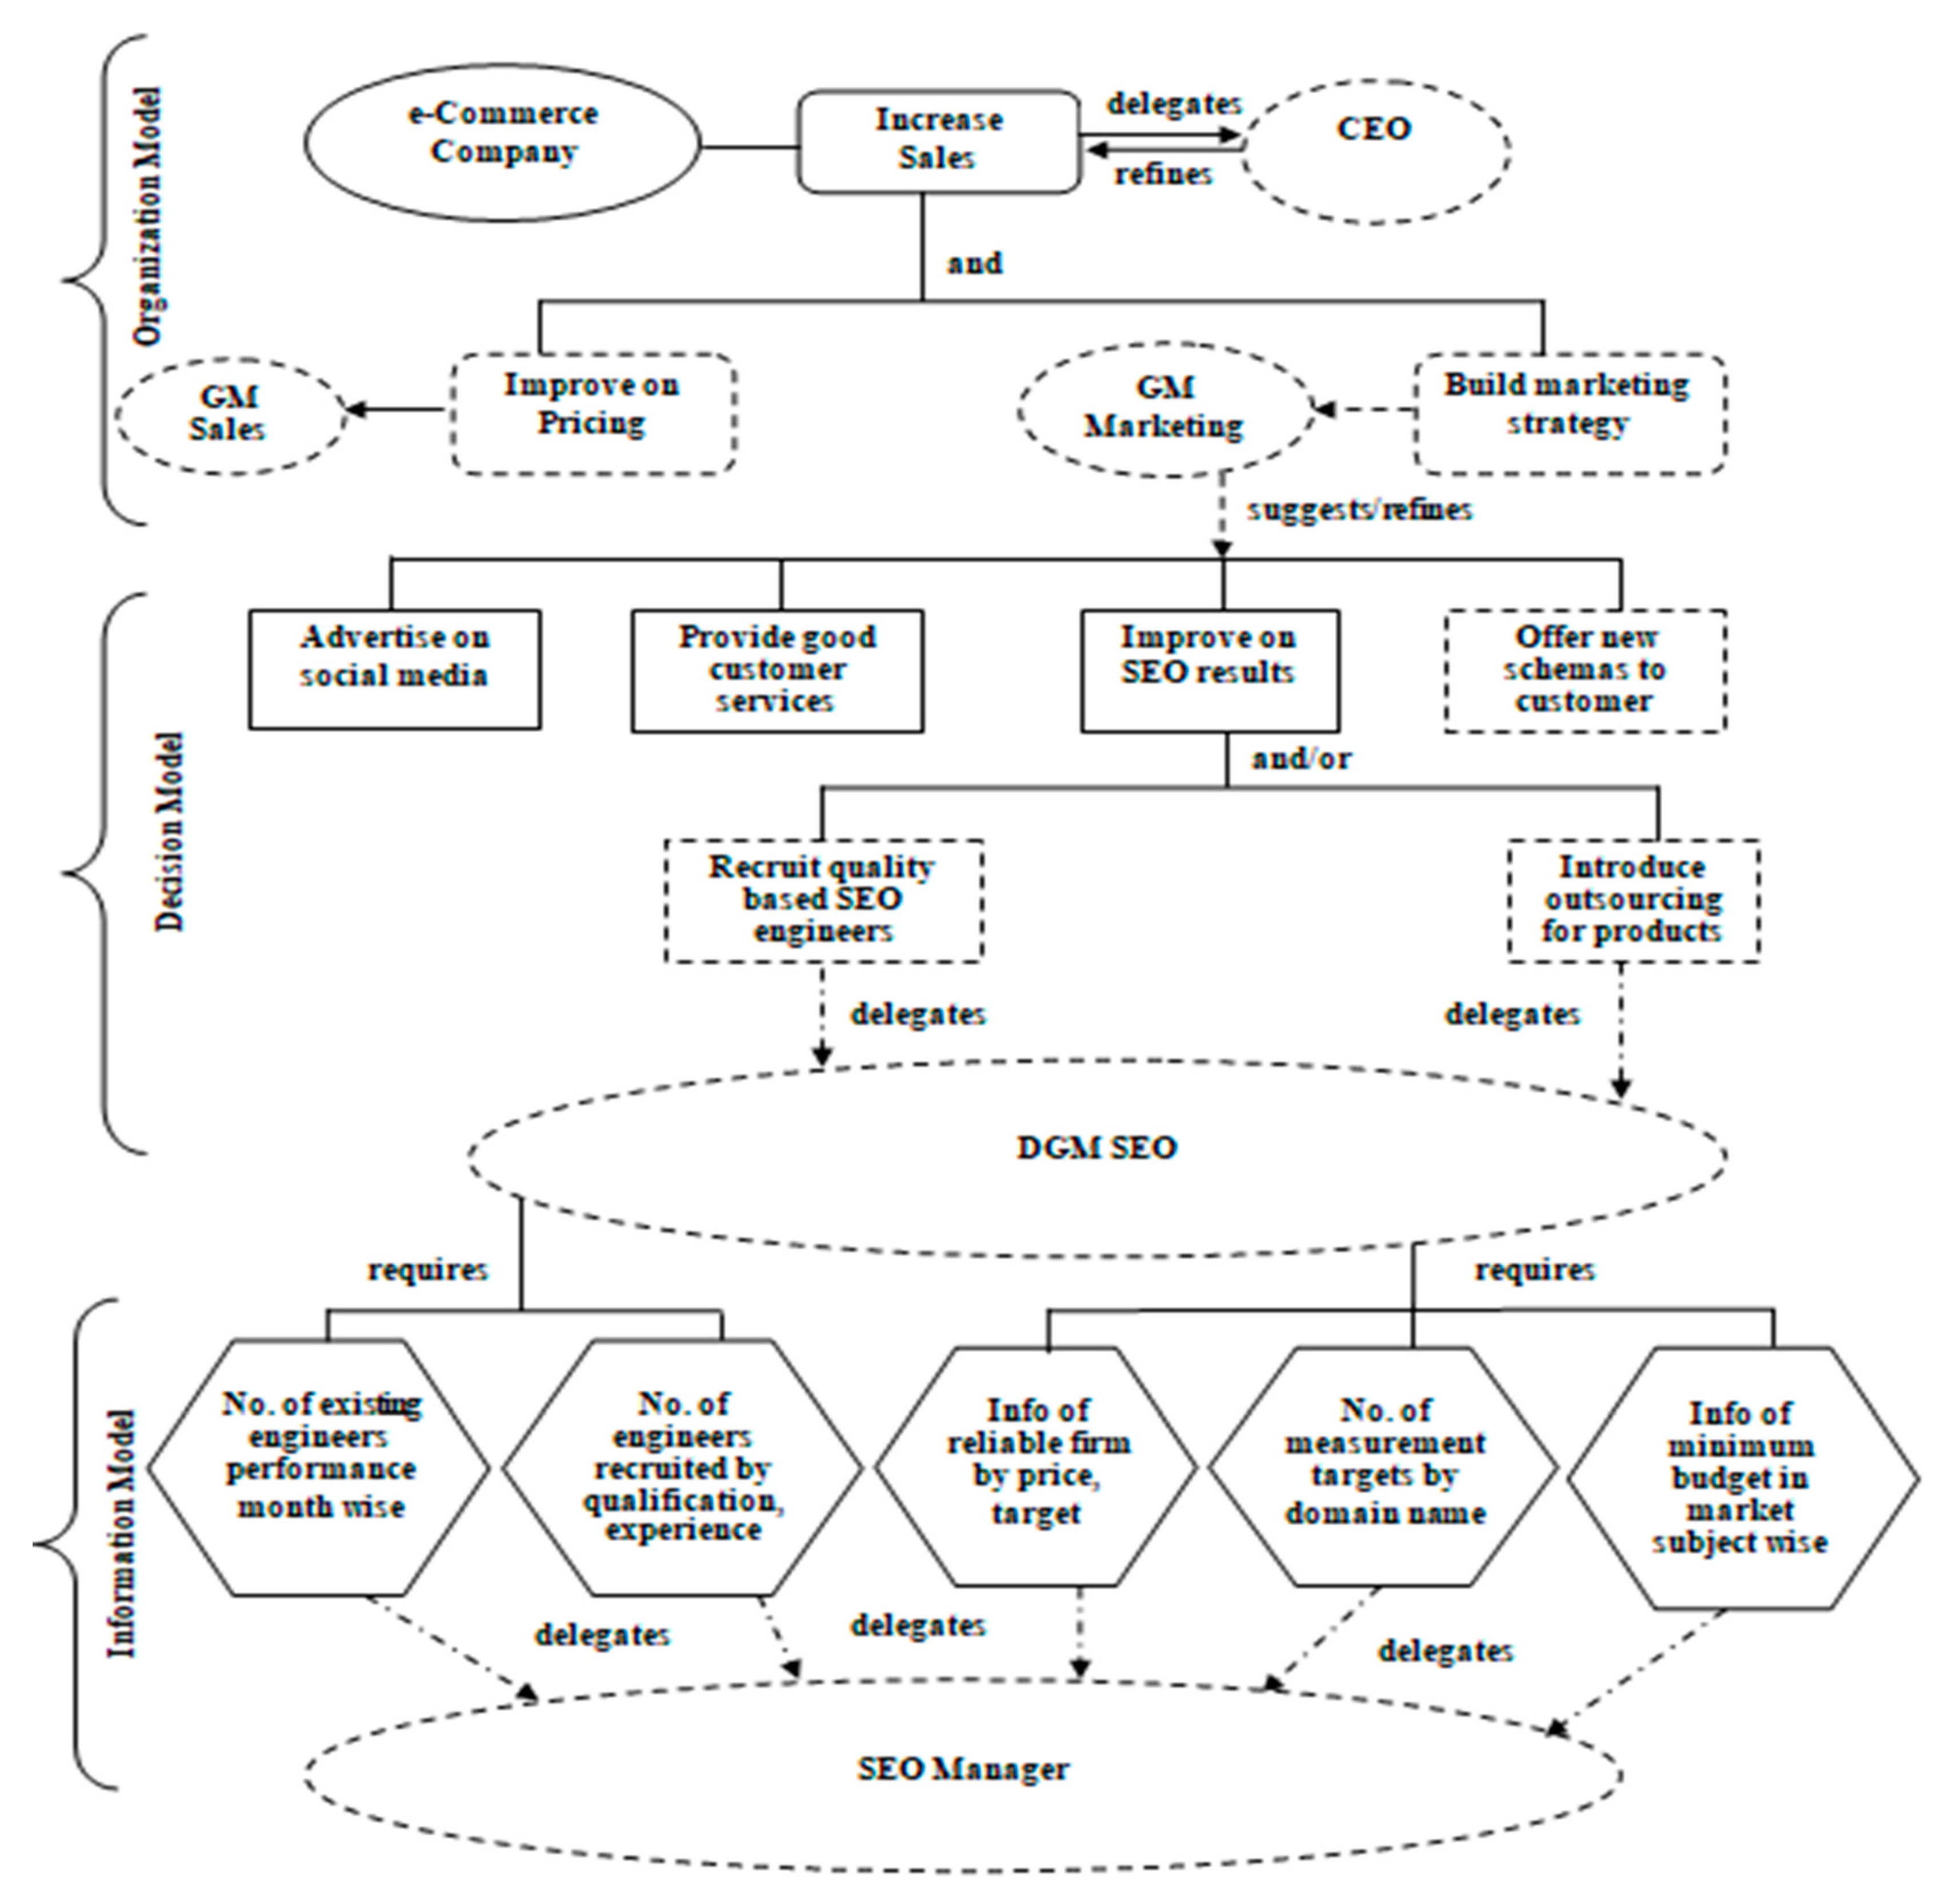
- Q1: Which type of goals do we need to increase the sales of the company?
- Q2: What type of decisions do we need to take to improve search engine optimization results?
- Q3: If we need to introduce outsourcing for products, then which information do we need to add?
- Q4: Which agent do we need who will tell the best employee performance?
4.2. Research Methodology
4.2.1. K-Means Clustering Technique
4.2.2. Logistic Regression Analysis
4.2.3. ML Techniques Used in This Investigation
NB Classifier
LDA with DT Classifier
RL Classifier
VR Classifier
Hybrid Classifier
4.3. Performance Parameters Used in This Study
- Accuracy: This is determined by dividing the proportion of DW requirements schemas accurately anticipated to be understandable or non-understandable by the total number of requirements schemas. Mathematically, it can be expressed as:
- 2.
- Sensitivity (recall): The potential of a classification model can be determined by using sensitivity, which is evaluated as the percentage of DW requirements schemas correctly predicted as understandable. Therefore, a higher sensitivity value indicates a better model. Mathematically, we can express this as,
- 3.
- Specificity or True Negative Rate (TNR): This aims to identify negative results and is also crucial for analyzing and comparing the performance of prediction models. It is measured as the proportion of accurately predicted non-understandable DW requirements schemas. Mathematically, it is expressed as:
- 4.
- AUC: Generalizing findings solely based on accuracy metrics can be challenging [59,60], and results may vary with false positives (specificity) at different cutoff points [61]. To address this, ROC plot analysis and the AUC measure are used [47], with each ROC point reflecting sensitivity and specificity for a given threshold [62]. In this study, AUC values are evaluated to assess model performance, with values ≤0.5 deemed poor and values between 0.9 and 1.0 considered excellent.
- Additionally, this investigation includes four characteristics of the LR technique, which are implemented along with the classification performance parameters discussed above:
- 1.
- Statistical Significance (Sig.): This determines the coefficient’s (Bi’s) significance level. A higher value of Sig. results in a lower estimated impact of the requirements metrics (independent variables). We chose the widely accepted value of 0.05 as the significance level to test the hypothesis (see Section 4.1.3).
- 2.
- Odds Ratio: This is measured for each requirements metric (independent variable) using Sig. Essentially, it represents the possibility of the event (i.e., understandable requirements schemas) divided by the non-event (non-understandable requirements schemas).
- 3.
- R2 Statistic: This statistic calculates the proportion of variance in understandability described by the requirements metrics variance. A higher R2 value indicates a larger effect on requirements metrics and results in a more accurate requirements model. In this investigation, we have used R2 values for univariate models and adjusted R2 for multivariate models.
- 4.
- Kappa Statistic: The kappa value measures the agreement between actual and expected DW requirements, with higher values indicating better correspondence. Specifically, values between 0.80 and 1.00 denote almost perfect agreement, 0.61 to 0.80 signify substantial agreement, 0.41 to 0.60 suggest moderate agreement, 0.21 to 0.40 indicate fair agreement, 0.00 to 0.20 show slight agreement, and negative values represent poor agreement [63].
4.4. Cross-Validation
5. Results and Discussion
5.1. Statistical Analysis Results
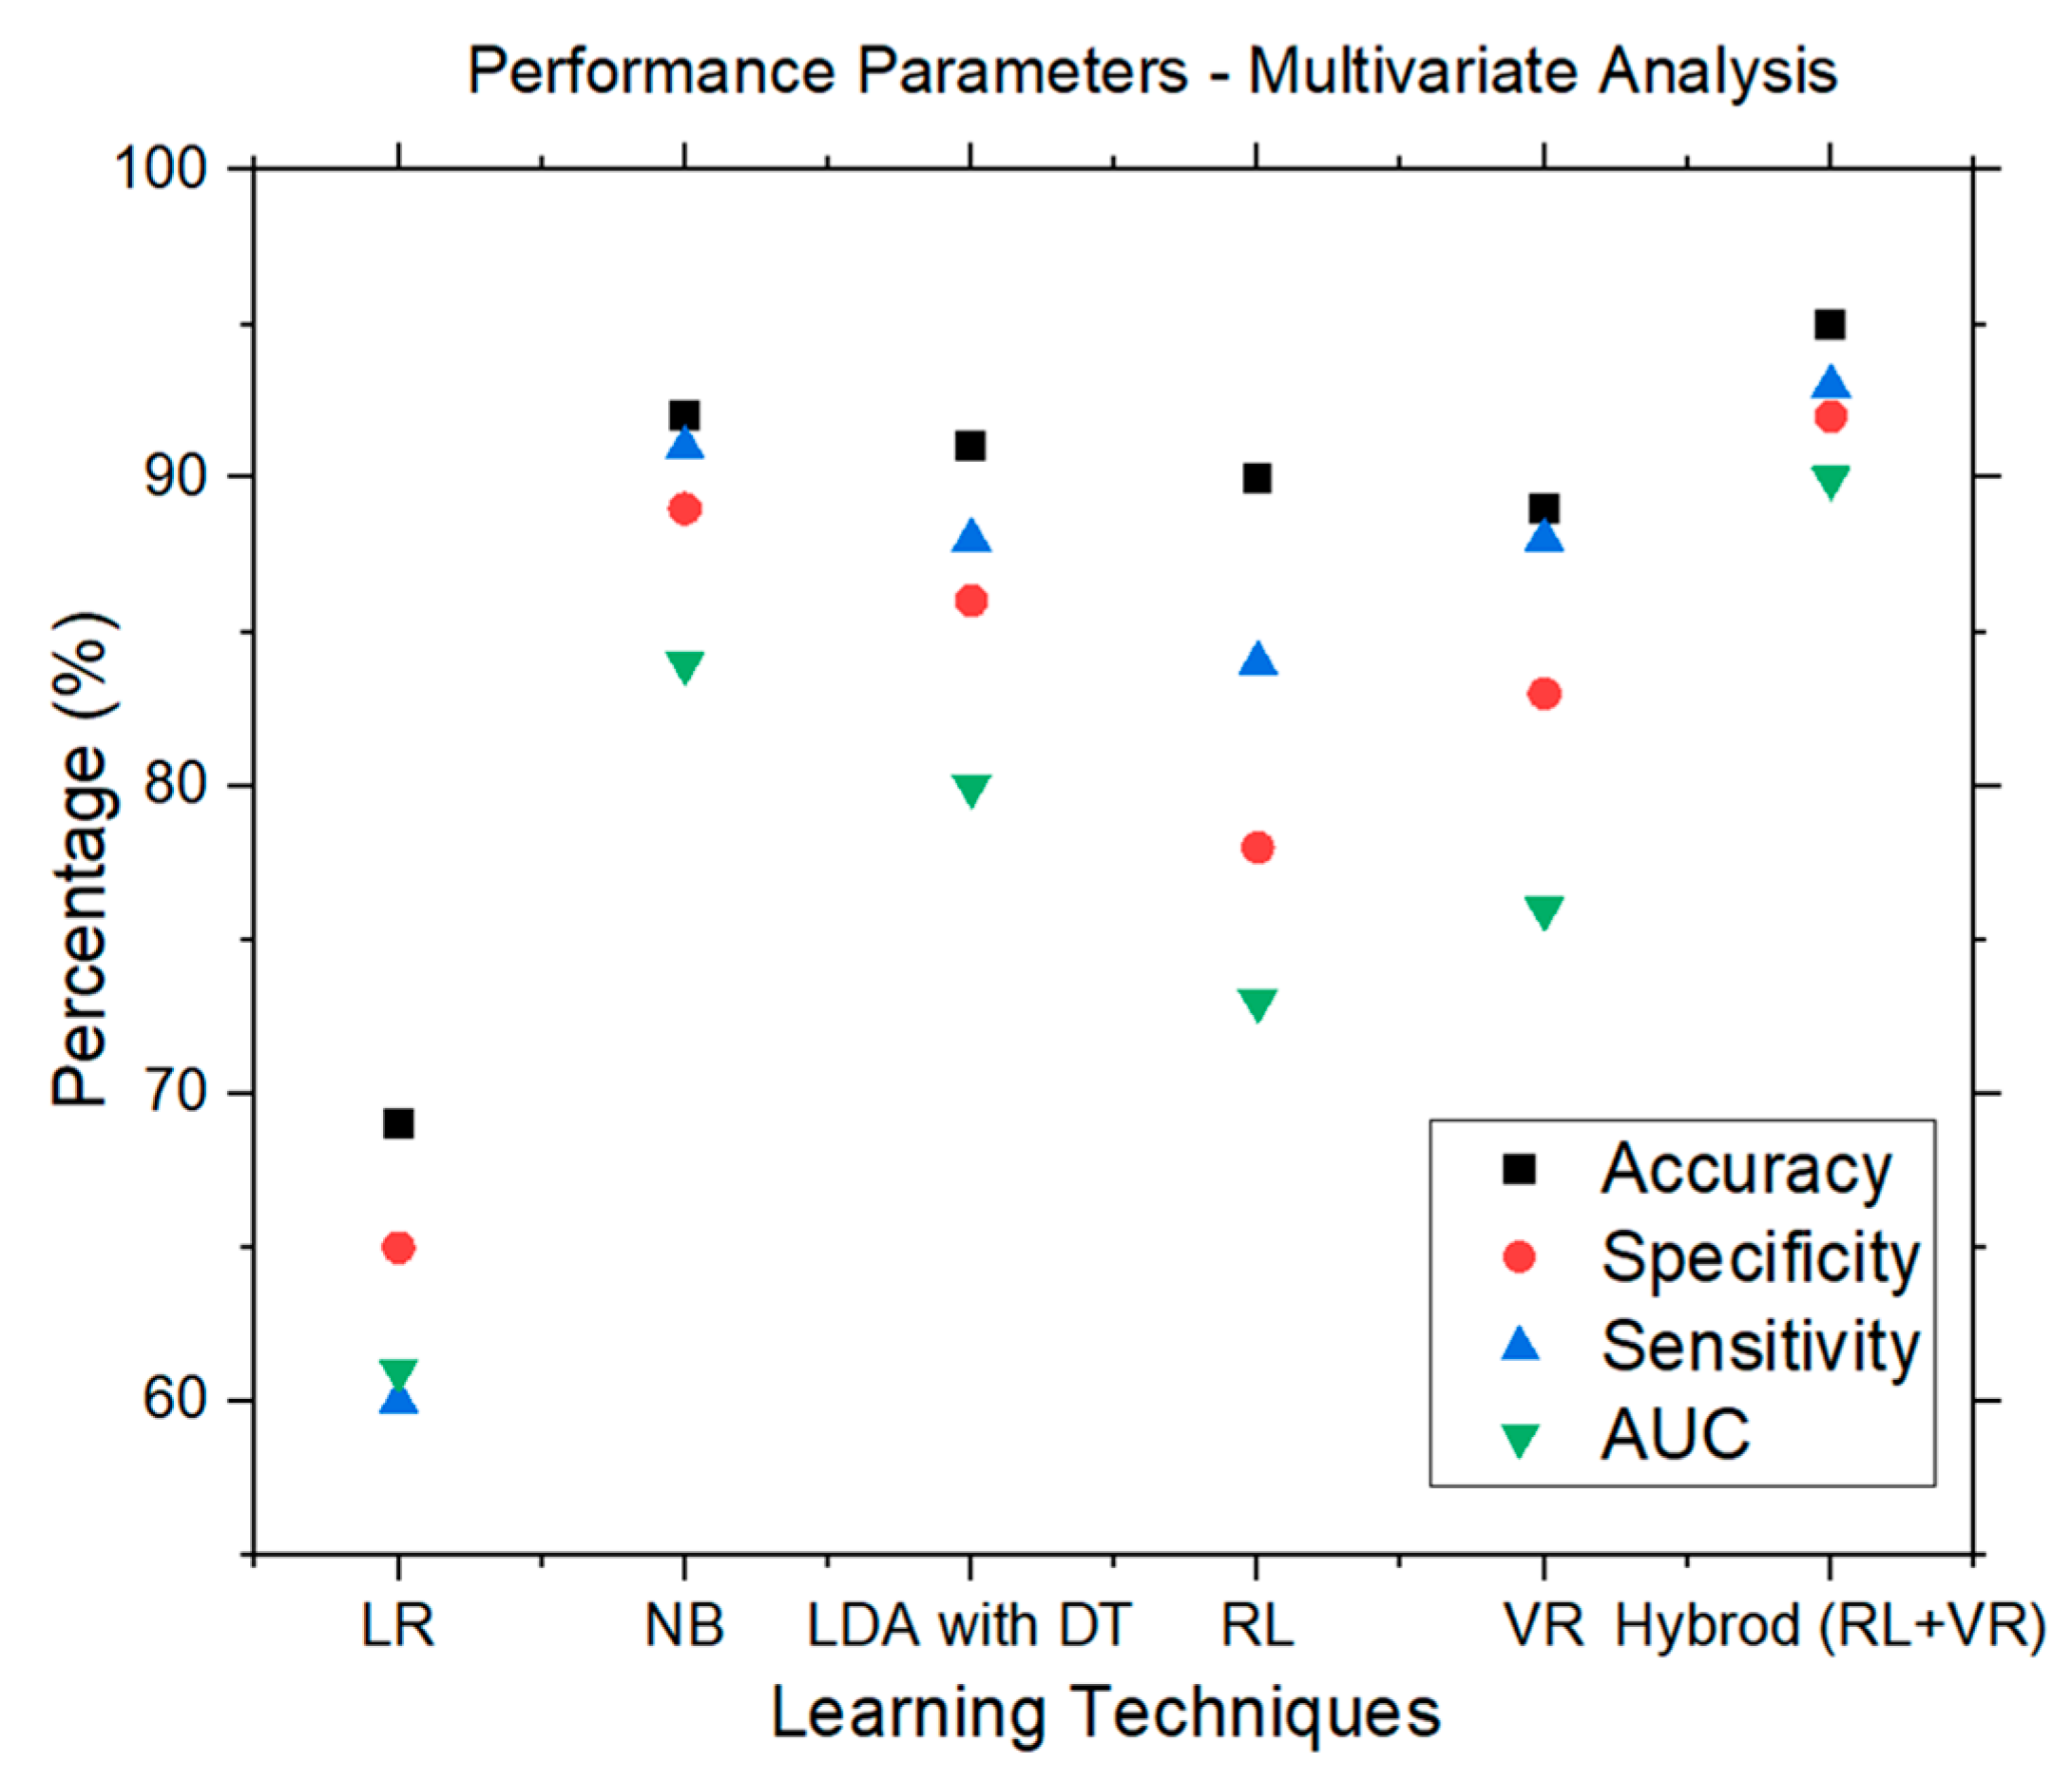
5.2. Result Analysis: LR and ML
5.2.1. Univariate Analysis Results
Univariate Analysis Results—LR Characteristics
Univariate Analysis Results—LR
Univariate Analysis Results—NB
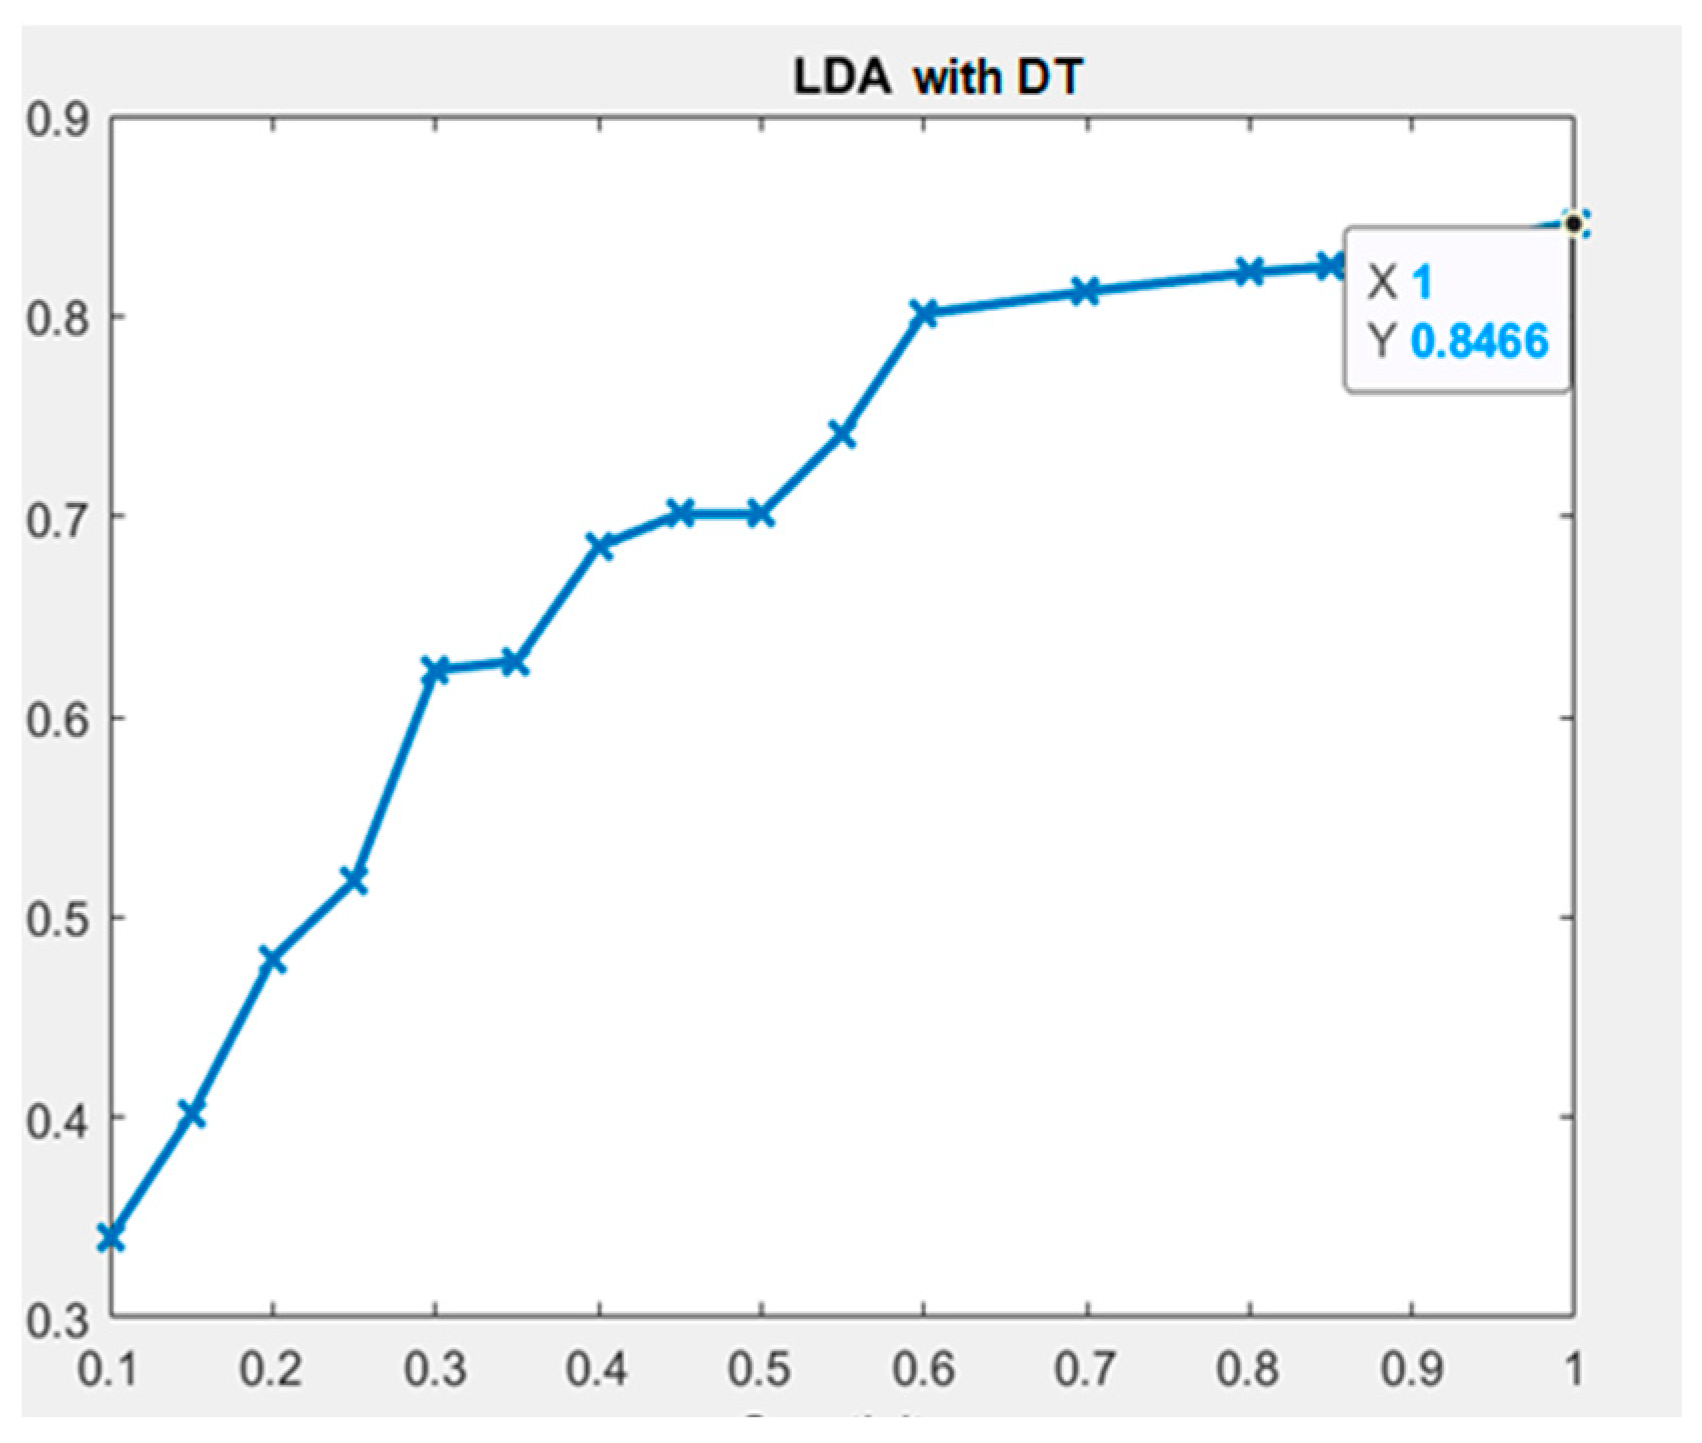
Univariate Analysis Results—LDA with DT
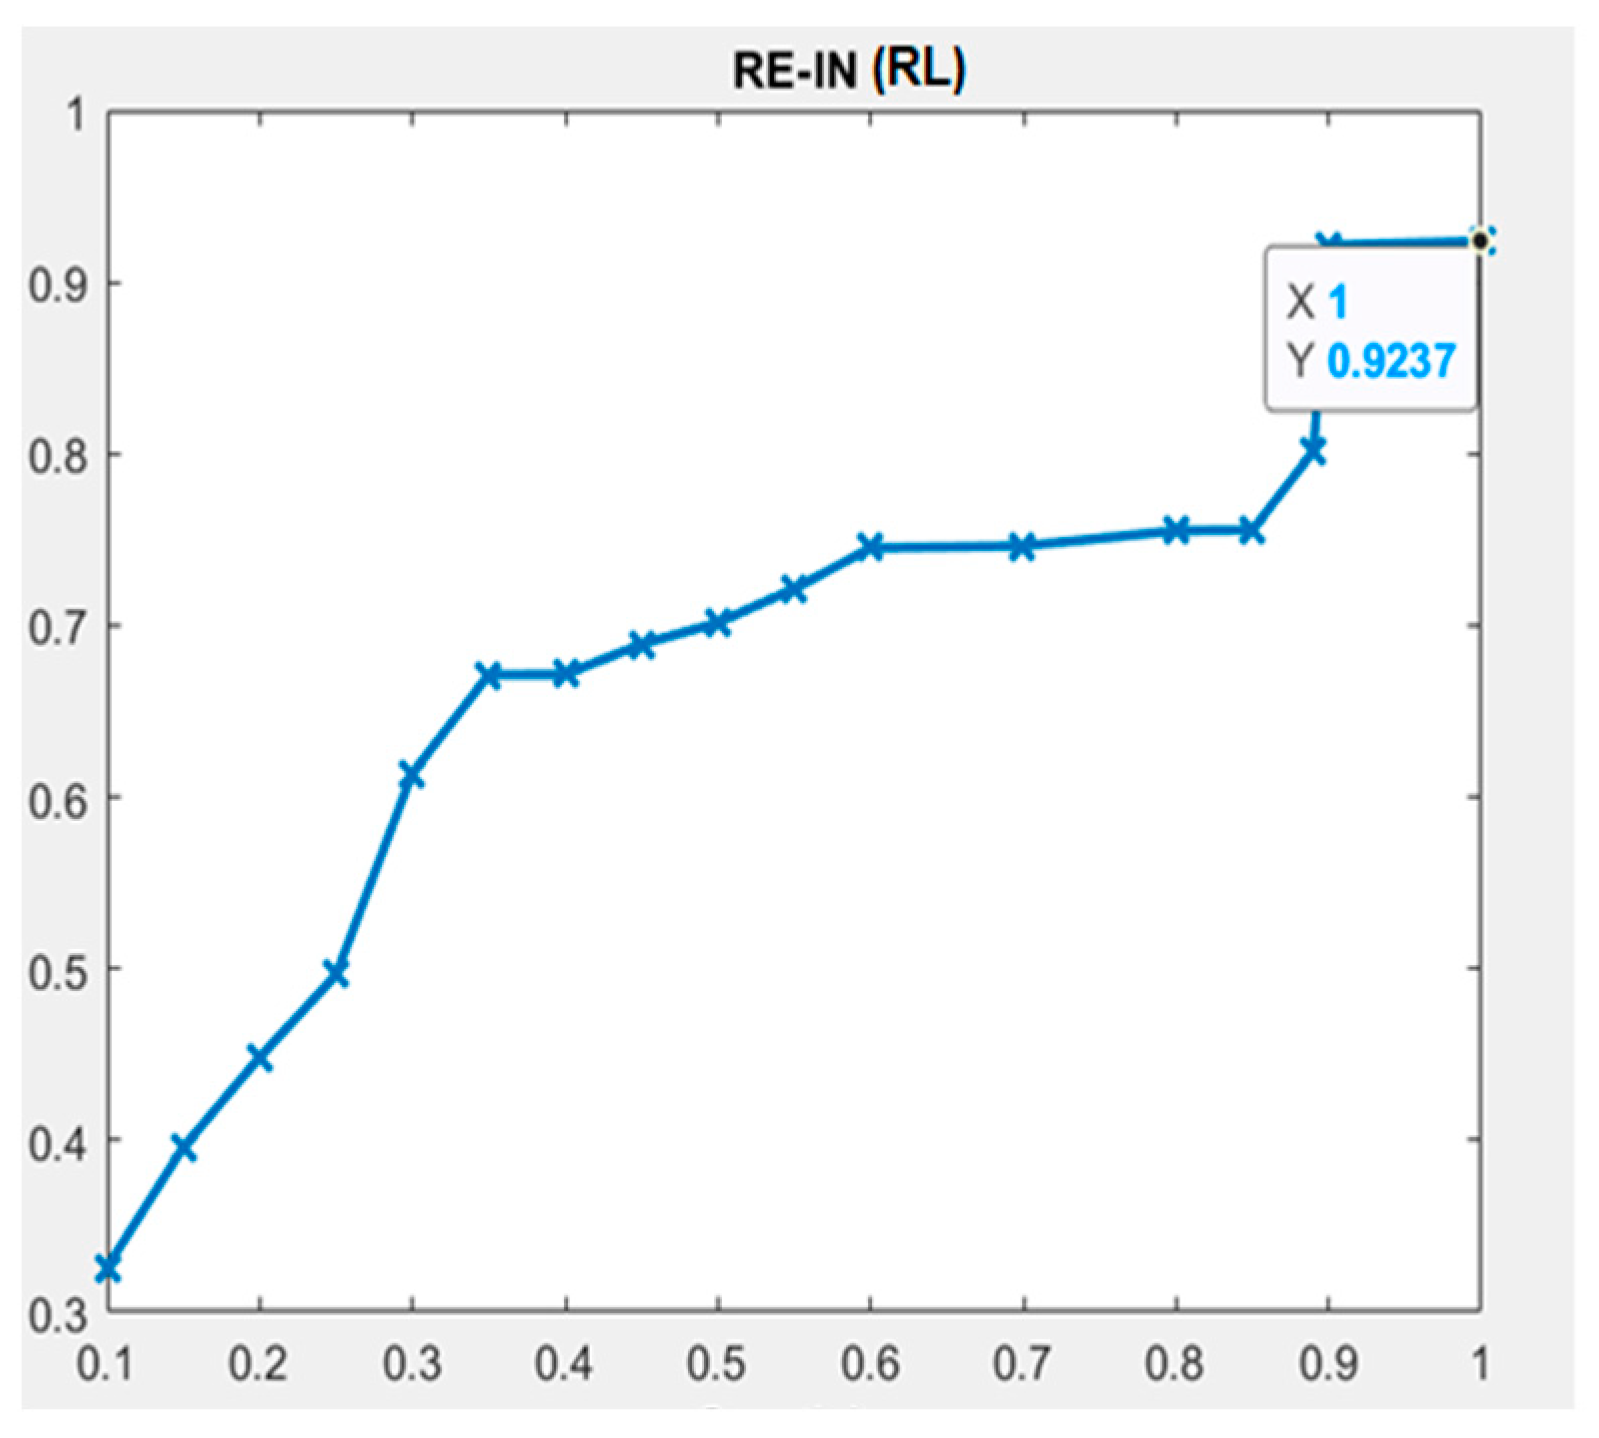
Univariate Analysis Results—RL
Univariate Analysis Results—VR
Univariate Analysis Results—Hybrid (RL and VR)
5.2.2. Multivariate Analysis Results
5.3. Validation of Hypothesis (H0 to H17)
5.4. Comparing Multivariate Predictive Models and Validation of H18 Hypothesis
6. Threats to Validity
- Construct Validity: In our experimental inquiry, construct validity pertains to the precision with which the instruments measured the independent and dependent variables. The concept validity of the dependent variable is guaranteed by the measurement technique employed to understand time—the amount of time subjects took to answer the questions in each requirements schema. Furthermore, as the independent variables (requirements metrics) were explicitly validated using Briand’s methodology, the construct validity of the variables has been guaranteed [21,25].
- Within-Subject Design Approach: A within-subject design strategy was used in our inquiry to reduce error differences among participants when they responded to questions in their mental states. The experiment involved 56 students (subjects) from M.Tech. and B.Tech. programs in a monitored environment. While we acknowledge that 56 subjects may not be sufficient to achieve generalizable results, we aimed to generalize the findings through experiments involving professionals with larger datasets. Additionally, the subjects were volunteers and were motivated to experiment.
- Recording of Time: The experiment was conducted in a controlled environment. Subjects themselves recorded the starting and ending times of each requirement schema, ensuring more accurate results compared to employing other individuals for time recording. The entire process took six days to finish, and each subject worked on the experiment for an average of less than an hour every day—a shorter amount of time than one practical class. Therefore, the fatigue effect was minimal within this time range.
- Diversity of DW Requirements Schemas: To provide a diversified dataset, we built DW requirements schemas from various domains. But further research requires more trials using actual, bigger, more intricate schemas.
- Statistical Validity: Statistical validity refers to the degree to which conclusions are statistically validated. One potential concern in our investigation is the size of the data model (56 subjects and 28 schemas), which we believe is insufficient for empirical investigation. While there are only a few similar empirical studies in the literature [24,26], we aimed to address this limitation by performing replicated experiments with larger datasets in different studies to generalize the results.
7. Conclusions and Future Scope
- The metrics NSA, NSG, NDH, NI, NCGTBC, NSGTBC, NCDTBC, NDI, NDG, NID, NDGI, NGI, and NIG were identified as significant predictors of DW requirements schema understandability using LR characteristics, while NGH, NSD, NSDTBC, and NGD were not found to be good predictors.
- The NID metric emerged as an excellent predictor for schema understandability using learning techniques, whereas the NDH, NDI, and NDG metrics were found to be highly significant predictors.
- A few metrics like NSA, NSG, NI, NCGTBC, NSGTBC, NCDTBC, NDGI, NGI, and NIG showed moderate performance across all parameters.
- The NGH, NSD, NSDTBC, and NGD metrics were not significant in predicting schema understandability.
- ROC analysis (AUC values) indicated that the hybrid model (RL + VR), along with NB, LDA with DT, VR, and RL, outperformed the LR technique in predicting schema understandability.
- The study concludes that ML techniques are beneficial for building adaptable models for DW systems, enhancing the prediction of requirements schema understandability.
Author Contributions
Funding
Data Availability Statement
Conflicts of Interest
References
- Inmon, W.H. The data warehouse and data mining. Commun. ACM 1996, 39, 49–51. [Google Scholar] [CrossRef]
- Bouzeghoub, M.; Kedad, Z. Quality in data warehousing. In Information and Database Quality; Springer: Boston, MA, USA, 2002; pp. 163–198. [Google Scholar] [CrossRef]
- Rizzi, S.; Abelló, A.; Lechtenbörger, J.; Trujillo, J. Research in data warehouse modeling and design: Dead or alive? In Proceedings of the 9th ACM international workshop on Data warehousing and OLAP, Arlington, VA, USA, 10 November 2006; pp. 3–10. [Google Scholar]
- English, L. Information Quality Improvement: Principles, Methods and Management, Seminar; Information Impact International: Brentwood, TN, USA, 1996. [Google Scholar]
- Serrano, M.; Trujillo, J.; Calero, C.; Piattini, M. Metrics for data warehouse conceptual models understandability. Inf. Softw. Technol. 2007, 49, 851–870. [Google Scholar] [CrossRef]
- Lehner, W.; Albrecht, J.; Wedekind, H. Normal forms for multidimensional databases. In Proceedings of the Tenth International Conference on Scientific and Statistical Database Management (Cat. No. 98TB100243), Capri, Italy, 3 July 1998; pp. 63–72. [Google Scholar]
- Vassiliadis, P. Gulliver in the land of data warehousing: Practical experiences and observations of a researcher. In Proceedings of the Second Intl. Workshop on Design and Management of Data Warehouses, DMDW 2000, Stockholm, Sweden, 5–6 June 2000; p. 12. [Google Scholar]
- Salinesi, C.; Gam, I. How Specific Should Requirements Engineering Be in the Context of Decision Information Systems? In Proceedings of the 2009 Third International Conference on Research Challenges in Information Science, Fez, Morocco, 22–24 April 2009; IEEE: Piscataway, NJ, USA, 2009. [Google Scholar]
- Frendi, M.; Salinesi, C. Requirements engineering for data warehousing. In Proceedings of the 9th International Workshop on Requirements Engineering: Foundations of Software Quality, Klagenfurt/Velden, Austria, 16–17 June 2003. [Google Scholar]
- Mazón, J.N.; Pardillo, J.; Trujillo, J. A model-driven goal-oriented requirement engineering approach for data warehouses. In International Conference on Conceptual Modeling; Springer: Berlin/Heidelberg, Germany, 2007; pp. 255–264. [Google Scholar]
- Schiefer, J.; List, B.; Bruckner, R. A holistic approach for managing requirements of data warehouse systems. In Proceedings of the AMCIS 2002, Eighth Americas Conference on Information Systems, Dallas, TX, USA, 9–11 August 2002; p. 13. [Google Scholar]
- Fenton, N.; Melton, A. Deriving structurally based software measures. J. Syst. Softw. 1990, 12, 177–187. [Google Scholar] [CrossRef]
- Fenton, N.; Bieman, J. Software Metrics: A rigorous and Practical Approach; CRC Press: Boca Raton, FL, USA, 2014. [Google Scholar]
- Gaur, H.; Kumar, M. Assessing the understandability of a data warehouse logical model using a decision-tree approach. ACM SIGSOFT Softw. Eng. Notes 2014, 39, 1–6. [Google Scholar] [CrossRef]
- Serrano, M. Definition of a Set of Metrics for Assuring Data Warehouse Quality. Ph.D. Thesis, Univeristy of Castilla, La Mancha, Spain, 2004. [Google Scholar]
- Inmon, W.H. Building the Data Warehouse; John Wiley & Sons: Hoboken, NJ, USA, 2005. [Google Scholar]
- Kimball, R.; Ross, M. The Data Warehouse Lifecycle Toolkit, 2nd ed.; John Wiley & Sons: New York, NY, USA, 2002. [Google Scholar]
- Gosain, A.; Singh, J. Comprehensive complexity metric for data warehouse multidimensional model understandability. IET Softw. 2020, 14, 275–282. [Google Scholar] [CrossRef]
- Kumar, M.; Gosain, A.; Singh, Y. Empirical validation of structural metrics for predicting understandability of conceptual schemas for data warehouse. Int. J. Syst. Assur. Eng. Manag. 2014, 5, 291–306. [Google Scholar] [CrossRef]
- Serrano, M.; Calero, C.; Trujillo, J.; Luján-Mora, S.; Piattini, M. Empirical validation of metrics for conceptual models of data warehouses. In International Conference on Advanced Information Systems Engineering; Springer: Berlin/Heidelberg, Germany, 2004; pp. 506–520. [Google Scholar]
- Kumar, M. Validation of data warehouse requirements-model traceability metrics using a formal framework. In Proceedings of the 2015 2nd International Conference on Computing for Sustainable Global Development (INDIACom), New Delhi, India, 11–13 March 2015; IEEE: Piscataway, NJ, USA, 2015; pp. 216–221. [Google Scholar]
- Kumar, M.; Gosain, A.; Singh, Y. Quality-oriented requirements engineering approach for data warehouse. Int. J. Comput. Syst. Eng. 2012, 1, 127–138. [Google Scholar] [CrossRef]
- Kumar, M.; Gosain, A.; Singh, Y. On completeness and traceability metrics for data warehouse requirements engineering. Int. J. Comput. Syst. Eng. 2013, 1, 229–237. [Google Scholar] [CrossRef]
- Singh, T.; Kumar, M. Empirical Validation of Requirements Traceability Metrics for Requirements Model of Data Warehouse using SVM. In Proceedings of the 2020 IEEE 17th India Council International Conference (INDICON), New Delhi, India, 10–13 December 2020; IEEE: Piscataway, NJ, USA, 2020; pp. 1–5. [Google Scholar]
- Singh, T.; Kumar, M. Formally Investigating Traceability Metrics of Data Warehouse Requirements Model Using Briand’s Framework. In Proceedings of the 5th International Conference on Intelligent Computing and Control Systems (ICICCS), Madurai, India, 6–8 May 2021; IEEE: Piscataway, NJ, USA, 2021. [Google Scholar]
- Singh, T.; Kumar, M. Empirical study to predict the understandability of requirements schemas of data warehouse using requirements metrics. Int. J. Intell. Eng. Inform. 2021, 9, 329–354. [Google Scholar] [CrossRef]
- Singh, T.; Kumar, M. Theoretical Validation of Data Warehouse Requirements Metrics Based on Agent Goal Decision Information Model Using Zuse’s Framework. In The Communication and Intelligent Systems: Proceedings of ICCIS 2021; Springer Nature: Singapore, 2022; pp. 107–118. [Google Scholar]
- Singh, T.; Kumar, M. Investigating requirements completeness metrics for requirements schemas using requirements engineering approach of data warehouse: A formal and empirical validation. Arab. J. Sci. Eng. 2022, 47, 9527–9546. [Google Scholar] [CrossRef]
- Singh, T.; Patidar, V.; Singh, M. A novel metric for assessing structural complexity of data warehouse requirements models. Expert Syst. Appl. 2024, 255, 124754. [Google Scholar] [CrossRef]
- Singh, T.; Kaushik, B. Employ Metrics in the Data Warehouse’s Requirements Model for Hospitals. In Handbook on Augmenting Telehealth Services; CRC Press: Boca Raton, FL, USA, 2024; pp. 349–367. [Google Scholar]
- Williams, D.W.; Hall, T.; Kennedy, M. A framework for improving the requirements engineering process management. Softw. Qual. J. 1999, 8, 133–147. [Google Scholar] [CrossRef]
- Böhnlein, M.; Ulbrich-vom Ende, A. Business process oriented development of data warehouse structures. In Data Warehousing; Physica: Heidelberg, Germany, 2000; pp. 3–21. [Google Scholar]
- Winter, R.; Strauch, B. A method for demand-driven information requirements analysis in data warehousing projects. In Proceedings of the 36th Annual Hawaii International Conference on System Sciences, Waikoloa Village, HI, USA, 6–9 January 2003; IEEE: Piscataway, NJ, USA, 2003; p. 9. [Google Scholar]
- Winter, R.; Strauch, B. Information requirements engineering for data warehouse systems. In Proceedings of the 2004 ACM symposium on Applied computing, Nicosia, Cyprus, 14–17 March 2004; pp. 1359–1365. [Google Scholar]
- Kumar, M.; Gosain, A.; Singh, Y. Stakeholders driven requirements engineering approach for data warehouse development. J. Inf. Process. Syst. 2010, 6, 385–402. [Google Scholar] [CrossRef]
- Kumar, M.; Gosain, A.; Singh, Y. A novel requirements engineering approach for designing data warehouses. Int. J. Syst. Assur. Eng. Manag. 2016, 7, 205–221. [Google Scholar] [CrossRef]
- Amalfitano, D.; De Simone, V.; Scala, S.; Fasolino, A.R. A model-driven engineering approach for supporting questionnaire-based gap analysis processes through application lifecycle management systems. Softw. Qual. J. 2020, 28, 535–565. [Google Scholar] [CrossRef]
- Pargaonkar, S. Synergizing Requirements Engineering and Quality Assurance: A Comprehensive Exploration in Software Quality Engineering. Int. J. Sci. Res. 2023, 12, 2003–2007. [Google Scholar] [CrossRef]
- Prakash, N.; Gosain, A. Requirements Driven Data Warehouse Development. In Proceedings of the CAiSE short paper proceedings, Klagenfurt/Velden, Austria, 16–20 June 2003; Volume 252. [Google Scholar]
- Basili, V.R.; Weiss, D.M. A methodology for collecting valid software engineering data. IEEE Trans. Softw. Eng. 1984, 6, 728–738. [Google Scholar] [CrossRef]
- Wohlin, C.; Runeson, P.; Höst, M.; Ohlsson, M.C.; Regnell, B.; Wesslén, A. In Experimentation in Software Engineering; Springer Science & Business Media: Berlin/Heidelberg, Germany, 2012. [Google Scholar]
- Van Solingen, R.; Basili, V.; Caldiera, G.; Rombach, H.D. Goal question metric (gqm) approach. Encycl. Softw. Eng. 2002. [Google Scholar] [CrossRef]
- Carver, J.; Jaccheri, L.; Morasca, S.; Shull, F. Using empirical studies during software courses. In Empirical Methods and Studies in Software Engineering; Springer: Berlin/Heidelberg, Germany, 2003; pp. 81–103. [Google Scholar]
- Kitchenham, B.A.; Pfleeger, S.L.; Pickard, L.M.; Jones, P.W.; Hoaglin, D.C.; El Emam, K.; Rosenberg, J. Preliminary guidelines for empirical research in software engineering. IEEE Trans. Softw. Eng. 2002, 28, 721–734. [Google Scholar] [CrossRef]
- Serrano, M.A.; Calero, C.; Sahraoui, H.A.; Piattini, M. Empirical studies to assess the understandability of data warehouse schemas using structural metrics. Softw. Qual. J. 2008, 16, 79–106. [Google Scholar] [CrossRef]
- Arthur, D.; Vassilvitskii, S. Worst-case and smoothed analysis of the ICP algorithm, with an application to the k-means method. In Proceedings of the 2006 47th Annual IEEE Symposium on Foundations of Computer Science (FOCS’06), Berkeley, CA, USA, 21–24 October 2006; IEEE: Piscataway, NJ, USA, 2006; pp. 153–164. [Google Scholar]
- Hosmer, D.W.; Lemeshow, S. Applied Logistic Regression; John Wiley & Sons: New York, NY, USA, 2000. [Google Scholar]
- Gosain, A.; Singh, J. Investigating structural metrics for understandability prediction of data warehouse multidimensional schemas using machine learning techniques. Innov. Syst. Softw. Eng. 2018, 14, 59–80. [Google Scholar] [CrossRef]
- Dejaeger, K.; Verbraken, T.; Baesens, B. Toward comprehensible software fault prediction models using bayesian network classifiers. IEEE Trans. Softw. Eng. 2012, 39, 237–257. [Google Scholar] [CrossRef]
- John, G.H.; Langley, P. Estimating continuous distributions in Bayesian classifiers. arXiv 2013, arXiv:1302.4964. [Google Scholar]
- Izenman, A.J. Linear discriminant analysis. In Modern Multivariate Statistical Techniques; Springer: New York, NY, USA, 2013; pp. 237–280. [Google Scholar]
- Safavian, S.R.; Landgrebe, D. A survey of decision tree classifier methodology. IEEE Trans. Syst. Man Cybern. 1991, 21, 660–674. [Google Scholar] [CrossRef]
- Sarker, I.H.; Colman, A.; Han, J.; Khan, A.I.; Abushark, Y.B.; Salah, K. Behavdt: A behavioral decision tree learning to build user-centric context-aware predictive model. Mob. Netw. Appl. 2020, 25, 1151–1161. [Google Scholar] [CrossRef]
- Neves, M.; Vieira, M.; Neto, P. A study on a Q-Learning algorithm application to a manufacturing assembly problem. J. Manuf. Syst. 2021, 59, 426–440. [Google Scholar] [CrossRef]
- Pourpanah, F.; Tan, C.J.; Lim, C.P.; Mohamad-Saleh, J. A Q-learning-based multi-agent system for data classification. Appl. Soft Comput. 2017, 52, 519–531. [Google Scholar] [CrossRef]
- Kittler, J.; Alkoot, F.M. Sum versus vote fusion in multiple classifier systems. IEEE Trans. Pattern Anal. Mach. Intell. 2003, 25, 110–115. [Google Scholar] [CrossRef]
- Sokolova, M.; Japkowicz, N.; Szpakowicz, S. Beyond accuracy, F-score and ROC: A family of discriminant measures for performance evaluation. In Australasian Joint Conference on Artificial Intelligence; Springer: Berlin/Heidelberg, Germany, 2006; pp. 1015–1021. [Google Scholar]
- Witten, I.H.; Frank, E. Data mining: Practical machine learning tools and techniques with Java implementations. AcmSigmod Rec. 2002, 31, 76–77. [Google Scholar] [CrossRef]
- Koru, A.G.; Liu, H. Building effective defect-prediction models in practice. IEEE Softw. 2005, 22, 23–29. [Google Scholar] [CrossRef]
- El Emam, K.; Benlarbi, S.; Goel, N.; Rai, S. A Validation of Object-Oriented Metrics; National Research Council Canada, Institute for Information Technology: Ottawa, ON, Canada, 1999. [Google Scholar]
- Briand, L.C.; Wüst, J.; Daly, J.W.; Porter, D.V. Exploring the relationships between design measures and software quality in object-oriented systems. J. Syst. Softw. 2000, 51, 245–273. [Google Scholar] [CrossRef]
- Fawcett, T. An introduction to ROC analysis. Pattern Recognit. Lett. 2006, 27, 861–874. [Google Scholar] [CrossRef]
- Landis, J.R.; Koch, G.G. The measurement of observer agreement for categorical data. Biometrics 1977, 33, 159–174. [Google Scholar] [CrossRef] [PubMed]
- Stone, M. Cross-validatory choice and assessment of statistical predictions. J. R. Stat. Soc. Ser. B 1974, 36, 111–133. [Google Scholar] [CrossRef]


| Author and Year | Metrics Used | Requirements Model | Validation (Theoretical/Empirical) | Techniques | Analysis (Univarite/Multivariate) | Findings |
|---|---|---|---|---|---|---|
| Kumar et al. [22] | Quality oriented RE approach | Banking requirements model | Guidelines for new approach | AGDI approach | Univariate | To ensure the quality of requirements models |
| Kumar et al. [23] | Completeness and traceability metrics | Banking requirements model | - | AGDI Model | Univariate | Metrics successfully applied on early and late requirements model |
| Kumar [21] | Traceability metrics | Banking requirements model | Theoretical | Size measure of Briand’s framework | Univariate | Successfully validated theoretically and found correct and valid |
| Singh and Kumar [24] | Traceability metrics | IT industry requirements model | Empirical | Support vector machine (SVM) | Univariate | Successfully predicted requirements model understandability |
| Singh and Kumar [25] | Traceability metrics | Hospital requirements model | Theoretical | Cohesion and coupling measure of Briand’s framework | Univariate | Successfully validated theoretically and found correct and valid |
| Singh and Kumar [26] | Completeness and traceability metrics | Library requirements model | Empirical | Artificial neural networks (ANN) and random forests (RF) | Univariate | Successfully predicted requirements model understandability |
| Singh and Kumar [27] | Traceability metrics | Railways requirements model | Theoretical | Zuse’s formal framework | Univariate | Successfully validated theoretically and found correct and valid |
| Singh and Kumar [28] | Completeness metrics | Manufacturing industry requirements model | Theoretical and Empirical | Size, complexity, cohesion and coupling measure of Briand’s framework; correlation analysis and linear regression | Univariate | Successfully validated theoretically and found correct and valid. Metrics exhibited a strong correlation and can be utilized to predict model understandability |
| Singh et al. [29] | Structural complexity metrics | Manufacturing industry requirements model | Theoretical | Complexity measure of Briand’s framework | Univariate | Successfully validated theoretically and found correct and valid |
| Our Proposed Study: | ||||||
| Singh, T., Patidar, V., Singh, M. and Rocha, A. | Completeness and traceability metrics | e-Commerce company requirements model | Empirical | Statistical (LR) and ML (NB, LDA with DT, RL, VR, and hybrid (RL + VR)) techniques | Univariate and Multivariate | Successfully predicted requirements model understandability |
| Requirements Metrics | Description | Values | ||
|---|---|---|---|---|
| Requirements Completeness Metrics | RD metrics | NSA | Number of simple agents | 5 |
| NGH | Number of goal hierarchy | 2 | ||
| NSG | Number of simple goals | 2 | ||
| NDH | Number of decision hierarchy | 3 | ||
| NSD | Number of simple decisions | 3 | ||
| NI | Number of information requirements | 5 | ||
| STBC metrics | NCGTBC | Number of complex goals TBC | 1 | |
| NSGTBC | Number of simple goals TBC | 1 | ||
| NCDTBC | Number of complex decisions TBC | 2 | ||
| NSDTBC | Number of simple decisions TBC | 1 | ||
| Requirements Traceability Metrics | COV metrics | NGD | Number of simple goals traced down to the simple decisions | 1 |
| NDI | Number of simple decisions traced below to the information requirements | 2 | ||
| NDG | Number of simple decisions traced upwards to simple goals | 3 | ||
| NID | Number of information requirements traced up to simple decisions | 5 | ||
| NDGI | Number of simple decisions traced upwards to the simple goals and downwards to information requirements | 2 | ||
| DHCOV metrics | NGI | Number of complex or simple goals traced below to the information | 1 | |
| NIG | Number of information traced upwards to the simple or complex goals | 5 | ||
| Requirements Schemas↓ | Min | Max | SD | Average | K-Means Clustering Technique | Understandability |
|---|---|---|---|---|---|---|
| Sc1 | 103 | 159 | 15.97 | 132.07 | 1 | Understandable |
| Sc2 | 168 | 214 | 12.81 | 192.48 | 0 | Non-Understandable |
| Sc3 | 101 | 138 | 9.82 | 117.91 | 1 | Understandable |
| Sc4 | 100 | 171 | 13.55 | 144.86 | 1 | Understandable |
| Sc5 | 145 | 219 | 14.70 | 196.04 | 0 | Non-Understandable |
| Sc6 | 60 | 189 | 34.19 | 122.32 | 1 | Understandable |
| Sc7 | 131 | 205 | 15.32 | 175.91 | 0 | Non-Understandable |
| Sc8 | 76 | 142 | 13.57 | 102.88 | 1 | Understandable |
| Sc9 | 99 | 183 | 19.01 | 145.54 | 1 | Understandable |
| Sc10 | 120 | 221 | 16.51 | 197.73 | 0 | Non-Understandable |
| Sc11 | 159 | 276 | 28.49 | 233.07 | 0 | Non-Understandable |
| Sc12 | 97 | 150 | 11.65 | 118.25 | 1 | Understandable |
| Sc13 | 105 | 185 | 23.42 | 150.09 | 0 | Non-Understandable |
| Sc14 | 98 | 168 | 17.76 | 134.05 | 1 | Understandable |
| Sc15 | 71 | 127 | 14.16 | 99.52 | 1 | Understandable |
| Sc16 | 106 | 181 | 23.04 | 146.09 | 1 | Understandable |
| Sc17 | 109 | 232 | 19.13 | 203.52 | 0 | Non-Understandable |
| Sc18 | 62 | 108 | 13.18 | 83.45 | 1 | Understandable |
| Sc19 | 67 | 136 | 18.43 | 107.61 | 1 | Understandable |
| Sc20 | 100 | 144 | 12.41 | 120.36 | 1 | Understandable |
| Sc21 | 87 | 191 | 20.71 | 156.96 | 0 | Non-Understandable |
| Sc22 | 102 | 157 | 16.10 | 131.57 | 1 | Understandable |
| Sc23 | 89 | 141 | 13.52 | 113.02 | 1 | Understandable |
| Sc24 | 100 | 169 | 17.07 | 129.52 | 1 | Understandable |
| Sc25 | 105 | 162 | 13.76 | 142.66 | 1 | Understandable |
| Sc26 | 191 | 245 | 14.22 | 219.66 | 0 | Non-Understandable |
| Sc27 | 97 | 151 | 12.97 | 126.36 | 1 | Understandable |
| Sc28 | 101 | 163 | 15.04 | 133.36 | 1 | Understandable |
| Requirements Metrics↓ | Sig. | Odds Ratio | R2 | Kappa |
|---|---|---|---|---|
| NSA | 0.016507 | 0.733333 | 0.734322305 | 0.42539266 |
| NGH | 0.074036 | 0.14 | 0.646596534 | 0.018804713 |
| NSG | 0.052393 | 0.086957 | 0.518412966 | 0.546487524 |
| NDH | 0.021140 | 0.316 | 0.439352403 | 0.512633608 |
| NSD | 0.071313 | 0.19 | 0.732063295 | 0.024540475 |
| NI | 0.053338 | 0.25665 | 0.406353728 | 0.566790908 |
| NCGTBC | 0.028098 | 0.13669 | 0.815302365 | 0.519534454 |
| NSGTBC | 0.031060 | 0.692308 | 0.647652345 | 0.891107632 |
| NCDTBC | 0.025322 | 0.20147 | 0.673207281 | 0.394829752 |
| NSDTBC | 0.096445 | 0.526 | 0.76367338 | 0.045705098 |
| NGD | 0.077976 | 0.130435 | 0.405977458 | 0.070914395 |
| NDI | 0.041120 | 0.3333 | 0.779344598 | 0.11450675 |
| NDG | 0.042600 | 0.14 | 0.788994795 | 0.19519107 |
| NID | 0.048952 | 0.470588 | 0.434297715 | 0.44194272 |
| NDGI | 0.007782 | 0.888889 | 0.750983646 | 0.620886834 |
| NGI | 0.051100 | 0.529412 | 0.664623172 | 0.52762982 |
| NIG | 0.040716 | 0.16 | 0.905705336 | 0.286118397 |
| Completeness Metrics | ML Techniques | Accuracy | Sensitivity | Specificity | AUC | Null Hypothesis H0 | Alternative Hypothesis HX | Summary/Conclusion |
|---|---|---|---|---|---|---|---|---|
| NSA | LR | 0.73088 | 0.73333 | 0.72727 | 0.66707 | Rejected | H1 Accepted | NSA is a strong metric that affects schema understandability |
| NB | 0.89474 | 0.84383 | 1 | 0.73989 | ||||
| LDA with DT | 0.83 | 0.95454 | 0.8 | 0.81222 | ||||
| RL | 0.9231 | 0.9444 | 0.875 | 0.745 | ||||
| VR | 0.52 | 1 | 0.2353 | 0.3365 | ||||
| Hybrid (RL + VR) | 1 | 1 | 1 | 0.9374 | ||||
| NGH | LR | 0.6538 | 0.4545 | 0.9375 | 0.339 | Accepted | H2 Rejected | NGH has no impact on schemas understandability and may need further investigation in future replicated studies. |
| NB | 0.6356 | 0.3214 | 1 | 0.1629 | ||||
| LDA with DT | 0.7878 | 0.7777 | 0.9411 | 0.6849 | ||||
| RL | 0.7692 | 0.8125 | 0.7 | 0.396 | ||||
| VR | 0.8846 | 0.94 | 0.875 | 0.7115 | ||||
| Hybrid(RL + VR) | 0.8667 | 0.7143 | 0.913 | 0.6789 | ||||
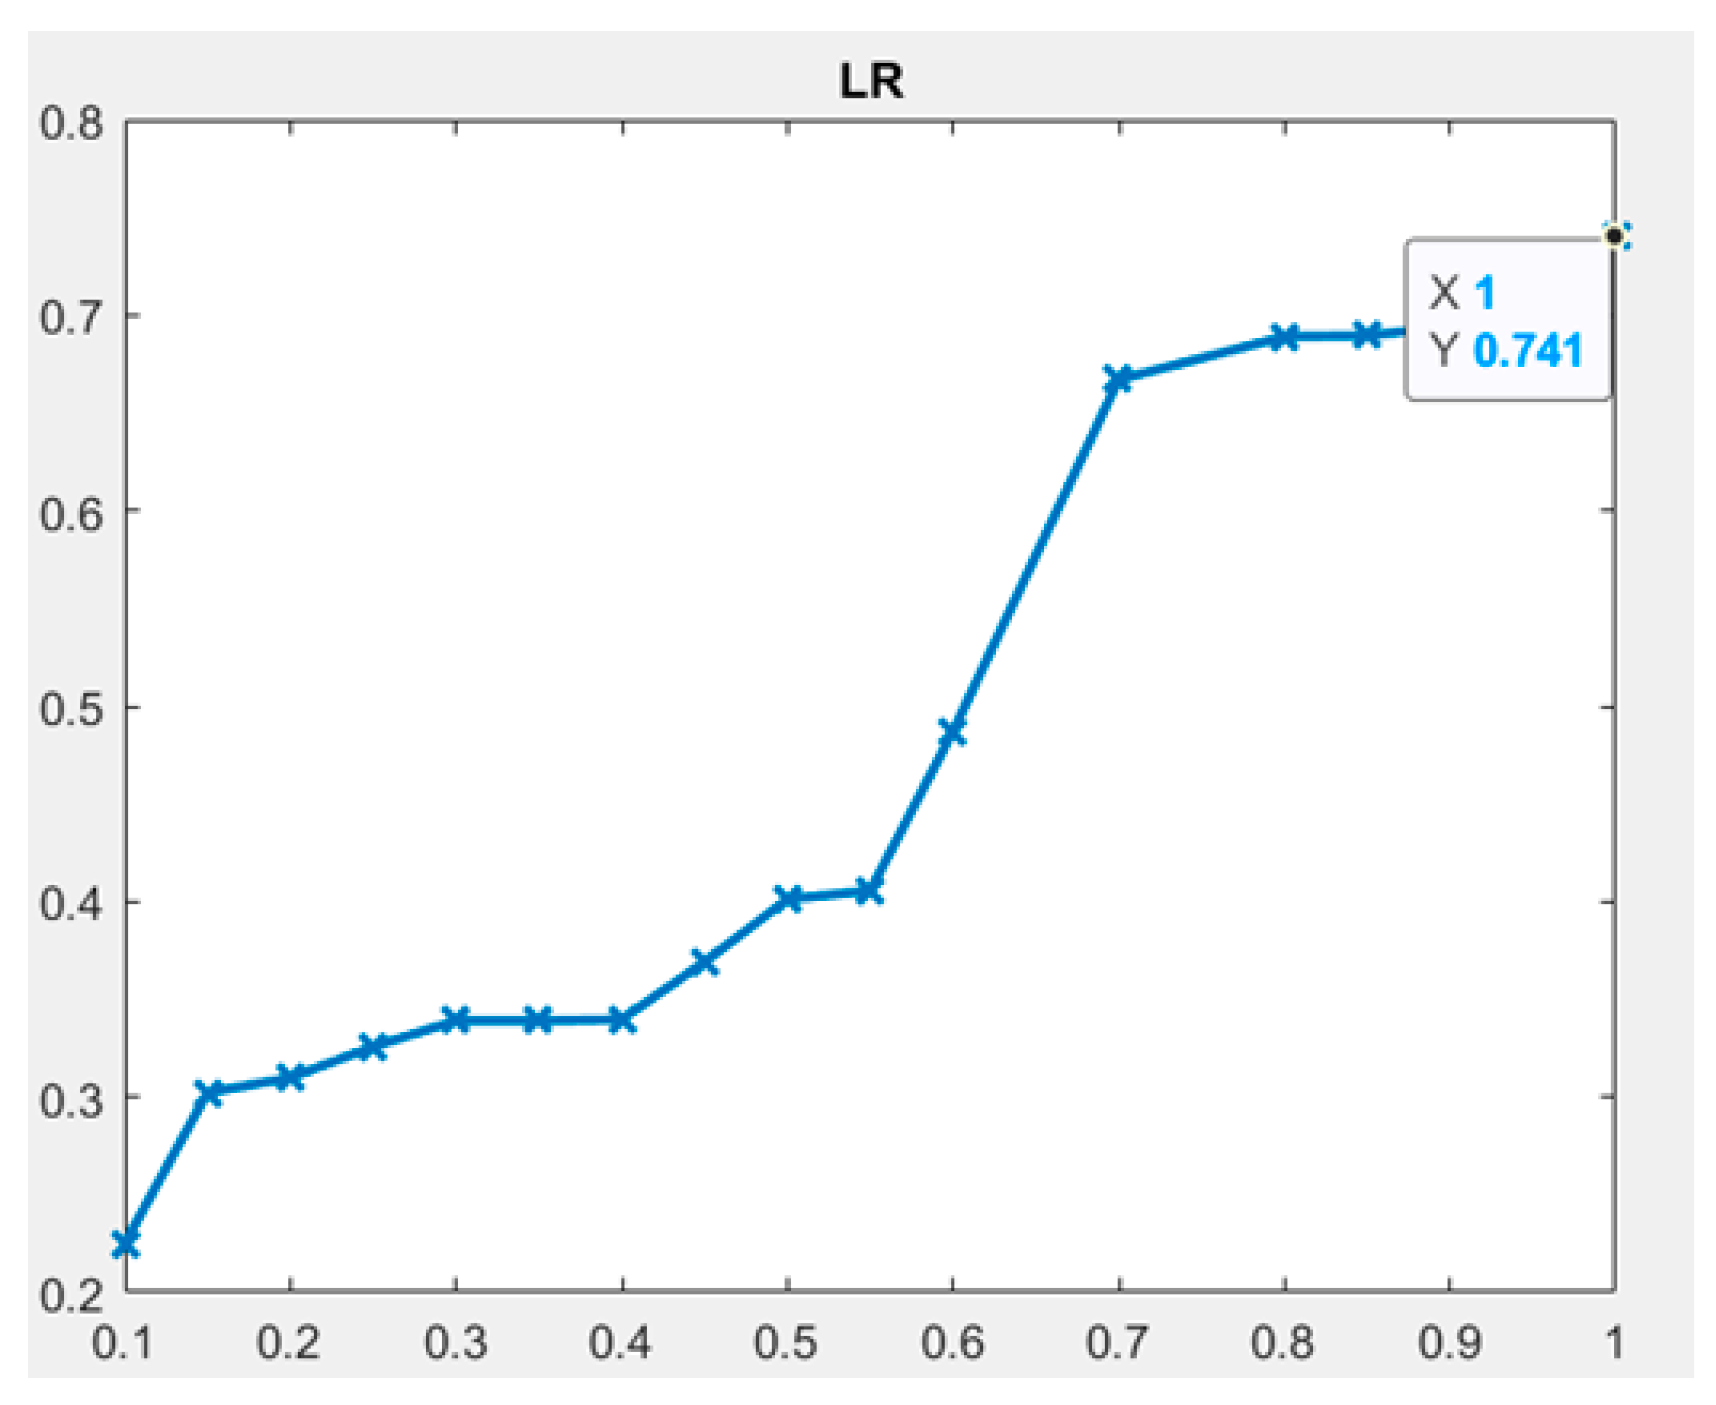
| NSG | LR | 0.9615 | 0.9333 | 1 | 0.741 | Rejected | H3 Accepted | NSG is a strong metric that affects schemas understandability |
| NB | 1 | 0.9479 | 1 | 0.8241 | ||||
| LDA with DT | 0.9615 | 1 | 0.9091 | 0.8216 | ||||
| RL | 0.9615 | 0.9375 | 1 | 0.7556 | ||||
| VR | 1 | 1 | 1 | 0.8874 | ||||
| Hybrid (RL + VR) | 0.9744 | 0.8571 | 1 | 0.6321 | ||||
| NDH | LR | 0.8846 | 1 | 0.85 | 0.339 | Rejected | H4 Accepted | NDH is a strong metric that affects schemas understandability |
| NB | 0.8947 | 0.8438 | 0.73 | 0.6078 | ||||
| LDA with DT | 0.8846 | 0.9375 | 0.8 | 0.8011 | ||||
| RL | 1 | 1 | 1 | 0.9237 | ||||
| VR | 0.9231 | 1 | 0.913 | 0.7323 | ||||
| Hybrid (RL + VR) | 1 | 1 | 1 | 0.9362 | ||||
| NSD | LR | 0.5462 | 0.5 | 0.3333 | 0.441 | Accepted | H5 Rejected | NSD has no impact on schemas understandability and may need further investigation in future replicated studies. |
| NB | 0.6368 | 0.6667 | 0.4545 | 0.3072 | ||||
| LDA with DT | 0.7878 | 0.7777 | 0.9412 | 0.6849 | ||||
| RL | 0.7946 | 0.9375 | 0.82 | 0.7551 | ||||
| VR | 0.8615 | 0.66 | 0.9286 | 0.7844 | ||||
| Hybrid (RL + VR) | 0.9621 | 0.8571 | 1 | 0.8457 | ||||
| NI | LR | 0.7308 | 0.7273 | 0.7333 | 0.6895 | Rejected | H6 Accepted | NI is a strong metric that affects schemas understandability |
| NB | 1 | 1 | 0.85 | 0.8132 | ||||
| LDA with DT | 0.808 | 0.95 | 0.6667 | 0.7011 | ||||
| RL | 0.8846 | 0.8824 | 0.8889 | 0.7015 | ||||
| VR | 0.7308 | 1 | 0.6316 | 0.3625 | ||||
| Hybrid (RL + VR) | 0.9516 | 0.8571 | 0.9636 | 0.7011 | ||||
| NCGTBC | LR | 0.5969 | 0.8571 | 0.55 | 0.225 | Rejected | H7 Accepted | NCGTBC is a strong metric that affects schemas understandability |
| NB | 0.8421 | 0.7643 | 0.8421 | 0.4478 | ||||
| LDA with DT | 0.9615 | 0.909 | 1 | 0.6232 | ||||
| RL | 0.9431 | 0.9545 | 1 | 0.4486 | ||||
| VR | 0.9231 | 1 | 0.913 | 0.7589 | ||||
| Hybrid (RL + VR) | 0.9859 | 1 | 0.9844 | 0.8432 | ||||
| NSGTBC | LR | 0.7923 | 0.9375 | 0.73 | 0.6691 | Rejected | H8 Accepted | NSGTBC is a strong metric that affects schemas understandability |
| NB | 0.8947 | 0.8864 | 0.8 | 0.4322 | ||||
| LDA with DT | 0.9615 | 0.909 | 1 | 0.3396 | ||||
| RL | 1 | 1 | 1 | 0.9237 | ||||
| VR | 0.6692 | 1 | 0.74 | 0.488 | ||||
| Hybrid (RL + VR) | 0.9877 | 1 | 0.9865 | 0.8436 | ||||
| NCDTBC | LR | 0.6923 | 0.8571 | 0.5 | 0.3099 | Rejected | H9 Accepted | NCDTBC is a strong metric that affects schemas understandability |
| NB | 0.9474 | 1 | 0.7 | 0.7449 | ||||
| LDA with DT | 0.9444 | 0.8666 | 1 | 0.6011 | ||||
| RL | 0.9231 | 0.9167 | 0.9286 | 0.8014 | ||||
| VR | 0.7146 | 0.74 | 0.781 | 0.6154 | ||||
| Hybrid (RL + VR) | 1 | 1 | 1 | 0.9355 | ||||
| NSDTBC | LR | 0.6908 | 0.8667 | 0.5454 | 0.4056 | Accepted | H10 Rejected | NSDTBC has no impact on schemas understandability and may need further investigation in future replicated studies. |
| NB | 0.3158 | 0.1875 | 0.54 | 0.1698 | ||||
| LDA with DT | 0.6161 | 0.7778 | 0.6667 | 0.5178 | ||||
| RL | 0.6462 | 0.7412 | 0.7778 | 0.614 | ||||
| VR | 0.51 | 0.375 | 0.5556 | 0.2574 | ||||
| Hybrid (RL + VR) | 0.9 | 1 | 0.7143 | 0.9348 | ||||
| Traceability Metrics | ML Techniques | Accuracy | Sensitivity | Specificity | AUC | Hypothesis H0 | Hypothesis HX | Summary/Conclusion |
| NGD | LR | 0.63088 | 0.66667 | 0.4 | 0.3397 | Accepted | H11 Rejected | NGD has no impact on schemas understandability and may need further investigation in future replicated studies. |
| NB | 0.61955 | 0.6875 | 0.57147 | 0.32 | ||||
| LDA with DT | 0.68461 | 0.66667 | 0.85714 | 0.6412 | ||||
| RL | 0.68392 | 0.33333 | 0.75 | 0.6712 | ||||
| VR | 0.82308 | 0.944444 | 1 | 0.76646 | ||||
| Hybrid (RL + VR) | 0.84857 | 0.98 | 0.85715 | 0.6655 | ||||
| NDI | LR | 0.7308 | 0.8 | 0.6364 | 0.4871 | Rejected | H12 Accepted | NDI is a strong metric that affects schemas understandability |
| NB | 0.8947 | 1 | 0.7263 | 0.6011 | ||||
| LDA with DT | 0.846153 | 0.75 | 0.928571 | 0.62774 | ||||
| RL | 0.884615 | 0.846154 | 0.923077 | 0.6891 | ||||
| VR | 1 | 1 | 1 | 0.8874 | ||||
| Hybrid (RL + VR) | 1 | 1 | 1 | 0.93961 | ||||
| NDG | LR | 0.8154 | 0.8889 | 0.9412 | 0.6956 | Rejected | H13 Accepted | NDG is a strong metric that affects schemas understandability |
| NB | 1 | 1 | 0.8636 | 0.8063 | ||||
| LDA with DT | 1 | 1 | 1 | 0.8466 | ||||
| RL | 0.923076 | 0.958333 | 0.75 | 0.6326 | ||||
| VR | 0.85 | 0.757575 | 0.76 | 0.65552 | ||||
| Hybrid (RL + VR) | 1 | 1 | 1 | 0.93665 | ||||
| NID | LR | 0.6538 | 0.8889 | 0.725 | 0.6022 | Rejected | H14 Accepted | NID is a strong metric that affects schemas understandability |
| NB | 0.8947 | 0.9375 | 0.7346 | 0.6796 | ||||
| LDA with DT | 1 | 1 | 1 | 0.9267 | ||||
| RL | 1 | 1 | 1 | 0.9267 | ||||
| VR | 0.7576923 | 0.68 | 0.7171429 | 0.60114 | ||||
| Hybrid (RL + VR) | 1 | 1 | 1 | 0.93665 | ||||
| NDGI | LR | 0.86922 | 1 | 0.84299 | 0.72588 | Rejected | H15 Accepted | NDGI is a strong metric that affects schemas understandability |
| NB | 0.7667 | 0.8586 | 0.7368 | 0.7178 | ||||
| LDA with DT | 0.846153 | 0.714286 | 89.47368 | 0.47939 | ||||
| RL | 0.906153 | 0.866667 | 0.928571 | 0.7463 | ||||
| VR | 0.769231 | 1 | 0.7 | 0.7124 | ||||
| Hybrid (RL + VR) | 0.979592 | 0.714286 | 0.992857 | 0.554 | ||||
| NGI | LR | 0.7308 | 0.5 | 0.875 | 0.4011 | Rejected | H16 Accepted | NGI is a strong metric that affects schemas understandability |
| NB | 0.7895 | 0.7115 | 0.5385 | 0.353 | ||||
| LDA with DT | 1 | 1 | 1 | 0.8466 | ||||
| RL | 0.89615 | 0.98889 | 0.75 | 0.7214 | ||||
| VR | 0.92308 | 1 | 0.91305 | 0.82151 | ||||
| Hybrid (RL + VR) | 0.97452 | 0.85715 | 0.98 | 0.6894 | ||||
| NIG | LR | 0.80777 | 0.83647 | 0.933333 | 0.68909 | Rejected | H17 Accepted | NIG is a strong metric that affects schemas understandability |
| NB | 0.894747 | 0.843838 | 1 | 0.739898 | ||||
| LDA with DT | 0.9230769 | 0.8666667 | 1 | 0.70114 | ||||
| RL | 0.9615385 | 1 | 0.75 | 0.6963 | ||||
| VR | 0.7692308 | 0.8461538 | 0.6923077 | 0.7124 | ||||
| Hybrid (RL + VR) | 1 | 1 | 1 | 0.93621 |
| Requirements Metrics↓ | Values |
|---|---|
| Sig. | 0.04 |
| R2 | 0.876 |
| Kappa | 0.851 |
| Odds ratio | 0.8530 |
| ML Techniques↓ | Accuracy | Specificity | Sensitivity | AUC |
|---|---|---|---|---|
| LR | 0.69 | 0.65 | 0.60 | 0.61 |
| NB | 0.92 | 0.89 | 0.91 | 0.84 |
| LDA with DT | 0.91 | 0.86 | 0.88 | 0.80 |
| RL | 0.90 | 0.78 | 0.84 | 0.73 |
| VR | 0.89 | 0.83 | 0.88 | 0.76 |
| Hybrid (RL + VR) | 0.95 | 0.92 | 0.93 | 0.90 |
| Alternate hypothesis H18 accepted indicating a significant combined effect of all metrics on schema understandability | ||||
Disclaimer/Publisher’s Note: The statements, opinions and data contained in all publications are solely those of the individual author(s) and contributor(s) and not of MDPI and/or the editor(s). MDPI and/or the editor(s) disclaim responsibility for any injury to people or property resulting from any ideas, methods, instructions or products referred to in the content. |
© 2025 by the authors. Licensee MDPI, Basel, Switzerland. This article is an open access article distributed under the terms and conditions of the Creative Commons Attribution (CC BY) license (https://creativecommons.org/licenses/by/4.0/).
Share and Cite
Singh, T.; Patidar, V.; Singh, M.; Rocha, Á. Schema Understandability: A Comprehensive Empirical Study of Requirements Metrics. Information 2025, 16, 155. https://doi.org/10.3390/info16020155
Singh T, Patidar V, Singh M, Rocha Á. Schema Understandability: A Comprehensive Empirical Study of Requirements Metrics. Information. 2025; 16(2):155. https://doi.org/10.3390/info16020155
Chicago/Turabian StyleSingh, Tanu, Vinod Patidar, Manu Singh, and Álvaro Rocha. 2025. "Schema Understandability: A Comprehensive Empirical Study of Requirements Metrics" Information 16, no. 2: 155. https://doi.org/10.3390/info16020155
APA StyleSingh, T., Patidar, V., Singh, M., & Rocha, Á. (2025). Schema Understandability: A Comprehensive Empirical Study of Requirements Metrics. Information, 16(2), 155. https://doi.org/10.3390/info16020155