Abstract
Ensuring high-quality data warehouses is crucial for organizations, as they provide the reliable information needed for informed decision-making. While various methodologies emphasize the importance of requirements, conceptual, logical, and physical models in developing data warehouses, empirical quality assessment of these models remains underexplored, especially requirements models. To bridge this gap, this study focuses on assessment of requirements metrics for predicting the understandability of requirements schemas, a key indicator of model quality. In this empirical study, 28 requirements schemas were classified into understandable and non-understandable clusters using the k-means clustering technique. The study then employed six classification techniques—logistic regression, naive Bayes, linear discriminant analysis with decision tree, reinforcement learning, voting rule, and a hybrid approach—within both univariate and multivariate models to identify strong predictors of schema understandability. Results indicate that 13 out of 17 requirements metrics are robust predictors of schema understandability. Furthermore, a comparative performance analysis of the classification techniques reveals that the hybrid classifier outperforms other techniques across key evaluation parameters, including accuracy, sensitivity, specificity, and AUC. These findings highlight the potential of requirements metrics as effective predictors of schema understandability, contributing to improved quality assessment and the development of better conceptual data models for data warehouses.
1. Introduction
Data warehouses (DWs) store historical data to support organizational decision-making processes [1]. Thus, it becomes integral to assess the information quality right from the initial phases of design and implementation [2,3]. Additionally, poor DW information quality may negatively impact the organizational decision-making, potentially leading to financial losses for both the organization and its clients [4]. Consequently, ensuring the quality of DW information is essential for an organization.
Information quality depends on both the quality of a DW itself and presentation quality [5], as shown in Figure 1. Further, DW quality is impacted by the data quality, data model quality, and database management system (DBMS) quality. Data model quality plays an essential role in ensuring the overall reliability and usability of a data warehouse. Moreover, the primary factors affecting the quality of DW information are the requirements, conceptual, logical, and physical data models. The dashed lines indicate the requirements data model, the primary focus of this empirical study, which is crucial for developing a coherent and well-structured framework for subsequent models, as shown in Figure 1.
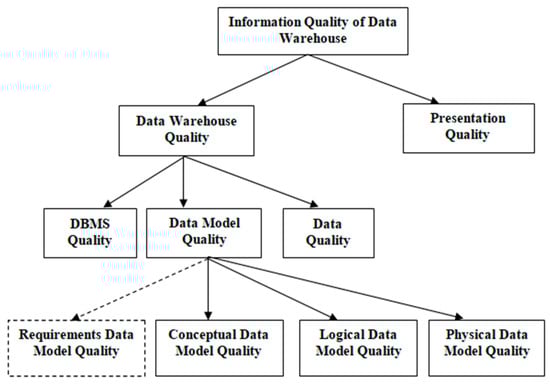
Figure 1.
DW information quality [5].
Numerous researchers have noted the failure of DW projects which exclude the requirements model and only focus on conceptual, logical, and physical data models [6,7,8]. Consequently, several methodologies for DWs have been proposed in the literature, emphasizing the importance of the requirements engineering (RE) phase for DWs [9,10,11]. However, depending solely on methodologies is not enough to ensure DW information quality due to variable data sources and the potential for human error during processing. Additionally, these methodologies may lack the flexibility to adapt to evolving data and the specific needs of a business, while also overlooking the importance of continuous monitoring. Therefore, various metrics have been proposed to assess data model quality by implementing them theoretically and empirically. Moreover, metrics have always been favored for objectively determining the quality features of software artefacts [12,13].
Many researchers have endeavored to assess data model quality at both the logical model level [14,15] and the physical model level [16,17]. These authors have put forth various guidelines for creating effective multidimensional models (MD) for DWs. Additionally, different approaches and metrics for the conceptual model level have been proposed [18,19,20] that have been further evaluated both theoretically and practically to validate conceptual data models quality. The literature has proposed and assessed requirements metrics based on an agent goal decision information (AGDI) model for the DW requirements data model using both theoretical and empirical approaches [21,22,23,24,25,26,27,28,29,30]. Despite various studies of quality assessment, there is no comprehensive empirical study specifically addressing the quality assessment of the requirements model in the existing literature. This study addresses the gap by empirically evaluating the effectiveness of requirements metrics for predicting the understandability of requirements schemas. The main purpose of our study includes the following:
- This study includes 28 requirements schemas which have been classified into two clusters, i.e., understandable and non-understandable, through the k-means clustering technique.
- Following this, a statistical technique, i.e., logistic regression (LR), has been employed including both univariate and multivariate analysis of requirements metrics for predicting schema understandability.
- Furthermore, as part of our study, five machine learning (ML) techniques have been implemented: naive bayes classifier (NB), linear discriminant analysis (LDA) with decision tree (DT), reinforcement learning (RL), voting rule (VR), and a hybrid (combination of RL + VR). These techniques also involve univariate and multivariate analyses of requirements metrics to predict schema understandability and to investigate their capability in creating accurate predictive models.
- Moreover, the assessment and comparison of these predictive models are performed by calculating different performance parameters including accuracy, specificity, sensitivity, and area under curve (AUC) obtained from the receiver operating characteristics (ROC) curve. The results shows that a hybrid classifier (combining reinforcement learning and voting rule) significantly outperforms other techniques to predict DW requirements schema understandability.
These findings highlight the potential of requirements metrics as effective predictors of schema understandability, contributing to improved quality assessment and the development of better conceptual data models for data warehouses.
The paper is further divided into the following sections: Section 2 provides a brief literature survey of RE techniques and related work, while Section 3 elaborates on the requirements metrics. Section 4 details the experimental setup, including goals, subjects, variable selection, hypothesis formulation, requirements schemas, research methodology, and various performance parameters. Section 5 presents the experimental results, including both univariate and multivariate analyses of requirements metrics, a comparison of statistical and ML techniques, and hypothesis validation. Section 6 addresses potential threats encountered during the experimentation process, and Section 7 concludes the study, offering insights into future research directions.
2. Related Work
The RE phase has received less attention or was overlooked in previous DW development efforts. In contrast, Inmon [1] observed that, unlike the traditional software development life cycle (SDLC), data warehousing requirements are usually addressed later. Various approaches to the SDLC for data warehousing have been proposed, many of which emphasize requirements engineering (RE). Williams et al. [31] introduced a model-based framework aimed at enhancing the quality of RE. Böhnlein and Ulbrich-vom Ende [32] suggested a model-based framework for improving RE quality by deriving DW requirements from business processes. Subsequent approaches, such as Winter and Strauch’s [33,34] bottom-up RE model, focused on user-driven information needs but often overlooked decisional requirements. Further, Kumar et al. [35,36] refined RE practices by incorporating early, late, and conceptual RE phases while Amalfitano et al. [37] integrated model-driven engineering (MDE) with automated tools. More recent approach by Pargaonkar [38] enhanced the quality of software by correlating the requirements and quality assurance. Despite these efforts, these approaches have proven insufficient for effectively evaluating the quality of DW requirements models. As a result, from the literature, various metrics from different RE methodologies have been proposed to assess requirements model quality.
It is clear that all the above RE approaches were not sufficient to assess the quality of DW requirements data models, as these approaches need to be validated theoretically and empirically. Hence, many researchers have worked to assess the quality of the data models at the physical level [16,17], logical level [14,15], and conceptual level [18,19,20] based on respective metrics suggested in the literature. However, much less research work has been observed in the literature for assessing the quality of requirements data models in a subjective as well as objective manner [21,24,25,26,27,28,29]. The main objective of this paper is to assess the quality of requirements data models; hence, only work on DW requirements data models is discussed in detail in the next sub-section.
To enhance requirements data model quality, different guidelines have been recommended by Kumar et al. [22], who have proposed a quality-oriented requirements model for DWs, which is an extension of the existing AGDI model. Further, to evaluate the quality of the requirements model, Kumar et al. [23] have proposed requirements completeness and traceability metrics. Kumar [21] has formally validated only requirements traceability metrics, where only size measures have been applied using Briand’s framework. Subsequently, to assess DW requirements data model quality empirically, Singh and Kumar [24] conducted an experiment using a smaller dataset of requirements schemas and subjects to execute experimental validation only on traceability metrics for predicting the understandability of DW requirements schemas using the support vector machine (SVM) method. Moreover, Singh and Kumar [25] have formally validated the traceability metrics to prove that they are defined correctly and validated by applying the cohesion and coupling measures of Briand’s framework. Later, Singh and Kumar [26] empirically investigated requirements metrics using artificial neural networks (ANN) and random forests (RF) to predict the understandability of DW requirements schemas. The theoretical validation of requirements metrics was performed using the Zuse framework [27]. Further, a combined validation, i.e., formal and empirical, was carried out on requirements completeness metrics [28]. Recently, Singh et al. [29] proposed new metrics, namely complexity metrics, for assessing the structural complexity of requirements models. Despite the extensive literature, no study has conducted both univariate and multivariate analyses. Therefore, this study undertakes an empirical investigation of requirements metrics using a larger dataset, incorporating a greater number of requirements schemas and subjects. The goal is to predict the understandability of DW requirements schemas based on the RE approach by applying both statistical (LR) and ML (NB, LDA with DT, RL, VR, and hybrid (RL + VR)) techniques. A survey of related work on requirements models based on the AGDI model is shown in Table 1. A detailed explanation of requirements completeness and traceability metrics is covered in the next section.

Table 1.
Literature survey of requirements models based on the AGDI model.
3. Requirements Metrics Used in This Study
Organizations set specific goals that managers must achieve, relying on the information to support their decisions. Prakash and Gosain [39] proposed the goal decision information (GDI) model to help managers meet these goals, but it focused solely on managerial decisions, overlooking input from other stakeholders. To overcome this limitation, Kumar et al. [35] introduced the agent goal decision information (AGDI) model, which captures both early and late requirements by involving all stakeholders. This model was later expanded into a comprehensive DW design approach, integrating requirements and conceptual modeling [36].
To assess the quality of DW requirements models objectively, Kumar et al. [23] proposed requirements completeness and traceability metrics (see Table 2) using the AGDI model [35]. Requirements completeness metrics are categorized into two types: (i) requirements decomposition (RD) metrics and (ii) specification to be completed (STBC) metrics. Similarly, traceability metrics are divided into two categories: (i) coverage (COV) metrics and (ii) full depth and height coverage (DHCOV) metrics. These metrics ensure complete and traceable requirements input for the conceptual design of a DW, contributing to the quality of the DW. A total of 28 DW requirements schemas have been designed for various typical domains like banking, the manufacturing industry, universities, the IT industry, e-Commerce companies, and many more using the existing AGDI model [35]. In this study, for a better understanding of the DW requirements model, we have used an e-commerce company as an example of a requirements schema (see Figure 2). The detailed definitions of the 17 requirements metrics, along with the calculated values for the e-Commerce company, are presented in Table 2. Likewise, we have calculated the values for the remaining 27 DW requirements schemas used in this study. These requirements metrics have been used for the comprehensive empirical study in the next section.
Table 2.
Detailed Definition of 17 Requirements metrics [23].
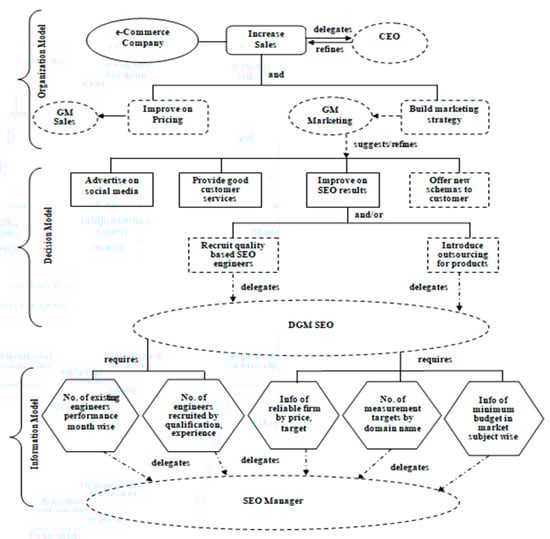
Figure 2.
e-Commerce company requirements schema.
4. Empirical Study
In this empirical study, an experiment was conducted in a controlled environment to ensure high validity [40,41]. Statistical techniques such as LR and ML techniques including NB, LDA with DT, RL, VR, and hybrid (RL + VR) were employed, including both univariate and multivariate analysis for predicting schema understandability. Additionally, as noted by Wohlin et al. [41], a hypothesis can only be reliably validated if the experimental setup is appropriately designed.
4.1. Experimental Design
This section explains the goal definition, subjects, variables, hypotheses, and DW requirements schemas. It also includes the research methodology along with the performance parameters and cross-validation techniques applied in this study.
4.1.1. Goal Definition
This section employs a goal–question–metric (GQM) approach [42] to define the experimental goal as outlined below:
- to study the metrics for DW requirements schemas
- for the purpose of predicting the understandability of DW requirements schemas
- with respect to the performance of statistical (LR) and ML (NB, LDA with DT, RL, VR and hybrid (RL + VR)) techniques
- from the perspective of scientists/scholars/researchers
- in the context of students/subjects (graduate and postgraduate)
4.1.2. Subjects
In real life, conducting an experiment is challenging as it involves professionals from organizations and requires funding to execute. Therefore, researchers often conduct pilot experiments within academia with students [43]. Since students are expected to become professionals, and in some cases the differences between students and professionals are minimal [44], 56 B.Tech and M.Tech students were selected for this experiment. These students had comprehensive knowledge of software engineering and data warehousing from their coursework, along with internship and training experience from various organizations, making them suitable subjects for the study.
4.1.3. Experimental Variables
In this study, the DW requirements metrics are treated as independent variables and the understandability of the schemas as a dependent variable. Understandability is measured by the time it takes subjects to answer questions related to each DW requirements schema. Subjects are asked to record the start and end times for each schema, and the difference between these times is used to calculate each schema’s understanding time. This approach of predicting schema understandability was previously applied by researchers to assess the understanding of multidimensional schemas in conceptual data models [19,45], which inspired its use in this study.
4.1.4. Formulation of Hypothesis
- Null hypothesis (H0): In this case, the understandability of the DW requirements schemas is not significantly impacted by the individual requirements metrics.
- Alternative hypothesis from (H1) to (H17): Here, the understandability of the DW requirements schemas is significantly impacted by all completeness and traceability requirements metrics.
- Alternative hypothesis (H18): In this case, the understandability of the DW requirements schemas is significantly impacted by some or all combined requirements metrics.
4.1.5. Data Collection
In this study, the experiment was conducted using a larger number of datasets comprising 28 requirements schemas from various domains, all designed using the existing AGDI model [35]. These domains are very common, which helps to avoid any difficulty in understanding the designed schemas. The value for one of the requirements schemas, i.e., the e-Commerce company, has been already calculated and given in Table 2. Similarly, the metrics for the remaining 27 schemas have been calculated and are used in this study.
The experiment begins by training the subjects on the AGDI approach for DW design. The authors answer all the queries of the process, such as how to answer or measure time. However, the students are not informed about the investigation of requirements schemas or the hypothesis. Each subject is given four questions for each of the 28 schemas and instructed to answer them. An example set provided from the e-Commerce company schema (Figure 2) is given below:
- Start time (in seconds) -____________ End time (in seconds) -________________
- Q1: Which type of goals do we need to increase the sales of the company?
- Q2: What type of decisions do we need to take to improve search engine optimization results?
- Q3: If we need to introduce outsourcing for products, then which information do we need to add?
- Q4: Which agent do we need who will tell the best employee performance?
All subjects in the experiment were given clear instructions to record the start and end times (preferably in seconds) for each DW requirements schema. The schema understanding time is determined by how long it takes the subject to complete one requirement schema with four questions. The understanding time indicates how well the subject understands the schema. Similarly, we assess the time it takes each of the 56 subjects to understand each of the 28 DW requirements schemas and calculate their understanding time accordingly.
4.2. Research Methodology
A total of 2044 data were collected, including 1568 values for understanding time (28 schemas × 56 subjects) and 476 values for requirements metrics (28 schemas × 17 metrics). The understanding time serves as the dependent variable, while the metrics are the independent variables. Statistical (LR) and ML techniques (NB, LDA with DT, RL, VR, and a hybrid of RL + VR) were applied to predict schema understandability based on these metrics. This study first performs univariate analysis on each requirements metric to predict DW schema understandability, followed by developing a multivariate prediction model combining all metrics. A comparison of results for each ML technique is also provided to demonstrate their effectiveness.
4.2.1. K-Means Clustering Technique
K-means clustering is a popular technique that minimizes within-cluster variance to group similar data points while keeping clusters distinct [46]. It can reveal hidden patterns and simplify complex data and is often used in conjunction with other methods to improve model performance. In this study, k-means clustering was used to classify requirements schemas into understandable and non-understandable groups, enabling the analysis of each metric’s effectiveness. This helps identify patterns that enhance schema quality and understandability.
4.2.2. Logistic Regression Analysis
In this study, to predict the understandability of requirements schemas, logistic regression (LR) has been employed, aiming to measure variance in schema understandability [47]. A significance level of 0.05 is applied, aligning with standard practices [19]. While LR has been used for multidimensional schemas in previous research [19,48], its application to DW requirements schemas is novel, prompting the use of both univariate and multivariate LR analyses.
4.2.3. ML Techniques Used in This Investigation
While ML techniques have been applied for predicting conceptual schemas understandability in several studies [19,45,48], there is limited research on using ML to assess requirements model quality [24,26]. This study employed five ML approaches to determine if they can predict the understandability of DW requirements schemas using NB, LDA with DT, RL, VR, and a hybrid method (RL and VR). Detailed descriptions of each technique are provided in the following sub-sections.
NB Classifier
The naive Bayes (NB) algorithm is a classification method that calculates conditional probabilities based on Bayes [49] and is effective with conditionally independent variables [50]. Its simplicity allows for easy construction without needing a predefined structure, and it often performs well despite its reliance on conditional independence. In this study, we used a MATLAB (R2016a) implementation of NB for both supervised and semi-supervised data categorization.
LDA with DT Classifier
Linear discriminant analysis (LDA) functions as a multivariate classifier that seeks to find linear combinations of features that best separate different classes [51]. It maintains a constant linear slope of data until the gradient varies beyond a threshold, at which point categorization occurs. LDA can serve as a linear classifier or reduce the dimensionality of feature space before further classification and has been effectively used in face recognition. In the proposed framework, LDA categorizes data into “Understandable” and “Non-understandable” classes and is particularly efficient with small datasets, offering lower computational complexity compared to decision trees (DTs), which rely on “If-then” rules and have higher computational demands [52,53]. The use of LDA helps to reduce the computational time required for DTs.
RL Classifier
Reinforcement learning (RL) is an ML method where an initially untrained model learns to perform actions within a system based on rewards received from the system’s responses [54]. RL gathers data through ongoing interaction, optimizing performance to achieve the best results. In this study, the Q-learning algorithm is used, which generates observation sequences as state behavior rewards [55], with its process illustrated in Figure 3. The Q-learning approach aims to assess the requirements model quality by measuring how effectively the dataset helps in obtaining reward points. The structure is trained on subjects, with initial trust calculated for each subject. During testing, samples are compared to stored data, adjusting the Q value based on the rewards obtained to refine performance iteratively until the desired results are achieved. After going through the learning function, the return circuit uses the improved patterns from the RL database to update the classification rule. This guarantees increased precision and flexibility for better categorization in subsequent data processing.
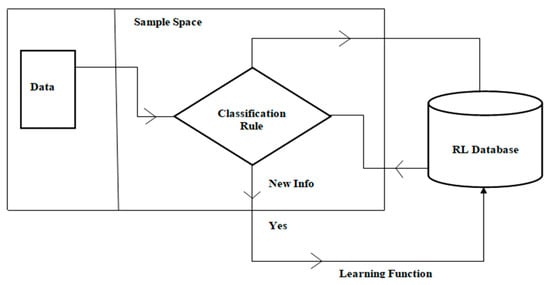
Figure 3.
RL workflow.
VR Classifier
Weighted voting rules (VR) is a widely used classification method in ML, involving a combination of various algorithms selected randomly. Each algorithm uses different techniques for data categorization, and while it may not always deliver the best results, it generally yields efficient outcomes. The technique assigns voting weights to classifiers based on their performance in specific output classes, with higher weights given to more accurate classifiers, making the selection of appropriate weights crucial [56].
Hybrid Classifier
A hybrid classifier combines two learning mechanisms or classification methods. In this study, the model integrates RL (Q-learning) with a VR classifier, where VR enhances the Q-learning mechanism’s information repository by adjusting based on reward points (Figure 4).
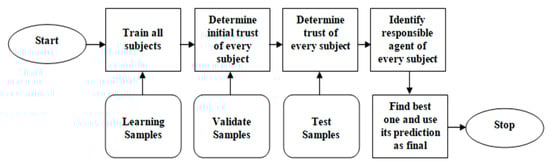
Figure 4.
Hybrid classifier workflow of the understandability of DW requirements schemas.
4.3. Performance Parameters Used in This Study
Various performance measurement parameters have been utilized to assess the performance of different classification techniques in the literature [57]. These defined parameters are employed to evaluate two-set problems (such as high/low, non-understandable/understandable) to assess the performance of DW requirements model understandability [58]. The performance parameters utilized in our experiment are discussed below both theoretically and mathematically:
- Accuracy: This is determined by dividing the proportion of DW requirements schemas accurately anticipated to be understandable or non-understandable by the total number of requirements schemas. Mathematically, it can be expressed as:
- 2.
- Sensitivity (recall): The potential of a classification model can be determined by using sensitivity, which is evaluated as the percentage of DW requirements schemas correctly predicted as understandable. Therefore, a higher sensitivity value indicates a better model. Mathematically, we can express this as,
A low sensitivity value means that many understandable requirements schemas were incorrectly identified as non-understandable, leading to wasted effort when testing those particular schemas. In such cases, the DW development life cycle may incur costly maintenance in later phases [59].
- 3.
- Specificity or True Negative Rate (TNR): This aims to identify negative results and is also crucial for analyzing and comparing the performance of prediction models. It is measured as the proportion of accurately predicted non-understandable DW requirements schemas. Mathematically, it is expressed as:
A low specificity value indicates that many non-understandable requirement schemas were identified as understandable requirement schemas. Consequently, the organization will only send those requirement schemas that are non-understandable to the subsequent development phase. In such cases, the DW development may incur costly maintenance in later phases [59].
- 4.
- AUC: Generalizing findings solely based on accuracy metrics can be challenging [59,60], and results may vary with false positives (specificity) at different cutoff points [61]. To address this, ROC plot analysis and the AUC measure are used [47], with each ROC point reflecting sensitivity and specificity for a given threshold [62]. In this study, AUC values are evaluated to assess model performance, with values ≤0.5 deemed poor and values between 0.9 and 1.0 considered excellent.
- Additionally, this investigation includes four characteristics of the LR technique, which are implemented along with the classification performance parameters discussed above:
- 1.
- Statistical Significance (Sig.): This determines the coefficient’s (Bi’s) significance level. A higher value of Sig. results in a lower estimated impact of the requirements metrics (independent variables). We chose the widely accepted value of 0.05 as the significance level to test the hypothesis (see Section 4.1.3).
- 2.
- Odds Ratio: This is measured for each requirements metric (independent variable) using Sig. Essentially, it represents the possibility of the event (i.e., understandable requirements schemas) divided by the non-event (non-understandable requirements schemas).
- 3.
- R2 Statistic: This statistic calculates the proportion of variance in understandability described by the requirements metrics variance. A higher R2 value indicates a larger effect on requirements metrics and results in a more accurate requirements model. In this investigation, we have used R2 values for univariate models and adjusted R2 for multivariate models.
- 4.
- Kappa Statistic: The kappa value measures the agreement between actual and expected DW requirements, with higher values indicating better correspondence. Specifically, values between 0.80 and 1.00 denote almost perfect agreement, 0.61 to 0.80 signify substantial agreement, 0.41 to 0.60 suggest moderate agreement, 0.21 to 0.40 indicate fair agreement, 0.00 to 0.20 show slight agreement, and negative values represent poor agreement [63].
4.4. Cross-Validation
In this experiment, k-fold cross-validation (k = 10) is used, creating ten subsets from the data [64]. The model is trained on nine subsets and tested on the remaining one, with performance parameters evaluated to predict the understandability of DW requirements schemas.
5. Results and Discussion
This section outlines the comprehensive study incorporating both univariate and multivariate analyses to explore how requirements metrics influence the understandability of DW requirements schemas.
5.1. Statistical Analysis Results
Here, we provide the statistical details of each requirements schema’s actual data, including the minimum (Min), maximum (Max), standard deviation (SD), and average understanding time in seconds (refer to Table 3). The maximum understanding time was observed in S11, i.e., 276 s, and the minimum understanding time in S6, i.e., 60 s. The maximum standard deviation was observed in S6, i.e., 34.19 s, and the minimum standard deviation in S3, i.e., 9.82 s. The k-means clustering technique was applied to the schema data to categorize them into two clusters, i.e., understandable (labeled as 1) and non-understandable (labeled as 0), as shown in Table 3. Understandability was determined when the understanding time of DW requirements schemas was equal to or less than the average understanding time, i.e., 146.10 s, in which case it was labeled as ’understandable’, indicating easy to understand; otherwise, it was labeled as ’non-understandable’, signifying difficult to understand (refer to Table 3). Additionally, Figure 5 and Figure 6 provide a visual comparison of the understanding time for each model, both before and after the application of the k-means clustering technique.
Table 3.
Descriptive statistics (in sec) of collected data from DW requirements schemas (Sc1 to Sc28).
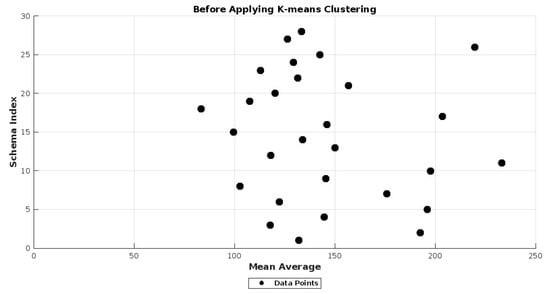
Figure 5.
Understanding time before applying k-means clustering technique.
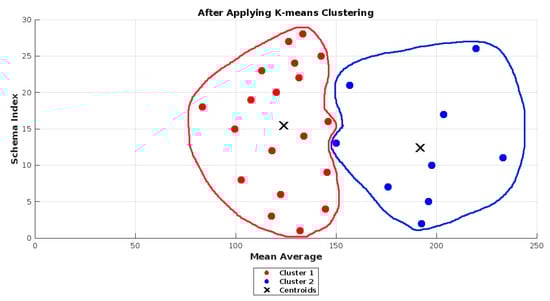
Figure 6.
Understanding time after applying the k-means clustering technique. RED indicates understandable and BLUE indicates non-understandable clusters.
5.2. Result Analysis: LR and ML
This subsection presents the results derived from applying LR and ML techniques to the requirements metrics to predict schema understandability. The results are divided into two parts: first, employing techniques individually on each requirements metric (also known as univariate approach), and second, merging all requirements metrics (also known as multivariate approach) to explore their combined effect on the DW requirements schemas understandability. Initially, for both approaches, the investigation focused on four characteristics of LR (Sig., Odds ratio, R2, and kappa statistic). Subsequently, various parameters were evaluated, such as accuracy, specificity, sensitivity, and ROC (AUC) results, which are discussed as follows:
5.2.1. Univariate Analysis Results
Here we discuss all the univariate analysis results of the first statistical (LR) technique with its four characteristics, and then the results based on the performance parameters of LR and ML (NB, LDA with DT, RL, VR, and hybrid (RL + VR)) techniques are also discussed.
Univariate Analysis Results—LR Characteristics
Table 4 displays the results of the four characteristics of LR univariate analysis discussed in Section 4.3 for each DW requirements metric. From Table 4, it is observed that NSA, NSG, NDH, NI, NCGTBC, NSGTBC, NCDTBC, NDI, NDG, NID, NDGI, NGI, and NIG metrics were the most significant, as their level of significance was less than 0.054 (marked in bold in Table 4), indicating their ability to predict the understandability of DW requirements schemas. Among these requirements metrics, the NDGI metric had the maximum value of odds ratio, i.e., 0.89, followed by the NSA metric with the second-highest value of 0.73. Moreover, a higher R2 value indicates a larger effect on requirements metrics, resulting in a more accurate requirements model. In this regard, the NIG metric had the highest R2 value of 0.91, followed by the NCGTBC and NDG metrics with R2 values of 0.82 and 0.79, respectively.
Table 4.
Logistic Regression—Univariate Results.
The kappa statistic measures the agreement between the actual and predicted understandability of DW requirements schemas. In the case of NSGTBC univariate analysis, the actual and predicted understandability exhibit a perfect agreement, with a coefficient of 0.89. Additionally, the kappa measure for NDGI univariate analysis was 0.62, indicating substantial agreement with understandability. However, the kappa measures for NSA, NSG, NDH, NI, NCGTBC, NID, and NGI univariate models were 0.43, 0.54, 0.51, 0.57, 0.52, 0.44, and 0.52, respectively, suggesting moderate agreement with understandability. Consequently, based on the results obtained from LR characteristics, the metrics NGH, NSD, NSDTBC, and NGD are not significantly related to DW requirements schema understandability.
Univariate Analysis Results—LR
The results of the LR model illustrate the highest accuracy, specificity, and sensitivity values of 96%, 100%, and 93%, respectively, for predicting the understandability of DW requirements schemas using the NSG metric. Additionally, the NSG metric has the highest AUC value (0.74), as shown in Figure 7. The second-highest accuracy, specificity, and sensitivity values were observed in the NDH metric, which were 88%, 85%, and 100%, respectively. Furthermore, the accuracy, specificity, and sensitivity values of the NDGI and NIG metrics were found to be above 80%. Detailed performance of the LR model is presented in Table 5.
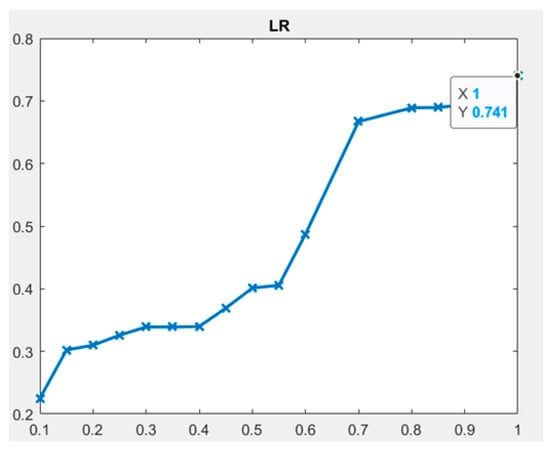
Figure 7.
LR classifier—ROC (AUC) plot.
Table 5.
Completeness and Traceability metrics—univariate results of all learning techniques.
Univariate Analysis Results—NB
The results of the NB model demonstrate the highest accuracy, specificity, and sensitivity values of 100%, 100%, and 95%, respectively, to predict the understandability of DW requirements schemas using the NSG metric. Additionally, the accuracy and sensitivity values of both the NI and NDG metrics were found to be 100%, while the specificity of NI and NDG was 85% and 86%, respectively. Moreover, the NSG, NI, and NDG metrics have AUC values of 0.82, 0.81, and 0.81, respectively, with the highest value (0.8241 for the NSG metric), as shown in Figure 8. The second-highest sensitivity, accuracy and specificity, and values were observed in the NCDTBC metric, which were 95%, 70%, and 100%, respectively. Additionally, the sensitivity, accuracy, and specificity values of the NSA, NDH, NCGTBC, NSGTBC, NDI, NID, and NIG metrics were found to be above 80%. Detailed performance of the NB model is presented in Table 5.
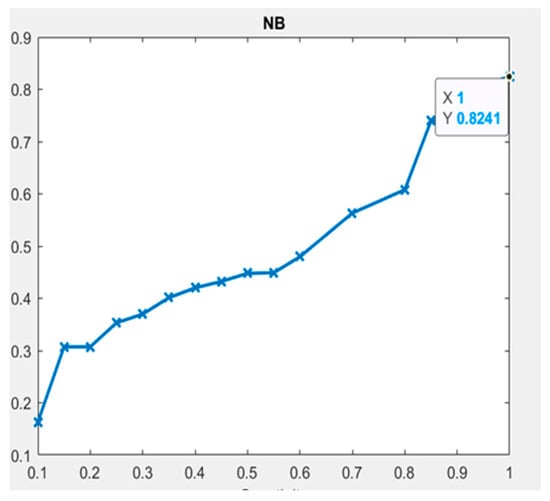
Figure 8.
NB classifier—ROC (AUC) plot.
Univariate Analysis Results—LDA with DT
The results of the LDA with DT model display the highest values for accuracy, specificity, and sensitivity, all of which were 100%, to predict schema understandability using the NDG, NID, and NGI metrics. Furthermore, the NDG, NID, and NGI metrics have the same AUC value, 0.8466, as shown in Figure 9. Additionally, the sensitivity, accuracy, and specificity values of the NSA, NSG, NDH, NCGTBC, NSGTBC, NCDTBC, NDI, NDGI, and NIG metrics were found to be above 80%. The performance of all metrics in the LDA with DT model is detailed in Table 5.
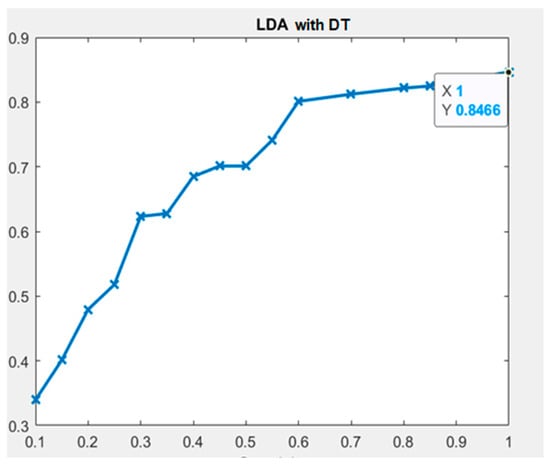
Figure 9.
LDA with DT classifier—ROC (AUC) plot.
Univariate Analysis Results—RL
The results of the RL model show that the NDH, NSGTBC, and NID metrics had the highest values for accuracy, specificity, and sensitivity, all of which were 100%, to predict the understandability of DW requirements schemas. Moreover, these metrics, NDH, NSGTBC, and NID, have the same AUC value, 0.9237, as shown in Figure 10. Additionally, the sensitivity, accuracy, and specificity values of the NSA, NSG, NI, NCGTBC, NCDTBC, NDI, NDG, NDGI, NGI, and NIG metrics were found to be above 80%. The RL performance of the model is presented in Table 5.
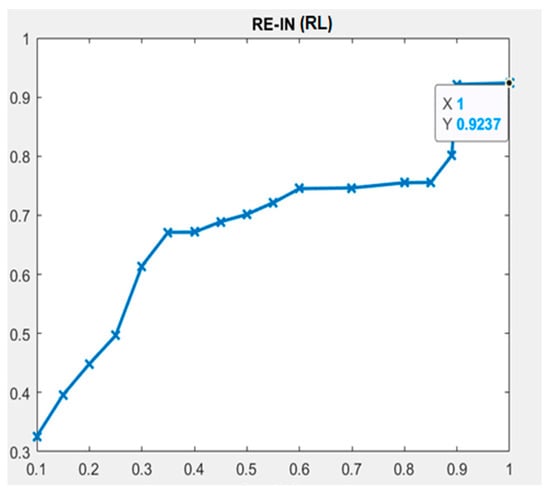
Figure 10.
RL classifier—ROC (AUC) plot.
Univariate Analysis Results—VR
The results of the VR model indicate the highest sensitivity, accuracy, and specificity values, all of which were 100%, to predict schema understandability using the NSG and NDI metrics. Additionally, both the NSG and NDI metrics have the same AUC value, 0.8874, as shown in Figure 11. The second-highest accuracy, 92%, along with sensitivity = 100% and specificity = 91%, was observed for the NDH, NCGTBC, and NGI metrics. The VR performance of the model is depicted in Table 5.
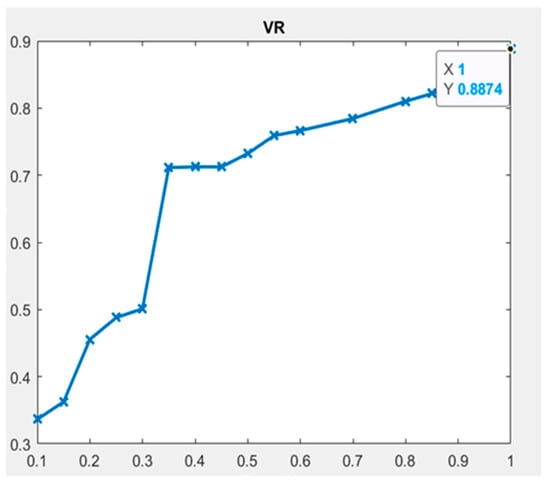
Figure 11.
VR classifier—ROC (AUC) plot.
Univariate Analysis Results—Hybrid (RL and VR)
The results of the hybrid (RL + VR) model show that NSA, NDH, NCDTBC, NID, NDG, and NID metrics had the highest values for sensitivity, accuracy, and specificity, all at 100%, to predict the understandability of DW requirements schemas. Moreover, these metrics have the same AUC value, around 0.94, as shown in Figure 12. Additionally, the values of accuracy, specificity, and sensitivity of NGH, NSG, NSD, NI, NCGTBC, NSGTBC, NGD, NDGI, and NGI metrics were found to be above 85%. Furthermore, the detailed performance of the hybrid (RL + VR) model is shown in Table 5.
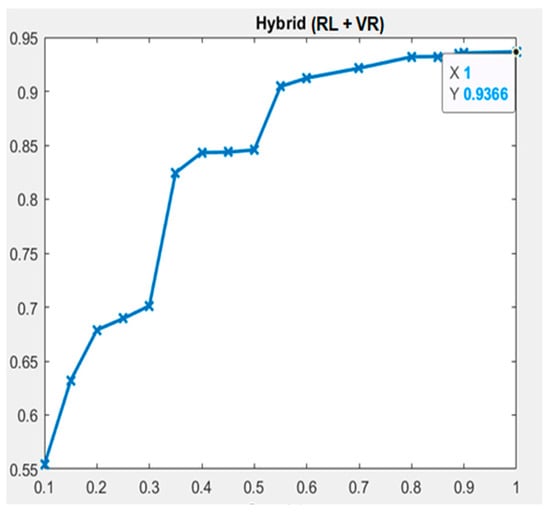
Figure 12.
Hybrid (RL + VR) classifier—ROC (AUC) plot.
5.2.2. Multivariate Analysis Results
In this section, all the multivariate results of LR and ML techniques, along with their characteristics and classification performance parameters, are explained. Table 6 presents the multivariate results of the LR technique. Based on the results, the value of R2 was 0.876, indicating a high level of accuracy in constructing the DW requirements model. Additionally, the kappa value was 0.851, demonstrating perfect agreement between predicted and actual understandability of DW requirements schemas. The odds ratio of the multivariate LR model was 0.8530. Furthermore, it is observed that the overall model’s level of significance was 0.04, indicating that the metrics are significant for predicting schema understandability. Moreover, Table 7 presents the results of all techniques used in this investigation in a combined manner, specifically in multivariate analysis where all the requirements metrics are implemented as one to be used as understandability predictors. All the classification parameters of each technique are discussed in Section 5.4, where a comparison of all predictive models is performed and discussed.
Table 6.
LR—Multivariate results of LR characteristics.
Table 7.
ML techniques—Multivariate results.
5.3. Validation of Hypothesis (H0 to H17)
This section validates the hypotheses for each requirements metric formulated in Section 4.1.4 using univariate analysis results from all learning techniques (refer to Table 5).
NSA, NSG, NDH, NI, NCGTBC, NSGTBC, and NCDTBC are seven completeness metrics which have been identified as significantly influencing requirements schema understandability in accordance with the hypothesis, whereas NGH, NSD, and NSDTBC completeness metrics showed an insignificant effect. In addition, out of the seven requirements traceability metrics, six (NDI, NDG, NID, NDGI, NGI, and NIG) were most significant in predicting the understandability of DW requirements schemas, whereas only NGD showed an insignificant effect on the prediction of schema understandability.
5.4. Comparing Multivariate Predictive Models and Validation of H18 Hypothesis
The validated hypothesis mentioned above was based on univariate results (refer to Table 5). In this section, we use multivariate data to verify our last hypothesis, H18, showing a significant effect on the schemas’ understandability by integrating all metrics. We also compare the multivariate results (see Table 7). Analysis of the multivariate results for all learning techniques indicates that combining all metrics can serve as the best predictor of schema understandability. Therefore, we accept the alternative hypothesis H18, which indicates a substantial combined impact of all requirements metrics on schemas understandability. The detailed multivariate results are discussed as follows:
In our experiment, we applied six techniques—LR, NB, LDA with DT, RL, VR, and hybrid (RL and VR)—to predict requirements schema understandability using both requirements completeness and traceability metrics. These techniques were evaluated based on various performance parameters such as accuracy, specificity, sensitivity, and AUC. As shown in Table 7, the hybrid (RL and VR) technique demonstrated the highest accuracy, specificity, and sensitivity values of 95%, 92%, and 93%, respectively. Following the hybrid (RL and VR) technique, the second-highest accuracy, specificity, and sensitivity values were observed in NB, at 92%, 89%, and 91%, respectively (see Table 7). Additionally, LDA with DT, RL, and VR also exhibited accuracy, specificity, and sensitivity values above 85%, which are also notably high. Finally, LR showed accuracy, specificity, and sensitivity values below 70%.
Furthermore, the hybrid (RL and VR) classifier exhibited the highest AUC value of 0.90, while the NB technique showed the second-highest AUC value of 0.84, indicating the accuracy of prediction. The comparison of all learning techniques based on each performance parameter is depicted in Figure 13. Consequently, we can conclude that the performance of the hybrid (RL and VR), NB, LDA with DT, VR, and RL techniques surpasses that of the LR technique to predict the understandability of DW requirements schemas.
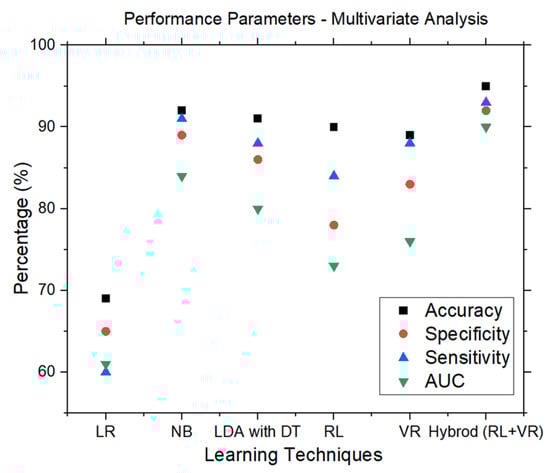
Figure 13.
Performance parameters of all learning techniques—Multivariate.
6. Threats to Validity
In this section, we discuss all the potential threats to validity encountered during the implementation of our empirical investigation:
- Construct Validity: In our experimental inquiry, construct validity pertains to the precision with which the instruments measured the independent and dependent variables. The concept validity of the dependent variable is guaranteed by the measurement technique employed to understand time—the amount of time subjects took to answer the questions in each requirements schema. Furthermore, as the independent variables (requirements metrics) were explicitly validated using Briand’s methodology, the construct validity of the variables has been guaranteed [21,25].
- Within-Subject Design Approach: A within-subject design strategy was used in our inquiry to reduce error differences among participants when they responded to questions in their mental states. The experiment involved 56 students (subjects) from M.Tech. and B.Tech. programs in a monitored environment. While we acknowledge that 56 subjects may not be sufficient to achieve generalizable results, we aimed to generalize the findings through experiments involving professionals with larger datasets. Additionally, the subjects were volunteers and were motivated to experiment.
- Recording of Time: The experiment was conducted in a controlled environment. Subjects themselves recorded the starting and ending times of each requirement schema, ensuring more accurate results compared to employing other individuals for time recording. The entire process took six days to finish, and each subject worked on the experiment for an average of less than an hour every day—a shorter amount of time than one practical class. Therefore, the fatigue effect was minimal within this time range.
- Diversity of DW Requirements Schemas: To provide a diversified dataset, we built DW requirements schemas from various domains. But further research requires more trials using actual, bigger, more intricate schemas.
- Statistical Validity: Statistical validity refers to the degree to which conclusions are statistically validated. One potential concern in our investigation is the size of the data model (56 subjects and 28 schemas), which we believe is insufficient for empirical investigation. While there are only a few similar empirical studies in the literature [24,26], we aimed to address this limitation by performing replicated experiments with larger datasets in different studies to generalize the results.
7. Conclusions and Future Scope
This paper presents the findings of an empirical study that evaluated the effectiveness of DW requirements metrics in predicting the understandability of requirements schemas. The study included 56 subjects and 28 requirements schemas, each paired with set of four questions for the subjects to answer. The experiment was conducted in a monitored environment with precise instructions, including recording the start and end times involved in understanding each requirement schema.
In this empirical study, firstly 28 requirements schemas were considered and classified into understandable and non-understandable clusters using the k-means clustering technique. To empirically investigate requirements completeness and traceability metrics both, a statistical technique (logistic regression) and five ML techniques (naive Bayes, linear discriminant analysis with decision tree, reinforcement learning, voting rule, and a hybrid of reinforcement learning and voting rule) were employed to predict schema understandability, using both univariate and multivariate analyses. The univariate analysis evaluated LR characteristics such as significance, odds ratio, R², and kappa statistic, while the performance parameters (accuracy, specificity, sensitivity, and ROC (AUC)) for all learning techniques were also assessed. Multivariate analysis results for LR characteristics and other learning techniques were also illustrated.
- The metrics NSA, NSG, NDH, NI, NCGTBC, NSGTBC, NCDTBC, NDI, NDG, NID, NDGI, NGI, and NIG were identified as significant predictors of DW requirements schema understandability using LR characteristics, while NGH, NSD, NSDTBC, and NGD were not found to be good predictors.
- The NID metric emerged as an excellent predictor for schema understandability using learning techniques, whereas the NDH, NDI, and NDG metrics were found to be highly significant predictors.
- A few metrics like NSA, NSG, NI, NCGTBC, NSGTBC, NCDTBC, NDGI, NGI, and NIG showed moderate performance across all parameters.
- The NGH, NSD, NSDTBC, and NGD metrics were not significant in predicting schema understandability.
- ROC analysis (AUC values) indicated that the hybrid model (RL + VR), along with NB, LDA with DT, VR, and RL, outperformed the LR technique in predicting schema understandability.
- The study concludes that ML techniques are beneficial for building adaptable models for DW systems, enhancing the prediction of requirements schema understandability.
These findings highlight the potential of requirements metrics as effective predictors of schema understandability, contributing to improved quality assessment and the development of better conceptual data models for DWs.
For future research, a larger set of DW requirements schemas and subjects, preferably professionals from organizations, will be used in repeated trials with various learning techniques to generalize the results. Additionally, statistical data mining approaches will be applied to further explore how requirements metrics influence the various external quality factors in DW requirements schemas.
Author Contributions
Conceptualization, T.S. and V.P.; methodology, T.S., V.P., M.S. and Á.R.; validation, T.S., V.P. and M.S.; formal analysis, T.S., V.P. and Á.R.; investigation, T.S. and M.S.; data curation, T.S. and M.S.; writing—original draft preparation, T.S., V.P. and Á.R.; writing—review and editing, T.S., V.P. and Á.R.; visualization, T.S. and M.S.; supervision, V.P. and Á.R. All authors have read and agreed to the published version of the manuscript.
Funding
This research received no external funding.
Data Availability Statement
Data will be made available on reasonable request.
Conflicts of Interest
The authors declared that they have no conflicts of interest.
References
- Inmon, W.H. The data warehouse and data mining. Commun. ACM 1996, 39, 49–51. [Google Scholar] [CrossRef]
- Bouzeghoub, M.; Kedad, Z. Quality in data warehousing. In Information and Database Quality; Springer: Boston, MA, USA, 2002; pp. 163–198. [Google Scholar] [CrossRef]
- Rizzi, S.; Abelló, A.; Lechtenbörger, J.; Trujillo, J. Research in data warehouse modeling and design: Dead or alive? In Proceedings of the 9th ACM international workshop on Data warehousing and OLAP, Arlington, VA, USA, 10 November 2006; pp. 3–10. [Google Scholar]
- English, L. Information Quality Improvement: Principles, Methods and Management, Seminar; Information Impact International: Brentwood, TN, USA, 1996. [Google Scholar]
- Serrano, M.; Trujillo, J.; Calero, C.; Piattini, M. Metrics for data warehouse conceptual models understandability. Inf. Softw. Technol. 2007, 49, 851–870. [Google Scholar] [CrossRef]
- Lehner, W.; Albrecht, J.; Wedekind, H. Normal forms for multidimensional databases. In Proceedings of the Tenth International Conference on Scientific and Statistical Database Management (Cat. No. 98TB100243), Capri, Italy, 3 July 1998; pp. 63–72. [Google Scholar]
- Vassiliadis, P. Gulliver in the land of data warehousing: Practical experiences and observations of a researcher. In Proceedings of the Second Intl. Workshop on Design and Management of Data Warehouses, DMDW 2000, Stockholm, Sweden, 5–6 June 2000; p. 12. [Google Scholar]
- Salinesi, C.; Gam, I. How Specific Should Requirements Engineering Be in the Context of Decision Information Systems? In Proceedings of the 2009 Third International Conference on Research Challenges in Information Science, Fez, Morocco, 22–24 April 2009; IEEE: Piscataway, NJ, USA, 2009. [Google Scholar]
- Frendi, M.; Salinesi, C. Requirements engineering for data warehousing. In Proceedings of the 9th International Workshop on Requirements Engineering: Foundations of Software Quality, Klagenfurt/Velden, Austria, 16–17 June 2003. [Google Scholar]
- Mazón, J.N.; Pardillo, J.; Trujillo, J. A model-driven goal-oriented requirement engineering approach for data warehouses. In International Conference on Conceptual Modeling; Springer: Berlin/Heidelberg, Germany, 2007; pp. 255–264. [Google Scholar]
- Schiefer, J.; List, B.; Bruckner, R. A holistic approach for managing requirements of data warehouse systems. In Proceedings of the AMCIS 2002, Eighth Americas Conference on Information Systems, Dallas, TX, USA, 9–11 August 2002; p. 13. [Google Scholar]
- Fenton, N.; Melton, A. Deriving structurally based software measures. J. Syst. Softw. 1990, 12, 177–187. [Google Scholar] [CrossRef]
- Fenton, N.; Bieman, J. Software Metrics: A rigorous and Practical Approach; CRC Press: Boca Raton, FL, USA, 2014. [Google Scholar]
- Gaur, H.; Kumar, M. Assessing the understandability of a data warehouse logical model using a decision-tree approach. ACM SIGSOFT Softw. Eng. Notes 2014, 39, 1–6. [Google Scholar] [CrossRef]
- Serrano, M. Definition of a Set of Metrics for Assuring Data Warehouse Quality. Ph.D. Thesis, Univeristy of Castilla, La Mancha, Spain, 2004. [Google Scholar]
- Inmon, W.H. Building the Data Warehouse; John Wiley & Sons: Hoboken, NJ, USA, 2005. [Google Scholar]
- Kimball, R.; Ross, M. The Data Warehouse Lifecycle Toolkit, 2nd ed.; John Wiley & Sons: New York, NY, USA, 2002. [Google Scholar]
- Gosain, A.; Singh, J. Comprehensive complexity metric for data warehouse multidimensional model understandability. IET Softw. 2020, 14, 275–282. [Google Scholar] [CrossRef]
- Kumar, M.; Gosain, A.; Singh, Y. Empirical validation of structural metrics for predicting understandability of conceptual schemas for data warehouse. Int. J. Syst. Assur. Eng. Manag. 2014, 5, 291–306. [Google Scholar] [CrossRef]
- Serrano, M.; Calero, C.; Trujillo, J.; Luján-Mora, S.; Piattini, M. Empirical validation of metrics for conceptual models of data warehouses. In International Conference on Advanced Information Systems Engineering; Springer: Berlin/Heidelberg, Germany, 2004; pp. 506–520. [Google Scholar]
- Kumar, M. Validation of data warehouse requirements-model traceability metrics using a formal framework. In Proceedings of the 2015 2nd International Conference on Computing for Sustainable Global Development (INDIACom), New Delhi, India, 11–13 March 2015; IEEE: Piscataway, NJ, USA, 2015; pp. 216–221. [Google Scholar]
- Kumar, M.; Gosain, A.; Singh, Y. Quality-oriented requirements engineering approach for data warehouse. Int. J. Comput. Syst. Eng. 2012, 1, 127–138. [Google Scholar] [CrossRef]
- Kumar, M.; Gosain, A.; Singh, Y. On completeness and traceability metrics for data warehouse requirements engineering. Int. J. Comput. Syst. Eng. 2013, 1, 229–237. [Google Scholar] [CrossRef]
- Singh, T.; Kumar, M. Empirical Validation of Requirements Traceability Metrics for Requirements Model of Data Warehouse using SVM. In Proceedings of the 2020 IEEE 17th India Council International Conference (INDICON), New Delhi, India, 10–13 December 2020; IEEE: Piscataway, NJ, USA, 2020; pp. 1–5. [Google Scholar]
- Singh, T.; Kumar, M. Formally Investigating Traceability Metrics of Data Warehouse Requirements Model Using Briand’s Framework. In Proceedings of the 5th International Conference on Intelligent Computing and Control Systems (ICICCS), Madurai, India, 6–8 May 2021; IEEE: Piscataway, NJ, USA, 2021. [Google Scholar]
- Singh, T.; Kumar, M. Empirical study to predict the understandability of requirements schemas of data warehouse using requirements metrics. Int. J. Intell. Eng. Inform. 2021, 9, 329–354. [Google Scholar] [CrossRef]
- Singh, T.; Kumar, M. Theoretical Validation of Data Warehouse Requirements Metrics Based on Agent Goal Decision Information Model Using Zuse’s Framework. In The Communication and Intelligent Systems: Proceedings of ICCIS 2021; Springer Nature: Singapore, 2022; pp. 107–118. [Google Scholar]
- Singh, T.; Kumar, M. Investigating requirements completeness metrics for requirements schemas using requirements engineering approach of data warehouse: A formal and empirical validation. Arab. J. Sci. Eng. 2022, 47, 9527–9546. [Google Scholar] [CrossRef]
- Singh, T.; Patidar, V.; Singh, M. A novel metric for assessing structural complexity of data warehouse requirements models. Expert Syst. Appl. 2024, 255, 124754. [Google Scholar] [CrossRef]
- Singh, T.; Kaushik, B. Employ Metrics in the Data Warehouse’s Requirements Model for Hospitals. In Handbook on Augmenting Telehealth Services; CRC Press: Boca Raton, FL, USA, 2024; pp. 349–367. [Google Scholar]
- Williams, D.W.; Hall, T.; Kennedy, M. A framework for improving the requirements engineering process management. Softw. Qual. J. 1999, 8, 133–147. [Google Scholar] [CrossRef]
- Böhnlein, M.; Ulbrich-vom Ende, A. Business process oriented development of data warehouse structures. In Data Warehousing; Physica: Heidelberg, Germany, 2000; pp. 3–21. [Google Scholar]
- Winter, R.; Strauch, B. A method for demand-driven information requirements analysis in data warehousing projects. In Proceedings of the 36th Annual Hawaii International Conference on System Sciences, Waikoloa Village, HI, USA, 6–9 January 2003; IEEE: Piscataway, NJ, USA, 2003; p. 9. [Google Scholar]
- Winter, R.; Strauch, B. Information requirements engineering for data warehouse systems. In Proceedings of the 2004 ACM symposium on Applied computing, Nicosia, Cyprus, 14–17 March 2004; pp. 1359–1365. [Google Scholar]
- Kumar, M.; Gosain, A.; Singh, Y. Stakeholders driven requirements engineering approach for data warehouse development. J. Inf. Process. Syst. 2010, 6, 385–402. [Google Scholar] [CrossRef]
- Kumar, M.; Gosain, A.; Singh, Y. A novel requirements engineering approach for designing data warehouses. Int. J. Syst. Assur. Eng. Manag. 2016, 7, 205–221. [Google Scholar] [CrossRef]
- Amalfitano, D.; De Simone, V.; Scala, S.; Fasolino, A.R. A model-driven engineering approach for supporting questionnaire-based gap analysis processes through application lifecycle management systems. Softw. Qual. J. 2020, 28, 535–565. [Google Scholar] [CrossRef]
- Pargaonkar, S. Synergizing Requirements Engineering and Quality Assurance: A Comprehensive Exploration in Software Quality Engineering. Int. J. Sci. Res. 2023, 12, 2003–2007. [Google Scholar] [CrossRef]
- Prakash, N.; Gosain, A. Requirements Driven Data Warehouse Development. In Proceedings of the CAiSE short paper proceedings, Klagenfurt/Velden, Austria, 16–20 June 2003; Volume 252. [Google Scholar]
- Basili, V.R.; Weiss, D.M. A methodology for collecting valid software engineering data. IEEE Trans. Softw. Eng. 1984, 6, 728–738. [Google Scholar] [CrossRef]
- Wohlin, C.; Runeson, P.; Höst, M.; Ohlsson, M.C.; Regnell, B.; Wesslén, A. In Experimentation in Software Engineering; Springer Science & Business Media: Berlin/Heidelberg, Germany, 2012. [Google Scholar]
- Van Solingen, R.; Basili, V.; Caldiera, G.; Rombach, H.D. Goal question metric (gqm) approach. Encycl. Softw. Eng. 2002. [Google Scholar] [CrossRef]
- Carver, J.; Jaccheri, L.; Morasca, S.; Shull, F. Using empirical studies during software courses. In Empirical Methods and Studies in Software Engineering; Springer: Berlin/Heidelberg, Germany, 2003; pp. 81–103. [Google Scholar]
- Kitchenham, B.A.; Pfleeger, S.L.; Pickard, L.M.; Jones, P.W.; Hoaglin, D.C.; El Emam, K.; Rosenberg, J. Preliminary guidelines for empirical research in software engineering. IEEE Trans. Softw. Eng. 2002, 28, 721–734. [Google Scholar] [CrossRef]
- Serrano, M.A.; Calero, C.; Sahraoui, H.A.; Piattini, M. Empirical studies to assess the understandability of data warehouse schemas using structural metrics. Softw. Qual. J. 2008, 16, 79–106. [Google Scholar] [CrossRef]
- Arthur, D.; Vassilvitskii, S. Worst-case and smoothed analysis of the ICP algorithm, with an application to the k-means method. In Proceedings of the 2006 47th Annual IEEE Symposium on Foundations of Computer Science (FOCS’06), Berkeley, CA, USA, 21–24 October 2006; IEEE: Piscataway, NJ, USA, 2006; pp. 153–164. [Google Scholar]
- Hosmer, D.W.; Lemeshow, S. Applied Logistic Regression; John Wiley & Sons: New York, NY, USA, 2000. [Google Scholar]
- Gosain, A.; Singh, J. Investigating structural metrics for understandability prediction of data warehouse multidimensional schemas using machine learning techniques. Innov. Syst. Softw. Eng. 2018, 14, 59–80. [Google Scholar] [CrossRef]
- Dejaeger, K.; Verbraken, T.; Baesens, B. Toward comprehensible software fault prediction models using bayesian network classifiers. IEEE Trans. Softw. Eng. 2012, 39, 237–257. [Google Scholar] [CrossRef]
- John, G.H.; Langley, P. Estimating continuous distributions in Bayesian classifiers. arXiv 2013, arXiv:1302.4964. [Google Scholar]
- Izenman, A.J. Linear discriminant analysis. In Modern Multivariate Statistical Techniques; Springer: New York, NY, USA, 2013; pp. 237–280. [Google Scholar]
- Safavian, S.R.; Landgrebe, D. A survey of decision tree classifier methodology. IEEE Trans. Syst. Man Cybern. 1991, 21, 660–674. [Google Scholar] [CrossRef]
- Sarker, I.H.; Colman, A.; Han, J.; Khan, A.I.; Abushark, Y.B.; Salah, K. Behavdt: A behavioral decision tree learning to build user-centric context-aware predictive model. Mob. Netw. Appl. 2020, 25, 1151–1161. [Google Scholar] [CrossRef]
- Neves, M.; Vieira, M.; Neto, P. A study on a Q-Learning algorithm application to a manufacturing assembly problem. J. Manuf. Syst. 2021, 59, 426–440. [Google Scholar] [CrossRef]
- Pourpanah, F.; Tan, C.J.; Lim, C.P.; Mohamad-Saleh, J. A Q-learning-based multi-agent system for data classification. Appl. Soft Comput. 2017, 52, 519–531. [Google Scholar] [CrossRef]
- Kittler, J.; Alkoot, F.M. Sum versus vote fusion in multiple classifier systems. IEEE Trans. Pattern Anal. Mach. Intell. 2003, 25, 110–115. [Google Scholar] [CrossRef]
- Sokolova, M.; Japkowicz, N.; Szpakowicz, S. Beyond accuracy, F-score and ROC: A family of discriminant measures for performance evaluation. In Australasian Joint Conference on Artificial Intelligence; Springer: Berlin/Heidelberg, Germany, 2006; pp. 1015–1021. [Google Scholar]
- Witten, I.H.; Frank, E. Data mining: Practical machine learning tools and techniques with Java implementations. AcmSigmod Rec. 2002, 31, 76–77. [Google Scholar] [CrossRef]
- Koru, A.G.; Liu, H. Building effective defect-prediction models in practice. IEEE Softw. 2005, 22, 23–29. [Google Scholar] [CrossRef]
- El Emam, K.; Benlarbi, S.; Goel, N.; Rai, S. A Validation of Object-Oriented Metrics; National Research Council Canada, Institute for Information Technology: Ottawa, ON, Canada, 1999. [Google Scholar]
- Briand, L.C.; Wüst, J.; Daly, J.W.; Porter, D.V. Exploring the relationships between design measures and software quality in object-oriented systems. J. Syst. Softw. 2000, 51, 245–273. [Google Scholar] [CrossRef]
- Fawcett, T. An introduction to ROC analysis. Pattern Recognit. Lett. 2006, 27, 861–874. [Google Scholar] [CrossRef]
- Landis, J.R.; Koch, G.G. The measurement of observer agreement for categorical data. Biometrics 1977, 33, 159–174. [Google Scholar] [CrossRef] [PubMed]
- Stone, M. Cross-validatory choice and assessment of statistical predictions. J. R. Stat. Soc. Ser. B 1974, 36, 111–133. [Google Scholar] [CrossRef]
Disclaimer/Publisher’s Note: The statements, opinions and data contained in all publications are solely those of the individual author(s) and contributor(s) and not of MDPI and/or the editor(s). MDPI and/or the editor(s) disclaim responsibility for any injury to people or property resulting from any ideas, methods, instructions or products referred to in the content. |
© 2025 by the authors. Licensee MDPI, Basel, Switzerland. This article is an open access article distributed under the terms and conditions of the Creative Commons Attribution (CC BY) license (https://creativecommons.org/licenses/by/4.0/).