Article

Graph Anomaly Detection Algorithm Based on Multi-View Heterogeneity Resistant Network

1
School of Computer Science and Technology, Taiyuan Normal University, Jinzhong 030619, China
2
School of Computer and Information Technology, Shanxi University, Taiyuan 030006, China
3
James att School of Engineering, University of Glasgow, Glasgow G12 8QQ, UK
*
Author to whom correspondence should be addressed.
Information 2025, 16(11), 985; https://doi.org/10.3390/info16110985
Submission received: 3 October 2025 / Revised: 29 October 2025 / Accepted: 12 November 2025 / Published: 14 November 2025

Abstract

Graph anomaly detection (GAD) aims to identify nodes or edges that deviate from normal patterns. However, the presence of heterophilic edges in graphs leads to feature over-smoothing issues. To overcome this limitation, this paper proposes the multi-view heterogeneity resistant network (MV-GHRN) model, which progressively purifies heterophilic edges through multi-view collaboration. First, to address the noise sensitivity of single predictions, the method computes post-aggregation (PA) scores for both the original graph and its perturbed versions and performs weighted fusion, leveraging the consistency of multiple prediction perspectives to enhance the reliability of heterophilic edge identification. Second, a cosine similarity view is introduced as a complementary structural perspective, with both views independently completing heterophilic edge pruning to clean the graph structure from both topological and feature dimensions. Finally, a cross-view self-distillation mechanism is designed, using the fused predictions from the two purified views as teacher signals to guide the optimization of each view in reverse, correcting feature biases caused by heterophilic edges. Experiments on benchmark datasets such as YelpChi and Amazon demonstrate that the framework significantly outperforms existing methods. For instance, on the YelpChi dataset, MV-GHRN surpasses the best baseline by 16.8% and 5.2% in F1-Macro and AUC, respectively, validating the effectiveness of the progressive multi-view purification mechanism.

1. Introduction

As fraudulent activities on Internet platforms become increasingly complex, graph anomaly detection (GAD) methods based on graph neural networks (GNNs) have shown significant value in areas such as social network analysis and financial risk control. Traditional GNN methods, such as GCNs [1] and GATs [2], rely on homogeneity assumptions. However, in anomaly detection, graphs exhibit strong heterophily—connections between abnormal and normal nodes cause feature over-smoothing, weakening anomaly recognition [3,4].
To address heterophily, researchers have proposed improvements through neighbor screening or spectral filtering [5,6,7]. However, they still face two key limitations: (1) single-view scoring mechanisms are vulnerable to prediction errors; and (2) a lack of multi-perspective collaboration limits the capture of complex anomaly patterns. Meanwhile, existing multi-view [8,9,10,11] methods rely on random perturbations, failing to exploit heterophilic characteristics.
To address these issues, we propose MV-GHRN, which stabilizes heterophilic edge detection through multi-view PA scoring and cross-view collaboration. Specifically, we construct structural and semantic views, employ joint edge pruning, and introduce cross-view distillation to enhance anomaly detection in heterophilic graphs.
The key contributions are as follows:
(1)
This paper proposes a multi-view PA scoring mechanism that introduces a new perspective for heterophilic edge detection, with theoretical proof that increasing views reduces PA score variance and enhances model stability;
(2)
A cross-view joint edge pruning strategy is designed to integrate structural and semantic perspectives, overcoming single-view methods’ limitations in heterophilic anomaly detection;
(3)
A multi-view self-distillation mechanism is introduced to exploit cross-view consistency as a regularization signal for anomaly learning.

2. Related Work

Early studies on graph anomaly detection (GAD) mainly relied on manual feature engineering (e.g., node degree, clustering coefficient) or shallow models such as isolation forests and local outlier factors. However, these approaches struggle to capture complex structural dependencies in graphs. With the rise of graph neural networks (GNNs) [12], deep learning-based GAD methods have become mainstream.
Existing GNN-based approaches addressing heterophilyin graph anomaly detection can generally be categorized into spatial and spectral methods.
From the spatial perspective, researchers aim to suppress noisy or cross-class edges by improving neighborhood selection and pruning strategies. Representative works include attention-based neighbor weighting and edge reweighting [13,14], as well as reinforcement learning or heuristic-based edge pruning [15,16]. These methods have achieved notable progress in fraud and misinformation detection, but are still prone to error accumulation and over-pruning in highly noisy or complex graph structures.
From a spectral perspective, models analyze graph signals in the frequency domain to distinguish homophilous from heterophilous connections. For example, GPR-GNN [17] learns adaptive filters to integrate low-frequency and high-frequency information, thereby alleviating over-smoothing. GHRN [7] further establishes a theoretical connection between the smoothness of label signals and the heterophily ratio, and introduces the PA score to quantify high-frequency components in node representations. By identifying cross-class edges via PA scores, GHRN effectively prunes noisy high-frequency edges and improves accuracy. Nevertheless, GHRN is restricted to a single-view structural perspective and lacks the ability to jointly model multiple modalities or relational views.
To further enhance performance in complex environments, recent studies have explored multi-view graph learning [18]. Multi-view models capture diverse behavioral patterns of nodes across different feature spaces or relational modalities, improving the detection of complex anomalies. For instance, Chen et al. [19] proposed a framework for anomaly detection on multi-view attributed networks, and Duan et al. [20] introduced a multi-scale contrastive learning framework with augmented view for graph anomaly detection.
In summary, current GAD studies still face several limitations:
  • Limited capability to suppress noise arising from strongly heterophilous connections, which often leads to unstable message propagation;
  • Lack of consistent representation learning under multi-view or multimodal scenarios, resulting in incomplete anomaly characterization;
  • Information conflicts and structural distortion during cross-view fusion, causing significant loss of global graph information.
These limitations motivate our research. To overcome them, this paper proposes a graph neural network framework that integrates multi-view generation and edge pruning, along with a cross-view self-distillation loss to enforce consistency among different views. By incorporating the PA-based high-frequency suppression idea [7], our framework effectively identifies and mitigates noisy edges across multiple views, preserving global structural semantics while reducing inter-view conflicts. This design directly addresses the aforementioned challenges and leads to more accurate anomaly detection on graphs.

3. Preliminary Knowledge

A graph anomaly detection (GAD) [21] task aims to identify anomalous nodes in the graph. Given a graph G = { V , E , X } , where V = { v 1 , v 2 , , v n } is the set of nodes, where v i represents a node in the graph, E is the set of edges, X is the node feature matrix, and the goal of the task is to compute an anomaly score vector S = { s 1 , s 2 , s n } , where s i represents the anomaly probability of node v i .
Multi-view graph learning generates multiple views { G v } v = 1 K from graph G, where each view G v = { V , E v , X v } captures different structural or feature information. Views are fused through weighted aggregation:
y ^ = v = 1 K w v y v
where y v is the output of view v, and w v is the corresponding weight.
Graph pruning removes noisy edges across multiple views. In multi-view settings, edge ( i , j ) is removed only if it is identified as noise in all views:
A i j = 0 if ( i , j ) is noise in all views A i j otherwise
where A is the pruned adjacency matrix.

4. Implementation of MV-GHRN

This paper proposes a framework for image anomaly detection based on multi-view PA scores. Through theoretical analysis, we demonstrate that the variance of multi-view PA scores decreases with the number of views, thereby improving the stability of the scores.

4.1. Single-View PA Scoring and Its Characteristics

4.1.1. Single-View PA Scoring

Following the theoretical formulation in GRHN [7], we first review the single-view PA score computation (Equations (3)–(5)) before extending it to the multi-view setting.
For view k, the PA score is defined:
S k = L ^ k Y ^ k
where L ^ k = I D ^ k 1 A ^ is the random walk normalized graph Laplacian matrix of view k (with added self-loops), Y ^ k is the node prediction label. For node i, its PA score can be expressed:
S i k = SIGN × d i k d i k + 1 hetero k ( i ) , d i k d i k + 1 hetero k ( i )
where SIGN is the node class sign (normal node is 1, abnormal node is −1), d i k is the degree of node i in view k, heterok(i) is the heterophily of node i in view k, defined as the proportion connected to nodes of different classes. Since abnormal nodes usually have higher heterophily, while normal nodes have lower heterophily, the value order of the PA score inner product:
S v V a · S v V a > S v V n · S v V n > 0 > S v V a · S v V n
where V a represents the set of abnormal nodes; V n represents the set of normal nodes. This ordering relationship clearly shows that edges connecting nodes of different classes (heterophilic edges) have negative-PA-score inner products, while edges connecting nodes of the same class (homophilic edges) have positive-PA-score inner products.

4.1.2. Prediction Error Analysis of Single-View PA Scores

To motivate our multi-view approach, we analyze the prediction error impact following the theoretical formulation in GHRN [7]. Let the true label of node i be y i , and the predicted label in view k be y ^ i k ; the prediction error is Δ i k = y ^ i k y i .
For normal nodes ( y i = 0 ), the PA score in the presence of a prediction error can be expressed as [7]
s i 0 k = d i k h i k d i k + 1 1 E 0 k E 1 k + E 0 k Δ i k h i k
For abnormal nodes ( y i = 1 ), the PA score is
s i 1 k = d i k h i k d i k + 1 1 + E 1 k E 0 k E 0 k Δ i k h i k
where E 0 k and E 1 k are the mean of the predicted error for normal nodes and abnormal nodes in view k, respectively; h i k is the heterophily of node i in view k. From Equations (6) and (7), we observe that the single-view PA score variance is proportional to the prediction error variance:
Var ( S i k ) ( d i k ) 2 ( d i k + 1 ) 2 · Var ( Δ i k )
This variance relationship motivates our multi-view fusion strategy.

4.2. Multi-View PA Scoring Theoretical Framework

4.2.1. Multi-View PA Score Definition

To reduce the impact of single-view prediction error, this paper proposes multi-view PA score:
S i multi = k = 1 K w k S i k
where w k is the weight of view k, satisfying k = 1 K w k = 1 . For the equal-weight case, w k = 1 / K . It maintains the basic characteristics of single-view PA score. In Figure 1a,b show the single-view and multi-view PA scores, respectively, while Figure 1c displays ground truth labels. Single-view PA scores poorly identify some heterophilic edges (with scores close to zero), which is consistent with Equation (5).

4.2.2. ANOVA of Multi-View PA Scores

We extend the single-view PA score formulation from GRHN [7] to derive a multi-view variance analysis. To understand the mechanism by which multi-view fusion reduces prediction variance, we first analyze the effect of multi-view fusion under ideal conditions.
Theorem 1. 
Under equal-weight fusion (i.e., w k = 1 / K for all k), if the prediction errors of each view are independent, the variance of the multi-view PA score satisfies
Var ( S i multi ) 1 K max k Var ( S i k )
Proof. 
Under the equal-weight assumption w k = 1 / K and view independence, we have
Var ( S i multi ) = Var 1 K k = 1 K S i k = 1 K 2 k = 1 K Var ( S i k ) 1 K 2 k = 1 K max k Var ( S i k ) = 1 K 2 · K · max k Var ( S i k ) = 1 K max k Var ( S i k )
This shows that variance decreases as O ( 1 / K ) with the number of views. □
Practical Case with Correlation: In practice, views are derived from the same data and exhibit correlation. Under equal-weight fusion ( w k = 1 / K ) with correlation coefficient ρ , the variance becomes
Var ( S i multi ) = 1 K 2 k = 1 K Var ( S i k ) + 2 K 2 j = 1 K 1 l = j + 1 K Cov ( S i j , S i l )
For the first term, 1 K 2 k = 1 K Var ( S i k ) 1 K max k Var ( S i k ) . For the covariance term, by the Cauchy–Schwarz inequality,
Cov ( S i j , S i l ) ρ · max k Var ( S i k )
Therefore,
2 K 2 j = 1 K 1 l = j + 1 K Cov ( S i j , S i l ) 2 K 2 · K ( K 1 ) 2 · ρ · max k Var ( S i k ) = ρ ( K 1 ) K max k Var ( S i k )
The variance upper bound considering correlation is
Var ( S i multi ) 1 + ρ ( K 1 ) K max k Var ( S i k )
When ρ = 0 , this reduces to Theorem 1. For ρ < 1 and K 2 , we have Var ( S i multi ) < max k Var ( S i k ) , confirming variance reduction.
Remark on Weight Selection:
Equal-weighting is adopted for two reasons:
(1)
Theoretically, it minimizes variance when view variances are comparable (proven by Cauchy–Schwarz inequality);
(2)
It avoids introducing additional hyperparameters. The variance reduction observed in Figure 2 (8.02% and 9.82% on Amazon and Yelp) validates this design choice.

4.3. Complexity Analysis

This section analyzes the time complexity of the proposed multi-view anomaly detection algorithm.
First phase (view generation and independent training): The computational bottleneck of the algorithm lies in the construction of similarity-based views, which requires computing the similarity between all pairs of nodes. The time complexity is O ( | V | 2 d ) , where | V | is the number of nodes and d is the feature dimension. In comparison, the independent training complexity for four views is O ( | V | h 2 ) , where h is the dimension of the hidden layer. In practical applications, view generation is guided by batch-wise steps.
Second phase (pruning and fusion): The graph pruning process requires sorting edges, with complexity O ( | | A | | 0 log | | A | | 0 ) , where | | A | | 0 is the number of edges. Fusion training is batch-processed and optimized to O ( | V | h 2 / B ) , where B is the batch size.
Total complexity: The overall time complexity of the algorithm is O ( | V | 2 d ) , dominated by the first phase of view generation.

4.4. Multi-View Graph Heterogeneity-Resistant Network

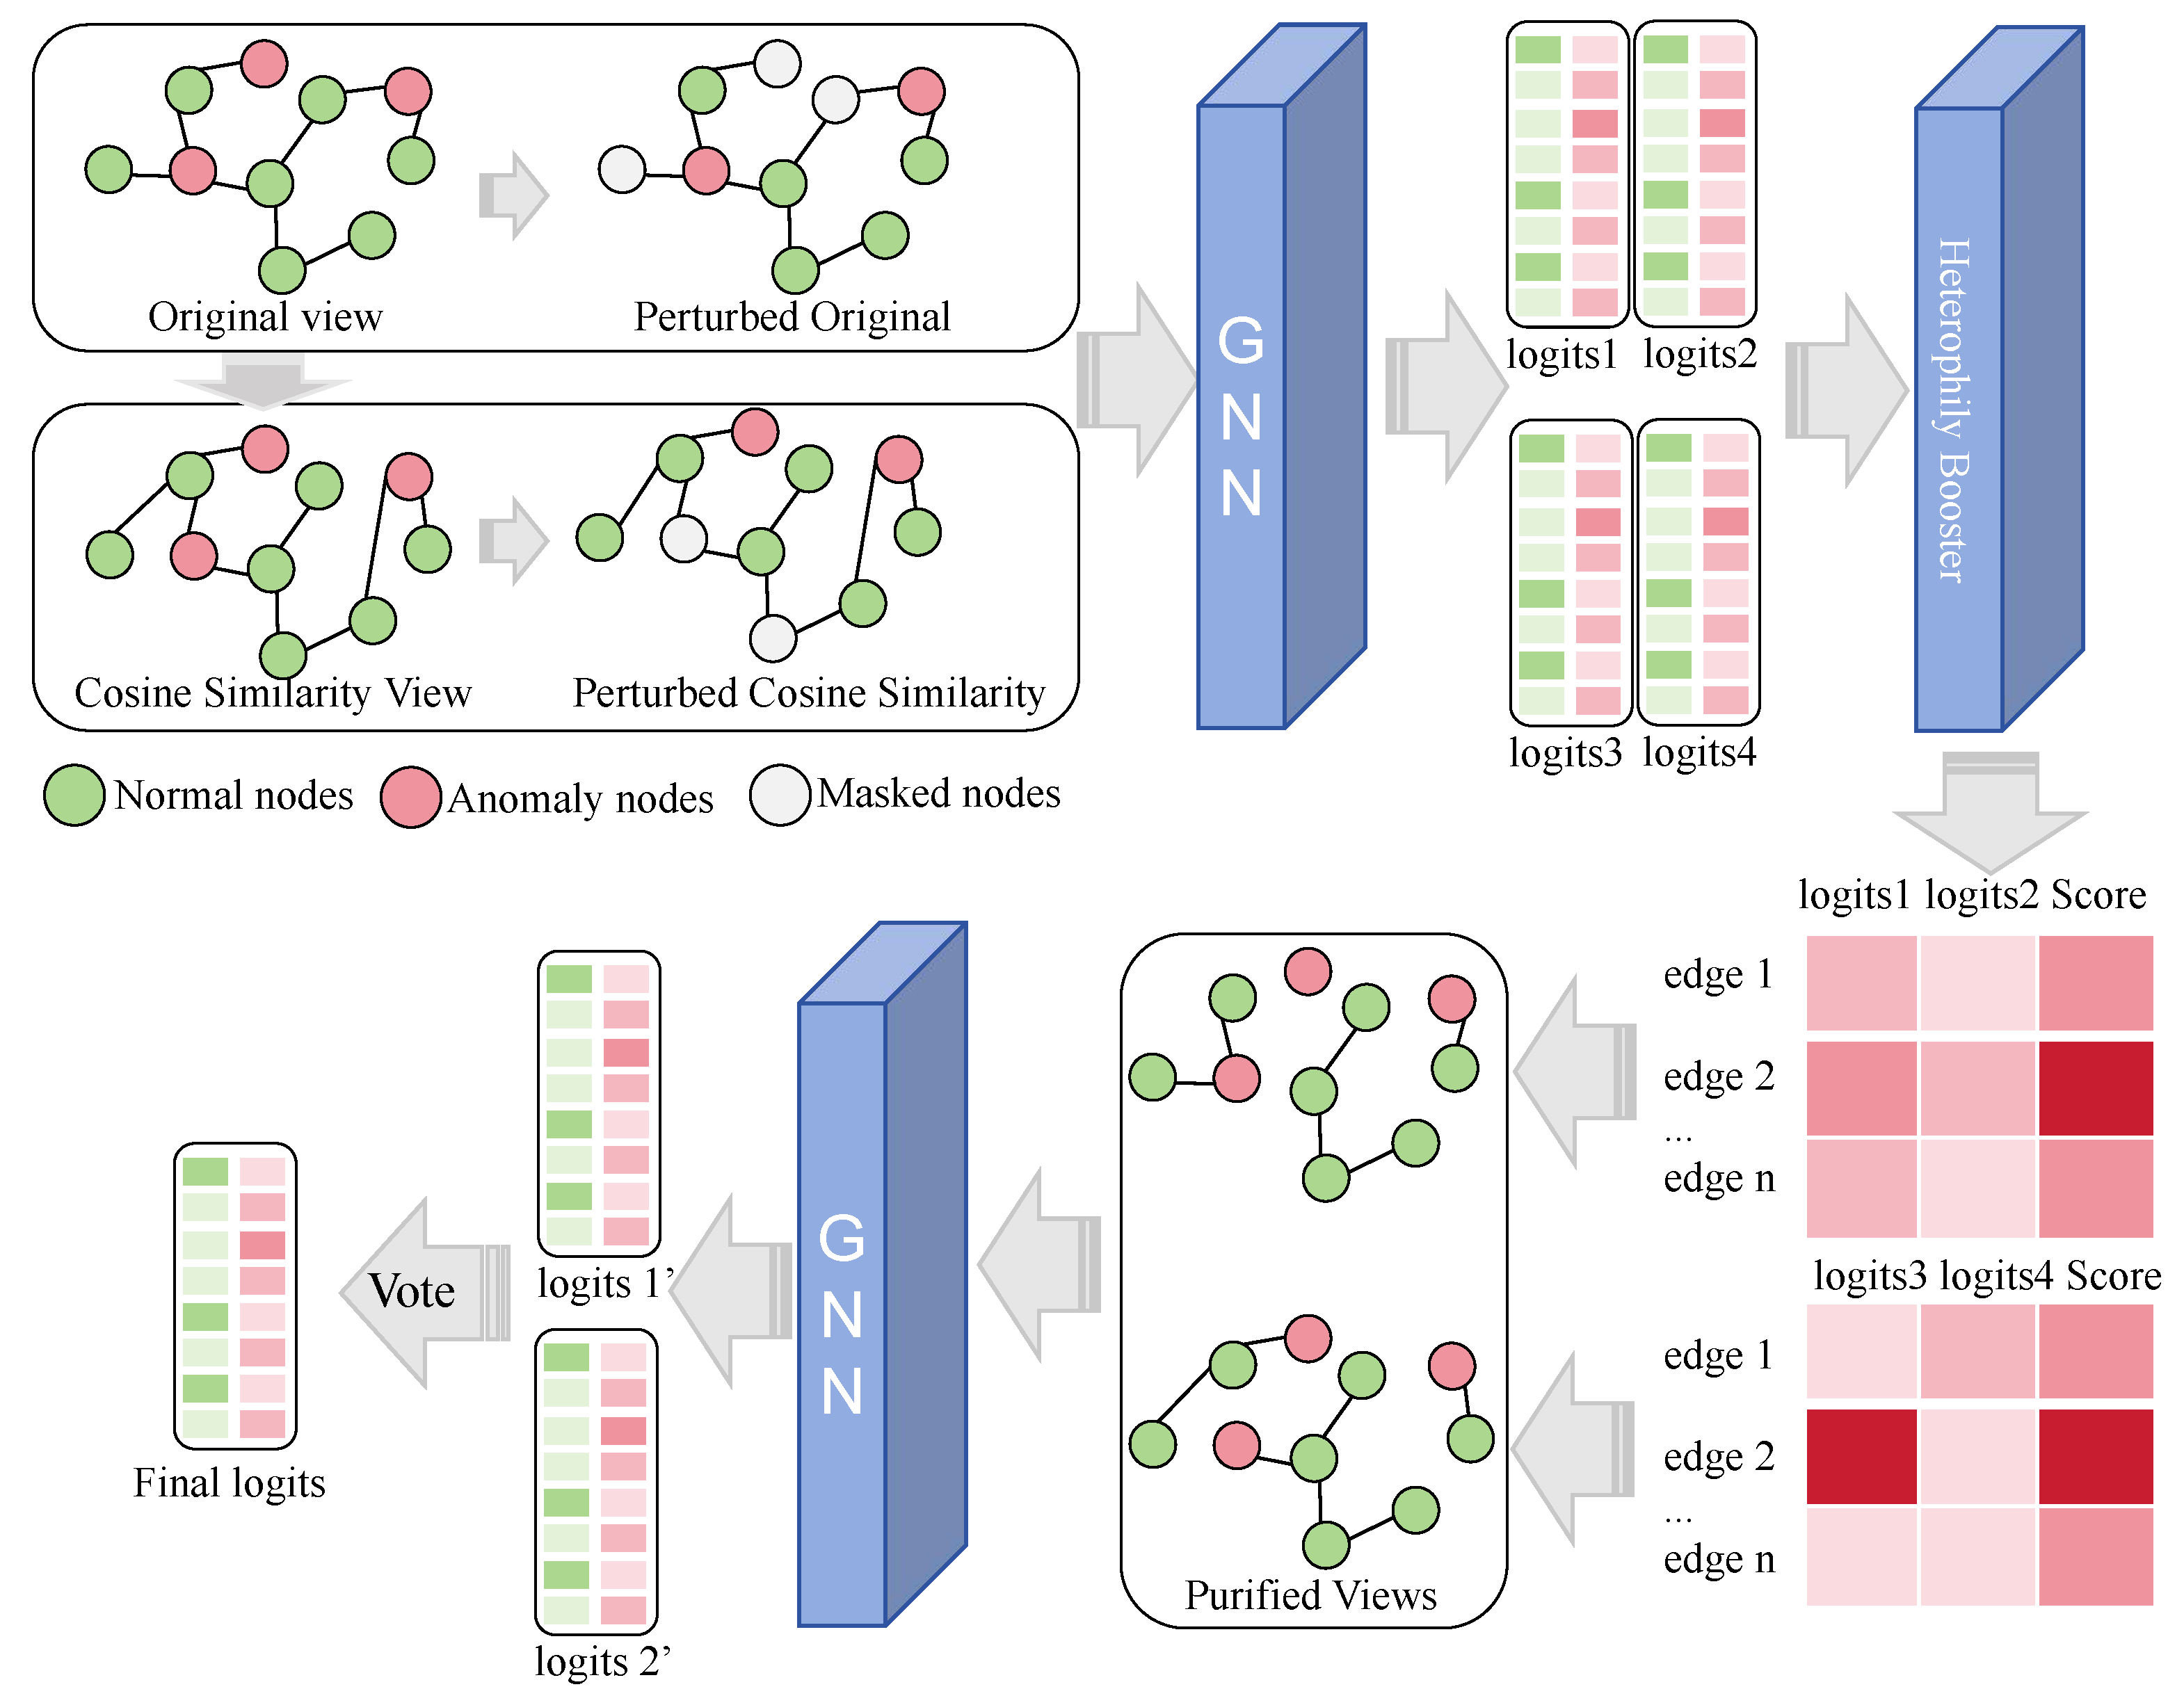
The overall framework of the multi-view heterogeneity-resistant network is shown in Figure 3. This framework enhances the anomaly detection capability in graphs through the fusion of multi-view information.
In MV-GHRN, first from the input graph G, two complementary views (view1, view2, …, viewn) are generated, and perturbed views Perturbed_view1, Perturbed_view2, …, Perturbed_viewn are generated for each view.
GNN encoders separately encode these views to obtain node representations. Based on these representations Y ^ k , a high-pass filter is designed to compute the edge heterophily score for each view:
E k = L Y ^ k Y ^ k T L T , k { 1 , 2 , , n }
Based on the previous analysis, the E value of heterophilic edges is greater than that of homogeneous edges, which establishes the foundation for the pruning strategy. Then, through top-K sampling, the highest heterophilic edges are selected and their scores E are binarized to B, thereby pruning each view to obtain the pruned graph G p :
G p = { V , ( B 1 , B 2 , , B n ) A , X }
After obtaining the pruned subgraphs, the model proceeds to the joint optimization stage, which integrates supervision and self-distillation to achieve consistent prediction across multiple views.
In this stage, each view-specific encoder produces its own prediction distribution P k , and all these predictions are fused through a voting-based strategy to form the teacher distribution P vote . The teacher then guides each student (view-specific model) through a distillation objective, defined as
L distill = k = 1 n T 2 · D KL P k T P vote T ,
where P k T = softmax ( Y ^ k / T ) and P vote T = softmax ( Y ^ * / T ) represent the softened probability distributions under temperature T. This formulation transfers knowledge from the fused teacher prediction to individual student models, enabling cross-view consistency and reducing prediction variance.
Meanwhile, the cross-entropy loss ensures supervised learning at the node level:
L ce = v V log ( y v · σ ( y ^ v ) ) .
The total loss is a weighted combination of these two objectives:
L = L ce + L distill .
This self-distillation process enables multi-view encoders to learn collaboratively, ensuring consistency among views.

5. Results

This section conducts experiments on publicly available datasets and reports results for MV-GHRN alongside several state-of-the-art baseline methods to demonstrate the effectiveness of the proposed model.

5.1. Experimental Setup

5.1.1. Dataset

This study conducted experiments using two public graph anomaly detection datasets: YelpChi and Amazon [5]. The YelpChi dataset consists of a network of merchant reviews, used to detect fake reviews; the Amazon dataset, similarly, consists of a network of product reviews, used to identify fraudulent reviews. Information from the datasets is shown in Table 1.

5.1.2. Evaluation Metrics

Since graph anomaly detection is a class-imbalanced classification task, we adopt two widely used evaluation metrics: F1-macro and AUC. F1-macro reflects the average classification performance across classes, while AUC measures the overall trade-off between true and false positive rates. Higher values of both metrics indicate better performance.

5.1.3. Experimental Environment and Model Configuration

The experimental environment is based on the PyTorch and DGL frameworks, utilizing GPU-accelerated computing. The model configuration was set to 64 hidden layer dimensions, 100 training epochs, a batch size of 5000, and an Adam optimizer with a learning rate of 0.01. Different datasets have different pruning ratios: 0.01 for the Amazon dataset and 0.1 for the Yelp dataset. The temperature coefficient is 2, and the training set size is 0.4.
The experiment uses a two-stage training strategy: the first stage independently trains four view models (original view1, original view2, and a perturbed version). The second stage uses the predictions from the first stage to optimize the graph structure and jointly train all views through a voting mechanism and knowledge distillation. For multi-view generation, view1 uses the adjacency matrix of the original graph, while view2 is constructed based on the cosine similarity of node features (threshold 0.95). A perturbed version of each view is also generated using a node feature mask.

5.2. Comparative Experiments

In this section, we compared MV-GHRN with leading baseline models, including traditional GNNs (GCN [1], JKNet [22]), fraud detection methods (CARE-GNN [5], PC-GNN [23]), heterogeneous-aware models (H2GCN [3], MixHop [24], GPRGNN [25], BWGNN [26], GHRN [7]), and recent state-of-the-art methods (SEC-GFD [27], PMP [28]). As shown in Table 2, MV-GHRN achieved state-of-the-art performance on both datasets.
On the YelpChi dataset, MV-GHRN achieved significant improvements, reaching an F1-Macro of 0.9551 and an AUC of 0.9882, outperforming the previous best method, PMP, by 13.72% and 4.85%, respectively. Traditional GNNs (GCN and CARE-GNN) completely failed, with F1-Macro below 0.52, while single-view heterogeneity methods (GHRN and BWGNN) only achieved approximately 0.78. This significant performance gap suggests that the high heterogeneity of YelpChi requires a multi-view mechanism to effectively capture structural and semantic fraud patterns. On the Amazon dataset, MV-GHRN achieved an F1-Macro of 0.9285 and an AUC of 0.9793, maintaining competitive performance with top baselines. While the absolute improvement over YelpChi is smaller, our model consistently outperforms or matches the best single-metric results across various methods (SEC-GFD: AUC 0.9823, with our F1-Macro exceeding 0.9235). Notably, MV-GHRN achieves balanced performance on both metrics without needing to be tailored to specific dataset characteristics, demonstrating the robustness and generalizability of our multi-view framework. This consistency across datasets with varying levels of heterogeneity validates our approach’s ability to provide reliable fraud detection across a wide range of graph structures.

5.3. Sensitivity Analysis

Pruning Ratio: We evaluate different pruning ratios on both datasets (Figure 4). On YelpChi, performance degrades substantially with increasing ratios: F1-Macro drops from 0.9551 (ratio 0.1) to 0.8386 (ratio 0.5), a 12.2% decline, while AUC decreases by 3.8%. On Amazon, the model exhibits lower sensitivity in the range 0.01–0.03, with F1-Macro and AUC fluctuating within 1.1% and 1.3%, respectively, peaking at a ratio of 0.01 (AUC: 0.9793). These results indicate that excessive pruning removes critical fraud-related edges, with F1-Macro being more sensitive than AUC due to its dependence on precision–recall balance. We adopt a pruning ratio of 0.1 for YelpChi and 0.01 for Amazon based on their respective optimal performance.
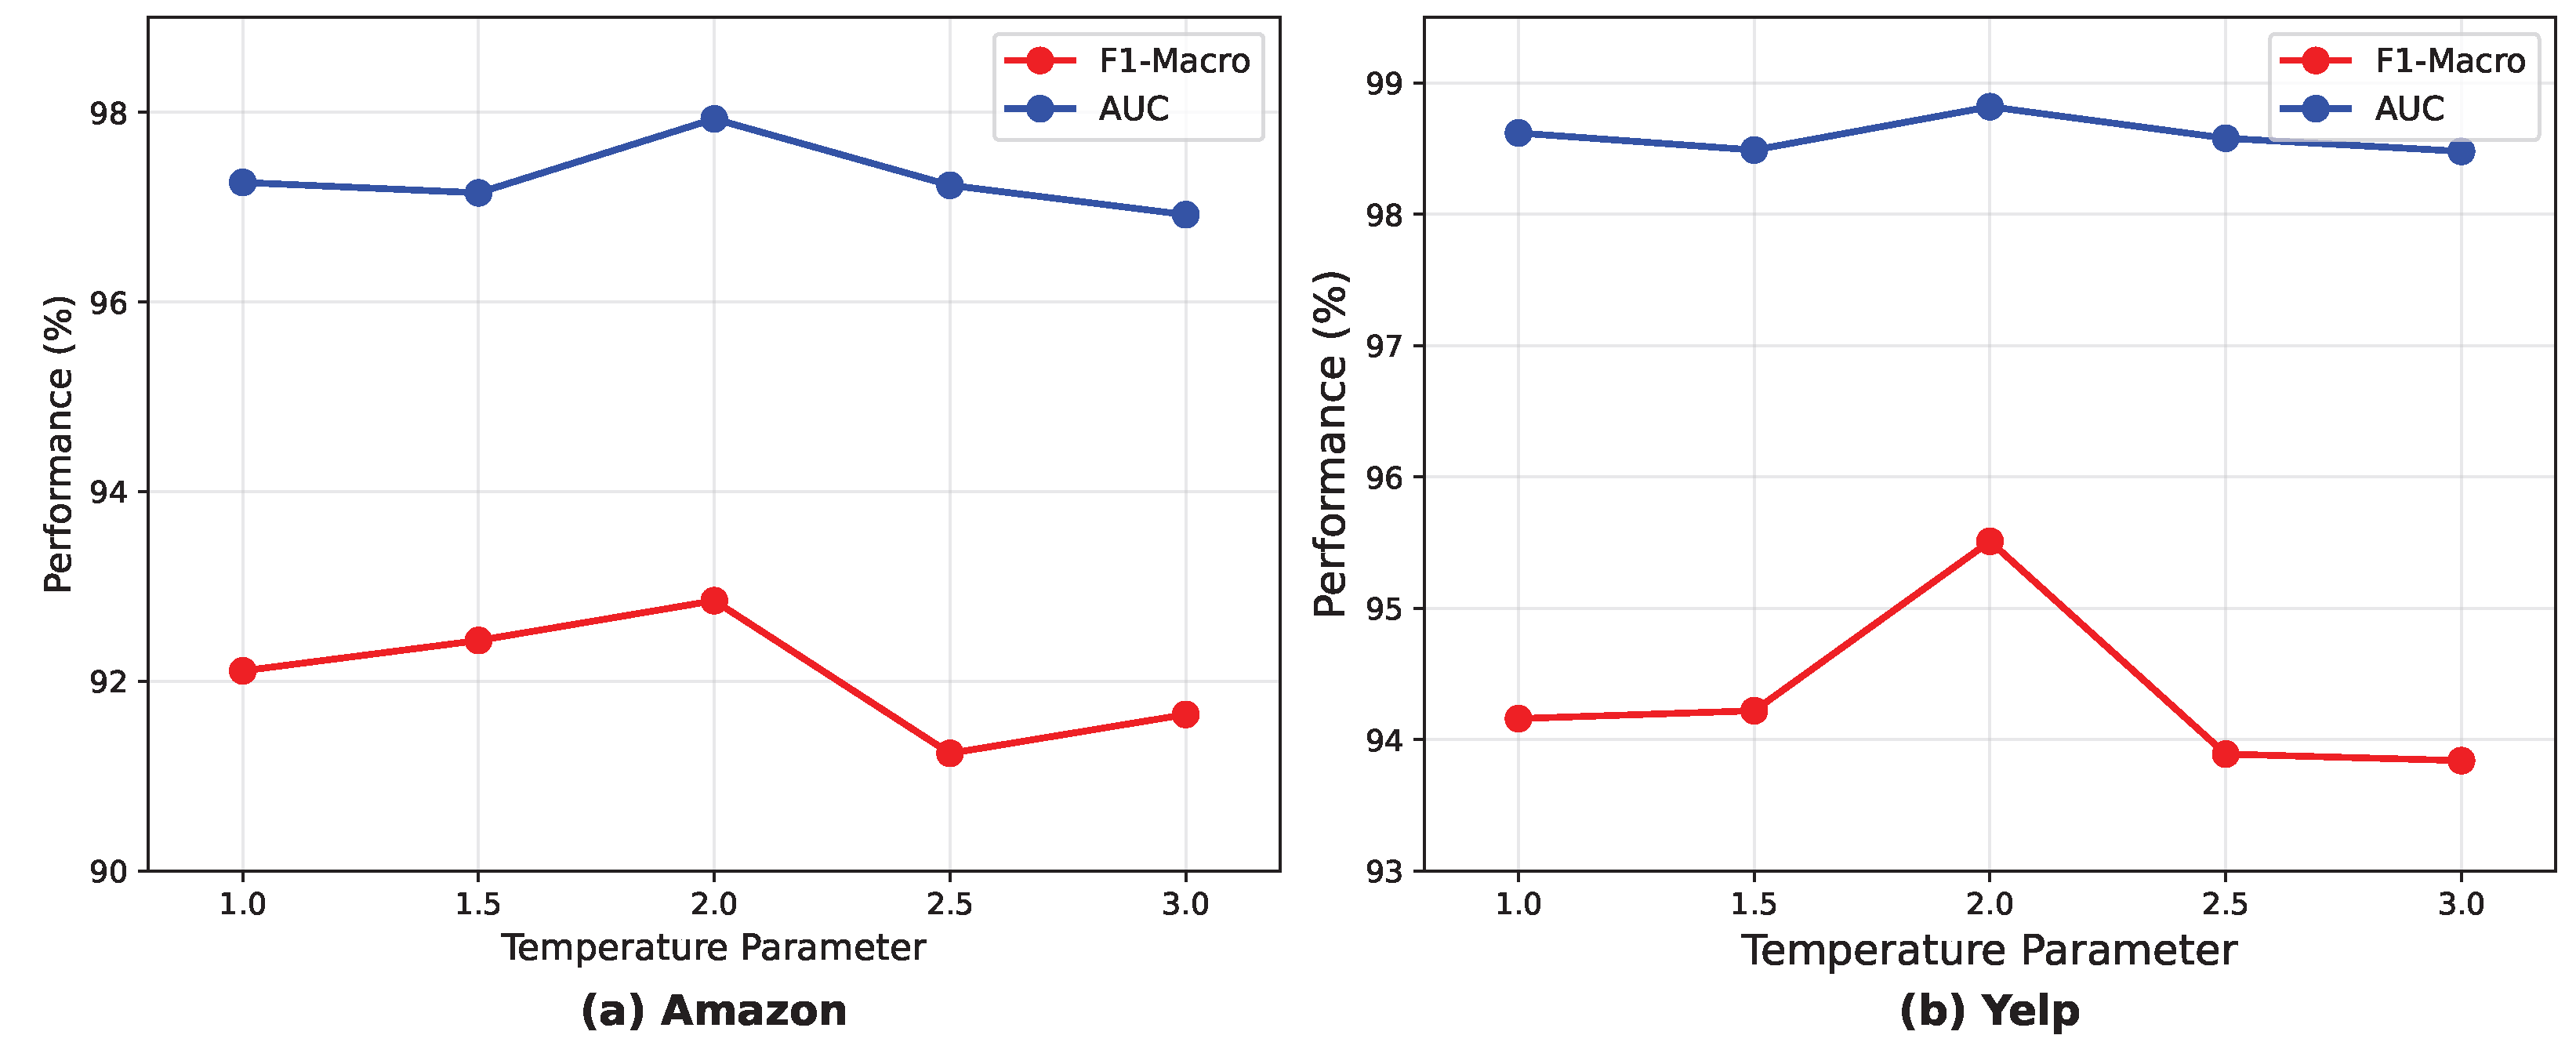
Temperature Parameter: We vary the temperature T from 1.0 to 3.0 in the distillation loss (Figure 5). On both datasets, performance exhibits a similar pattern: metrics peak at T = 2.0 and decline at extreme values. Low temperatures ( T = 1.0 ) produced overly sharp probability distributions, making the student’s views overconfident and less receptive to ensemble guidance, thus limiting knowledge transfer. High temperatures ( T = 3.0 ) over-smooth the distributions, diluting the discriminative signals in the ensemble predictions and weakening the supervision effect. At T = 2.0 , the temperature balances distribution smoothness and information preservation, enabling effective cross-view knowledge distillation. The model demonstrates relatively low sensitivity to temperature, with performance fluctuations below 2% across the tested range, indicating robust distillation effectiveness. We adopt T = 2.0 as the default parameter.

5.4. Performance Evaluation Under Different Perturbation Ratios

We evaluate the impact of node feature masking on model performance across perturbation ratios from 0.0 to 0.8 on the Yelp dataset. As shown in Figure 6, the model achieves optimal performance at a ratio of 0.1 with F1-Macro of 0.9551 and AUC of 0.9882, representing improvements of 3.13% and 6.81% over the baseline (0.9238, 0.9201), respectively.
When the perturbation ratio exceeds 0.1, F1-Macro gradually declines to 0.9405 at a ratio of 0.2 and stabilizes around 0.94 at higher ratios, while AUC consistently remains at approximately 0.98. This performance pattern reveals an optimal augmentation threshold where regularization benefits are maximized before information loss becomes detrimental. At a ratio of 0.1, masking 10% of nodes introduces sufficient noise to prevent the multi-view framework from overfitting to specific node features while retaining 90% of the original information for accurate fraud pattern recognition. When the ratio exceeds 0.1, F1-Macro drops sharply to 0.9413, indicating that excessive masking degrades the quality of individual view predictions. This degradation propagates through our multi-view architecture, as each perturbed view provides less reliable fraud signals, thereby compromising the ensemble’s overall effectiveness.

5.5. Analysis of the Impact of Edge Pruning on Heterophily

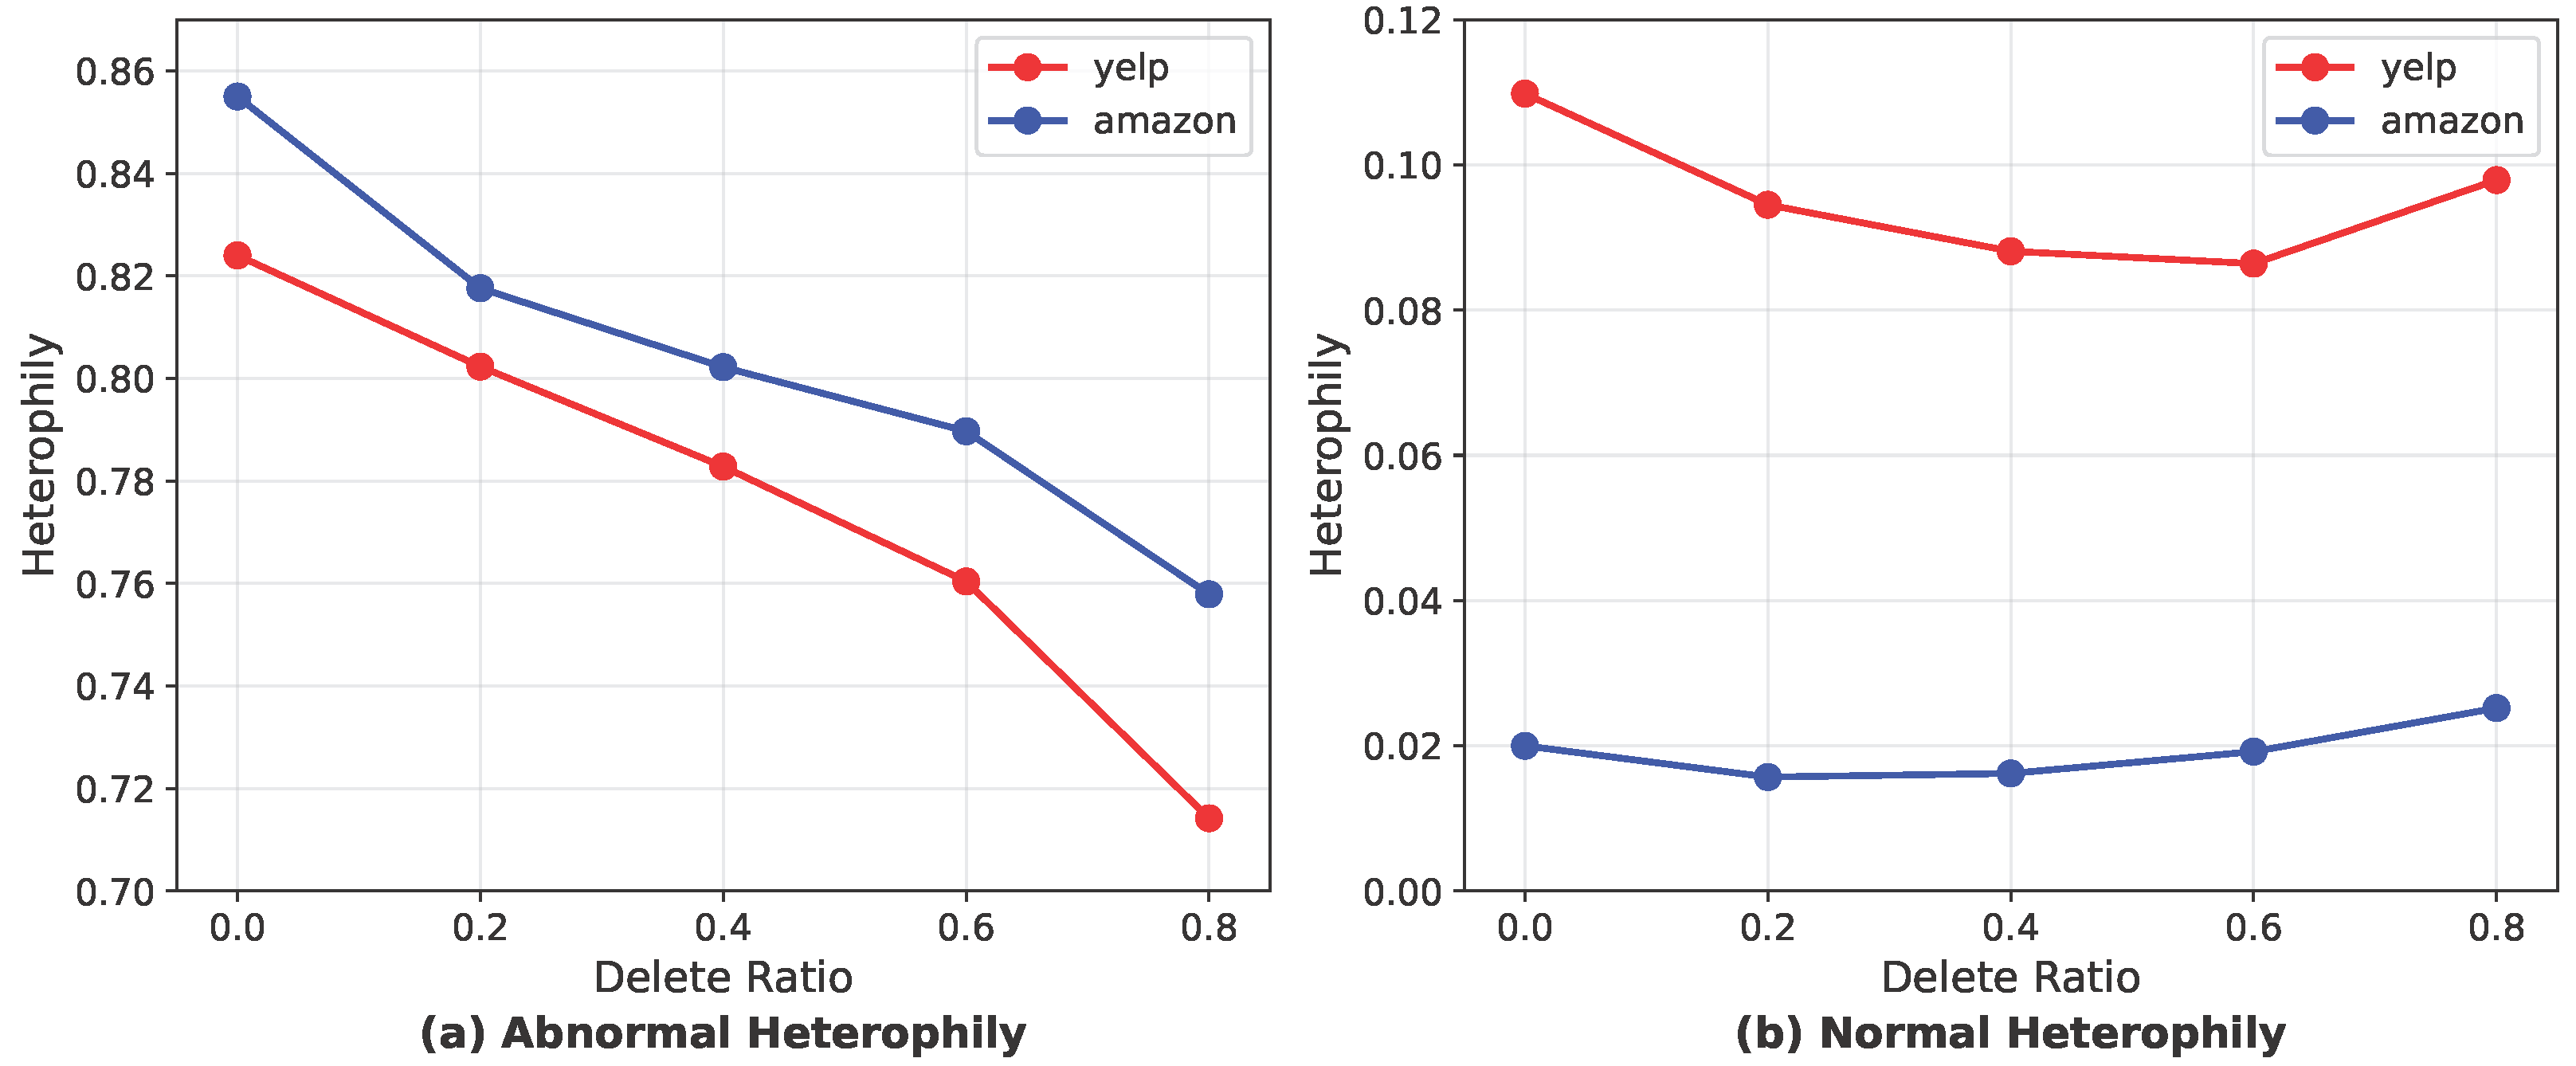
We evaluate how pruning affects graph heterophily on both datasets (Figure 7). As the pruning ratio increases, heterophily of anomalous nodes decreases substantially: from 0.825 to 0.714 on YelpChi and from 0.855 to 0.725 on Amazon. This demonstrates that our edge pruning strategy effectively removes noisy connections between anomalous and normal nodes, creating cleaner neighborhood structures for fraud detection. Normal node heterophily exhibits a more complex pattern, initially decreasing with low pruning ratios (reaching a minimum at 0.2–0.4 on Amazon) but slightly rebounding at higher ratios. This rebound occurs because aggressive pruning indirectly affects different normal nodes to varying degrees, causing representational divergence within the normal node population. Nevertheless, MV-GHRN successfully reduces overall graph heterophily, particularly for anomalous nodes, which is critical for improving GNN performance in fraud detection tasks.

5.6. Ablation Study

To assess the contribution of each component in MV-GHRN, we conducted ablation experiments focusing on the effects of multi-view fusion and pruning. Eight model variants were designed, covering four view combinations with and without pruning (Table 3). Results on the Amazon dataset show that pruning consistently improves model robustness and performance. For the base model, pruning caused only a negligible drop in F1-Macro (0.9194 → 0.9183). However, when perturbed views were added, pruning led to a clear improvement (0.9244 → 0.9267), indicating its role in enhancing robustness to structural noise. In the cosine similarity view, pruning substantially improved F1-Macro (0.9164 → 0.9301), demonstrating its ability to remove noisy edges and highlight semantic relations between nodes. Although the unpruned version achieved a slightly higher AUC (0.9691), the difference was minor. The full model, integrating all three views, achieved the best overall results: the pruned version reached an AUC of 0.9793, surpassing the unpruned one (0.9656) by 1.37%. These findings confirm that pruning and multi-view fusion are complementary—pruning filters noise while multi-view integration captures diverse structural patterns—jointly enhancing performance under graph heterophily.

5.7. Generalization to Additional Datasets

To further validate the generalization capability of our method, we conducted experiments on two additional datasets: Weibo and Reddit [29]. Due to resource constraints, we compared our method (MV-GHRN) with three representative baselines: GCN, BWGNN, and GHRN.
Table 4 shows the results. Weibo, characterized by cascade propagation structures and relatively homophilous interaction patterns, exhibits high detection performance across all methods (F1-Macro > 90%, AUC > 96%). In contrast, Reddit features complex hierarchical discussion structures with nested comment trees and exhibits stronger heterophilous characteristics, where nodes with opposing stances (e.g., debunking comments on fake posts) frequently interact, resulting in significantly lower performance across all approaches (F1-Macro: 49.15–54.88; AUC: 60.40–70.72). Our method achieves state-of-the-art performance on both datasets, with particularly notable improvements on Reddit (4.59% AUC improvement over GHRN, the strongest baseline). This demonstrates that our multi-view representation learning is especially effective for datasets with heterophilous interaction patterns and diverse discourse structures.

6. Conclusions

This paper proposes MV-GHRN, a multi-view ensemble framework for graph anomaly detection that addresses heterophily challenges through complementary graph views, heterophily scoring-based edge pruning, and adaptive view fusion. Experiments on four fraud detection datasets (YelpChi, Amazon, Weibo, Reddit) demonstrate superior performance, achieving 13.72% F1-Macro improvement over previous state-of-the-art on highly heterophilic graphs while maintaining competitive results across varying heterophily levels. Sensitivity analysis reveals that the model demonstrates robust performance with low sensitivity to key hyperparameters, with performance fluctuations below 2% for the temperature parameter and stable behavior within optimal pruning ranges.

6.1. Limitations

Despite these contributions, several limitations remain. Our evaluation focuses on fraud detection in social platforms and e-commerce, requiring further validation across diverse domains such as financial transactions or telecommunications fraud. The current experiments are conducted on medium-scale datasets, and extending the approach to large-scale real-world graphs will require additional optimization to reduce computational overhead. While the multi-view framework enhances robustness under varying heterophily levels, maintaining multiple graph views introduces extra computational costs that may limit real-time deployment in resource-constrained environments.

6.2. Future Work

Future work should explore adaptive view generation strategies that automatically adjust to graph characteristics, investigate theoretical foundations linking perturbation strategies to heterophily patterns, and develop efficient implementations for large-scale deployment. Enhancing model interpretability and robustness against adversarial attacks will further advance the practical applicability of multi-view graph anomaly detection.

Author Contributions

Conceptualization, Y.F. and C.C.; methodology, Z.W., H.Q. and Z.T.; formal analysis, Y.F.; data curation, Y.F.; writing—original draft preparation, Y.F. and Z.T.; writing—review and editing, Z.T.; supervision, C.C.; project administration, H.Q. and Z.W.; funding acquisition, H.Q. and Z.W. All authors have read and agreed to the published version of the manuscript.

Funding

The National Natural Science Foundation of China (62272285); the Basic Research Program of Shanxi Province (Free Exploration) (202403021221193).

Institutional Review Board Statement

Not applicable.

Informed Consent Statement

Not applicable.

Data Availability Statement

The data presented in this study are openly available in https://cseweb.ucsd.edu/~jmcauley/datasets.html, accessed on 20 January 2025.

Conflicts of Interest

The authors declare no conflicts of interest.

References

  1. Kipf, T.N.; Welling, M. Semi-supervised Classification with Graph Convolutional Networks. In Proceedings of the International Conference on Learning Representations, Toulon, France, 24–26 April 2017. [Google Scholar] [CrossRef]
  2. Veličković, P.; Cucurull, G.; Casanova, A.; Romero, A.; Liò, P.; Bengio, Y. Graph Attention Networks. In Proceedings of the International Conference on Learning Representations, Vancouver, BC, Canada, 30 April–3 May 2018. [Google Scholar] [CrossRef]
  3. Zhu, J.; Yan, Y.; Zhao, L.; Heimann, M.; Akoglu, L.; Koutra, D. Beyond Homophily in Graph Neural Networks: Current Limitations and Effective Designs. In Proceedings of the Neural Information Processing Systems, Vancouver, BC, Canada, 6–12 December 2020; pp. 7793–7804. [Google Scholar] [CrossRef]
  4. Zhu, J.; Rossi, R.A.; Rao, A.; Mai, T.; Lipka, N.; Ahmed, N.K.; Koutra, D. Graph Neural Networks with Heterophily. In Proceedings of the AAAI Conference on Artificial Intelligence, Menlo Park, CA, USA, 2–9 February 2021; pp. 8484–8488. [Google Scholar] [CrossRef]
  5. Dou, Y.; Liu, Z.; Sun, L.; Deng, Y.; Peng, H.; Yu, P.S. Enhancing Graph Neural Network-based Fraud Detectors against Camouflaged Fraudsters. In Proceedings of the ACM International Conference on Information and Knowledge Management, Virtual Event, Ireland, 19–23 October 2020; pp. 315–324. [Google Scholar] [CrossRef]
  6. Abed, R.A.; Hamza, E.K.; Humaidi, A.J. A Modified CNN-IDS Model for Enhancing the Efficacy of Intrusion Detection System. Meas. Sens. 2024, 35, 101299. [Google Scholar] [CrossRef]
  7. Gao, Y.; Wang, X.; He, X.; Liu, Z.; Feng, H.; Zhang, Y. Addressing Heterophily in Graph Anomaly Detection: A Perspective of Graph Spectrum. In Proceedings of the ACM Web Conference 2023, Austin, TX, USA, 30 April–4 May 2023; pp. 1528–1538. [Google Scholar] [CrossRef]
  8. Yao, K.; Liang, J.; Liang, J.; Li, M.; Cao, F. Multi-View Graph Convolutional Networks with Attention Mechanism. Artif. Intell. 2022, 307, 103708. [Google Scholar] [CrossRef]
  9. Cunegatto, E.H.T.; Zinani, F.S.F.; Rigo, S.J. Multi-objective optimisation of micromixer design using genetic algorithms and multi-criteria decision-making algorithms. Int. J. Hydromechatron. 2024, 7, 224–249. [Google Scholar] [CrossRef]
  10. Xu, C.; Tao, D.; Xu, C. A Survey on Multi-view Learning. arXiv 2013, arXiv:1304.5634. [Google Scholar] [CrossRef]
  11. Jiao, Y.; Xiong, Y.; Zhang, J.; Zhang, Y.; Zhang, T.; Zhu, Y. Sub-graph Contrast for Scalable Self-Supervised Graph Representation Learning. arXiv 2020, arXiv:2009.10273. [Google Scholar]
  12. Lau, S.L.; Lim, J.; Chong, E.K.; Wang, X. Single-pixel image reconstruction based on block compressive sensing and convolutional neural network. Int. J. Hydromechatron. 2023, 6, 258–273. [Google Scholar] [CrossRef]
  13. Cui, L.; Seo, H.; Tabar, M.; Ma, F.; Wang, S.; Dong, Y. DETERRENT: Knowledge Guided Graph Attention Network for Detecting Healthcare Misinformation. In Proceedings of the ACM SIGKDD Conference on Knowledge Discovery and Data Mining, Virtual Event, CA, USA, 6–10 July 2020; pp. 492–502. [Google Scholar] [CrossRef]
  14. Liu, C.; Sun, L.; Ao, X.; Yang, J.; Feng, H.; He, Q. Intention-aware Heterogeneous Graph Attention Networks for Fraud Transactions Detection. In Proceedings of the ACM SIGKDD Conference on Knowledge Discovery and Data Mining, Singapore, 14–18 August 2021; pp. 3280–3288. [Google Scholar] [CrossRef]
  15. Zhao, T.; Liu, Y.; Neves, L.; Woodford, O.; Jiang, M.; Shah, N. Data Augmentation for Graph Neural Networks. In Proceedings of the AAAI Conference on Artificial Intelligence, Menlo Park, CA, USA, 2–9 February 2021; pp. 11015–11023. [Google Scholar] [CrossRef]
  16. Huang, M.; Liu, Y.; Ao, X.; Li, K.; Chi, J.; Feng, J.; Yang, H.; He, Q. AUC-oriented Graph Neural Network for Fraud Detection. In Proceedings of the World Wide Web Conference, Lyon, France, 25–29 April 2022; pp. 1311–1321. [Google Scholar] [CrossRef]
  17. Chien, E.; Peng, J.; Li, P.; Milenkovic, O. Adaptive Universal Generalized PageRank Graph Neural Network. In Proceedings of the International Conference on Learning Representations, Virtual Event, 3–7 May 2021. [Google Scholar] [CrossRef]
  18. Li, M.; Qiao, Y.; Lee, B. Multi-View Intrusion Detection Framework Using Deep Learning and Knowledge Graphs. Information 2025, 16, 377. [Google Scholar] [CrossRef]
  19. Chen, L.; Wang, Y.; Tang, J. Detect Anomalies on Multi-View Attributed Networks. Inf. Sci. 2023, 638, 119008. [Google Scholar] [CrossRef]
  20. Duan, J.; Wang, S.; Zhang, P.; Zhu, E.; Hu, J.; Jin, H.; Liu, Y.; Dong, Z. Graph Anomaly Detection via Multi-Scale Contrastive Learning Networks with Augmented View. In Proceedings of the AAAI Conference on Artificial Intelligence (AAAI), Washington, DC, USA, 7–14 February 2023; AAAI Press: Menlo Park, CA, USA, 2023; pp. 7459–7467. [Google Scholar] [CrossRef]
  21. Zhao, T.; Ni, B.; Yu, W.; Cao, J.; Mao, Z.; Liu, C. Action Sequence Augmentation for Early Graph-based Anomaly Detection. In Proceedings of the 30th ACM International Conference on Information & Knowledge Management, Queensland, Australia, 1–5 November 2021; pp. 2668–2678. [Google Scholar] [CrossRef]
  22. Xu, K.; Li, C.; Tian, Y.; Sonobe, T.; Kawarabayashi, K.i.; Jegelka, S. Representation Learning on Graphs with Jumping Knowledge Networks. In Proceedings of the 35th International Conference on Machine Learning, New York, NY, USA, 10–15 July 2018; pp. 5449–5458. [Google Scholar] [CrossRef]
  23. Liu, Y.; Ao, X.; Qin, Z.; Chi, J.; Feng, J.; Yang, H.; He, Q. Pick and Choose: A GNN-based Imbalanced Learning Approach for Fraud Detection. In Proceedings of the 30th International World Wide Web Conference, Ljubljana, Slovenia, 19–23 April 2021; pp. 3168–3177. [Google Scholar] [CrossRef]
  24. Abu-El-Haija, S.; Perozzi, B.; Kapoor, A.; Alipourfard, N.; Lerman, K.; Harutyunyan, H.; Ver Steeg, G.; Galstyan, A. MixHop: Higher-Order Graph Convolutional Architectures via Sparsified Neighborhood Mixing. In Proceedings of the 36th International Conference on Machine Learning, New York, NY, USA, 9–15 June 2019; pp. 21–29. [Google Scholar] [CrossRef]
  25. Bo, D.; Wang, X.; Shi, C.; Shen, H. Beyond Low-frequency Information in Graph Convolutional Networks. In Proceedings of the AAAI Conference on Artificial Intelligence, Menlo Park, CA, USA, 2–9 February 2021; pp. 3950–3957. [Google Scholar] [CrossRef]
  26. Tang, J.; Li, J.; Gao, Z.; Li, J. Rethinking Graph Neural Networks for Anomaly Detection. In Proceedings of the 39th International Conference on Machine Learning, New York, NY, USA, 17–23 July 2022; pp. 21076–21089. [Google Scholar] [CrossRef]
  27. Xu, F.; Wang, N.; Wu, H.; Zhang, X.; Yu, K.; Yuan, Y.; Tang, X. Revisiting Graph-Based Fraud Detection in Sight of Heterophily and Spectrum. In Proceedings of the 38th AAAI Conference on Artificial Intelligence, Vancouver, BC, Canada, 20–27 February 2024; pp. 9214–9222. [Google Scholar] [CrossRef]
  28. Zhuo, W.; Liu, Z.; Hooi, B.; Wang, B.; He, G.; Cai, K.; Li, X. Partitioning Message Passing for Graph Fraud Detection. In Proceedings of the Twelfth International Conference on Learning Representations, Vienna, Austria, 7–11 May 2024. [Google Scholar] [CrossRef]
  29. Tang, J.; Hua, F.; Gao, Z.; Zhao, P.; Li, J. GADBench: Revisiting and Benchmarking Supervised Graph Anomaly Detection. In Proceedings of the 36th Conference on Neural Information Processing Systems (NeurIPS 2023)—Datasets and Benchmarks Track, Red Hook, NY, USA, 10–16 December 2023. [Google Scholar]
Figure 1. Comparison of single-view and multi-view PA score.
Information 16 00985 g001
Figure 2. Validation of prediction variance reduction by multi-view fusion. Box plots display prediction probability variance distributions. Dashed horizontal lines represent medians, and vertical error bars show bootstrap 95% confidence intervals.
Information 16 00985 g002
Figure 3. Multi-view graph heterogeneity resistant network. The proposed framework operates in multiple stages: the original view generates a cosine-similarity view, and both are perturbed to produce augmented graphs. Each view and its perturbed version are processed by a GNN to obtain prediction logits. Post-aggregation (PA) scores are then computed from both views to mitigate initial prediction errors when pruning high-heterophily edges. The resulting purified graphs are re-evaluated by the GNN, and their outputs are fused through a voting mechanism to produce the final anomaly scores. The final prediction acts as a teacher model that guides both student views through a cross-view self-distillation process. Heatmap intensity represents score magnitude (darker colors indicate higher values).
Information 16 00985 g003
Figure 4. Sensitivity analysis of MV-GHRN to pruning ratio.
Information 16 00985 g004
Figure 5. Impact of temperature parameter on model performance.
Information 16 00985 g005
Figure 6. The impact of perturbed view on model performance.
Information 16 00985 g006
Figure 7. Node heterophily changes with different pruning ratios.
Information 16 00985 g007
Table 1. Statistics of datasets.
DatasetNodesEdgesHeterophily of the GraphFeature
Amazon11,9444,398,3926.8725
YelpChi45,9543,846,97914.5332
Table 2. Performance comparison on YelpChi and Amazon datasets.
MethodYelpChiAmazon
F1-MacroAUCF1-MacroAUC
GCN0.51570.54130.50980.5083
JKNet0.58050.77360.82700.8970
CARE-GNN0.50150.73000.63130.8832
PC-GNN0.69250.81180.83670.9555
H2GCN0.65750.84060.92130.9693
MixHop0.65340.87960.80930.9723
GPRGNN0.64230.83550.80590.9358
BWGNN0.75680.89670.92040.9706
GHRN0.77890.90730.92820.9728
SEC-GFD0.77730.91930.92350.9823
PMP0.81790.93970.92200.9757
MV-GHRN (Ours)0.95510.98820.92850.9793
Bold values indicate the best performance in each metric.
Table 3. Model ablation study results.
ModelOriginal ViewPerturbed ViewCosine Similarity
View
PruningAmazon
F1-MacroAUC
Base Model 0.91830.9439
Perturbation Enhancement 0.92670.9428
Similarity Fusion 0.93010.9245
Complete Model0.92850.9793
Base Model 0.91940.9395
Perturbation Enhancement 0.92440.9371
Similarity Fusion 0.91640.9691
Complete Model 0.92460.9656
✓ indicates the component is included in the model variant. Bold values indicate the best performance in each section.
Table 4. Performance comparison on Weibo and Reddit datasets.
MethodWeiboReddit
F1-MacroAUCF1-MacroAUC
GCN90.3696.5249.1560.40
BWGNN91.0897.0252.9265.15
GHRN90.1496.7154.6966.13
MV-GHRN91.6697.4054.8870.72
Bold values indicate the best performance in each metric.
Disclaimer/Publisher’s Note: The statements, opinions and data contained in all publications are solely those of the individual author(s) and contributor(s) and not of MDPI and/or the editor(s). MDPI and/or the editor(s) disclaim responsibility for any injury to people or property resulting from any ideas, methods, instructions or products referred to in the content.