4.2. Matrix Components of REGOMAX Algorithm
We have computed the different reduced Google matrix components (as described in
Section 3.3) for the eight Wikipedia editions and using for each edition the edition-specific group of 40 articles given in
Table 2 and
Table 3 (as explained in
Section 2.2). The presentation order of the nodes in the groups is given by the index
, which was obtained by separately PageRank ordering the 23 nodes for society concepts and the 17 nodes for religions (or branches of religions) for the EN-Wikipedia edition. However, for the other editions there are different
K and
indices but for practical reasons we keep the same initial node order
(obtained from EN-Wikipedia) when presenting the different matrix components in the figures below.
Recall that
is, according to (
4), given by the sum
where
represents the direct links,
indirect links with
being a rank-1 matrix (with columns being rather close to the projected PageRank
) taking into account the contributions of the leading eigenvector in the complementary scattering space (see [
22] for details) and
is obtained from the other contributions and contains interesting nontrivial information about indirect links. Numerically,
is quite dominant in this sum with relative weights
–
depending on the edition but it has a very simple structure. The interesting properties of the reduced Google matrix are contained in the matrix
being the sum of
and
(with diagonal elements of the latter replaced by 0). For two editions (EN and ZH), we present results for the four matrices
,
,
and
while for the other six editions we limit ourselves to
and
.
Below we will focus our discussion on the most interesting case . To simplify this discussion, we also introduce for this matrix the sub-blocks A (left top diagonal society block), B (right top block with links from religion to society), C (left bottom block with links from society to religion) and D (bottom right diagonal religion block). In particular, we determine the strongest matrix element for each block, the sum of matrix elements per block and the ratios , , for these sums. In the next Subsection, we will see that the matrix can also be exploited to generate effective networks of friends and followers.
In
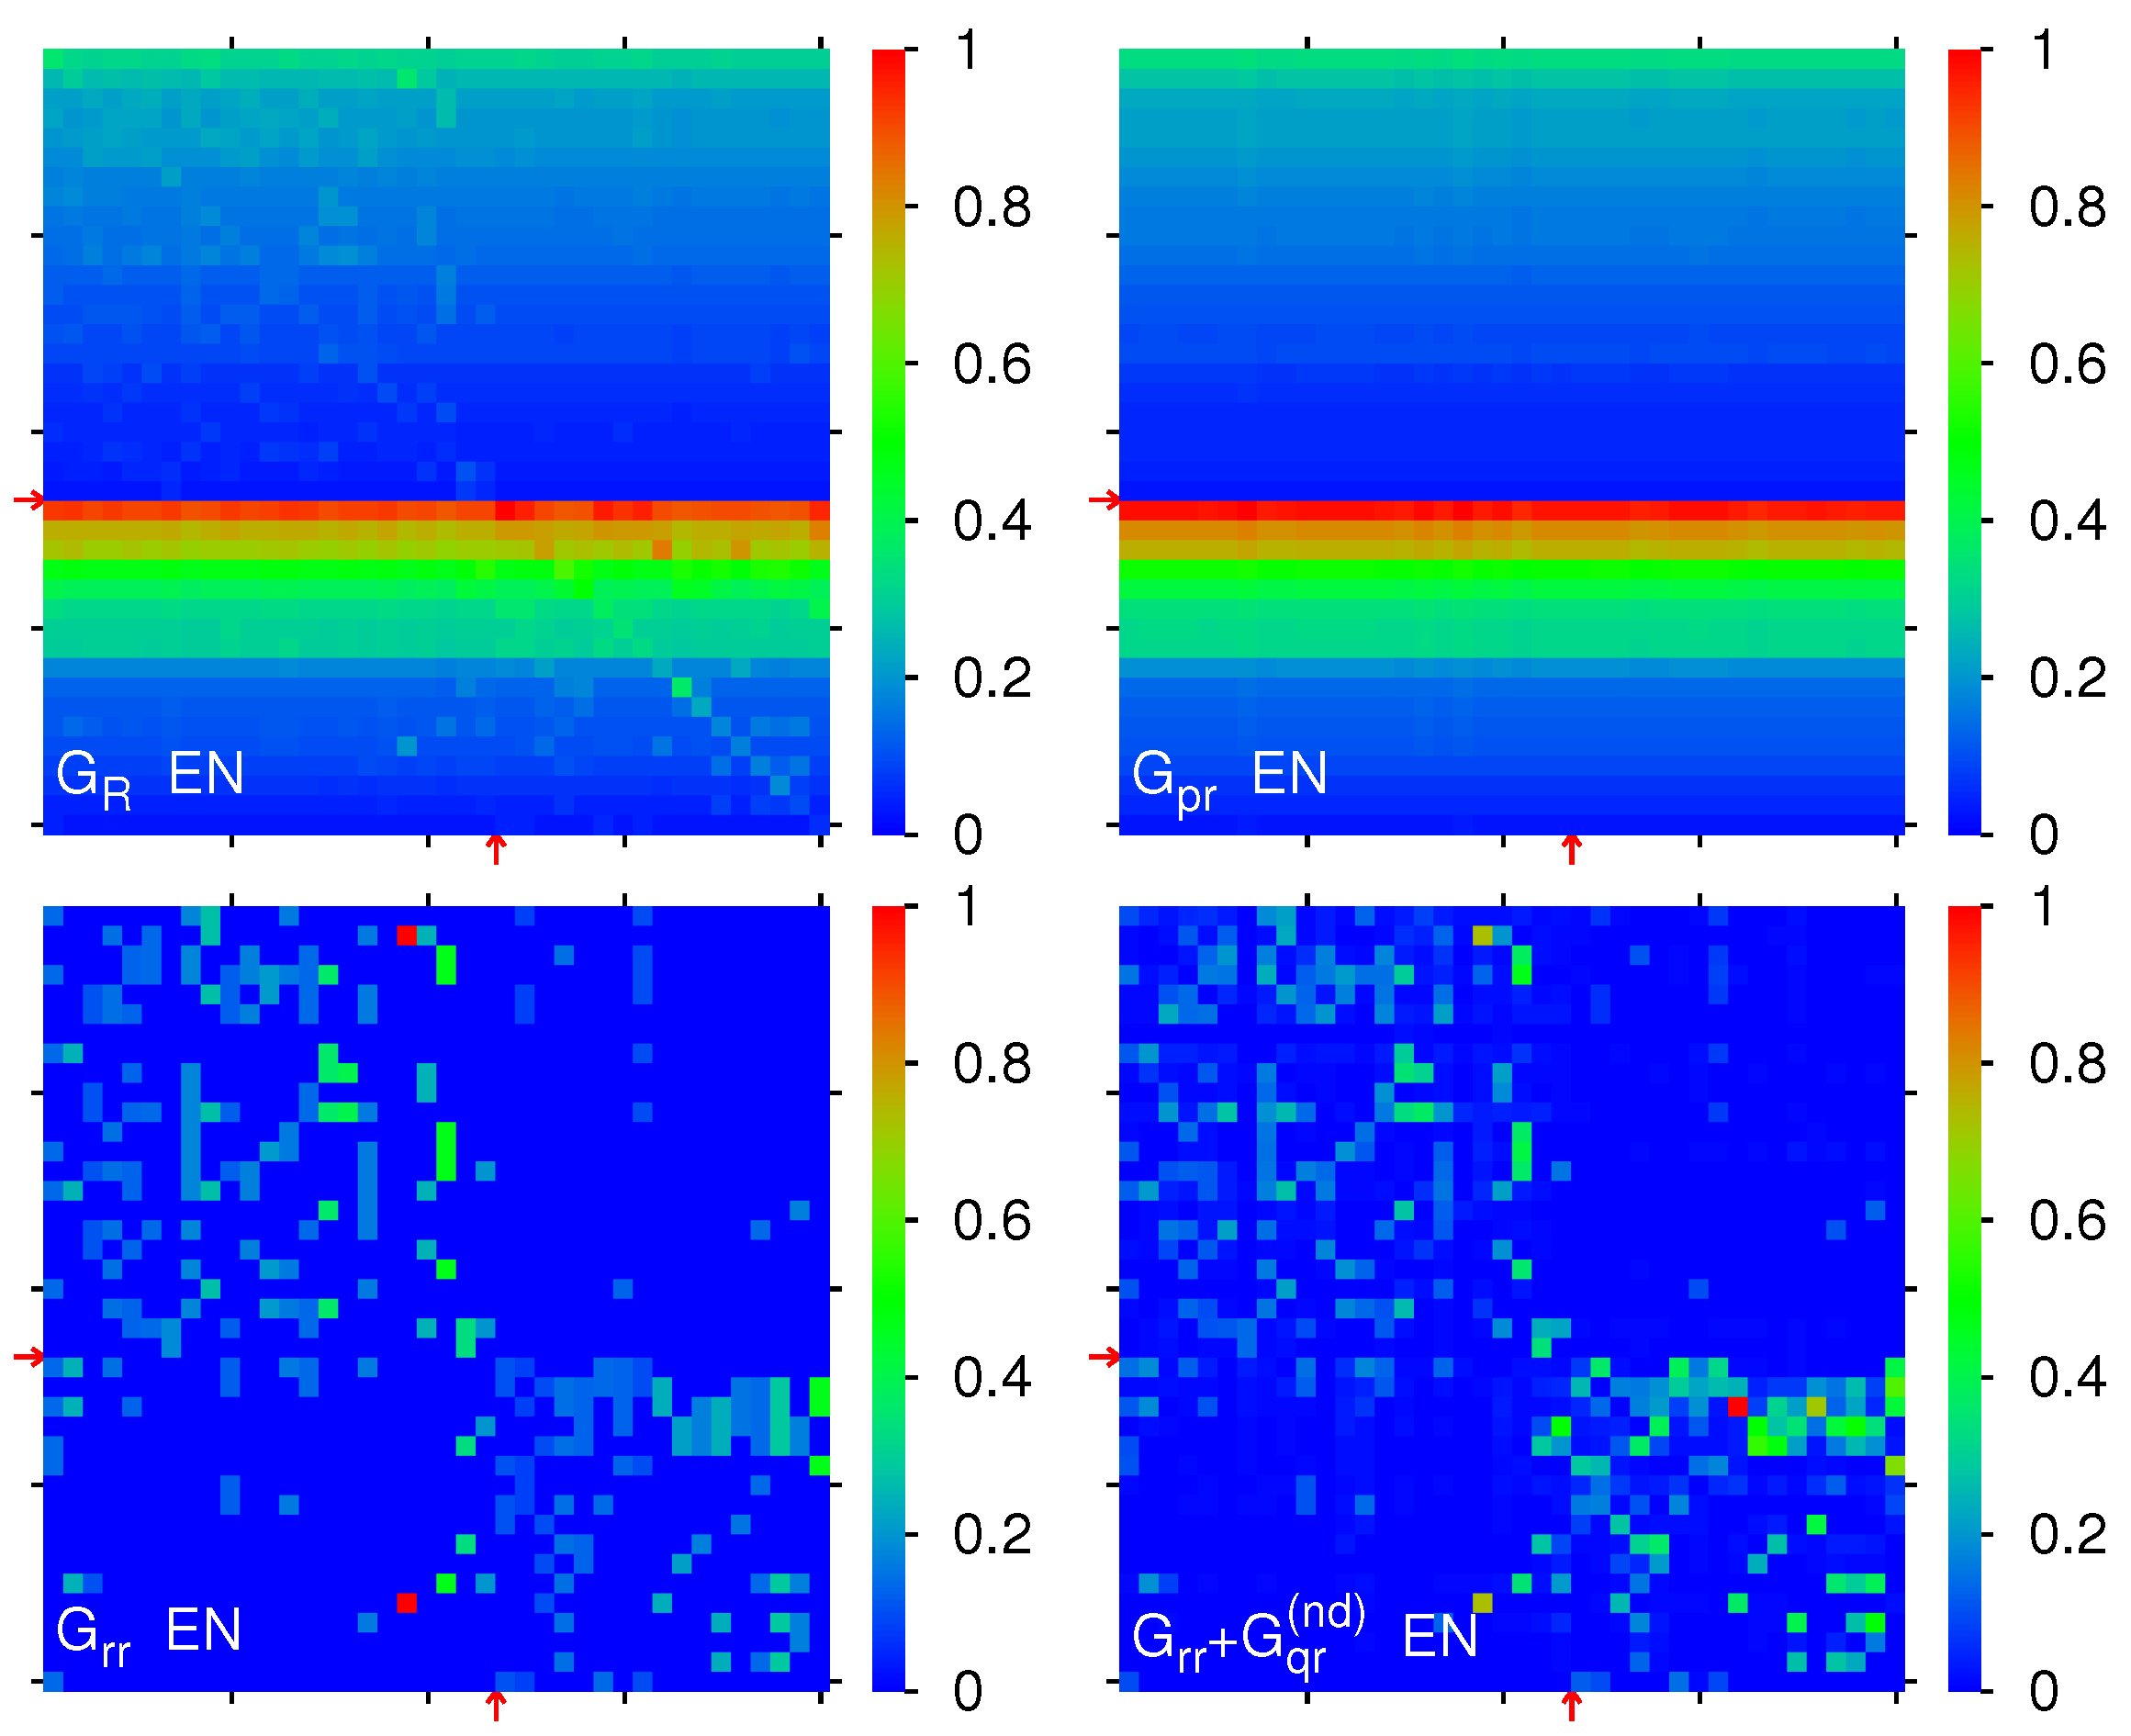
Figure 3, we show color density plots for
,
,
and
for the edition EN with numerical weights being
,
,
and
(
). The color plot of
is essentially composed of rows of equal color with matrix elements
for all columns
j. Here, the sequence of row colors illustrates the separate PageRange order in the two blocks. The row with red color corresponds to the top PageRank node Catholic Church with
,
and the first row in the religion block, and the rows below at
with orange or (strong) green color correspond to
. The color plot of
is similar in appearance, due to the strong weight of
, but with additional peaks at isolated positions with largest elements of
or
(including some quite strong diagonal elements of
, especially in the religion block).
For , the strongest matrix elements for each block A, B, C and D (for links ) correspond to 0.0126 (Education ← Oligarchy, A); 0.0021 (Economy ← Chinese folk religion, B); 0.0125 (Shia Islam ← Oligarchy, C) and 0.0172 (Islam ← Sunni Islam, D). The last value appears as a sum of a direct link and also a stronger indirect link from Sunni Islam to Islam while the two links from Oligarchy to Education or Shia Islam result from direct links also clearly visible in .
We also observe that the two diagonal blocks
A and
D seem rather decoupled with significantly smaller links in the off-diagonal blocks
B and
C, which is also confirmed by the sum ratios
,
and
. The value of
is higher due to the ratio of areas
, showing that the transitions inside the religion block
D are more intense comparing to the society concepts block
A; this difference is also related to the particularly strong maximal element in the
D block (see above). The decoupling between the two blocks, which is also confirmed for the other seven Wikipedia editions discussed below, seems to be surprising in view of the important historical role played by religions in society formation. However, on the other side there is a well-known statement from the Bible, “
Render unto Caesar the things that are Caesar’s, and unto God the things that are God’s” (Bible Matthew 22:21 [
35]) that may be partially at the origin of this result. Also, in certain countries, e.g., France, the separation between the state and religions is fixed by law.
Figure 4 shows the matrices
and
for the two editions
and
. For AR we have the weights
and
with higher weights of
and
as compared to EN. For AR, the strongest matrix elements of
per block correspond to 0.1067 (Monarchy ← Autocracy,
A); 0.0063 (Law ← Catholic Church,
B); 0.0132 (Islam ← Law,
C) and 0.0524 (Taoism ← Confucianism,
D). The first element of this list is related to the fact that several Islamic countries are monarchies. The sum ratios are
,
and
. Here, in the panel of
one sees a strong red row at
for the top PageRank node Islam.
In a similar way, we obtain for DE and and here the strongest matrix elements of per block correspond to 0.0327 (Democracy ← Oligarchy, A); 0.0137 (Communism ← Chinese folk religion, B); 0.0058 (Islam ← Republic, C) and 0.0209 (Hinduism ← Jainism, D). The sum ratios are , and . As for EN, there is a red row for at for Catholic Church.
For the ES edition (top panels of
Figure 5), we find
,
and
and the strongest matrix elements of
per block correspond to 0.0222 (Oligarchy ← Autocracy,
A); 0.0117 (Society ← Confucianism,
B); 0.0082 (Buddhism ← Materialism,
C) and 0.0346 (Islam ← Sunni Islam,
D). Here, we have in the
D block a second very strong matrix element with value 0.0296 (Islam ← Shia Islam). The sum ratios are given by
,
and
. As for EN and DE, there is a red row for
at
for Catholic Church.
For FR (bottom panels of
Figure 5), we have
,
and
and the strongest matrix elements of
per block correspond to: 0.0222 (Culture ← Society,
A); 0.0101 (Politics ← Confucianism,
B); 0.0178 (Christianity ← Autocracy,
C) and 0.0198 (Buddhism ← Chinese folk religion,
D). There are additional strong matrix elements 0.0191 (Capitalism ← Economy,
A), 0.0179 (Education ← Economy,
A), 0.0176 (Communism ← Economy,
A), 0.0189 (Taoism ← Chinese folk religion,
B) and 0.0170 (Monarchy ← Autocracy,
A). We attribute the last link and the top
C link from Autocracy to Christianity to the
baptême de Clovis when the king of France Clovis I accepted the Christian religion around the year 500. The sum ratios are
,
and
. There is a red row for
at
,
for Christianity along with strong orange rows at
,
(Islam) and
,
(Catholic Church).
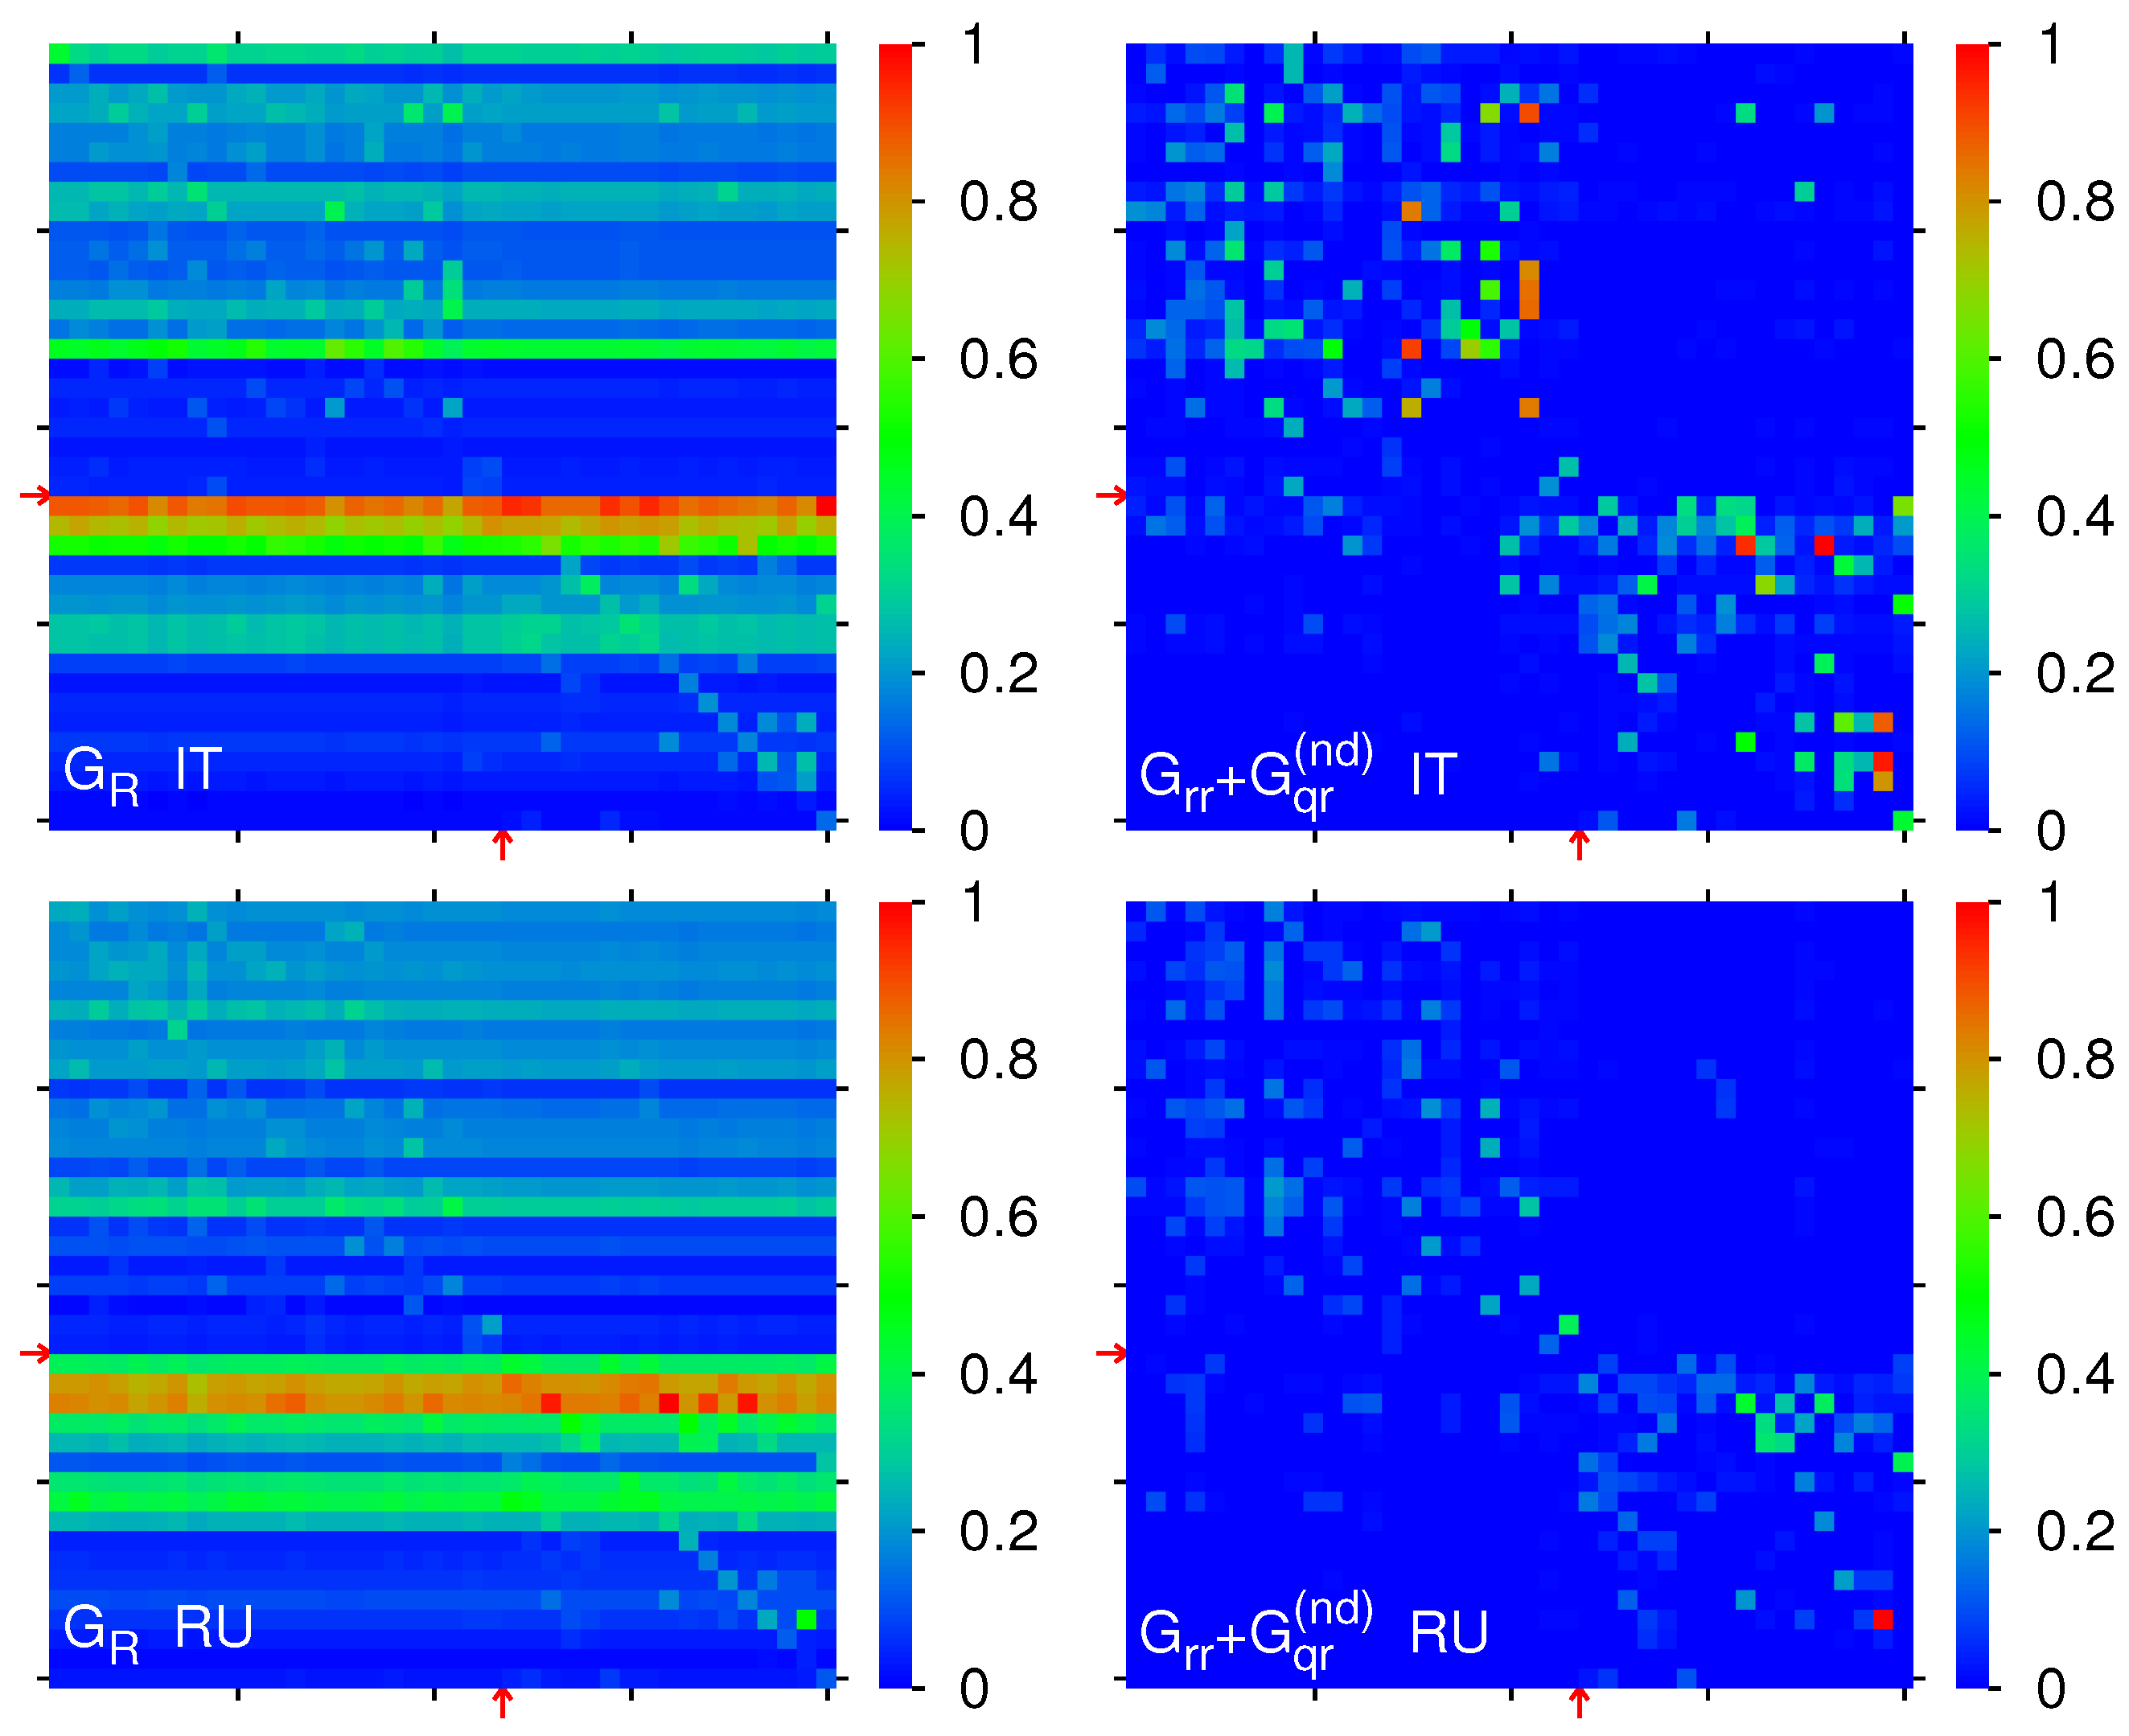
For the IT edition (top panels of
Figure 6), the matrix weights are
,
and
and the strongest matrix elements of
per block correspond to 0.0298 (Economy ← Society,
A); 0.0108 (Democracy ← Sunni Islam,
B); 0.0095 (Christianity ← Idealism,
C) and 0.0326 (Islam ← Shia Islam,
D). Furthermore, there are significant numbers of additional strong matrix elements in the
D-block: 0.0313 (Taoism ← Chinese folk religion); 0.0307 (Islam ← Sunni Islam); 0.0285 (Confucianism ← Chinese folk religion) and 0.0260 (Shinto ← Chinese folk religion). Also, there are more in the
A-block: 0.0292 (Democracy ← Autocracy); 0.0280 (Fascism ← Autocracy); 0.0278 (Monarchy ← Autocracy); 0.0273 (Oligarchy ← Autocracy); 0.0272 (Culture ← Society) and 0.0266 (Republic ← Autocracy). The latter are probably related to Italian history. The sum ratios are given by
,
and
and there are two strong rows for
being red (
,
, Catholic Church) and orange (
,
, Christianity).
For RU (bottom panels of
Figure 6), we have
,
and
and the strongest matrix elements of
per block correspond to 0.0223 (Materialism ← Idealism,
A); 0.0043 (Capitalism ← Protestantism,
B); 0.0066 (Buddhism ← Civilization,
C) and 0.0569 (Taoism ← Chinese folk religion,
D). Here, we have the sum ratios
,
and
and in the
panel we see two orange-red rows at
,
(Islam) and, with slightly smaller values, at
,
(Christianity).
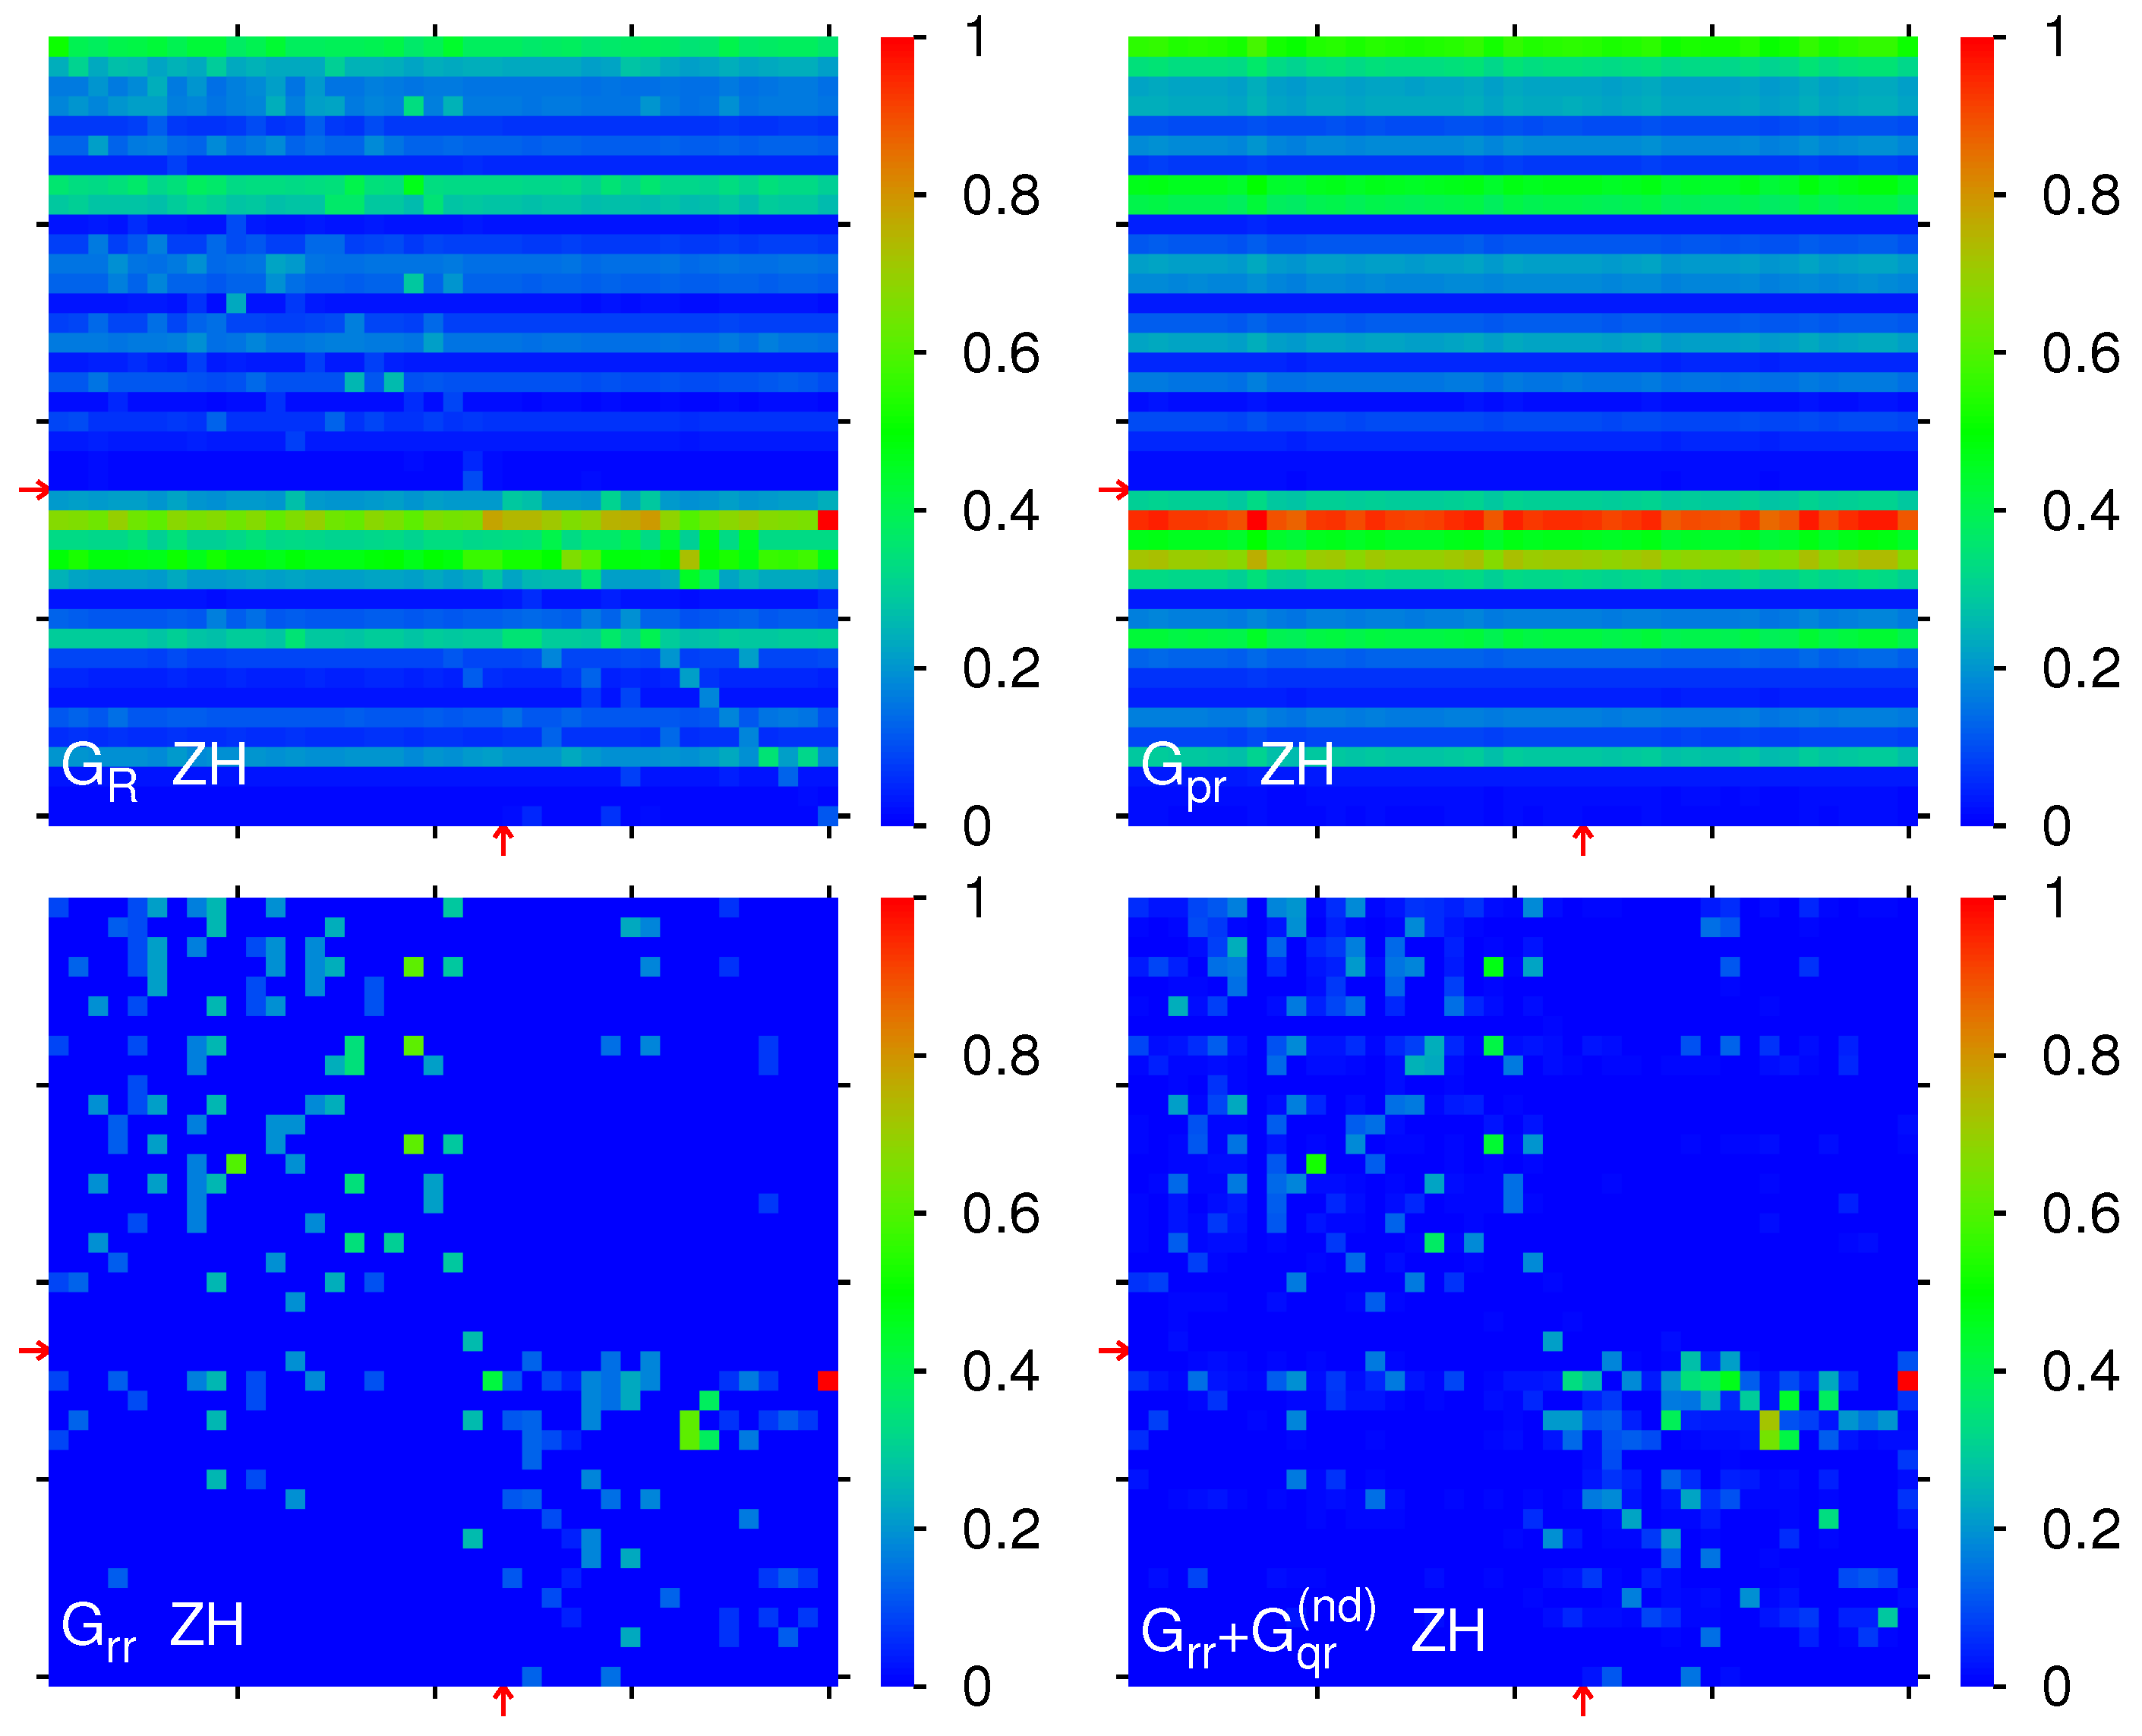
Finally, in
Figure 7 we show the matrices for
,
,
and
of the ZH edition. Here, the weights are
and
(
). For ZH, the strongest matrix elements of
per block correspond to 0.0341 (Fascism ← Nazism,
A); 0.0097 (Education ← Judaism,
B); 0.0219 (Christianity ← Idealism,
C) and 0.0653 (Christianity ← Oriental Orthodox Churches,
D) and the block-sum ratios are
,
and
. In the panel of
, we see a strong red row at
,
(Christianity), which appears less pronounced (between orange and strong green) in the other panel of
. This is mainly because the very strong maximal direct matrix element in the
D-block of
(and of
corresponding to the link Christianity ← Oriental Orthodox Churches) shifts the maximum value in the color plot, defining the red color, which reduces the color scale of other matrix elements. We note that the structure of the matrix
follows for ZH mainly
for the strongest transitions.
The results of this Subsection show that for the matrices of all eight editions there are indeed multiple significant transitions inside both blocks of society concepts and of religions. However, the transitions between these two blocks are, roughly by a factor 5–10, smaller if we compare the sums of matrix elements of the off-diagonal block to the sums over the diagonal blocks. The ratio of transition strengths of the two diagonal blocks is typically somewhat larger than the ratio of block areas . This shows that transitions between religions are on average a bit stronger than those between society concepts.
4.3. Network Structure Inside Social Concepts and Religions
In this section, we present effective network diagrams for friends and followers based on the information contained in the matrix
, or more precisely in its two diagonal blocks
A for society concepts and
D for religions. Since, according to the results of the last Subsection, these two blocks are rather well decoupled with only weak links between them, we will present separate network diagrams for each block. Network diagrams of (nearly) the same style were, for example, used in [
22] (for groups of political leaders in the Wikipedia network), [
25] (for banks and countries in the Wikipedia network) and [
27] (for a specific fibrosis-related protein group in the MetaCore network of proteins).
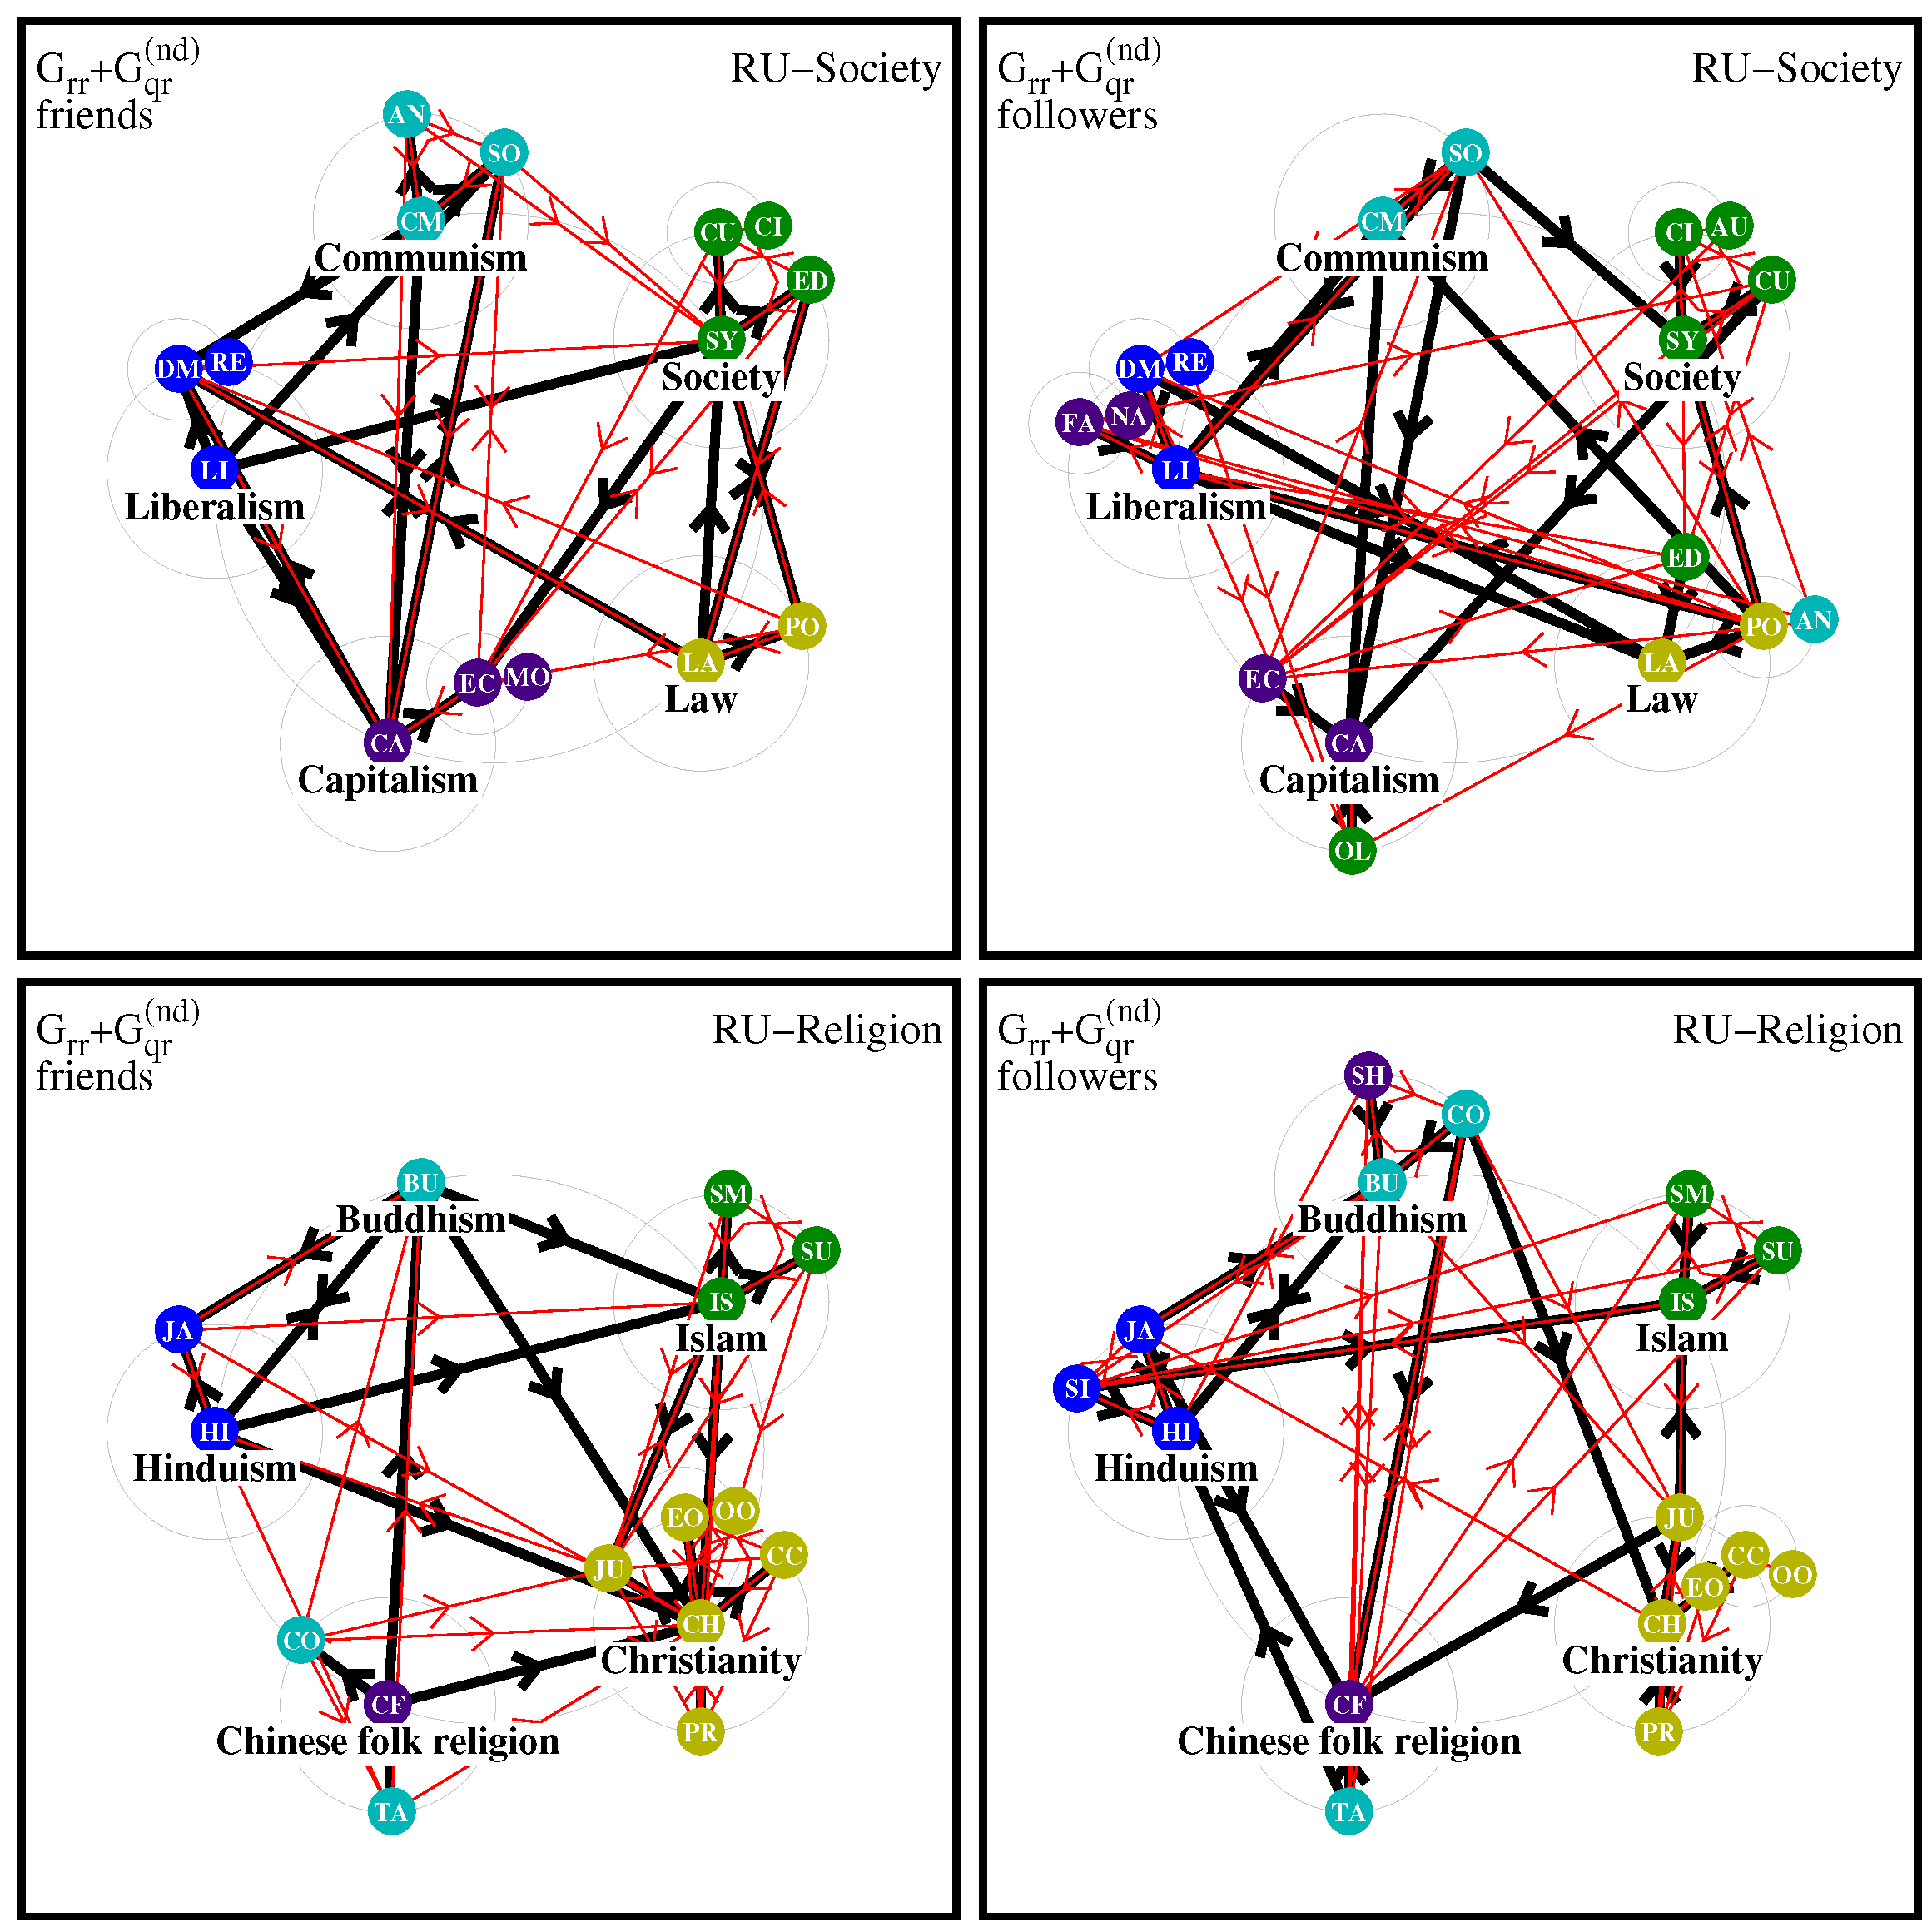
However, for convenience, we present here the construction method of these network diagrams. Assume we have a small matrix g with elements being either a reduced Google matrix or one of its components (e.g., , , or ) or a certain sub-block of such a matrix (e.g., society or religion sub-blocks A or D of shown in the previous section). First, we choose in the list of nodes (associated to this matrix or block) five top nodes representing five different subgroups based on some categorization criteria (depending on the set of nodes and the context) and we attribute each other node of this list to exactly one of the five subgroups (based on some criteria and the context). In the following, we will use for these subgroups the notation poles as a synonym for “center of interest”, which is a typical use of this expression in the French language. For each pole, we also define some presentation color.
To construct the effective friend network (see below for the other case of follower networks), we first draw a main circle (thin gray line) and place the five top nodes uniformly on this circle with some label and the corresponding color. Then, we select for each top node j (also called level-1 nodes) the four strongest friends i (level-2 nodes) with strongest outgoing links , i.e., with largest matrix elements in the same column j of this matrix. Each of these strongest friends, if not yet present in the diagram as another level-1 node, is placed on a smaller secondary circle around the top level-1 node associated to it and we draw thick black arrows from the level-1 nodes to their friends. It is possible that a new level-2 node appears as a friend of several initial level-1 nodes. In this case, we try first to place this level-2 node on the circle of the level-1 node with same color (same pole) if possible, i.e., if this level-2 node is indeed a friend of the level-1 node of the same color. Only if this is not possible, we place it on the circle of another level-1 node (first level-1 node of different color that has the given level-2 node as friend). If a level-1 node has a friend that is already present in the diagram as another level-1 node, we simply draw a thick black arrow from the former to the latter and do not modify the position of the latter.
The procedure is repeated for all (newly added) level-2 nodes with smaller circles around them on which we place their (up to) four strongest friends (level-3 nodes if newly added) and with the same rule for preferential placement on a circle of a parent node of same color. Now, we draw thin red arrows from the level-2 nodes to their friends. In the case if such a friend is already present in the network (as level-1 or level-2 node), its position is not modified and we only draw the thin red arrow from his parent node to it. We also mention that only non-empty circles with at least one node on them are drawn; i.e., if a given node has no newly added friends (i.e., all its friends are already in the diagram), then we will not draw an empty circle around it.
At this stage, we typically stop the procedure for simplicity. Even if we continue this procedure with level-4, level-5 nodes, etc., the number of newly added nodes quickly decreases and when there are no newly added nodes the procedure converges to a stable final diagram. This can happen actually quite early so that there is typically no big difference in diagrams limited to level-3 nodes and those with higher-level nodes. In particular, for the diagrams given below, the number of newly added level-3 nodes is typically already quite small (much smaller than the theoretical limit ) also because the available set of nodes is limited from the very beginning, even significantly smaller than the theoretical level-3 limit. In some of the diagrams below, there are even no newly added level-3 nodes (if absence of smallest level-3 circles) and we have convergence to a stable diagram at level-2, i.e., all friends of level-2 nodes are already present in the diagram as former level-1 or level-2 nodes. In case of convergence, the last stage does not add new nodes but it still adds arrows from the most recently added nodes in the previous stage to their friends (which are already present in the network diagram).
The construction of follower network diagrams is essentially the same with two modifications: (i) At each level k, we select for each level-k node i (typically only in our case) the four strongest followers j (as possible level- node if not yet present in the diagram) with strongest incoming links defined by the largest matrix elements in the same row i. (ii) Arrows (thick black or thin red) are drawn with inverted directions from followers (level- nodes) to parents (level-k nodes), e.g., there are some arrows from a circle node to its center node while in the friend diagrams we have arrows from the circle center to the outside nodes on the circle (note in case of multiple parent nodes or pre-existing friends or followers, we have typically a significant number of other types of arrows between different circles).
In this work, we present figures for the network diagrams constructed from the two diagonal blocks
A for society-related nodes and
D for religions of the matrix
for the eight different Wikipedia editions. Since there are two friend and follower diagrams for each case, we have four network diagrams per edition presented in a figure with four panels. The subgroups or poles together with their respective five top nodes for both society and religion cases are given in
Table 2 (eighth column) and this table also contains a two-letter code for each node (fifth column) used as a node label in the diagrams.
For society concepts, we choose the five top pole nodes Law, Society, Communism, Liberalism and Capitalism with respective node colors being olive, (dark) green, cyan, blue and indigo. We have tried to attribute the members of the poles based on the context and logical proximity to the top node, e.g., Education and Culture are attributed to the second pole of Society; Ecology and Politics belong to the first pole of Law and Socialism and Anarchism are attributed to the third pole for Communism. In certain cases, this attribution is a bit arbitrary and other choices would have been possible. We also tried to assure that each pole has a certain minimum number of members.
For the religion nodes, we choose the five top pole religions Christianity, Islam, Buddhism, Hinduism and Chinese folk religion (same colors as for the society top nodes in this order) and with its pole members being related to branches of religions or sub-religions. Here, we have attributed Judaism to the first Christianity pole with other members being Catholic Church, Protestantism and both nodes about the Orthodox Church.
In the following, we will more precisely call these poles also “initial poles” in order to distinguish them from “natural poles”, which may emerge naturally by certain clusters in a network diagram. Quite often, natural poles and initial poles are very similar but in certain cases natural poles are composed of nodes from several initial poles.
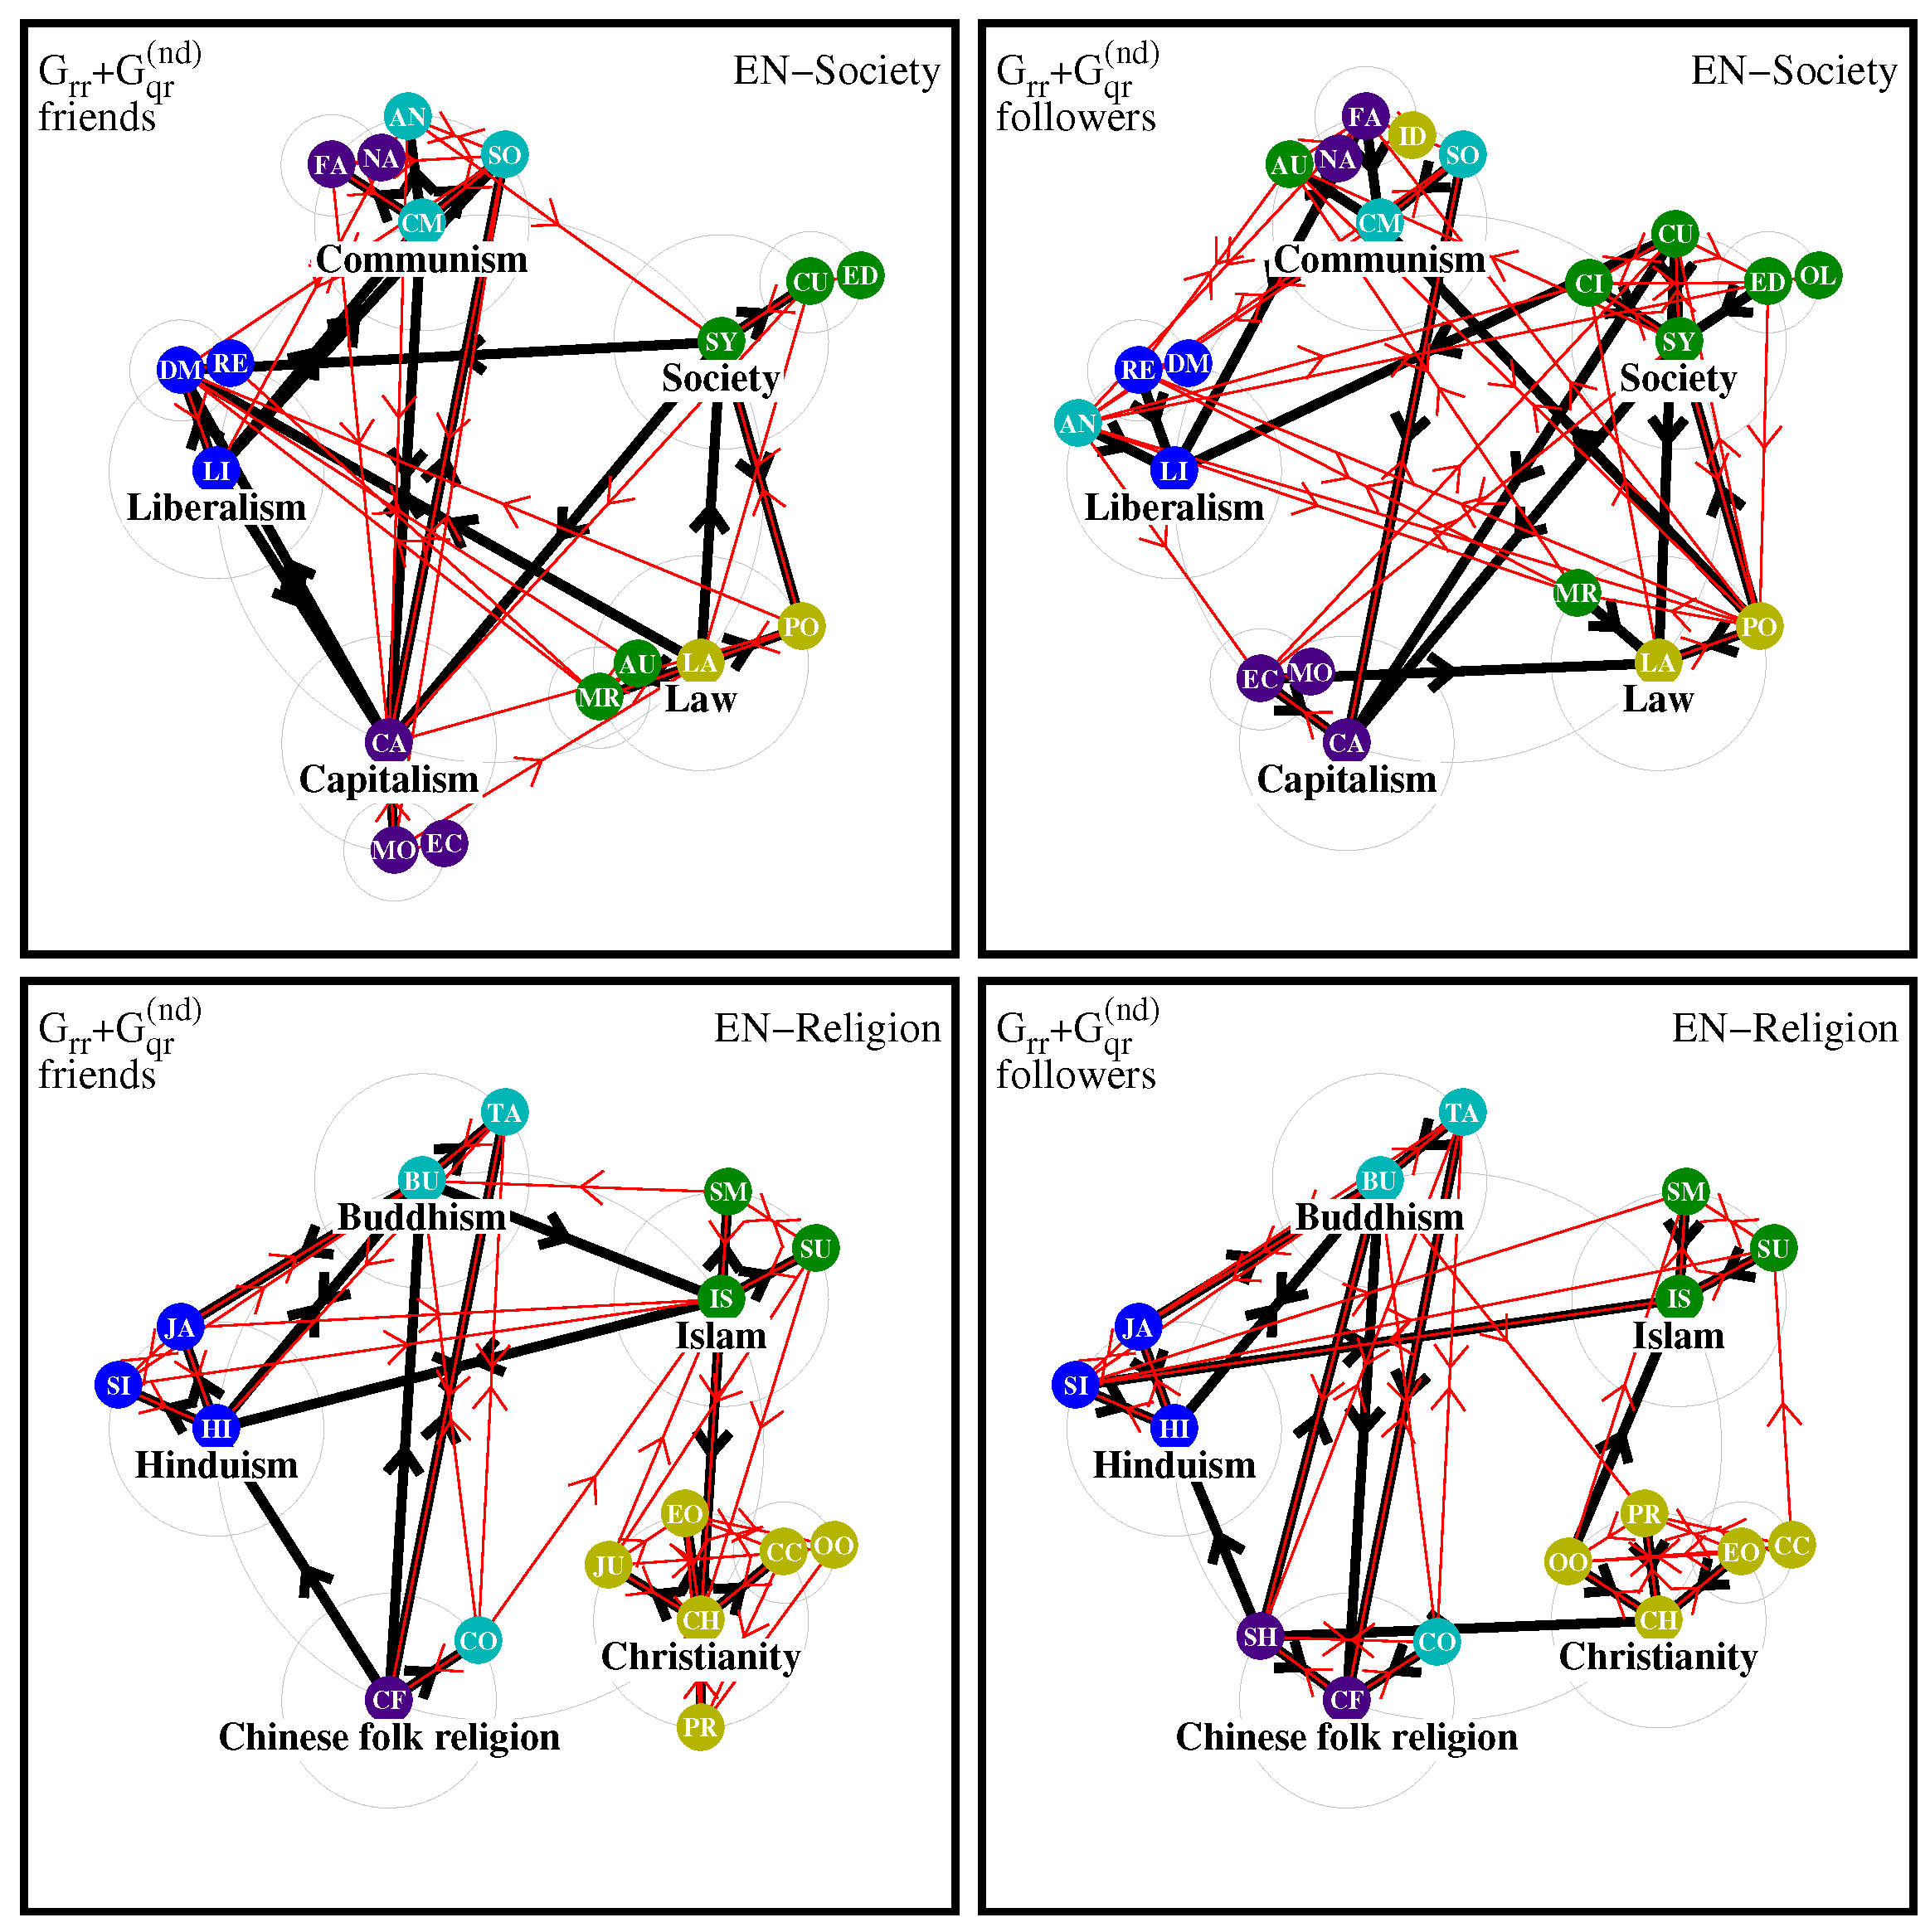
Specifically, for the EN edition, whose network diagrams are shown in
Figure 8, we can identify in the friend society diagram the formation of five natural poles (which may slightly deviate from the initial poles) with main members being (1T) Law, Politics, Monarchy and Autocracy (two initial poles); (2T) Society, Culture and Education (one initial pole); (3T) Communism, Socialism, Anarchism, Nazism and Fascism (two initial poles); (4T) Liberalism, Democracy and Republic (one initial pole) and (5T) Capitalism, Money and Economy (one initial pole). Thus, the natural pole Communism has the largest number of diagram members even if it is composed of nodes belonging to two different initial poles.
The diagram of followers has the natural poles (1T) Law, Politics and Monarchy (two initial poles); (2T) Society, Culture, Education, Civilization and Oligarchy (one initial pole); (3T) Communism, Socialism, Fascism, Nazism, Autocracy and Idealism (five initial poles); (4T) Liberalism, Democracy, Republic and Anarchism (two initial poles) and (5T) Capitalism, Money and Economy (one initial pole). Thus, again the strongest natural pole is formed around Communism.
For the diagram of religion friends we have from
Figure 8 the natural pole members (1T) Christianity, Catholic Church, Eastern Orthodox Church, Judaism, Protestantism and Oriental Orthodox Churches (one initial pole); (2T) Islam, Sunni Islam and Shia Islam (one initial pole); (3T) Buddhism and Taoism (one initial pole); (4T) Hinduism, Jainism and Sikhism (one initial pole) and (5T) Chinese folk religion and Confucianism (two initial poles). The strongest pole is Christianity; however, it is somehow isolated having strong links only from Islam while the poles of Islam, Buddhism, Hinduism and Chinese folk religion have more active interconnections.
For the diagram of religion followers, we find (1T) Christianity, Eastern Orthodox Church, Protestantism, Oriental Orthodox Churches and Catholic Church (one initial pole); (2T) Islam, Sunni Islam and Shia Islam (one initial pole); (3T) Buddhism and Taoism (one initial pole); (4T) Hinduism, Jainism and Sikhism (one initial pole) and (5T) Chinese folk religion, Confucianism and Shinto (two initial poles). Here, the strongest pole is again Christianity, and now it is less isolated with connections to Islam and Chinese folk religion. At the same time, we see here more intense links between religions from Asia (3T, 4T, 5T) forming a strongly interconnected religion group.
The diagram of friends for society concepts of AR, whose network diagrams are shown
Figure 9, has a reduced number of nodes as compared to EN in
Figure 8, but the poles are more interconnected by strong links. Interestingly, the Communism pole does not include Fascism and Nazism in contrast to the EN edition. For the diagram of society followers, the natural pole with largest number of nodes is Law with seven members and four initial poles. The Communism pole includes only Socialism and Anarchism in contrast to EN where the (natural) pole of Capitalism also includes Fascism and Nazism.
For the AR diagram of friends for religions in
Figure 9, we see that the Christianity pole contains a larger number of members as in the EN case but there are more links between poles and the Christianity pole is not as isolated as it is for EN. However, for the diagram of followers, the Christianity pole remains more isolated compared to the EN-edition, and also there are no strong black links between Christianity and Islam.
For the DE edition, the diagrams are presented in
Figure 10. For the diagram of friends for society concepts, the strongest natural pole is Liberalism with Democracy, Fascism, Nazism, Monarchy and Oligarchy (three initial poles), while for EN Fascism and Nazism are included in the Communism pole; also for DE the poles are more densely interconnected as compared to EN. For the diagram of followers, we again see a significant difference with EN, thus Fascism and Nazism are included in Liberalism pole while they are in the Communism pole for EN.
For the DE religion diagrams, we have denser interconnections between the five poles as compared to EN. In the case of followers, there are no strong links between Islam and Christianity but there are many (level-2) red links between their respective pole members.
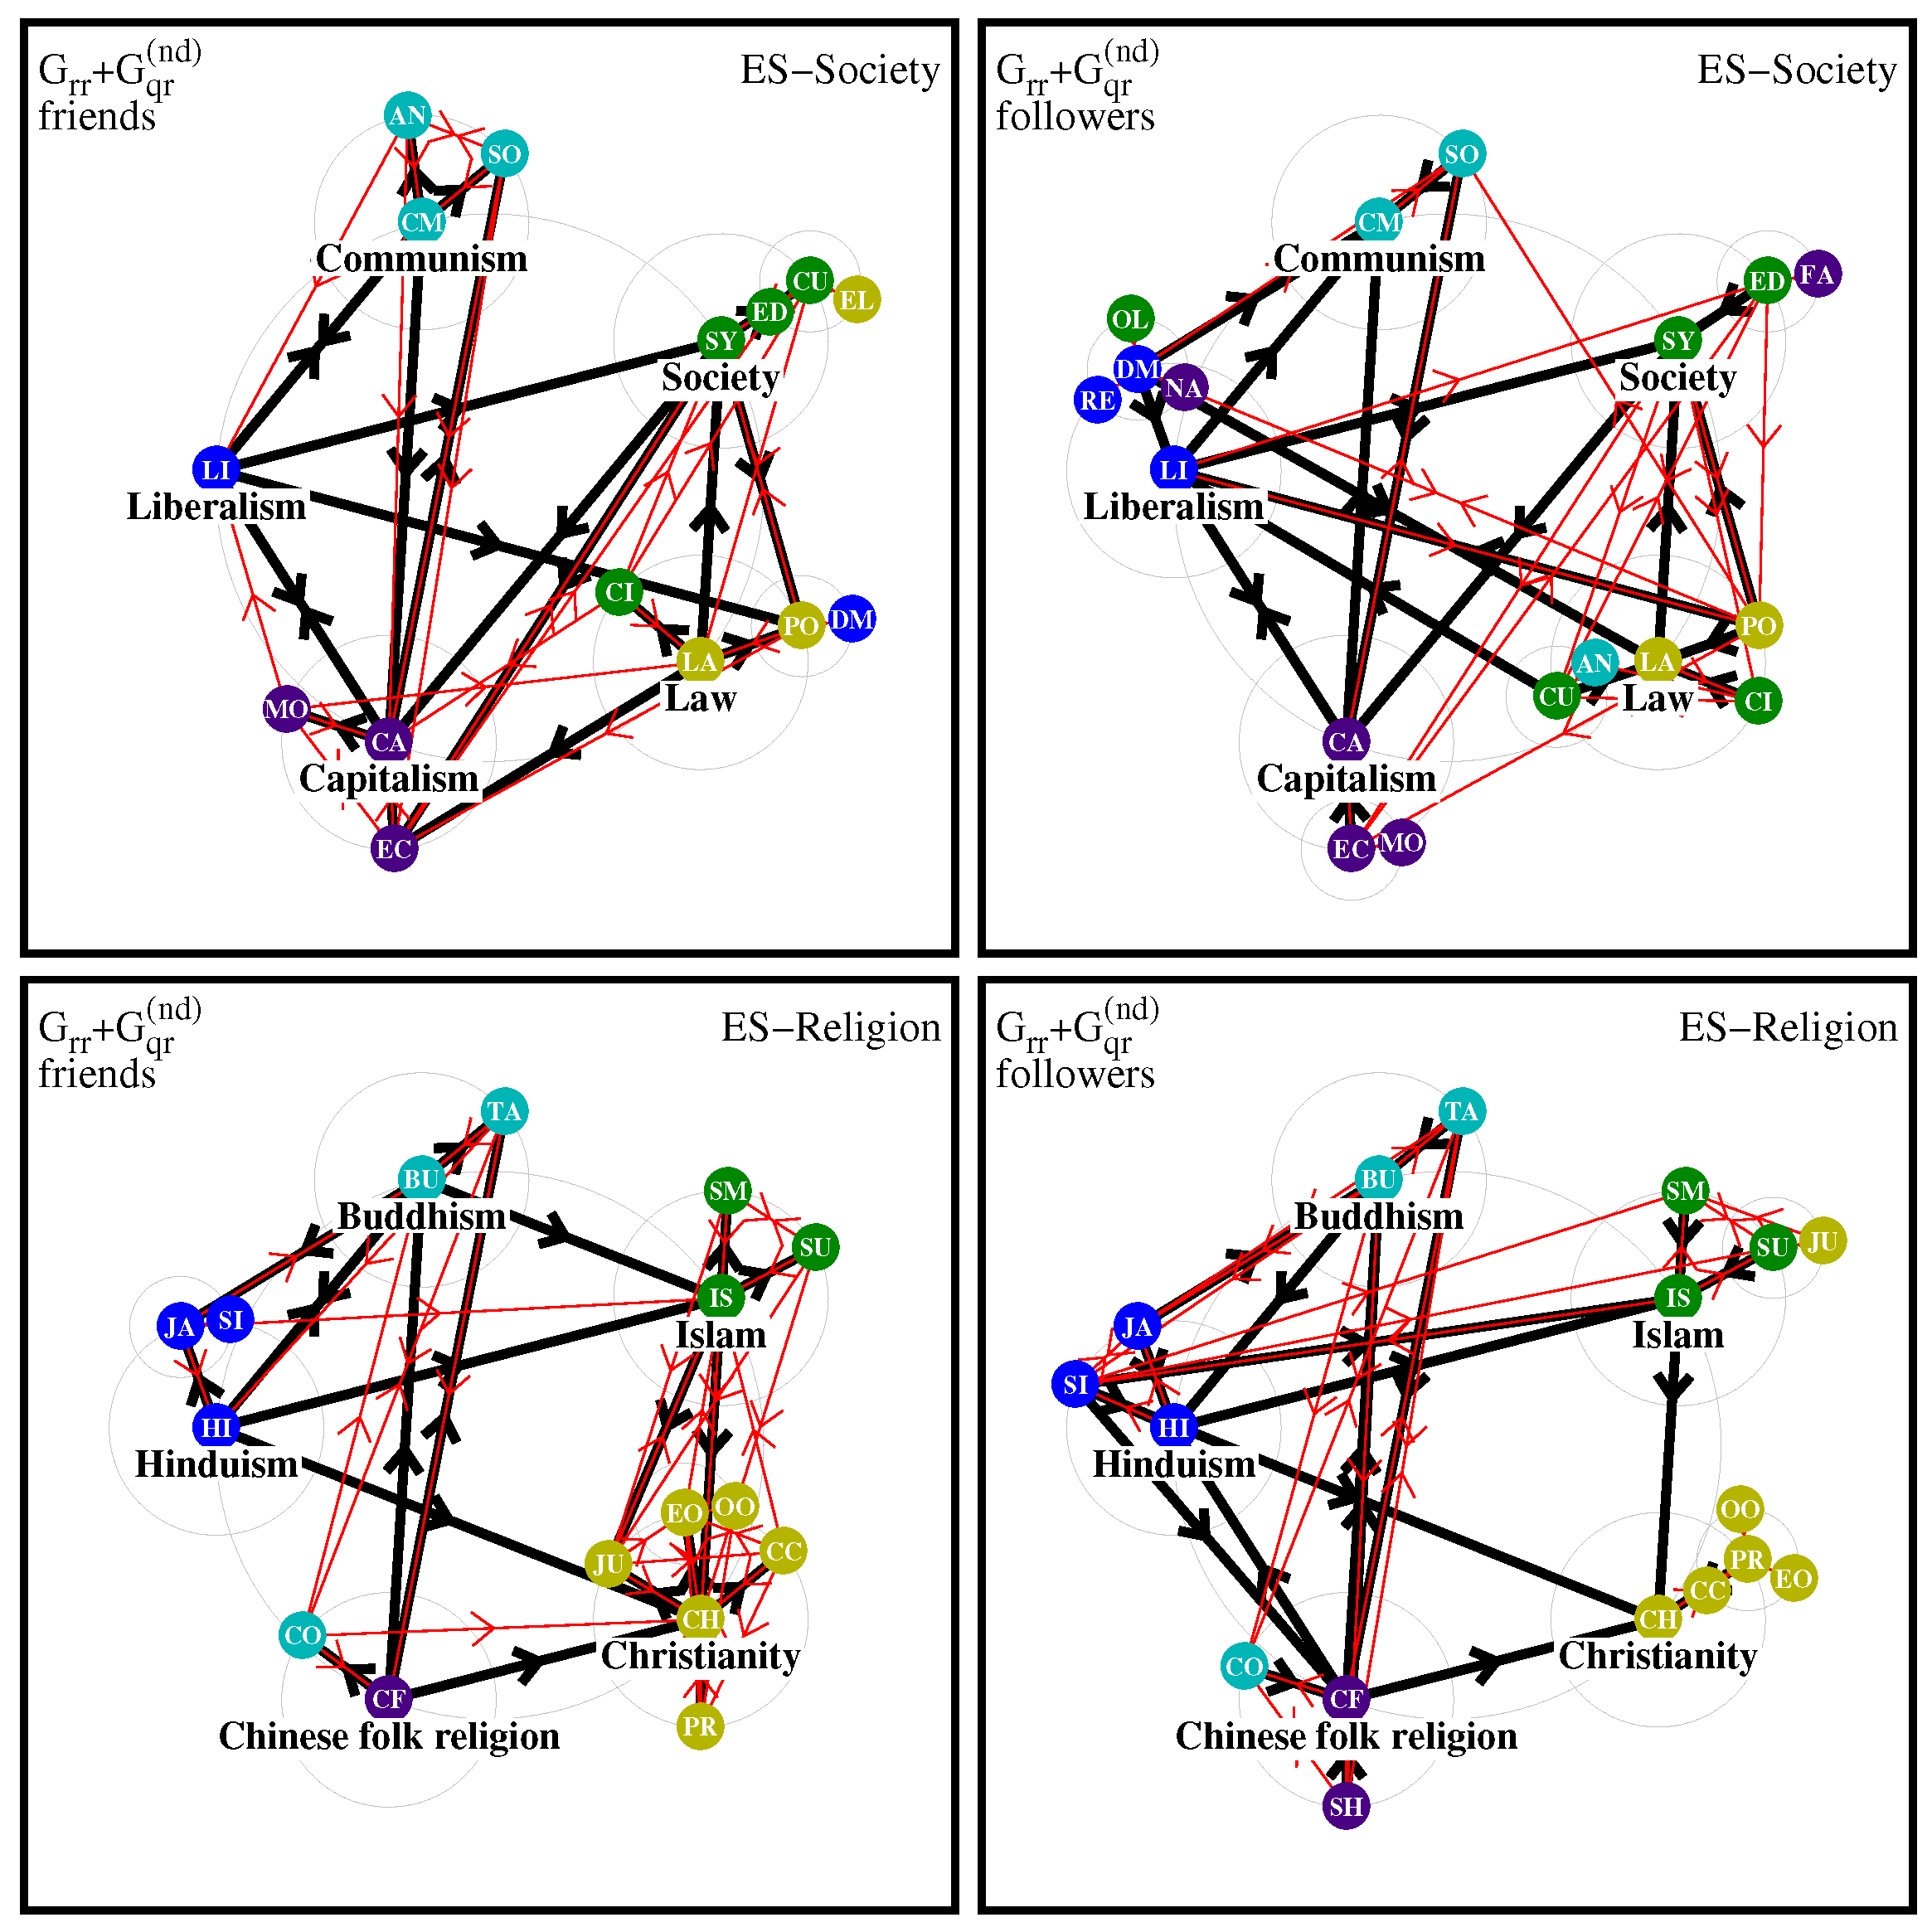
For the ES edition, the network diagrams are given in
Figure 11. Its society friend diagram is similar to EN but there are fewer nodes in the Liberalism pole (i.e., the direct friends of Liberalism are the other four level-1 top nodes), also Fascism and Nazism are absent. For the case of followers, there are fewer pole members for Society and Communism but more for Law and Liberalism; Nazism is attributed to the Liberalism pole, which is different from the EN case where Nazism is absent.
For the religion diagrams of ES in
Figure 11, the case of friends is similar to those of the EN edition but there are fewer links between the Islam and Christianity poles.
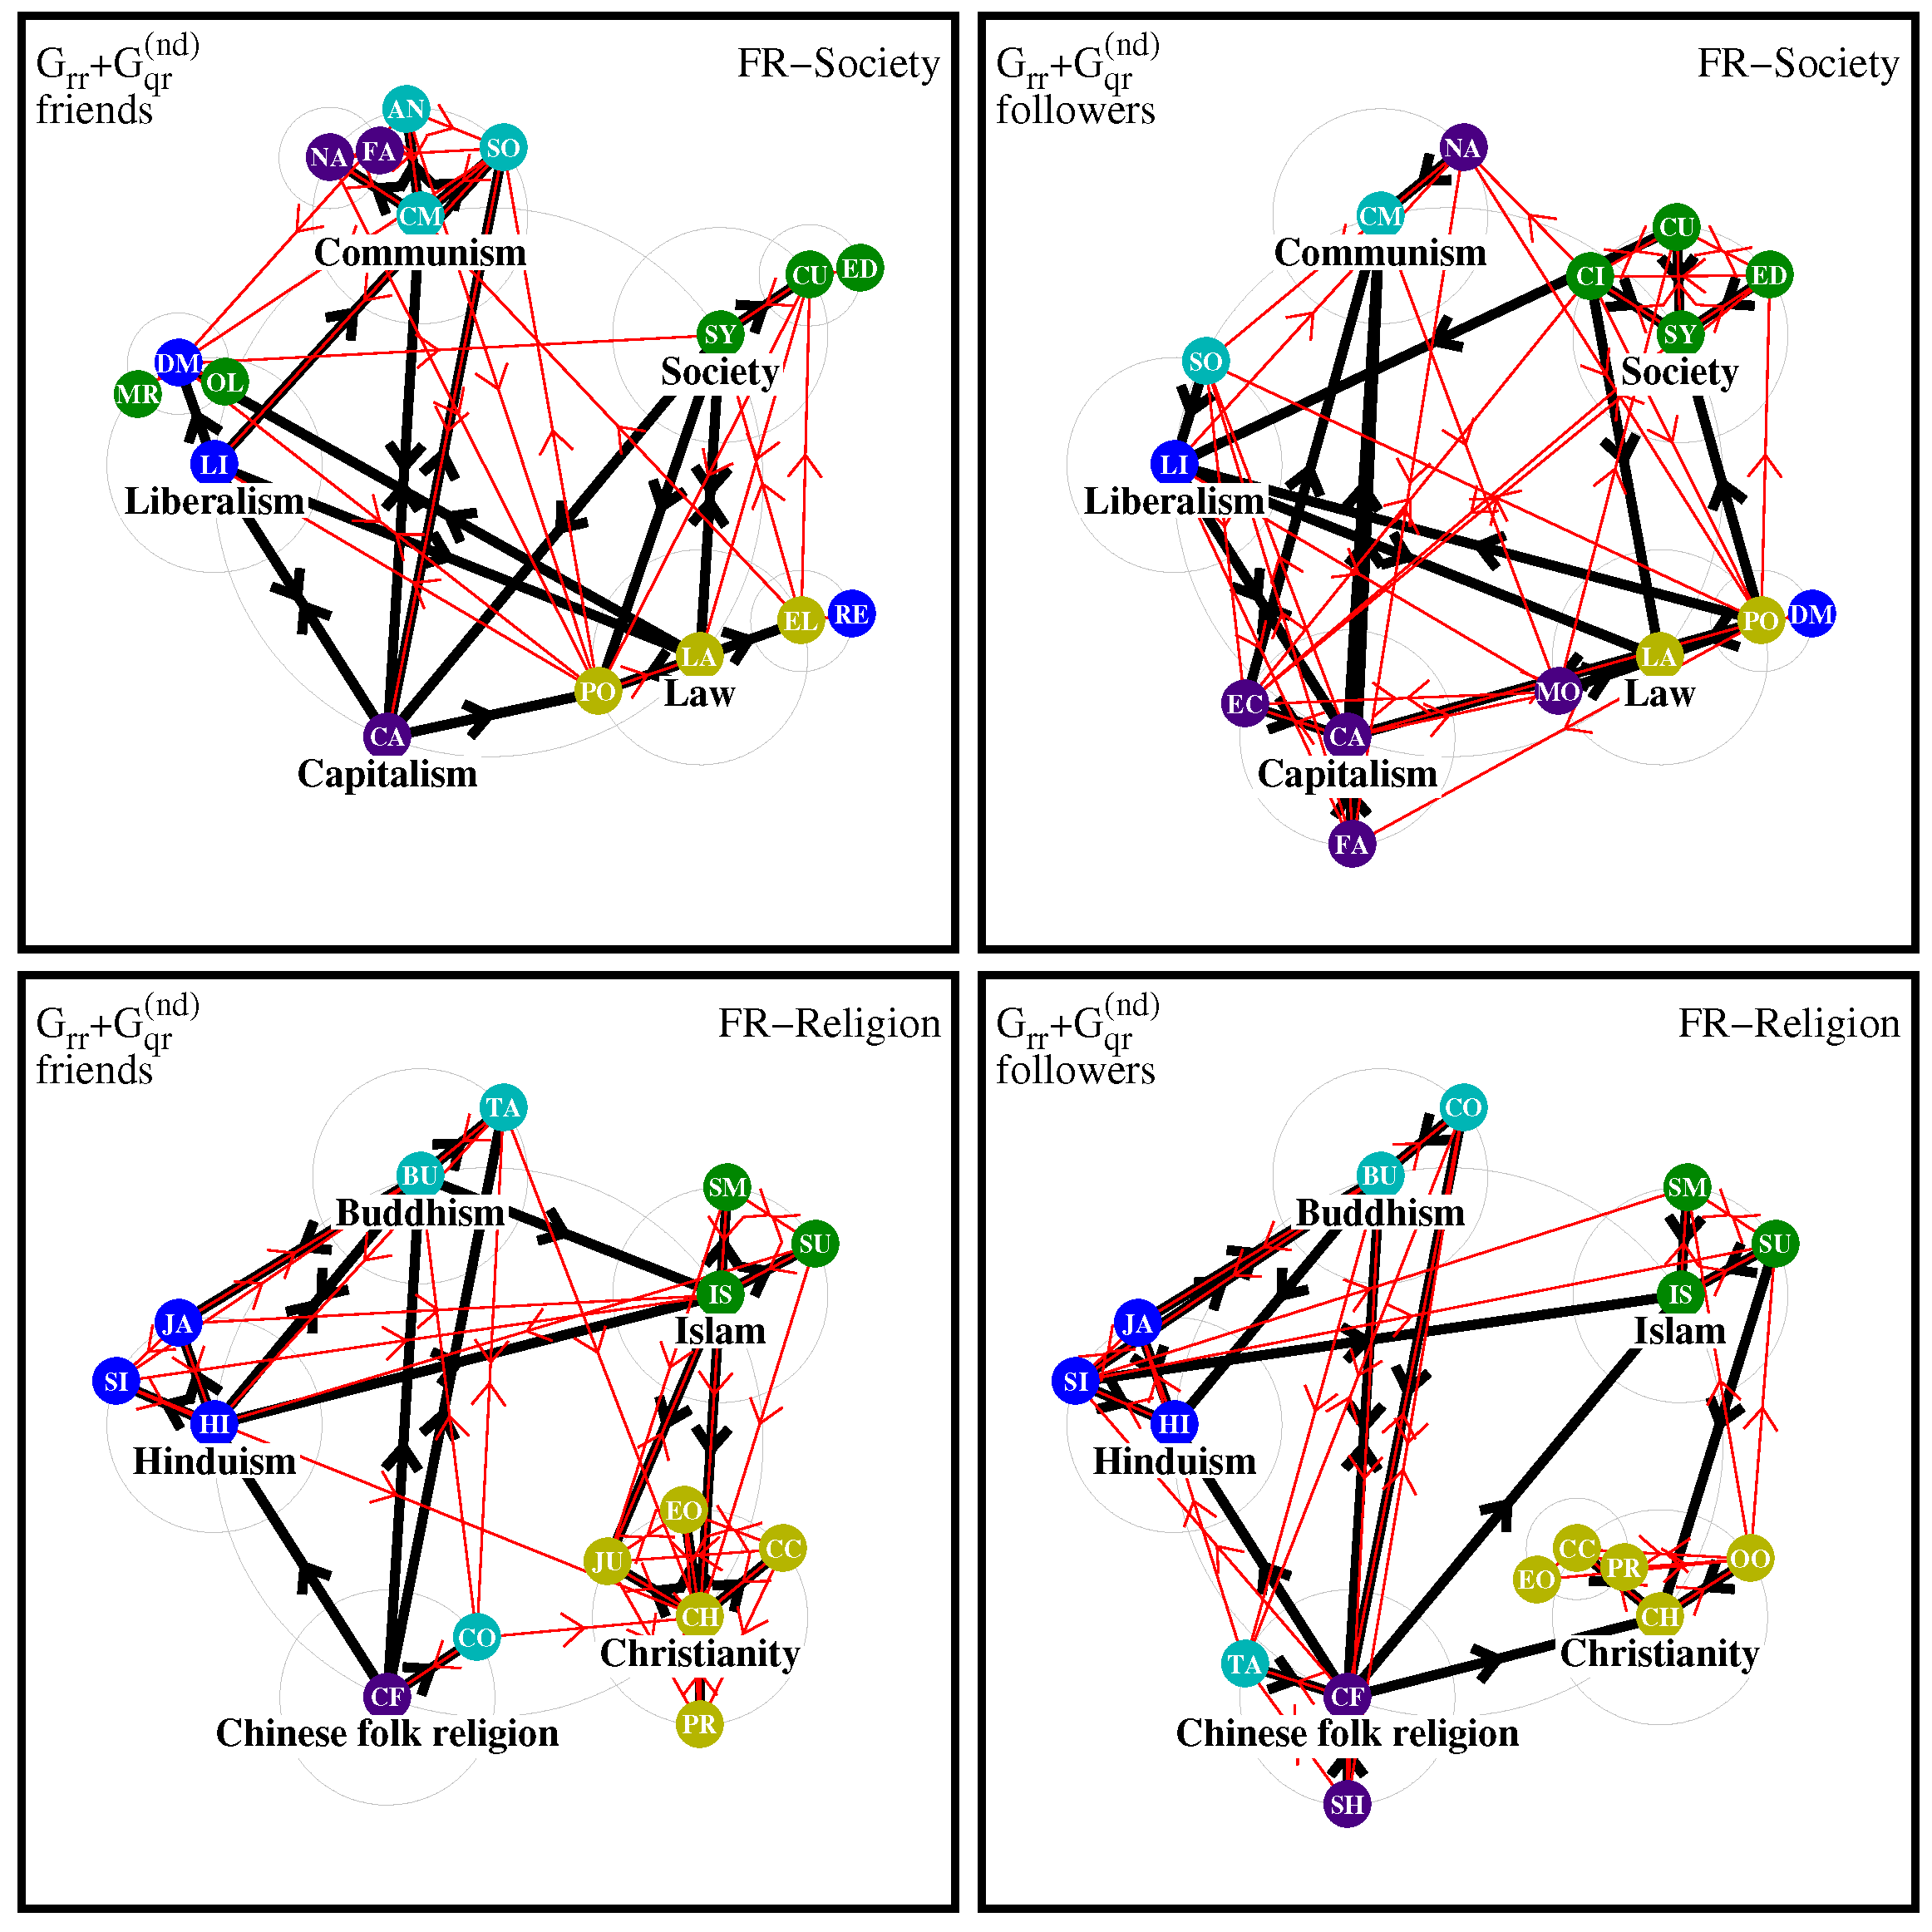
For the FR edition, the network diagrams are shown in
Figure 12. Here, the society friend diagram is similar to the case of EN but with fewer links between the Society and Liberalism poles; as for EN, the nodes Nazism and Fascism belong to the Communism natural pole. For the case of followers, the Communism pole has only one node of Nazism (from another initial pole), while for EN this pole contains six members including Fascism and Nazism. The religion diagrams of FR are quite similar with those of EN.
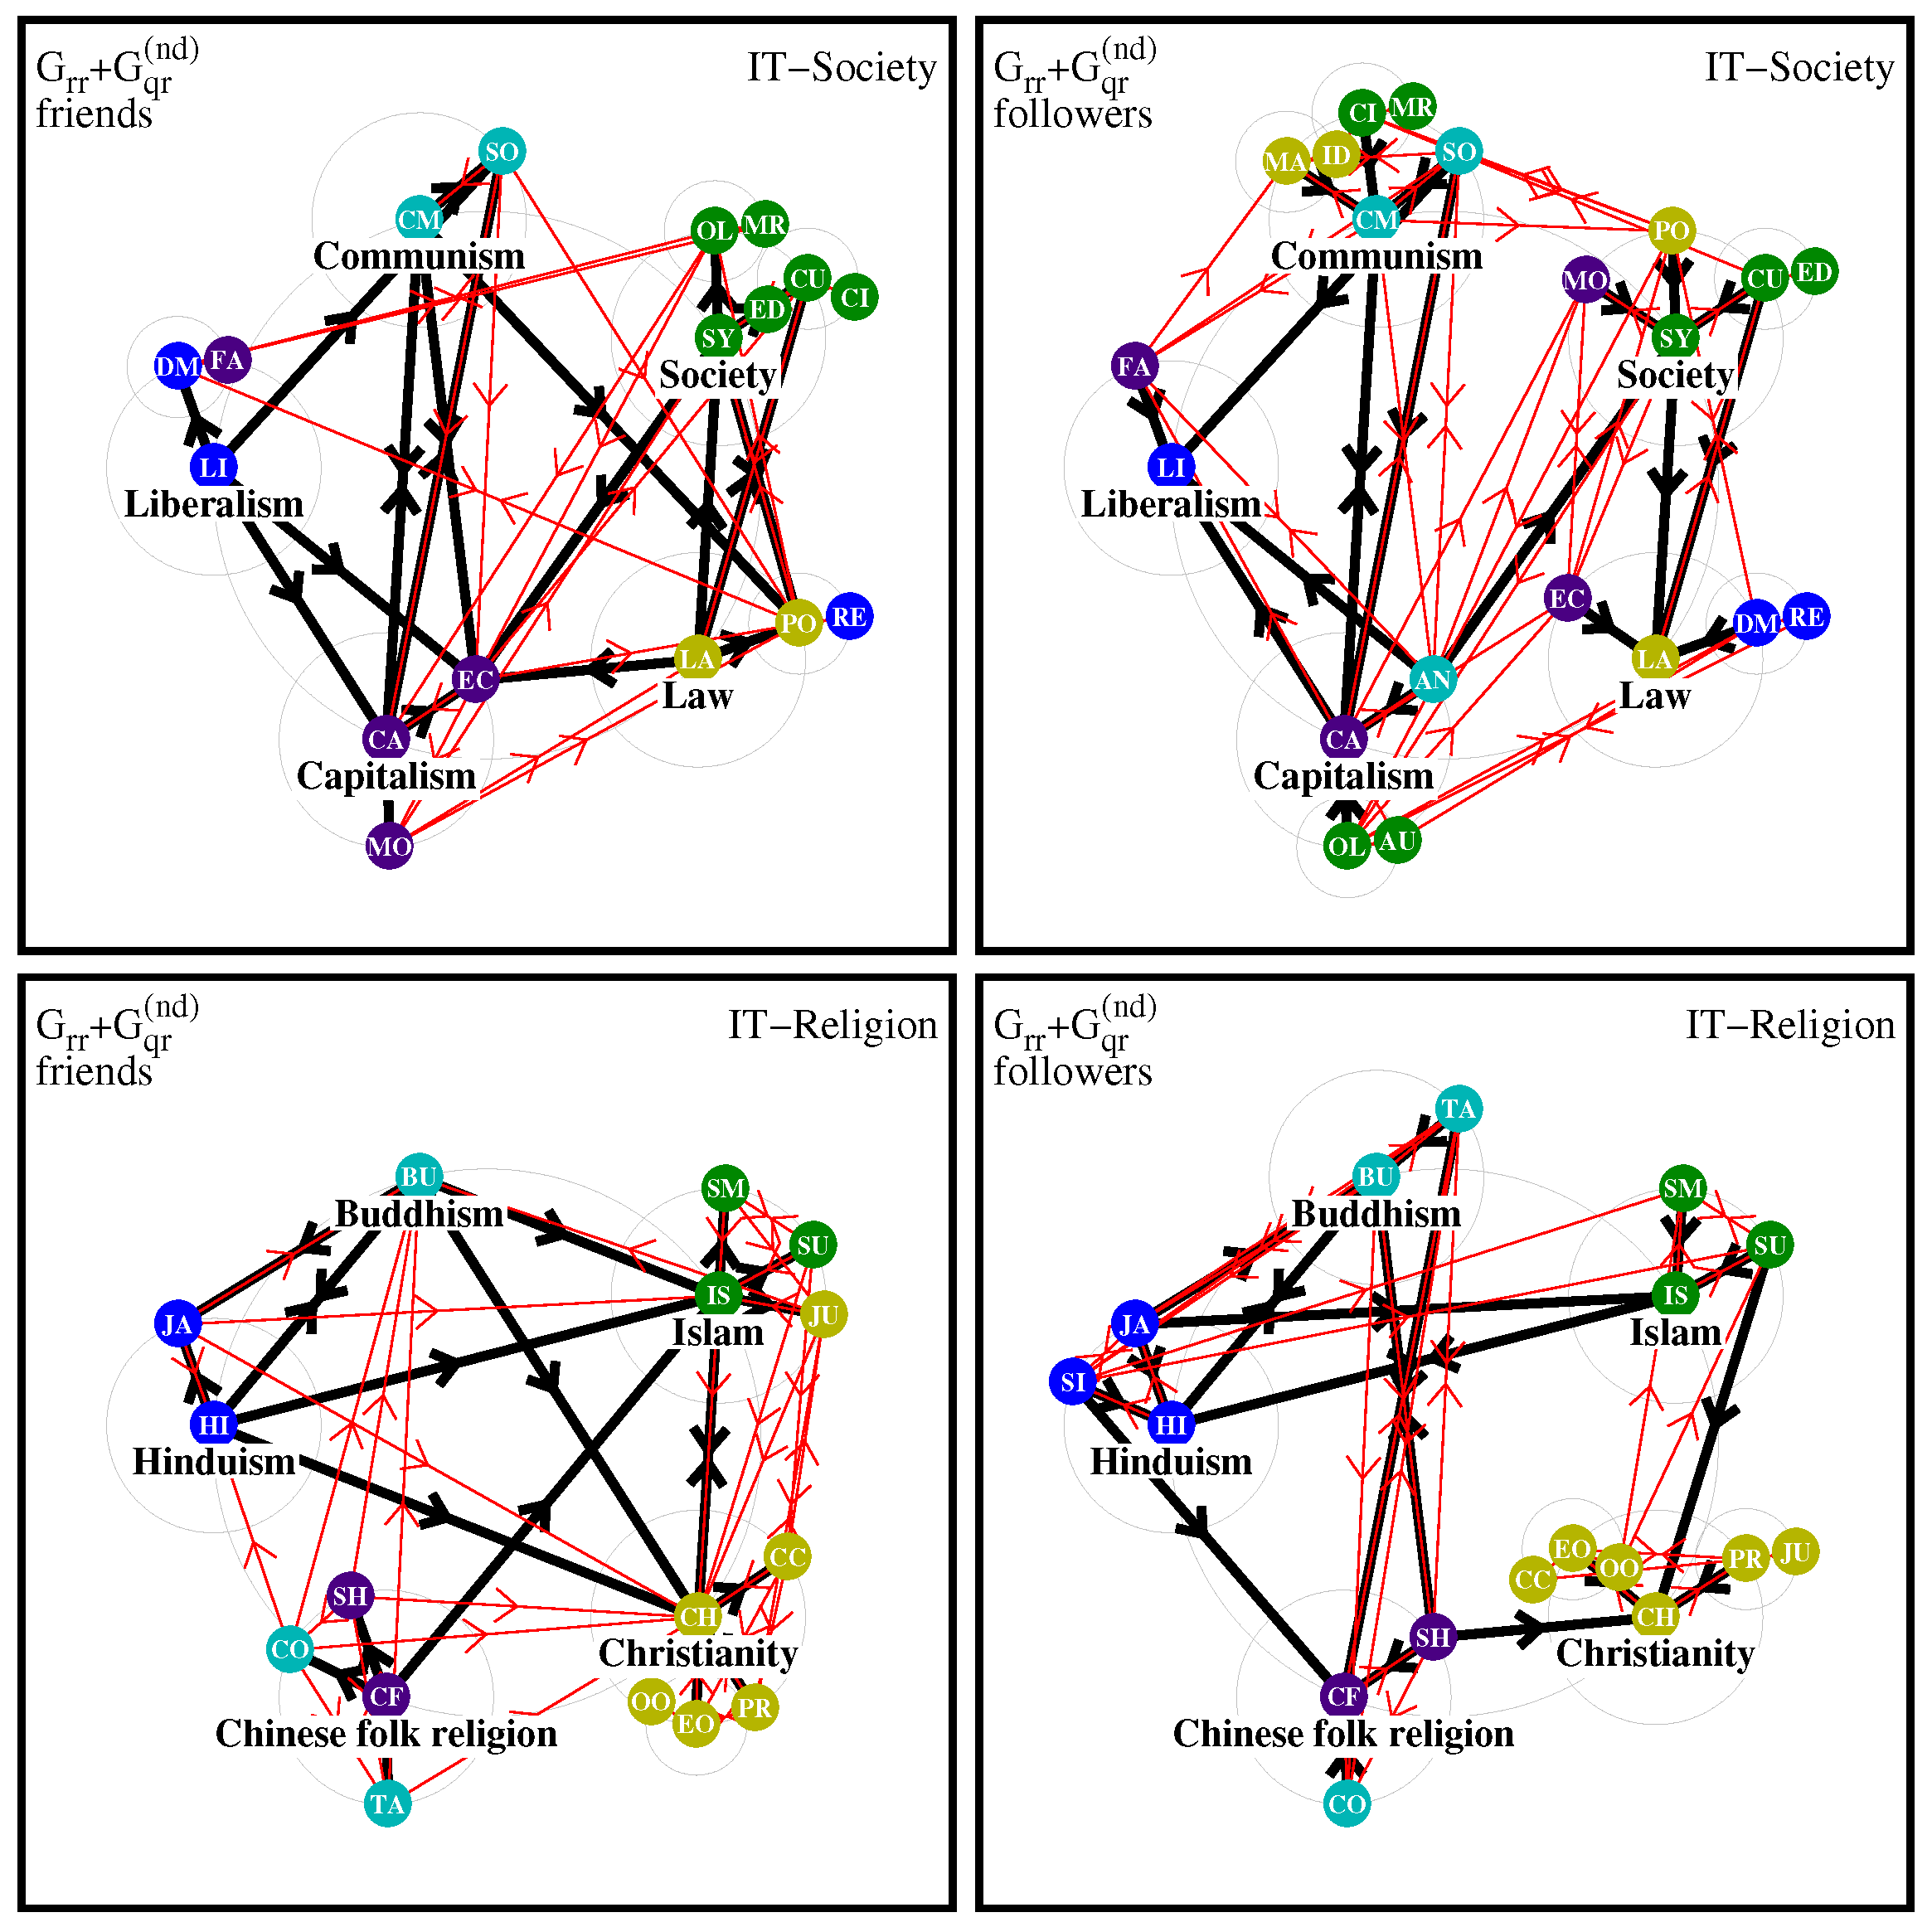
The network diagrams for the IT edition are presented in
Figure 13. For the society friend diagram, the largest pole is Society including Culture, Education, Civilization, Oligarchy and Monarchy (all nodes from the same initial pole); the Liberalism pole includes Democracy and Fascism while Communism has only Socialism. This makes the last two poles rather different from the EN edition. The Capitalism pole is the same as for the EN case; the Law pole contains only Politics and Republic. For the society follower network of IT, the highest number of members is in the pole of Communism including Socialism, Materialism, Idealism, Civilization and Monarchy (three initial poles). In both society friend and follower diagrams, the node Fascism is attributed to Liberalism and while Nazism is absent, which constitutes a drastic difference with the EN case.
In the religion friend diagram of IT, the node Christianity has the highest number of nodes and it is strongly linked with Islam, Buddhism and Hinduism, in contrast to EN where this pole is more isolated. The diagram of followers is similar to those of the EN edition and Christianity remains the strongest pole.
In
Figure 14, we show the network diagrams for the RU edition. Here, the society friend diagram is similar to EN but without Fascism or Nazism in the diagram, also the poles Law and Society have a bit fewer included nodes. In the diagram of followers, Fascism and Nazism are included in the Liberalism pole, in contrast to the EN edition where these two nodes are included in the Communism pole.
For the religion friend diagram, Christianity has the largest number of nodes including Judaism linked also from Islam and this pole is less isolated than in the EN edition. For the diagram of religion followers, Christianity is still the largest pole with six nodes including Judaism pointing to Islam but in other aspects this diagram is similar to the EN edition.
Finally, for the edition for ZH the diagrams are presented in
Figure 15. In the society friend diagram, the strongest pole is Law including Politics, Civilization, Autocracy, Monarchy, Economy and surprisingly Fascism. We note that for ZH the node Law has the unusual local Rank value
for a society node, which are normally well behind the religion nodes in PageRank order. The Communism pole includes only Socialism being well linked to the Society pole, in contrast to the EN case; the Liberalism and Capitalism poles are similar to EN. In the society followers diagram, the strongest pole is again Law with six nodes and three initial poles; Fascism and Nazism are included in the Liberalism pole.
For the religion friend diagram of ZH, the strongest pole is Christianity with six nodes being well connected to other poles, in contrast to the EN case; at the same time the interlinks between Asian religion poles Buddhism, Hinduism and Chinese folk religion are denser as compared to EN. In the religion follower diagram, the strongest pole is also Christianity with six nodes, the diagram structure is similar to EN with a larger number of links between the Islam and Hinduism poles.
Among the main results of
Section 4.2 and
Section 4.3, we point out the following: (R1) The REGOMAX algorithm established matrix transitions between 40 articles of society concepts and religions for eight language editions of Wikipedia. (R2) We find that the weights of links between sector of social concepts and sector of religions are on average a factor of 5 weaker compared to those inside each of these two sectors; this indicates a relatively weak influence of one sector on another one. (R3) We established five main poles of influence for each sector and determined main links between them; these poles are Law, Society, Communism, Liberalism and Capitalism for the sector of society concepts and Christianity, Islam, Buddhism, Hinduism and Chinese folk religion for the sector of religions These networks are described in
Section 4.3. (R4) We established that concepts of Nazism and Fascism were attributed to different poles by different editions. For example, they are attributed to Communism by the English edition, to Capitalism by Arabic edition and Liberalism by German edition. We discuss the proximity and differences of cultures in the next Subsection from a complementary view point.
4.4. Proximity and Differences of Cultures
Let us summarize the most important differences and similarities between the eight cultures represented by the eight Wikipedia language editions obtained in the last Subsection by analyzing the different network diagrams.
First, for the society diagrams the English and French cultures attribute the two nodes Fascism and Nazism to the Communism pole while they are attributed to the Capitalism pole by the Arabic culture and to the Liberalism pole by the German, Spanish (partially), Italian (partially), Russian (for followers) and Chinese (for followers) cultures.
Concerning the religion diagrams, the Christianity pole seems to be rather isolated in the English culture with other links only from the Islam pole (in the friend diagram). On the other hand, for the other cultures the Christianity pole is well connected not only with the Islam pole but also with the other poles of Hinduism, Buddhism and Chinese folk religion. For a majority of cultures, the three poles of the above Asian religions have a higher density of links between them as compared to the Islam and Christianity poles.
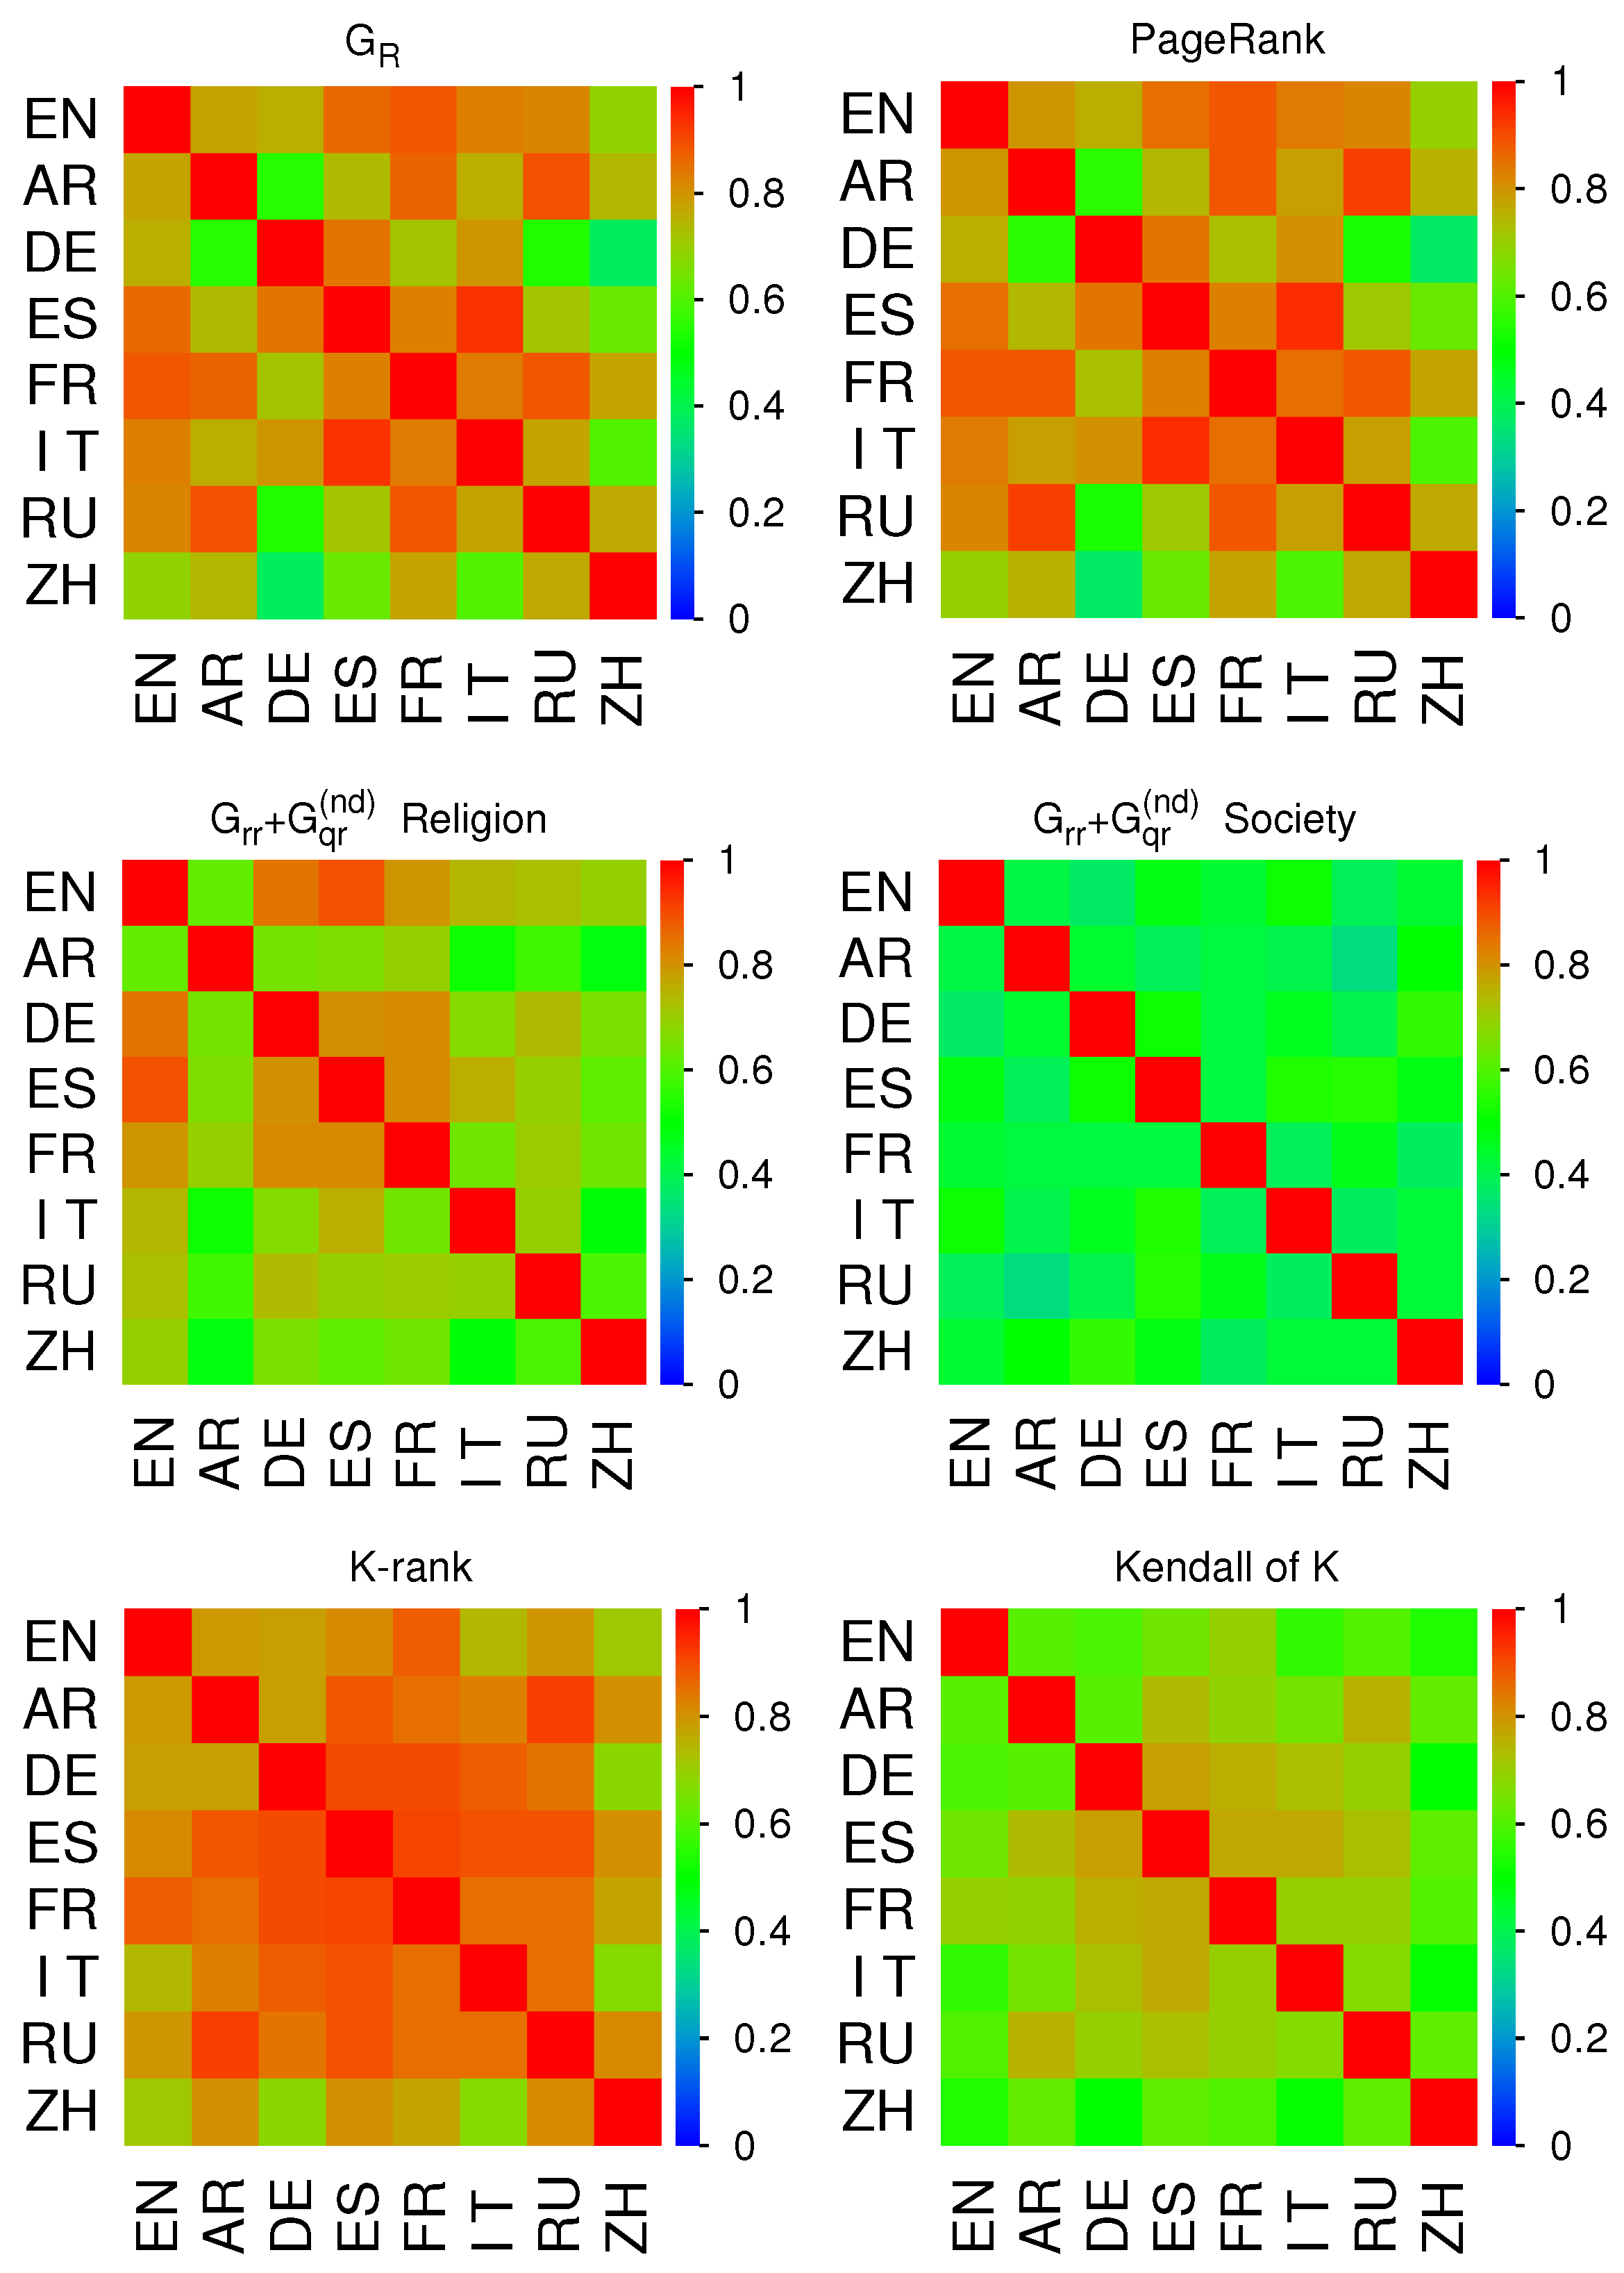
To determine quantitatively the proximity of the eight cultures, we compute the correlators for certain key quantities shown in
Figure 16. The six panels of
Figure 16 provide
-matrix density plots for different inter-edition correlators with five panels for the Pearson correlator of five quantities being the matrix
, the (group local) PageRank vector
, the religion and society sub-blocks for
and the local PageRank index
K and one additional panel for the Kendall correlator of
K. The precise definitions of these correlator quantities with some additional technical details are given in
Section 3.4 and we note that for such correlator quantities the minimal mathematical possible value is
, for the case of two data sets with strong anti-correlations, while values close to 0 indicate weak or absent correlations and values close to
correspond to strong correlations.
First, we observe that generally all eight Wikipedia editions seem to be rather well correlated with a big majority of correlator values being above 0.5 and only a few values close to 0.33. The two correlators associated to
and
(top row of
Figure 16) are very close, which is plausible due to the typical strong numerical weight of
in
and the fact that the columns of
are close to
. Here, the correlations of DE between AR, RU and ZH seem minimal (still with values ∼0.5) and also ZH seems to be less correlated to the other editions (with some fluctuations). The other inter-edition correlations are typically quite strong ∼0.8 with the largest values of
–
for the correlation between ES and IT.
More specifically, for the -correlator and EN the closest other editions are FR (0.882) and ES (0.858); for AR the largest values are with RU (0.896) and FR (0.867), which appears to be plausible due to the, at least partial, importance of Islam in these three cultures. For DE, the two closest cultures are ES (0.845) and IT (0.803); for ES they are IT (0.933) and EN 0.858); for FR they are RU (0.885) and EN (0.882); for IT they are ES (0.933) and FR (0.842); for RU they are AR (0.896) and FR (0.885) and finally for ZH they are FR (0.774) and RU (0.767). For the very similar -correlator, this list of closest two editions is identical with only slightly different correlator values.
Concerning the religion block of
(center left panel of
Figure 16), we see that AR and ZH have globally the weakest correlations to the other cultures, with values ∼0.5, which seems natural due to the importance of their specific religions. On the other hand here, we have a block of four strongly correlated editions of EN, DE, ES and FR between them, with values ≥0.8, while IT and RU have typical “intermediate” correlations ∼0.7.
More explicitly, for this case the closest cultures to EN are ES (0.892) and DE (0.844); for AR they are FR (0.699) and ES (0.662) with relatively low values; for DE they are EN (0.844), FR (0.814) and ES (0.806); for ES they are EN (0.892), FR (0.814) and DE (0.806); for FR they are DE (0.814), ES (0.814) and EN (0.801); for IT they are ES (0.76) and EN (0.746); for RU they are DE (0.737) and EN (0.73) and finally the strongest correlator of ZH is to EN (0.694).
The society block of
(center right panel of
Figure 16) shows the “weakest” general correlations of all correlator quantities with (off-diagonal) values being typically ∼0.5 with the strongest off-diagonal element being 0.565 between DE and ZH, which is due to two strong matrix elements in
due to the links from Oligarchy to Democracy and Monarchy for both editions. Here, the AR-RU correlator represents the minimal correlator value
for all editions and all correlator quantities.
The Pearson and Kendall correlators of the PageRank index
K (bottom row of
Figure 16) appear to have roughly a similar relative structure as the Pearson correlators of
and
(top row of
Figure 16). However, here the overall values are significantly stronger (lower) for the Pearson (Kendall)
K-correlator in comparison to the top row values. For the Kendall correlator of
K and the two editions EN and ZN, there is an additional suppression of the correlator values to other editions, which are mostly close to ∼0.5. Furthermore, for both
K-correlators, we have a block of five editions DE, ES, FR, IT and RU of relatively strong correlations between them and AR has somewhat intermediate correlations to this block, while EN and ZH seem to be a bit more separated from this block (but still with significant correlator values).
