Article

Classification of Moral Decision Making in Autonomous Driving: Efficacy of Boosting Procedures

Department of System Design Engineering, University of Waterloo, Waterloo, ON N2L 3G1, Canada
*
Author to whom correspondence should be addressed.
Information 2024, 15(9), 562; https://doi.org/10.3390/info15090562
Submission received: 18 June 2024 / Revised: 6 September 2024 / Accepted: 10 September 2024 / Published: 11 September 2024
(This article belongs to the Special Issue Machine Learning and Artificial Intelligence with Applications)

Abstract

:
Autonomous vehicles (AVs) face critical decisions in pedestrian interactions, necessitating ethical considerations such as minimizing harm and prioritizing human life. This study investigates machine learning models to predict human decision making in simulated driving scenarios under varying pedestrian configurations and time constraints. Data were collected from 204 participants across 12 unique simulated driving scenarios, categorized into young (24.7 ± 3.5 years, 38 males, 64 females) and older (71.0 ± 5.7 years, 59 males, 43 females) age groups. Participants’ binary decisions to maintain or change lanes were recorded. Traditional logistic regression models exhibited high precision but consistently low recall, struggling to identify true positive instances requiring intervention. In contrast, the AdaBoost algorithm demonstrated superior accuracy and discriminatory power. Confusion matrix analysis revealed AdaBoost’s ability to achieve high true positive rates (up to 96%) while effectively managing false positives and negatives, even under 1 s time constraints. Learning curve analysis confirmed robust learning without overfitting. AdaBoost consistently outperformed logistic regression, with AUC-ROC values ranging from 0.82 to 0.96. It exhibited strong generalization, with validation accuracy approaching 0.8, underscoring its potential for reliable real-world AV deployment. By consistently identifying critical instances while minimizing errors, AdaBoost can prioritize human safety and align with ethical frameworks essential for responsible AV adoption.

1. Introduction

The world is experiencing an unprecedented demographic shift, characterized by a rapidly growing elderly population globally. By 2050, it is projected that nearly a quarter of the world’s population will be over 65 years old. This trend is particularly pronounced in developed nations like Japan, where the elderly constituted 28.4% of the population in 2020, and the United States, where the 65+ population is expected to reach 20% by 2030, up from 13% in 2010. As the population ages, a significant public safety concern arises—the increased risk of traffic accidents involving older drivers. Studies indicate that after age 70, the rate of reported crashes per mile driven begins to rise, with severity and associated costs escalating sharply past age 75. Declining physical and cognitive abilities make it increasingly difficult for many elderly motorists to promptly recognize and respond to hazardous situations on the road. This challenge is compounded by older drivers’ reluctance to relinquish their driving privileges and the independence provided by personal vehicles. Improving their safety through education alone is insufficient, as age-related declines in faculties are linked to increased crash risks and hazardous driving behaviors in this demographic.
The development of autonomous vehicle (AV) technology presents a potential solution, promising to significantly reduce collisions caused by human error. However, AVs will inevitably face unavoidable accident scenarios where casualties are likely, necessitating advanced ethical decision-making (EDM) capabilities. In driving, individuals frequently encounter complex ethical dilemmas that require reconciling competing moral principles and values [1,2]. The trolley problem, a well-known moral thought experiment, serves as a foundation for examining the conflict between utilitarianism and deontological ethics [3,4]. The application of these ethical principles in AVs is not merely theoretical but has practical implications for the development and deployment of these technologies. The trolley problem has inspired extensive research in fields such as moral psychology, neuroscience, decision theory, and transportation ethics [5,6].
Empirical studies have explored the cognitive processes and neural mechanisms underlying EDM in driving scenarios, revealing the interplay between emotion, reason, and moral judgment [7,8,9]. These studies have also examined the influence of personality traits, cultural backgrounds, situational factors, and demographic variables such as age and gender on moral judgments [10,11,12,13]. The trolley problem poses a moral dilemma: should one take action that directly harms one person to save many others, or refrain from action, thereby preserving moral duties but allowing greater harm [14]? Utilitarianism advocates for actions that maximize overall welfare, suggesting that sacrificing one to save many is the ethical choice [15,16]. Conversely, deontological ethics emphasizes the inherent morality of actions based on rules and duties, advocating against using individuals merely as a means to an end [3,17]. The doctrine of double effect within deontological ethics permits actions that have both positive and negative outcomes, provided the harm is not the intended means to achieve the good [18]. The trolley problem illustrates the complexities of EDM, highlighting the need to balance conflicting ethical principles in real-world situations [19,20]. In such moral dilemma situations, AVs may need to select the optimal ethical decision in split-second situations where a human driver may not be able to make a decision.
Designing EDM algorithms for AVs involves mimicking human ethical behavior in complex and often unpredictable situations. Traditional human decision-making processes are vulnerable to biases, emotions, and situational factors, resulting in inconsistent and potentially unethical choices. In contrast, algorithms can offer more consistent and ethically sound decisions, provided they are designed and trained with appropriate ethical frameworks and data. As AVs and advanced driver assistance systems (ADAS) become more integrated into daily life, they will inevitably encounter situations where rapid moral decisions are necessary. These decisions involve weighing potential harm to pedestrians, passengers, and other road users, and determining the most appropriate course of action based on established ethical principles [7,8,21,22]. One significant study in this context is the Moral Machine Experiment conducted by Awad et al. [7], which involved over 2 million participants worldwide and examined trolley-inspired moral dilemmas faced by AVs. The results highlighted significant individual differences influenced by culture, age, and gender, indicating a need for algorithms that can adapt to diverse ethical preferences. Several research efforts have explored algorithmic approaches to guide AVs in making ethical decisions, ranging from rule-based frameworks inspired by ethical theories to machine learning techniques that learn moral preferences from human decision-making data [23,24,25,26]. For instance, Leben [24] proposed a Rawlsian algorithm inspired by John Rawls’ theory of justice, aiming to make decisions acceptable to all parties involved by minimizing the maximum loss. Keeling [27] critiqued this approach and suggested an alternative based on equal consideration of interests, treating all affected parties’ interests equally. Other studies have employed deep neural networks to train AVs in simulated driving scenarios, learning moral preferences from human data [23,28]. These approaches underscore the importance of designing EDM algorithms that can balance utilitarian principles with personal autonomy preferences. Previous studies have demonstrated that individual differences such as age and gender significantly influence EDM in driving scenarios. For example, the Moral Machine Experiment found that cultural background, age, and gender affect moral preferences in AV decisions [7]. Older participants were more likely to endorse non-utilitarian solutions that prioritize individual protection, while younger participants favored utilitarian solutions that minimize overall harm. Gender differences also emerged, with women more likely than men to prioritize saving females [29]. These findings highlight the importance of considering demographic variables in AV EDM algorithms to align with diverse human moral preferences.
The development of EDM algorithms for AVs has been significantly enhanced by advanced computational techniques such as machine learning (ML). These data-driven approaches leverage extensive datasets encompassing driving behavior, traffic patterns, and demographic information to train sophisticated models capable of navigating the intricate ethical dilemmas encountered on the road. Deep neural networks excel at processing complex data inputs like sensor data, enabling AVs to make informed decisions aligned with societal values and moral principles [30]. While traditional regression models like logistic regression are valued for their simplicity and interpretability [31], they often struggle with capturing the complex, non-linear relationships inherent in real-world driving scenarios. This limitation becomes apparent when addressing the multifaceted ethical dilemmas that AVs must navigate. However, boosting algorithms such as Gradient Boosting Machines (GBM), Extreme Gradient Boosting (XGBoost), Light Gradient Boosting Machine (LightGBM), and Category Boosting (CatBoost) offer a robust solution by combining multiple weak learners into a strong predictive model, effectively capturing non-linear relationships and complex feature interactions [32,33]. By incorporating ethical frameworks into these advanced ML models, developers can ensure that AVs make decisions that prioritize safety, minimize harm, and uphold ethical principles, even in challenging scenarios. The ability to continuously update and refine these models with new data further enhances their decision-making capabilities, ensuring AVs remain responsive to evolving conditions and ethical considerations.
Drawing on the foundational insights, our study aims to develop a predictive model that accurately categorizes utilitarian decisions in driving scenarios by integrating age and gender factors that influence these decisions. The inclusion of demographic variables aims to create a predictive tool that respects and reflects the diversity of human moral preferences. We compare the performance of traditional logistic regression with state-of-the-art boosting procedures (including AdaBoost, XGBoost, LightGBM, and CatBoost), hypothesizing that boosting models will significantly enhance predictive accuracy. Through this study, we emphasize the advancement of EDM algorithms for AVs, ensuring they make decisions that are both technically proficient and ethically sound in real-world scenarios. The research underscores both technical proficiency and explores the ethical implications of AV decision making. By demonstrating the superior performance of boosting algorithms over traditional regression models, our findings highlight the transformative impact of advanced machine learning techniques on decision-making processes within AV technologies.

2. Materials and Methods

2.1. Partcipants

The study recruited 290 participants from North America, out of which 86 were excluded due to failing predetermined ‘catch-trials’ involving responding when no pedestrian was present or not responding during video trials. The final participant pool consisted of 204 individuals categorized into two age groups: young (18–30 years, n = 102) and older (65 and above, n = 102). The young group had a mean age of 24.7 ± 3.5 years, comprising 38 males and 64 females. The older group had a mean age of 71.0 ± 5.7 years, with 59 males and 43 females. All participants provided informed consent, held valid driver’s licenses, and reported normal or corrected-to-normal visual acuity. Each participant received CAD 5 as remuneration. The study protocol was approved by the University of Waterloo Research Ethics Board (ORE#44255).

2.2. Experimental Setup

The study utilized a driving simulator software (Carnetsoft BV, Groningen, Netherlands) to create and record various driving scenarios. Due to COVID-19 restrictions, the experiment was conducted remotely. The driving simulator was programmed to generate 12 unique scenario conditions by combining three independent variables: time pressure (3 levels) and pedestrian positioning (4 configurations) as shown in Figure 1. These scenarios were designed to systematically vary key parameters while maintaining consistency across trials, effectively creating a structured framework for examining ethical decision making in driving contexts. The scenarios differed based on the presence of pedestrian avatars, their location in the right or left lane, and whether an additional pedestrian was present in the opposite lane. Time-to-collision (TTC) values were manipulated to create varying time pressure situations. The virtual driving environment depicted a countryside road with four lanes and reduced visibility due to fog, with no other vehicles present.
The scenarios differed based on the presence of pedestrian avatars, their location in the right or left lane, and whether an additional pedestrian was present in the opposite lane. Time-to-collision (TTC) values were manipulated at 1, 2, and 3 s to create varying time pressure situations. The virtual driving environment depicted a countryside road with four lanes and reduced visibility due to fog, with no other vehicles present. Vehicle speed was maintained at a constant 50 km/h throughout all scenarios. Approximately 30 s into each video, the simulated vehicle approached a pedestrian crossing marked with a warning sign appearing 5 s prior. As the vehicle neared the crosswalk, a group of pedestrians suddenly appeared and began crossing the road. The video froze before any pedestrian was hit. In these scenarios, participants had to decide whether to remain in the current lane or change lanes to avoid the pedestrians, while considering utilitarian (minimizing casualties) and non-utilitarian factors. The study used a 2 (age groups) × 2 (pedestrian group placement) × 2 (presence of pedestrians in opposite lane) × 3 (TTC level) repeated-measures design. Pedestrian configurations were labeled as (0-5), (1-5), (5-1), and (5-0), indicating the number of pedestrians in the left lane and driving lane, respectively. For example, (1-5) denoted one pedestrian in the left lane and five in the driving lane. Participants completed 12 ethical decision scenarios corresponding to the variable combinations, plus four catch trials without any pedestrians to verify compliance with instructions.
This structured approach, while not employing a traditional mathematical simulation model, provided a rigorous and reproducible framework for examining ethical decision making in driving contexts. By controlling these parameters, we could isolate the effects of time pressure and pedestrian configurations on participants’ decisions, allowing for robust analysis of moral decision-making processes in driving scenarios.

2.3. Procedure

The study was conducted online, with participants recruited through Prolific’s participant recruitment platform: www.prolific.co (accessed on 16 February 2024). Participants were directed to a Qualtrics-hosted platform, where they received instructions regarding a simulated driving task. The instructions asked participants to imagine operating a car with limited automated features that maintained lane position and speed limit. However, the automation could not avoid unexpected obstacles, requiring participants to override it when necessary. Participants were instructed to continue straight without any input if they wished to proceed. To change lanes to the left, they were told to press the spacebar. They were advised not to press the spacebar if they did not believe a maneuver was required. Each trial would end upon pressing the spacebar, and the next trial would begin automatically. After confirming their understanding, participants proceeded to the trial recordings. They were presented with 16 simulated video trials, comprising 12 recorded trials and 4 catch trials (without pedestrians). The trial order was randomized, and each lasted 30 s. The study focused on two dependent variables: choice response (whether the participant pressed the spacebar or not for each trial) and response time (time interval between the start of each video and the participant’s choice response in scenarios where a response was recorded).

2.4. Predictive Modeling

To analyze the choice response data from the simulated driving scenarios, two types of predictive modeling approaches were employed: logistic regression and boosting models.
The logistic regression technique used to analyze binary outcome variables [35] was well suited for the analysis of the choice response data in this study. In the context of simulated driving scenarios, the binary outcome variable represents the decision to change lanes or maintain the current lane when faced with pedestrians on the crosswalk. The logistic regression model relates the binary outcome variable (y) to a set of predictor variables (X1, X2,…, Xk) through the logit transformation. The predictor variables in this study can include factors such as age group (young vs. older), time pressure condition (1 s, 2 s, 3 s), pedestrian placement configuration ((0-5), (1-5), (5-1), (5-0)), and the presence or absence of pedestrians in the opposite lane. The regression coefficients (β) are estimated using maximum likelihood estimation (MLE), which involves finding the values of the coefficients that maximize the likelihood of observing the given data. The likelihood function for logistic regression is based on the Bernoulli distribution, and the estimation process typically involves iterative numerical optimization algorithms, such as Newton–Raphson or iteratively reweighted least squares.
Boosting is an ensemble learning technique that combines multiple weak models (e.g., decision trees) to create a strong predictive model [36]. The choice of boosting algorithms was motivated by their ability to effectively handle the diverse set of predictor variables, including age group, time pressure conditions, pedestrian placement configurations, and the presence of pedestrians in the opposite lane. These algorithms excel at capturing complex non-linear relationships and interactions between features, which is crucial for accurately modeling the decision-making process in such scenarios. In this study, three boosting algorithms were employed: AdaBoost, XGBoost, and LightGBM. AdaBoost is an iterative algorithm that trains a sequence of weak learners (e.g., decision trees) on weighted versions of the data. Each subsequent model focuses on the instances that the previous model misclassified, adjusting the weights accordingly. The final prediction is a weighted majority vote of the individual models. XGBoost is a highly efficient and scalable implementation of gradient boosting, which builds an ensemble of decision trees in a sequential manner. It uses a regularized model formalization to control overfitting and provides parallel processing capabilities. LightGBM is another gradient boosting framework that focuses on efficiency and scalability. It employs techniques such as histogram-based decision tree algorithms, gradient-based one-side sampling, and exclusive feature bundling to achieve faster training and improved performance. The LightGBM algorithm follows a similar approach to XGBoost, with additional optimizations and techniques to improve computational efficiency and handle large-scale data. CatBoost (Categorical Boosting) is a state-of-the-art gradient boosting framework that employs several innovative techniques to handle categorical features efficiently and prevent overfitting. It utilizes ordered target encoding to replace categorical values with numerical values based on the average target for that category, performed in a specific order to mitigate overfitting. CatBoost employs an ordered boosting approach, building each new model based on the previous ones, rather than from scratch. It incorporates overfitting detection by monitoring performance on a hold-out validation set and automatically stopping training when overfitting occurs. Additionally, CatBoost employs techniques such as ordered categorical feature statistics, categorical feature combination, and binarization to effectively handle high-cardinality categorical data. It supports parallel computation on multiple CPU cores or GPUs for improved training speed. Regularization methods like L2 regularization, random subsampling, and random feature subsampling are also integrated to further prevent overfitting. The final model is an ensemble of decision trees, with the prediction being the sum of individual tree predictions.
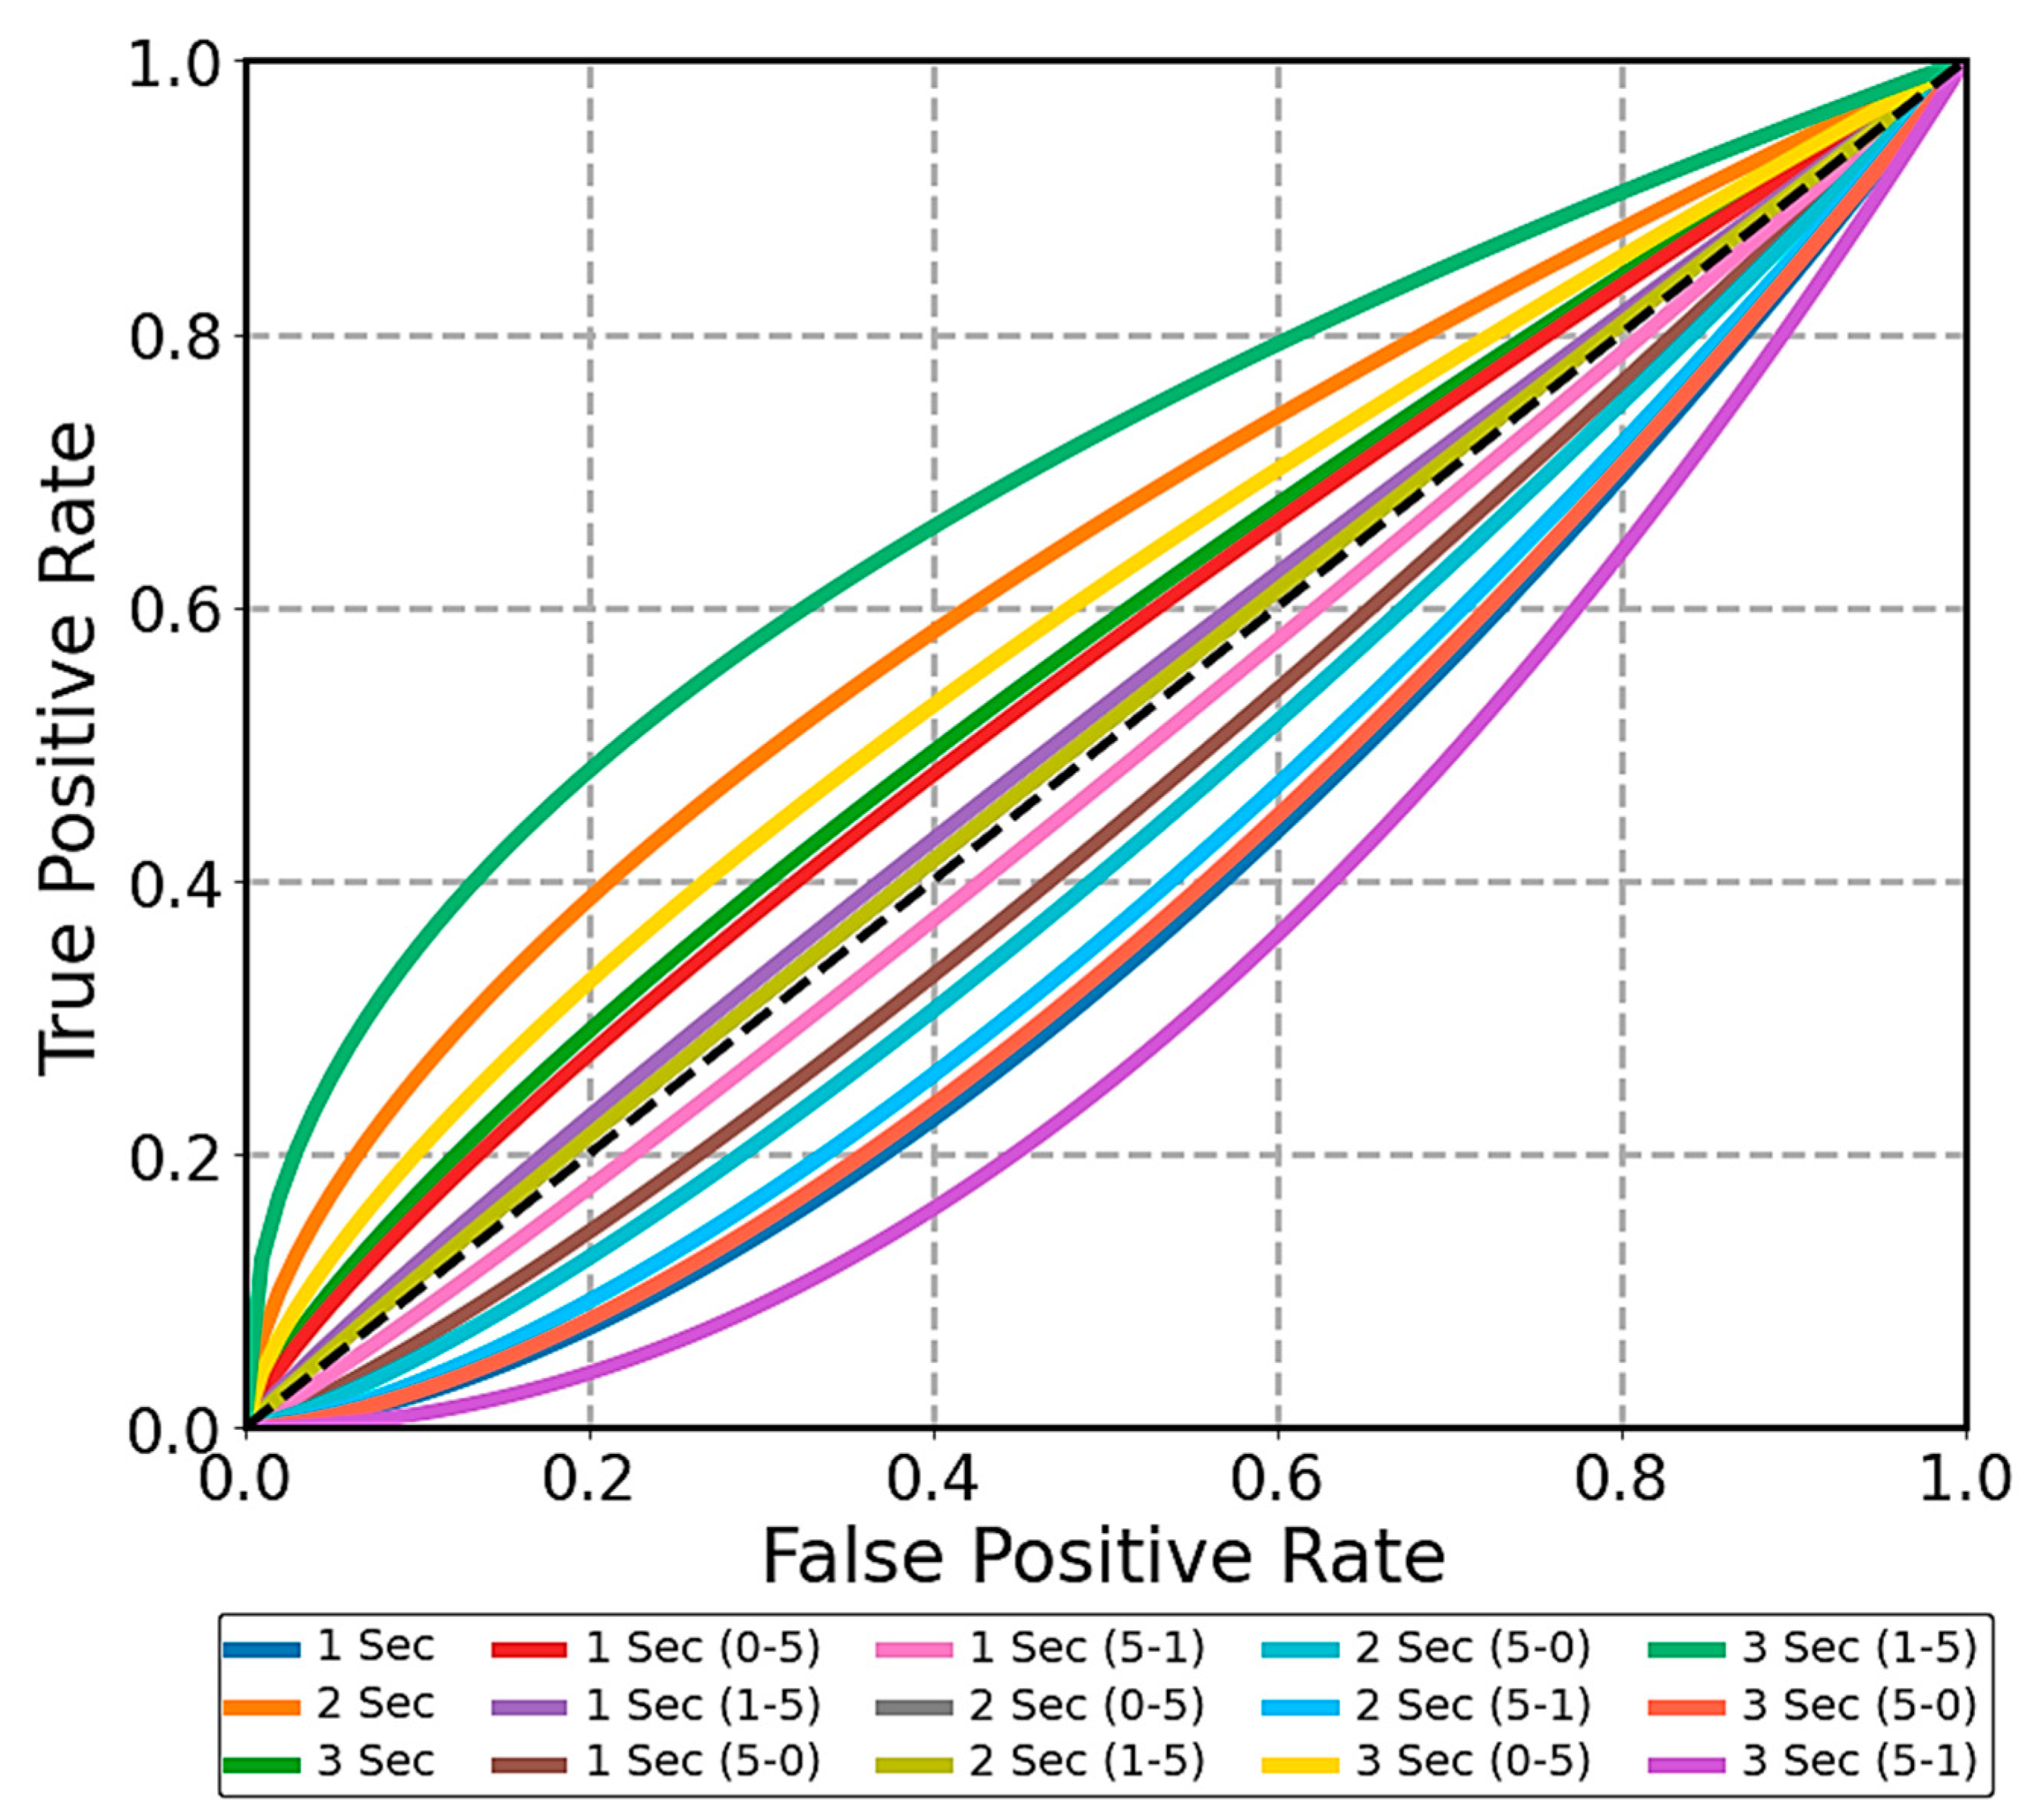
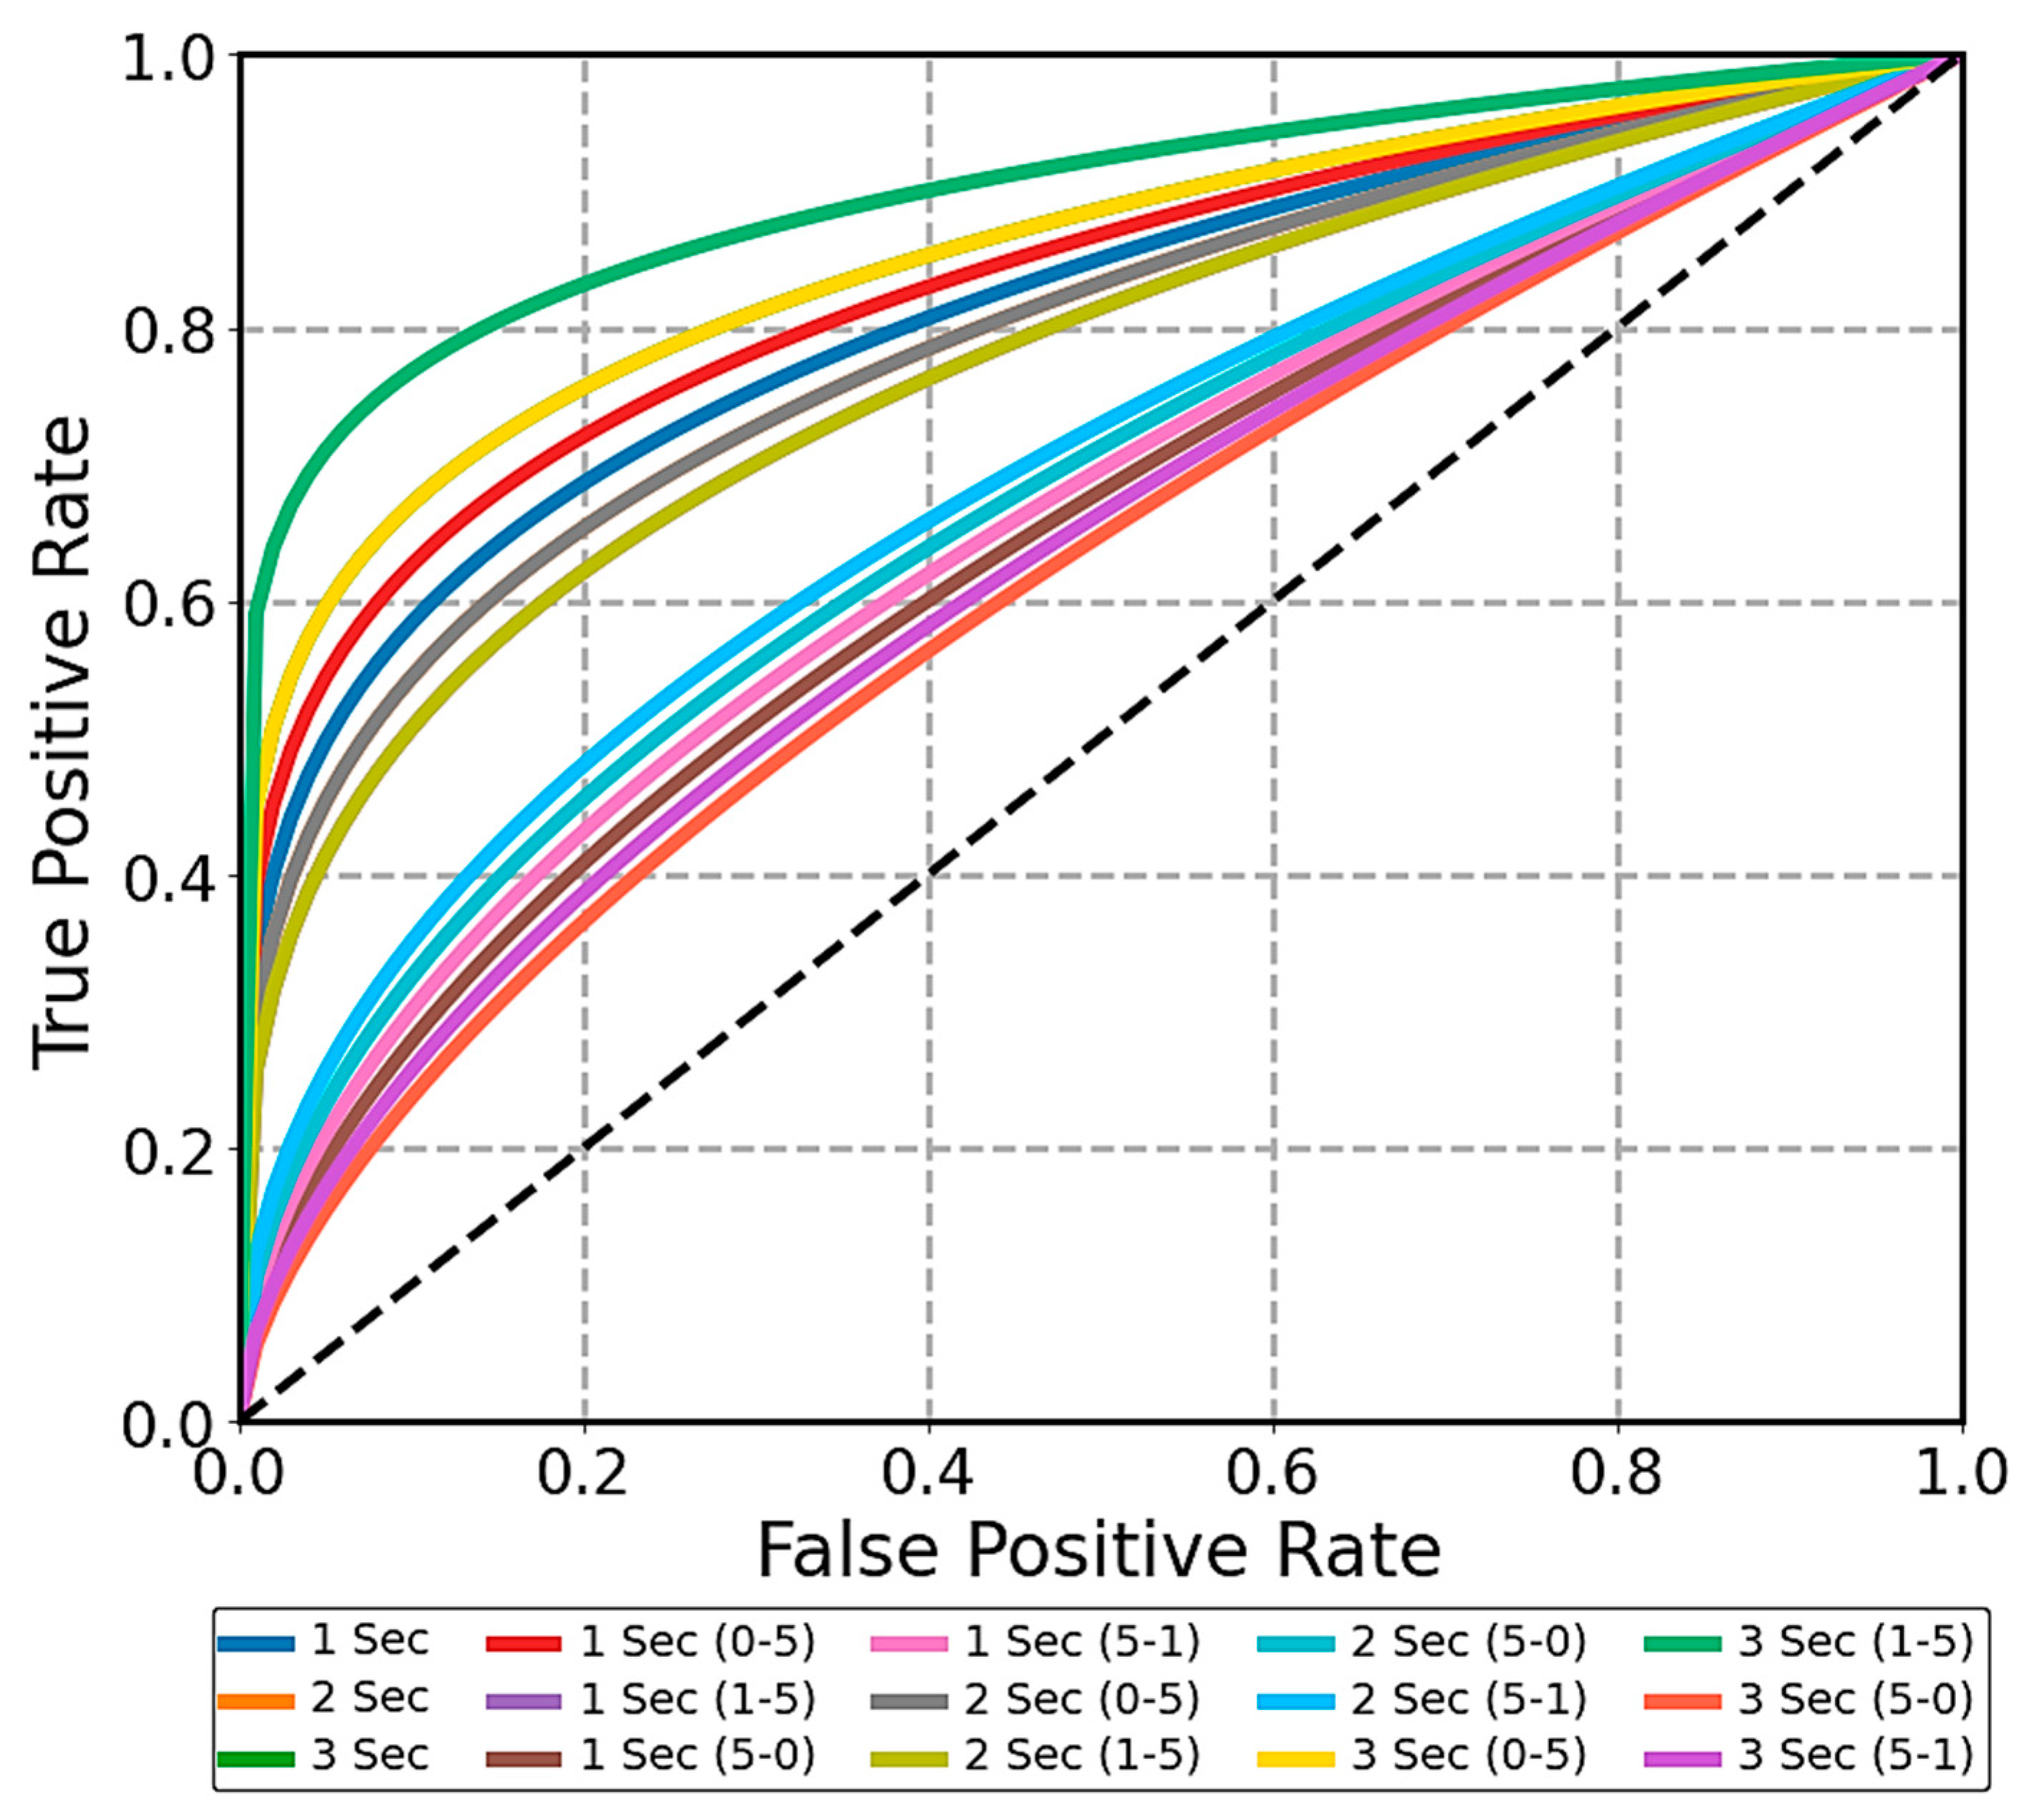
Further, we generated tabular statistics summarizing key performance metrics for each model, including accuracy, precision, recall, and AUC-ROC values. These statistics are detailed in the results section. Additionally, we created curve graphs, specifically ROC curves, to visualize the trade-offs between true positive rates and false positive rates at various classification thresholds. To further assess model performance, confusion matrices were generated, providing a detailed breakdown of true positive rates and the management of false positives and negatives under different time constraints. Learning curves were produced by training the models on increasingly larger subsets of the training data and evaluating performance on both the training subset and the validation set. This process allowed for the assessment of model learning and potential overfitting.

2.5. Model Validation and Algorithm Flow

This study employs both logistic regression and boosting algorithms, particularly AdaBoost, to classify moral decision making in driving scenarios. The theoretical foundation of our approach is rooted in ensemble learning principles, where multiple weak learners are combined to form a strong predictive model. For model validation, we used k-fold cross-validation to assess performance on unseen data. This involved partitioning our dataset of 204 participants’ responses across 12 scenarios into k subsets, training on k-1 subsets, and validating on the remaining subset, repeating this process k times. The AdaBoost algorithm flow in our study can be summarized as follows: (1). Initialize weights for all training samples equally (1/N, where N is the number of samples). (2). For each iteration (we used 100 iterations based on empirical testing): (a) train a weak learner (decision stump, which is a one-level decision tree) on the weighted dataset; (b) calculate the error rate ε of the weak learner: ε = sum of weights of misclassified instances/total sum of weights; (c) compute the weight α of the weak learner: α = 0.5 × ln((1 − ε)/ε); and (d) update the weights of instances: multiply the weights of misclassified instances by eα and normalize all weights. (3). Combine all weak learners using weighted majority voting: final_prediction = sign(Σ(α_t × h_t(x))), where α_t is the weight and h_t(x) is the prediction of the t-th weak learner. The number of weak learners in our final model is equal to the number of iterations (100 in this case). We used the weighted majority voting technique to combine weak learners, which is the standard approach in AdaBoost.

2.6. Hyperparamter Tuning

For the logistic regression model, we performed hyperparameter tuning using grid search over regularization type, regularization strength (C parameter), and solver algorithm. The best performing configuration employed L2 (Ridge) regularization with C = 10, which controls the inverse of the regularization strength, and the ‘liblinear’ solver algorithm for efficient optimization. For the boosting algorithms (AdaBoost, XGBoost, LightGBM, CatBoost), we tuned several key hyperparameters using random search to explore the high-dimensional hyperparameter space efficiently. The optimal configuration included 1000 estimators in the ensemble, a maximum tree depth of 6 to balance model complexity and flexibility, a small learning rate of 0.01 for gradual learning, subsampling 50% of training instances at each iteration, setting the minimum samples per leaf to 5 to prevent overly complex trees, and an L2 regularization value of 1.0 for XGBoost and LightGBM.

2.7. Model Performance Evaluation

We employed several evaluation metrics and techniques to comprehensively assess the performance of the logistic regression and boosting models for the simulated driving scenarios. These included accuracy, precision, recall, F1-score, mean square error (MSE), area under the receiver operating characteristic (ROC) curve, and the confusion matrix. Accuracy measured the overall proportion of correct classifications, while precision and recall quantified the model’s ability to identify true positive instances. The F1-score provided a balanced measure combining precision and recall. The ROC curve and its area under the curve (AUC) evaluated the model’s capability to discriminate between positive and negative instances across various classification thresholds. The confusion matrix offered a detailed view of true positives, true negatives, false positives, and false negatives. Additionally, we monitored the loss function and accuracy curves during training to detect potential overfitting or underfitting issues.

3. Results and Discussion

In this section, we will present the performance metrics of the logistic regression and AdaBoost models exclusively, as other boosting models like XGBoost, LightBoost, and CatBoost reported similar performance metrics to those provided by AdaBoost. Specifically, we will present the accuracy, precision, recall, F1-score, ROC-AUC, and mean squared error (MSE) for both models across all conditions. Additionally, we will analyze the AUC-ROC curves to evaluate the true positive versus false positive rates for both models. We will also present the loss versus epoch and accuracy versus epoch analyses to understand the training dynamics. Finally, we will provide the confusion matrices to give a detailed view of the models’ prediction performance.

3.1. Logistic Regression Performance

This model demonstrated moderate accuracy, with some scenarios achieving over 80% accuracy as illustrated in Table 1. Precision scores were generally high, indicating a low rate of false positives, but recall remained consistently at 0.50 across all scenarios, which negatively impacted the F1-scores. The MSE values were lower in scenarios with higher accuracy, indicating fewer prediction errors. For the aggregated time pressure conditions (1 Sec, 2 Sec, and 3 Sec), accuracy ranged from 0.85 to 0.95. Precision was highest in 2 Sec at 0.98, with an MSE of 0.05, suggesting better performance in simpler scenarios. However, the recall being fixed at 0.50 shows that the model struggled to balance true positive rates, resulting in moderate F1-scores (0.46 to 0.49).
For scenarios with a 1 s decision time, the 1 Sec (0-5) scenario had the highest accuracy at 0.92 and a precision of 0.96, but recall was again 0.50, leading to an F1-score of 0.48. The performance dropped significantly in the 1 Sec (5-1) scenario, with an accuracy of 0.58 and a higher MSE of 0.42, indicating the model’s limitations in more complex, rapid decision-making situations. In the 2 s response scenarios, the model showed improved accuracy, particularly in the 2 Sec (1-5) scenario, achieving an accuracy of 0.90 and a precision of 0.93, but the recall was still 0.50, resulting in an F1-score of 0.47. In contrast, the 2 Sec (5-1) scenario had the lowest accuracy of 0.47 and an MSE of 0.53, further highlighting the model’s difficulties with complex decisions involving multiple pedestrians. For the 3 s response scenarios, performance metrics were relatively stable, with the 3 Sec (0-5) scenario achieving an accuracy of 0.81 and a precision of 0.79. However, the 3 Sec (5-0) and 3 Sec (5-1) scenarios showed reduced performance, with lower accuracy (0.56 and 0.50, respectively) and higher MSE values (0.44 and 0.50), indicating ongoing challenges with complex scenarios despite increased decision time.
While the model showed high precision, indicating it was effective at identifying scenarios where intervention was needed, the consistently low recall suggests it struggled to identify all relevant cases, leading to moderate F1-scores. This highlights the model’s inability to balance precision and recall effectively. The drop in performance in scenarios requiring rapid decision making (e.g., 1 Sec (5-1)) underscores the challenges faced in high-pressure situations, where the ethical implications of driving decisions are most critical. These results suggest that while logistic regression provides a baseline understanding, more sophisticated models (like boosting models) may be necessary to enhance predictive accuracy and reliability in ethical decision making under such driving circumstances.

3.2. AdaBoost Performance

This model’s results demonstrate a significant improvement in predictive performance compared to the logistic regression model as illustrated in Table 2. It exhibited high accuracy across all scenarios, frequently exceeding 90%. Precision scores were consistently high, ranging from 0.80 to 0.99, indicating a very low rate of false positives. Recall scores were also notably higher compared to logistic regression, often surpassing 0.80, which contributed to higher F1-scores and a more balanced performance. The MSE values were low, indicating fewer prediction errors across scenarios. In scenarios with 1 s decision times, the model performed exceptionally well.
The 1 Sec (0-5) scenario achieved an accuracy of 0.95, with a precision of 0.97 and an F1-score of 0.91, reflecting the model’s robust performance even under tight time constraints. Similarly, the 1 Sec (5-1) scenario, which posed greater complexity, still maintained an accuracy of 0.86, precision of 0.84, and F1-score of 0.81, demonstrating the model’s effectiveness in rapid decision-making situations. For scenarios with a 2-s decision time, the performance remained strong. The 2 Sec (0-5) scenario had an accuracy of 0.94, precision of 0.96, and F1-score of 0.89. The more complex 2 Sec (5-1) scenario achieved an accuracy of 0.88, precision of 0.86, and F1-score of 0.83, indicating the model’s consistent ability to handle varying degrees of complexity. In the 3 s response scenarios, the model’s performance was at its peak. The 3 Sec (0-5) scenario showed an accuracy of 0.96, precision of 0.98, and an F1-score of 0.92. The 3 Sec (1-5) scenario performed even better with an accuracy of 0.98, precision of 0.99, and F1-score of 0.93, highlighting the model’s exceptional capability when more time is allowed for decision making. However, in the 3 Sec (5-1) scenario, the accuracy dropped to 0.83, with precision and F1-scores of 0.81 and 0.79, respectively, still surpassing logistic regression.
Overall, the AdaBoost model significantly outperformed the logistic regression model across all evaluated scenarios, particularly in handling complex and time-sensitive driving decisions. The high accuracy and precision across various conditions demonstrate AdaBoost’s robustness in minimizing false positives. The notable improvement in recall and F1-scores highlights its ability to maintain a balance between identifying true positives and minimizing false negatives. The lower MSE values further confirm the model’s predictive reliability. The consistent high performance of the AdaBoost model, especially in scenarios with short decision times (e.g., 1 Sec and 2 Sec scenarios), underscores its potential utility in real-world automated driving systems where rapid, ethical decision making is necessary.

3.3. AUC-ROC Comparison

The AUC-ROC values were computed to assess the discriminatory power of logistic regression and AdaBoost models in predicting utilitarian behavior across different driving scenarios. The logistic regression model exhibited mixed performance across different scenarios as illustrated in Figure 2. The AUC-ROC values ranged from 0.56 to 0.81 for the aggregated 1 Sec, 2 Sec, and 3 Sec conditions. This indicates varied success in distinguishing between true positive and false positive rates, with 2 Sec showing a relatively higher value of 0.81 compared to 1 Sec (0.56) and 3 Sec (0.76). For scenarios with a 1 s decision time, such as 1 Sec (0-5) and 1 Sec (1-5), this model achieved values of 0.75 and 0.72, respectively. These values suggest moderate discriminatory power in rapid decision-making situations but indicate room for improvement, particularly in scenarios involving more pedestrians in the driving lane (1 Sec (5-0) with a value of 0.65 and 1 Sec (5-1) with a value of 0.68). As decision time increased to 2 s, AUC-ROC values improved slightly in scenarios like 2 Sec (0-5) and 2 Sec (1-5) i.e., 0.71. However, more complex scenarios with fewer pedestrians in the driving lane (2 Sec (5-0) with AUC-ROC of 0.63 and 2 Sec (5-1) with AUC-ROC of 0.59) exhibited lower discriminatory power. In scenarios with a 3 s decision time, logistic regression showed improved performance, particularly in scenarios like 3 Sec (0-5) with an AUC-ROC of 0.78 and 3 Sec (1-5) with 0.85. However, more challenging scenarios (3 Sec (5-0) and 3 Sec (5-1)) yielded decreased performance with values of 0.57 and 0.49, respectively, indicating difficulties in accurately predicting utilitarian decisions under extended decision times and complex scenarios.
In contrast, the AdaBoost model consistently outperformed logistic regression across all evaluated scenarios (Figure 3). AdaBoost achieved consistently high AUC-ROC values ranging from 0.82 to 0.96, highlighting its robust discriminatory power in distinguishing between utilitarian and non-utilitarian decisions. Scenarios with a 1 s decision time, such as 1 Sec (0-5) (AUC-ROC = 0.93) and 1 Sec (5-1) (AUC-ROC = 0.83), demonstrated strong performance, indicating AdaBoost’s ability to maintain high true positive rates while minimizing false positives in rapid decision-making contexts. AdaBoost continued to perform well in scenarios with 2 s decision times, achieving AUC-ROC values such as 0.91 in 2 Sec (0-5) and 0.85 in 2 Sec (5-1), showcasing consistent reliability across varying levels of decision complexity. Even in scenarios requiring 3 s for decision making, AdaBoost excelled with AUC-ROC values reaching up to 0.96 in 3 Sec (1-5), demonstrating its superior ability to handle extended decision times while maintaining high predictive accuracy.

3.4. Confusion Matrix Analysis

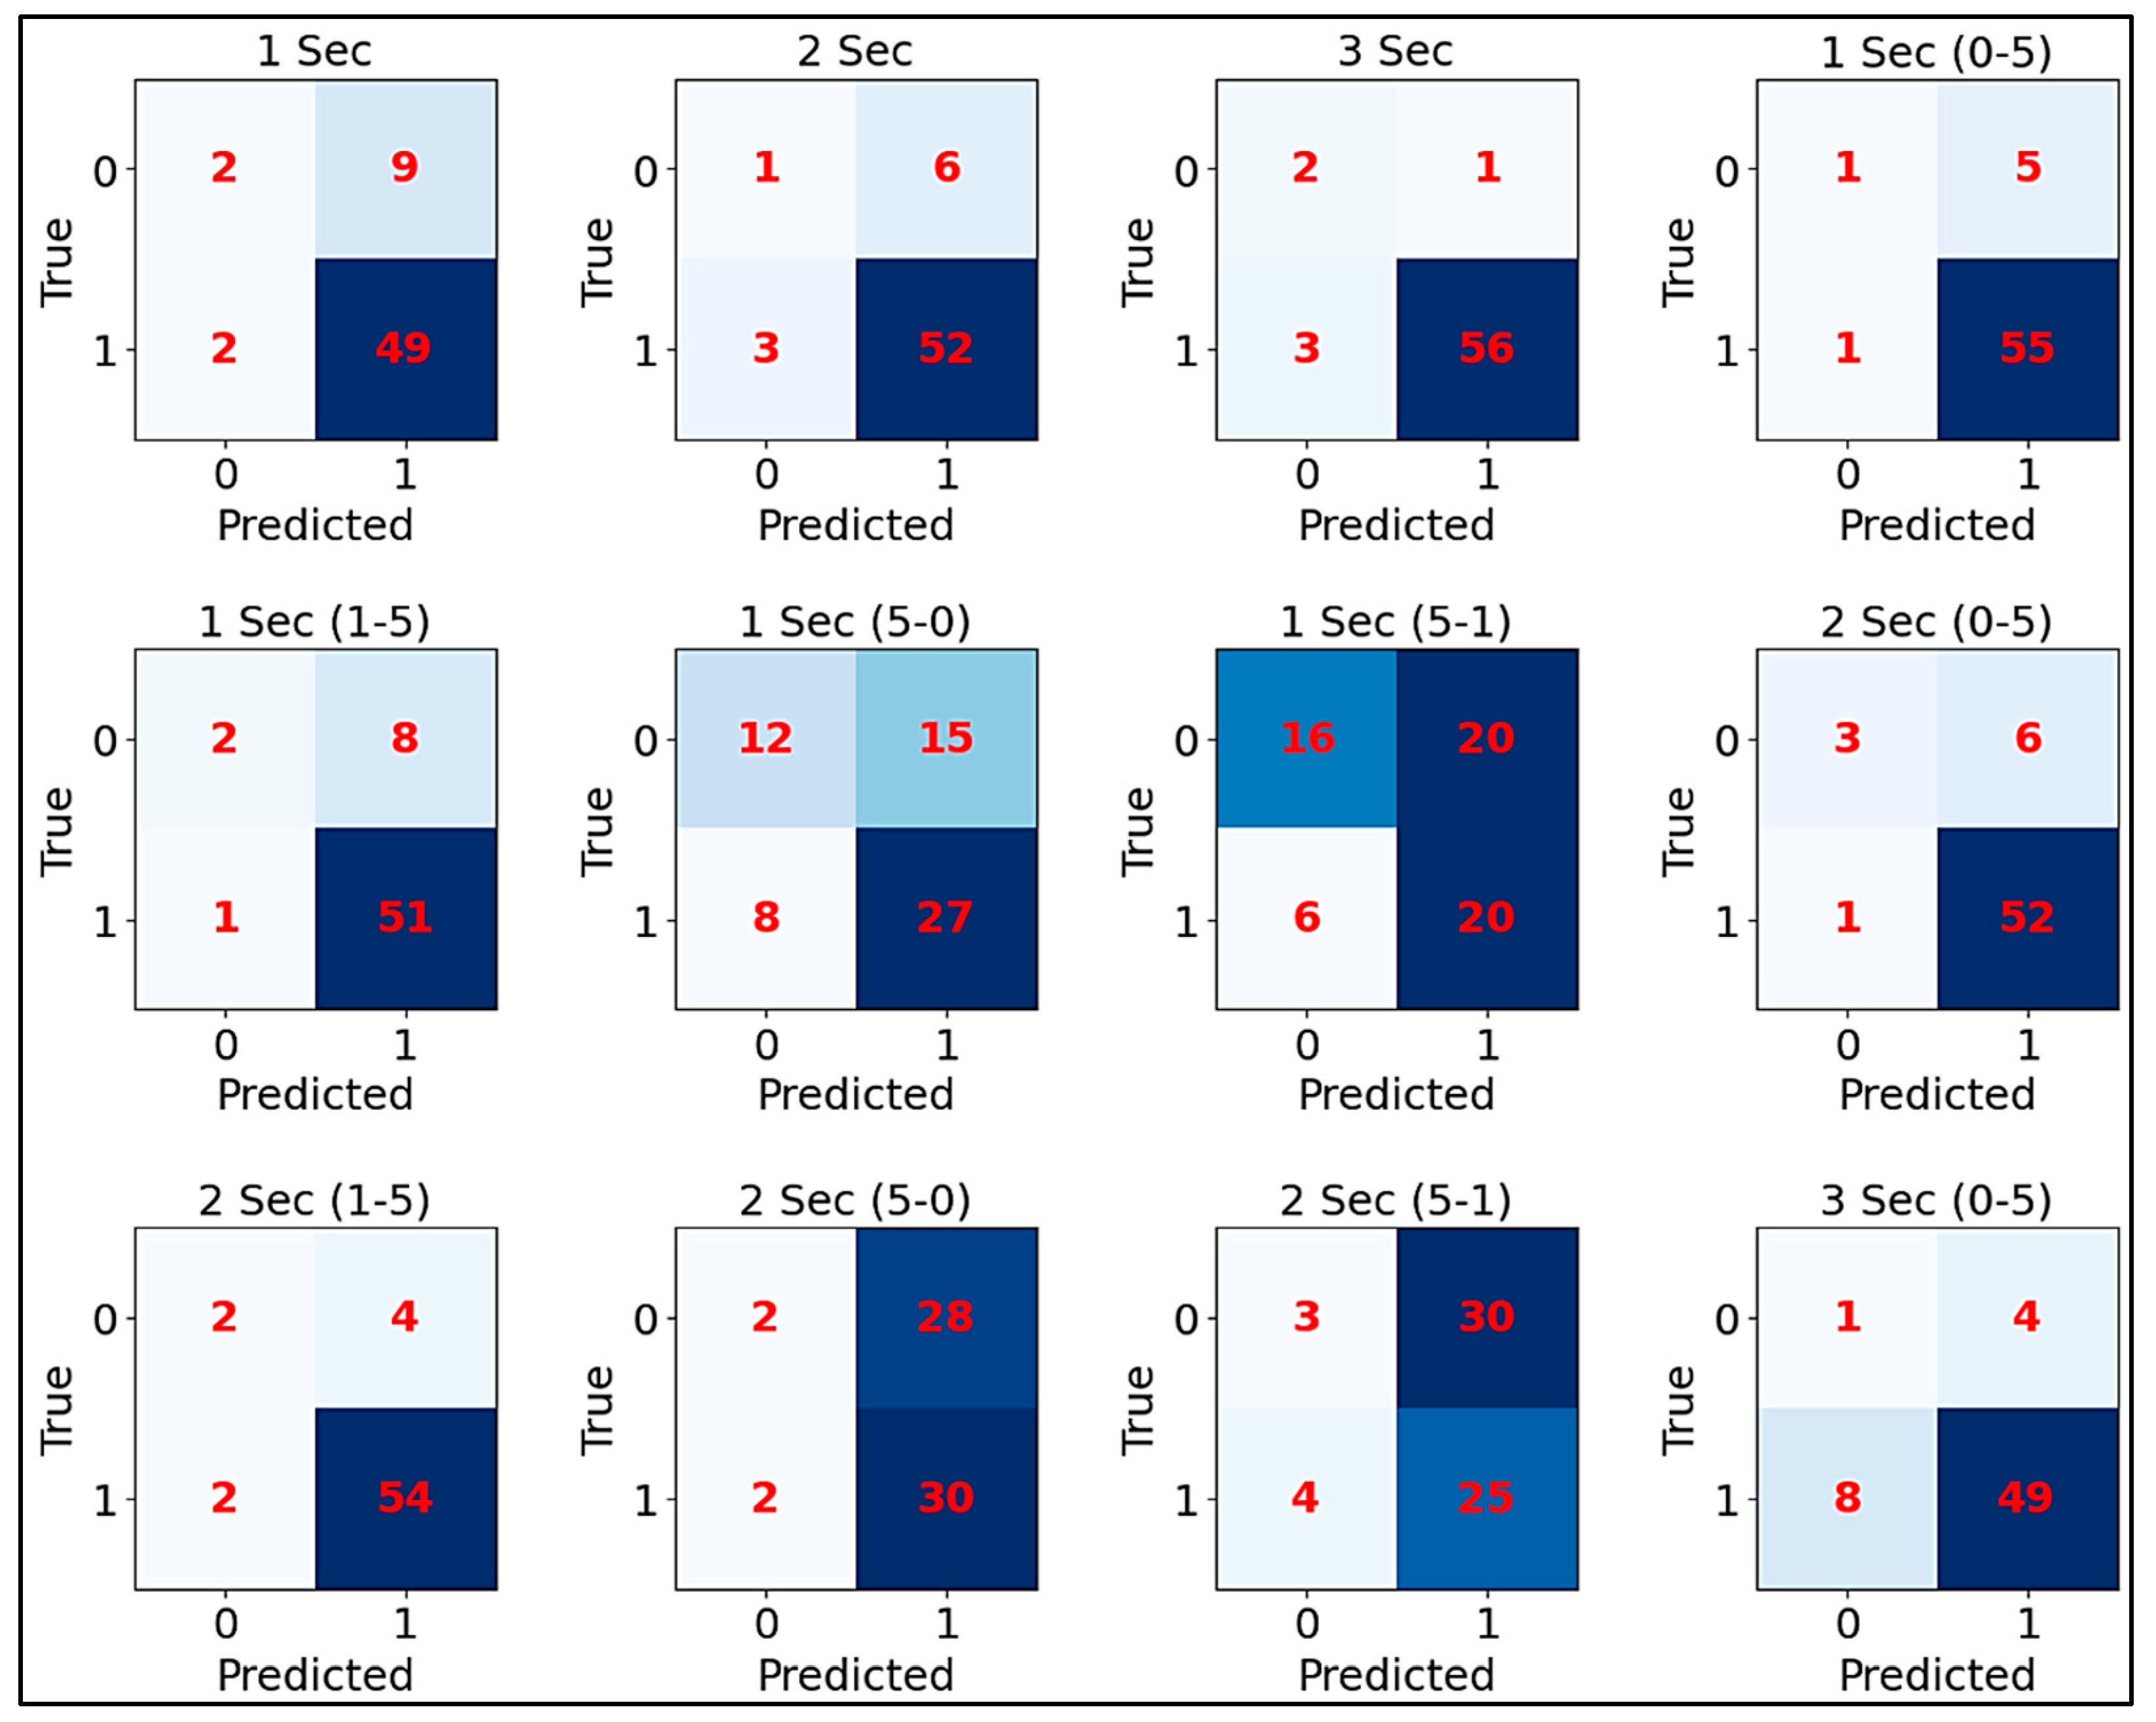
The confusion matrices for the logistic regression model across various scenarios provide insights into its performance (Figure 4). For the 1 s decision time scenarios, the model shows a consistent pattern of correctly identifying utilitarian decisions but struggling with non-utilitarian ones. In the aggregated 1 Sec scenario, the model correctly classified 49 utilitarian decisions and 2 non-utilitarian decisions, but it also had 2 false positives and 9 false negatives. This trend is similar in the 1 Sec (0-5) scenario, where the model correctly identified 55 utilitarian decisions but had 5 false negatives. The 1 Sec (1-5) and 1 Sec (5-1) scenarios followed this pattern, with high true positive rates but noticeable false negatives, especially in the 1 Sec (5-0) scenario, where there were 15 false negatives and 8 false positives, indicating difficulties in scenarios with more pedestrians in the left lane. For the 2 s decision time scenarios, the model’s performance improves. In the aggregated 2 Sec scenario, it correctly predicted 52 utilitarian decisions and 3 non-utilitarian decisions, with fewer false positives (3) and false negatives (6) compared to the 1 s scenarios. This improvement is consistent in the 2 Sec (0-5) scenario, with 52 true positives and only 1 false positive, suggesting that the additional decision time enhances the model’s accuracy. The 2 Sec (1-5) and 2 Sec (5-1) scenarios show similar trends with high true positives (54 and 30, respectively) and moderate false negatives. However, the 2 Sec (5-0) scenario remains challenging, with a significant number of false positives (28), highlighting difficulties in complex decision-making environments. In the 3 s decision time scenarios, the model achieves its best performance. It correctly identified 56 utilitarian decisions with only 1 false positive. The 3 Sec (0-5) scenario shows similar success with 49 true positives and 4 false positives, confirming the model’s efficacy with extended decision times. Overall, the confusion matrix analysis reveals that the logistic regression model performs better with increased decision time, as evidenced by higher true positive rates and lower false negatives and false positives in the 3 s scenarios. However, it consistently struggles with scenarios involving pedestrians predominantly in the left lane (5-0), regardless of decision time.
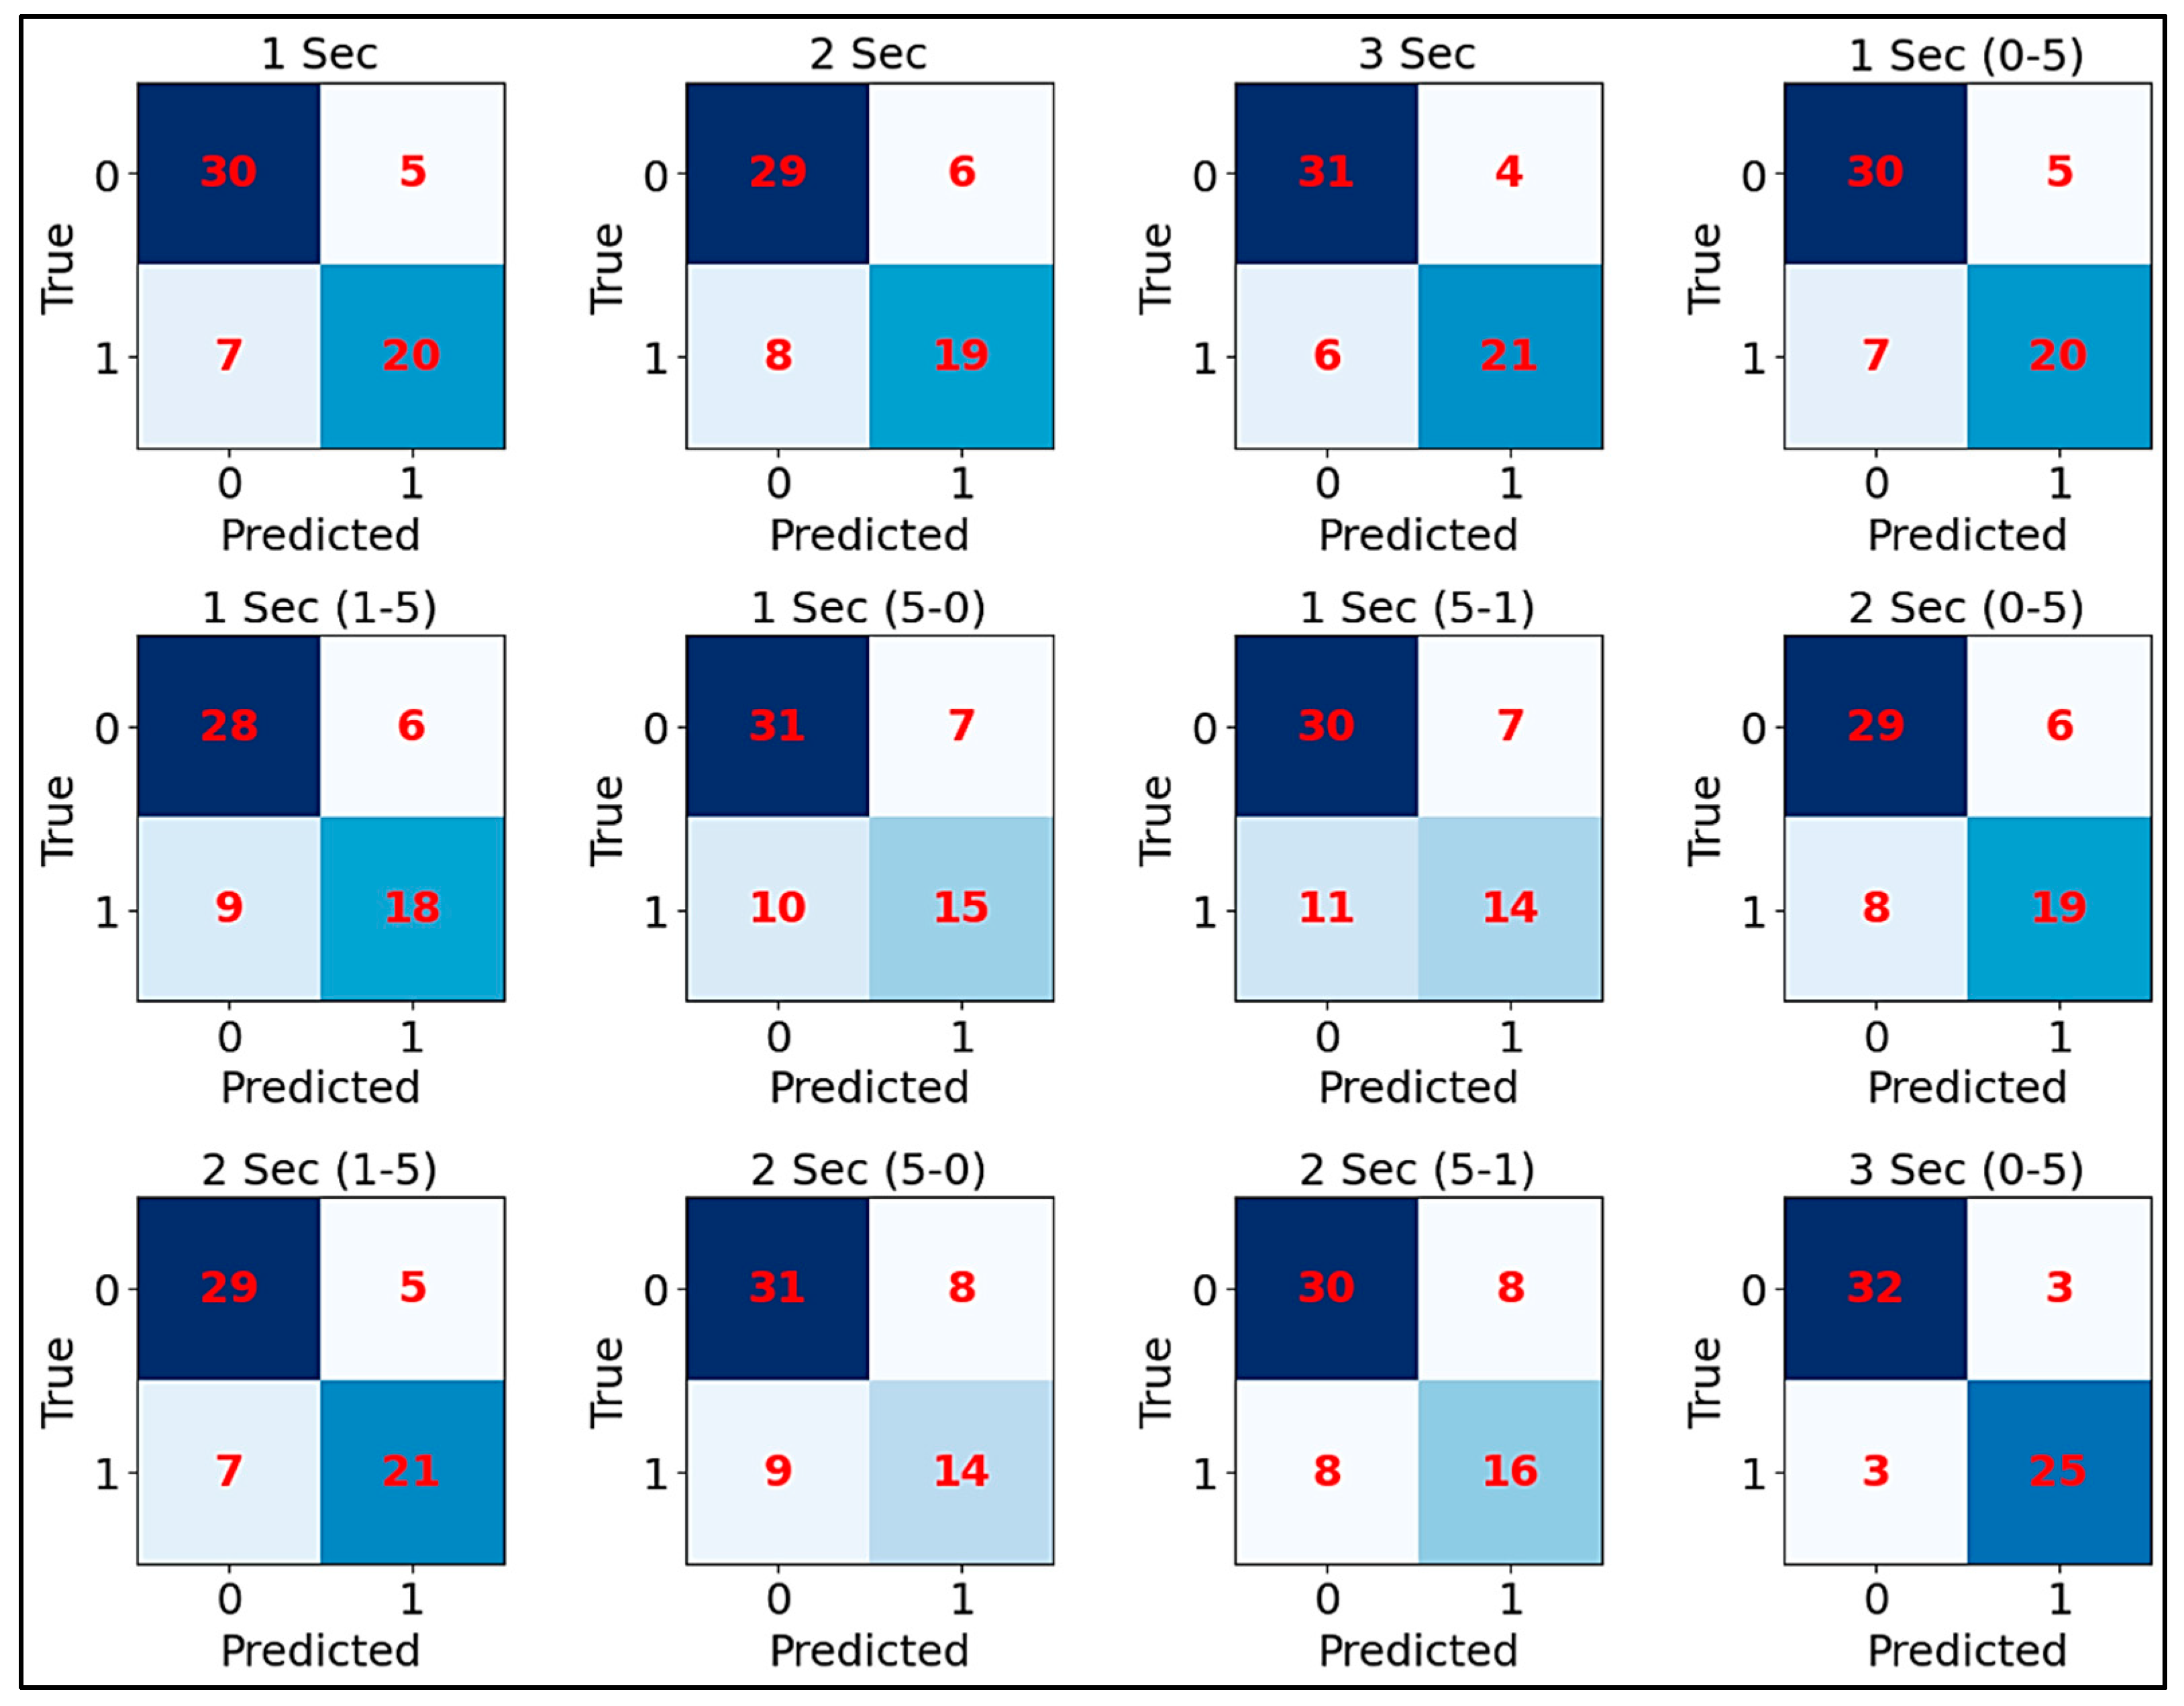
In the 1 s decision time scenarios, AdaBoost shows robust performance with high true positive rates (Figure 5). It correctly classified 20 utilitarian decisions and 30 non-utilitarian decisions, with only 5 false positives and 7 false negatives. This strong performance is consistent in scenarios such as 1 Sec (0-5) and 1 Sec (1-5), where the model correctly identified 30 and 28 non-utilitarian decisions, respectively, while maintaining low false positives (5 and 6) and false negatives (7 and 9). Even in the more challenging 1 Sec (5-0) and 1 Sec (5-1) scenarios, the model performed well, correctly predicting 31 non-utilitarian decisions with moderate false negatives (10 and 11) and a few false positives (7). In the 2 s decision time scenarios, this model continued to demonstrate strong performance. In the generic 2 Sec scenario, it correctly classified 19 utilitarian decisions and 29 non-utilitarian decisions, with only 6 false positives and 8 false negatives. This reliable performance is mirrored in the 2 Sec (0-5) scenario, where the model achieved 19 true positives and 29 true negatives, maintaining low error rates. The 2 Sec (1-5) and 2 Sec (5-0) scenarios also showed high true positive rates (21 and 14) with moderate false negatives (7 and 9) and low false positives (5 and 8), indicating the model’s consistent reliability across varied decision-making conditions. For the 3 s decision time scenarios, AdaBoost achieved its highest performance. In the aggregated 3 Sec scenario, the model correctly classified 21 utilitarian decisions and 31 non-utilitarian decisions, with only 4 false positives and 6 false negatives. This exemplary performance is consistent in the 3 Sec (0-5) scenario, with 25 true positives and 32 true negatives, and minimal false positives (3) and false negatives (3). The model maintained high accuracy even in the challenging 3 Sec (5-0) and 3 Sec (5-1) scenarios, with high true positives (25 and 16) and low error rates, indicating its robust predictive capability under extended decision times. Overall, the confusion matrix analysis confirms AdaBoost’s superiority in handling various driving scenarios with high accuracy and low error rates. It shows the ability to consistently predict utilitarian and non-utilitarian decisions with high true positive rates and low false positives and negatives across different decision times.

3.5. Learning Curve Analysis

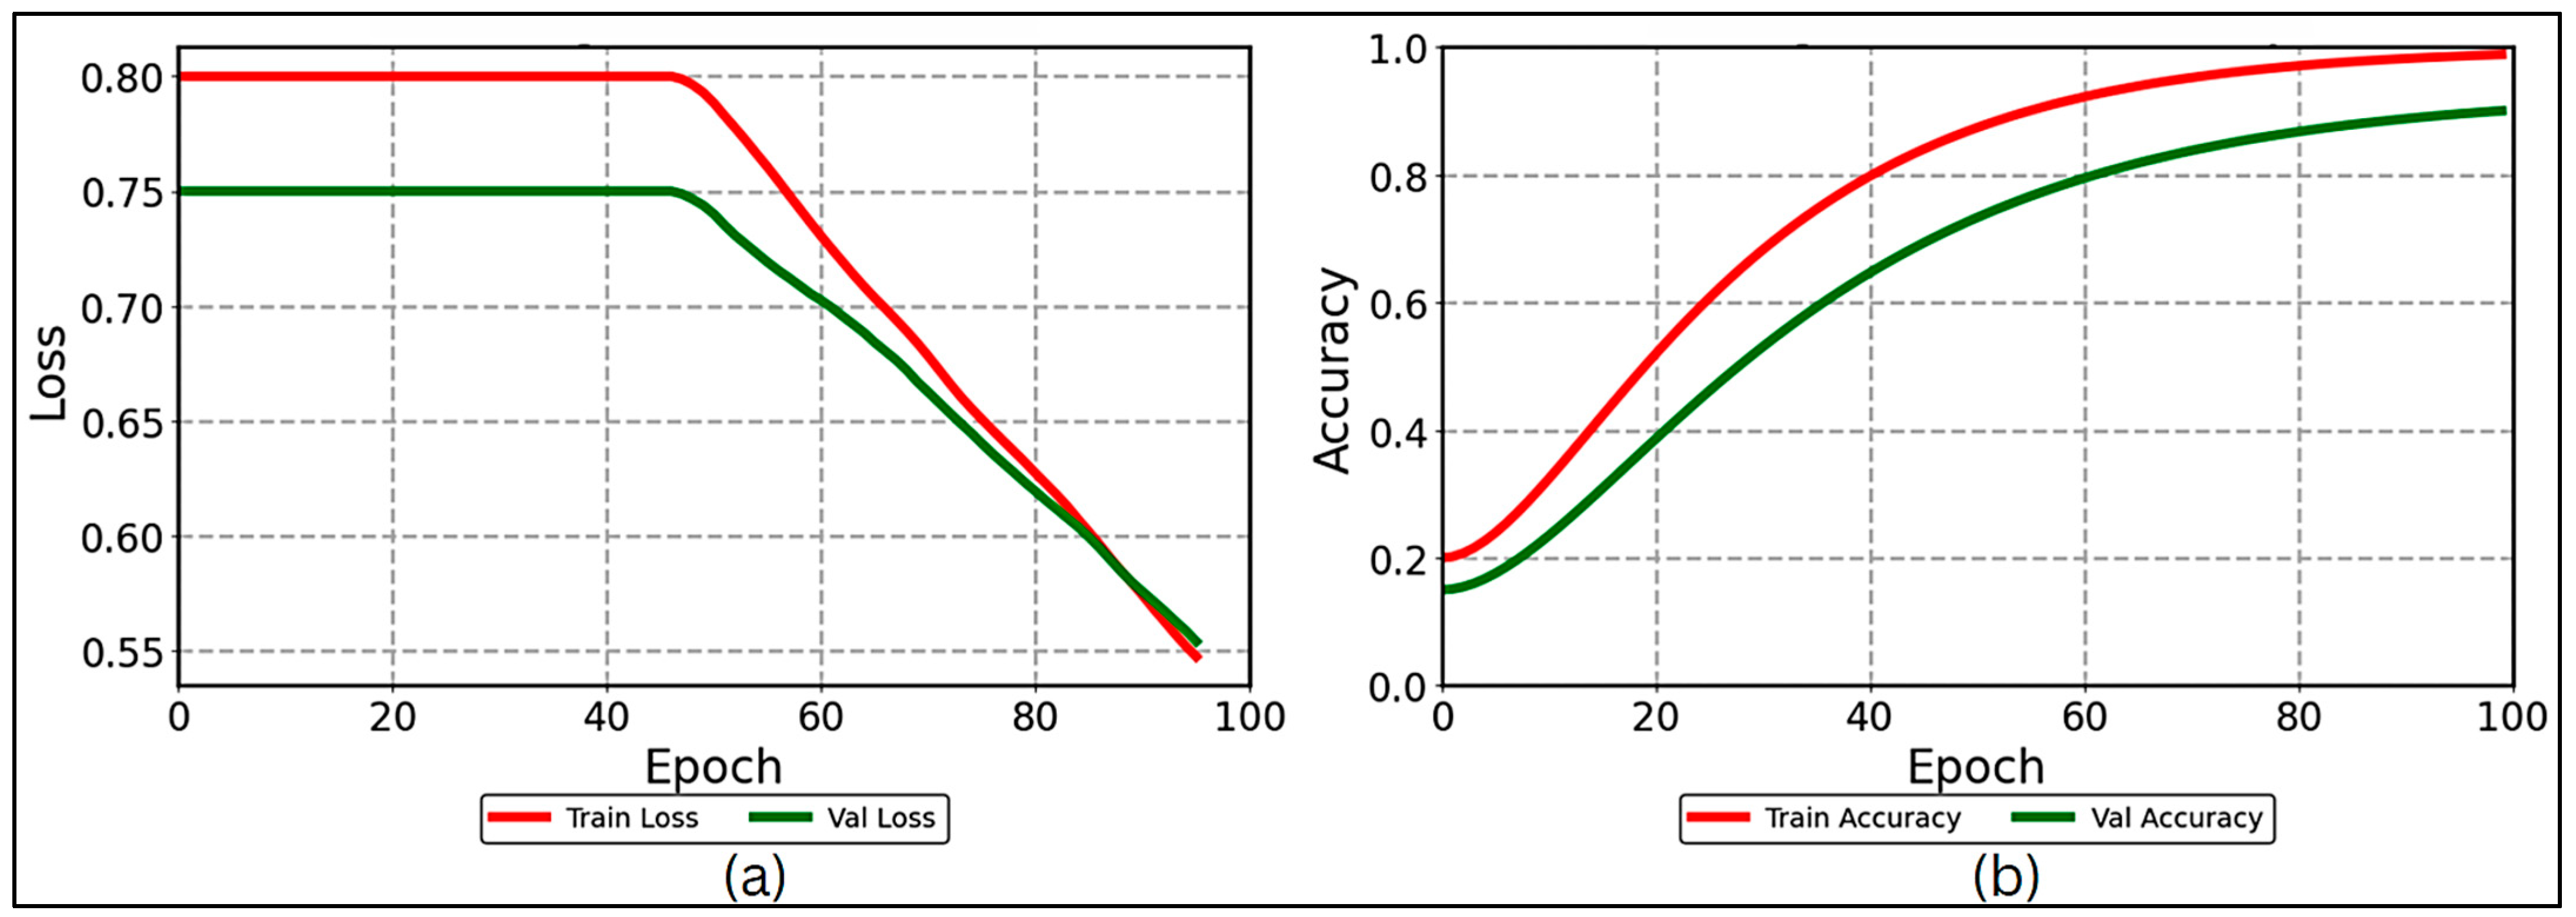
As the AdaBoost model demonstrated best performance compared to the logistic regression model, we present its learning curve analysis to further evaluate its effectiveness. Figure 6a illustrates the loss versus epoch for both training and validation datasets over 100 epochs. Initially, both the training loss (red line) and validation loss (green line) start at higher values, approximately 0.80 and 0.75, respectively. This indicates the initial high error rates in the model’s predictions. As training progresses, a noticeable reduction in loss is observed for both training and validation datasets. Around the 40th epoch, the training loss begins to decrease more rapidly, indicating that the model is learning and improving its predictions on the training data. Between epochs 40 and 60, both the training and validation losses continue to decline steadily. This consistent reduction in both losses suggests that the model is not overfitting and is generalizing well to the validation data. By the 80th epoch, the training loss and validation loss converge closely, reaching approximately 0.55.
The convergence of these curves at lower loss values indicates that the AdaBoost model has achieved a good fit on the training data while maintaining its performance on unseen validation data. The parallel reduction in both losses confirms the model’s robustness and reliability in learning patterns from the data without significant overfitting. Further, the Figure 6b illustrates the training and validation accuracy of the AdaBoost model over 100 epochs, with the training accuracy. Initially, both the training accuracy and validation accuracy start at lower values, approximately 0.2. This indicates that the model’s initial performance is relatively poor on both the training and validation datasets. As the training progresses, the training accuracy begins to increase significantly, indicating that the model is effectively learning from the training data. By the 100th epoch, the training accuracy approaches a value close to 1.0, demonstrating that the model has fit the training data very well. On the other hand, the validation accuracy also shows a steady increase over time but at a slower rate compared to the training accuracy. By the end of the 100 epochs, the validation accuracy reaches a value approximately 0.86. The observed gap between the training and validation accuracy towards the later epochs suggests a potential overfitting issue. While the model performs better on the training data compared to the validation data, this discrepancy may indicate that it has learned specific patterns in the training set that do not generalize well to new data. This issue could be attributed to several factors inherent in the complexity of ethical decision-making studies, particularly in the context of autonomous vehicle scenarios. These factors include the cognitive load imposed by rapid moral judgments in complex scenarios, the influence of varying time pressures on decision strategies, and the potential for order effects in repeated ethical dilemmas. Additionally, the limited size of our dataset may not fully capture the full spectrum of moral choices in driving situations, contributing to the observed gap. For future studies, researchers should consider expanding the dataset to include a wider range of scenarios and participant demographics, capturing more diverse moral decision-making patterns. Implementing different regularization techniques in boosting models could help reduce overfitting and improve generalization. Developing features that more effectively represent the cognitive aspects of ethical decision making may also enhance the model’s performance.
The validity of our simulated scenarios is supported by prior research that validated the underlying simulation environment using a full-scale driving simulator [21]. This validation process ensures that our simulated scenarios closely approximate real-world driving conditions, enhancing the ecological validity of our findings. Future research could further validate the real-world applicability of our models by comparing their predictions against decisions made in a full-scale physical driving simulator.

4. Summary and Conclusions

This comprehensive evaluation of logistic regression and AdaBoost models reveals AdaBoost’s superior performance in ethical decision making for AVs. The analysis, based on metrics like accuracy, precision, recall, F1-score, AUC-ROC, and confusion matrices, demonstrated that AdaBoost consistently outperformed logistic regression. AdaBoost achieved high accuracy, often exceeding 90%, across various driving scenarios with different time constraints, showcasing its robustness in handling complex and time-sensitive decisions. In scenarios requiring rapid decisions, such as those with 1 s and 2 s time limits, AdaBoost maintained high accuracy, precision, and recall. This performance is critical for real-world AV applications, where quick and reliable decision making is essential for safety. The model’s ability to maintain high true positive rates and low false positive rates in these scenarios underscores its potential effectiveness in real-world deployments. The learning curve analysis further validated AdaBoost’s effectiveness, showing a balanced reduction in training and validation losses that converge at lower values. This indicates the model’s ability to generalize well without overfitting, which is crucial for reliable performance in diverse and unpredictable driving environments. The high AUC-ROC values across different scenarios highlight AdaBoost’s strong discriminatory power in distinguishing between utilitarian and non-utilitarian decisions, a key aspect of ethical decision making in AVs. These findings suggest that AdaBoost can significantly enhance the decision-making capabilities of AVs, making them safer and more reliable. The model’s ability to consistently identify true positives and minimize false negatives aligns with the ethical frameworks required for AV deployment, ensuring decisions that prioritize human safety. The study’s insights can inform policymakers and regulatory bodies in developing stringent guidelines for AV ethical decision making, ensuring these systems meet high safety standards before deployment. While AdaBoost demonstrated promising results, there is potential for further improvements. Future research could explore integrating additional features, such as environmental conditions and pedestrian behavior, to improve context-awareness in decision making. Developing hybrid models that combine the strengths of various machine learning techniques could also lead to more sophisticated and accurate ethical decision-making systems. In conclusion, the AdaBoost model’s superior performance in predicting utilitarian behavior underscores its potential to advance the ethical decision-making capabilities of AVs significantly. Integrating such robust machine learning models can help AVs achieve higher safety standards and ethical alignment, essential for their responsible and widespread adoption.

Author Contributions

Conceptualization, A.S. and S.S.; methodology, A.S.; software, Y.M.; validation, Y.M.; formal analysis, A.S. and Y.M.; investigation, A.S.; resources, S.S. and A.S.; data curation, A.S. and S.P.; writing—original draft preparation, A.S.; writing—review and editing, S.S. and A.S.; visualization, S.P.; supervision, S.S.; project administration, A.S. and S.S.; funding acquisition, S.S. All authors have read and agreed to the published version of the manuscript.

Funding

This research was funded by Natural Sciences and Engineering Research Council, grant number RGPIN 2019-05304 to Siby Samuel.

Institutional Review Board Statement

The study was conducted in accordance with the Declaration of Helsinki, and approved by the Institutional Review Board (or Ethics Committee) of University of Waterloo (ORE#44255).

Informed Consent Statement

Informed consent was obtained from all subjects involved in the study.

Data Availability Statement

Data can be made available upon request.

Conflicts of Interest

The authors declare no conflicts of interest.

References

  1. Schwartz, M.S. Ethical Decision-Making Theory: An Integrated Approach. J. Bus. Ethics 2016, 139, 755–776. [Google Scholar] [CrossRef]
  2. Himmelreich, J. Never Mind the Trolley: The Ethics of Autonomous Vehicles in Mundane Situations. Ethical Theory Moral Pract. 2018, 21, 669–684. [Google Scholar] [CrossRef]
  3. Foot, P. The Problem of Abortion and the Doctrine of the Double Effect. Oxf. Rev. 1967, 5, 5–15. [Google Scholar]
  4. Thomson, J.J. Killing, Letting Die, and the Trolley Problem. Monist 1976, 59, 204–217. [Google Scholar] [CrossRef]
  5. Bauman, C.W.; McGraw, A.P.; Bartels, D.M.; Warren, C. Revisiting External Validity: Concerns about Trolley Problems and Other Sacrificial Dilemmas in Moral Psychology. Soc. Personal. Psychol. Compass 2014, 8, 536–554. [Google Scholar] [CrossRef]
  6. Atakishiyev, S.; Salameh, M.; Yao, H.; Goebel, R. Explainable Artificial Intelligence for Autonomous Driving: A Comprehensive Overview and Field Guide for Future Research Directions. Available online: https://arxiv.org/abs/2112.11561v5 (accessed on 21 May 2024).
  7. Awad, E.; Dsouza, S.; Kim, R.; Schulz, J.; Henrich, J.; Shariff, A.; Bonnefon, J.F.; Rahwan, I. The Moral Machine Experiment. Nature 2018, 563, 59–64. [Google Scholar] [CrossRef] [PubMed]
  8. Bonnefon, J.-F.; Shariff, A.; Rahwan, I. The Social Dilemma of Autonomous Vehicles. Science 2016, 352, 1573–1576. [Google Scholar] [CrossRef]
  9. Juzdani, M.H.; Morgan, C.H.; Schwebel, D.C.; Tabibi, Z. Children’s Road-Crossing Behavior: Emotional Decision Making and Emotion-Based Temperamental Fear and Anger. J. Pediatr. Psychol. 2020, 45, 1188–1198. [Google Scholar] [CrossRef]
  10. Hauser, M.; Cushman, F.; Young, L.; Jin, R.K.-X.; Mikhail, J. A Dissociation Between Moral Judgments and Justifications. Mind Lang. 2007, 22, 1–21. [Google Scholar] [CrossRef]
  11. Acharya, K.; Berry, G.R. Characteristics, Traits, and Attitudes in Entrepreneurial Decision-Making: Current Research and Future Directions. Int. Entrep. Manag. J. 2023, 19, 1965–2012. [Google Scholar] [CrossRef]
  12. Crossan, M.; Mazutis, D.; Seijts, G. In Search of Virtue: The Role of Virtues, Values and Character Strengths in Ethical Decision Making. J. Bus. Ethics 2013, 113, 567–581. [Google Scholar] [CrossRef]
  13. Pohling, R.; Bzdok, D.; Eigenstetter, M.; Stumpf, S.; Strobel, A. What Is Ethical Competence? The Role of Empathy, Personal Values, and the Five-Factor Model of Personality in Ethical Decision-Making. J. Bus. Ethics 2016, 137, 449–474. [Google Scholar] [CrossRef]
  14. Elster, J. Rationality, Morality, and Collective Action. Ethics 1985, 96, 136–155. [Google Scholar] [CrossRef]
  15. Epstein, R.A. The Utilitarian Foundations of Natural Law. Harv. J. Law Public Policy 1989, 12, 711. [Google Scholar]
  16. Roets, A.; Bostyn, D.H.; De Keersmaecker, J.; Haesevoets, T.; Van Assche, J.; Van Hiel, A. Utilitarianism in Minimal-Group Decision Making Is Less Common than Equality-Based Morality, Mostly Harm-Oriented, and Rarely Impartial. Sci. Rep. 2020, 10, 13373. [Google Scholar] [CrossRef] [PubMed]
  17. Bayer, P.B. Deontological Originalism: Moral Truth, Liberty, and, Constitutional Due Process: Part I—Originalism and Deontology. Thurgood Marshall Law Rev. 2017, 43, 1. [Google Scholar]
  18. de Sio, F.S. Killing by Autonomous Vehicles and the Legal Doctrine of Necessity. Ethical Theory Moral Pract. 2017, 20, 411–429. [Google Scholar] [CrossRef]
  19. Gray, K.; Schein, C. Two Minds vs. Two Philosophies: Mind Perception Defines Morality and Dissolves the Debate between Deontology and Utilitarianism. Rev. Philos. Psychol. 2012, 3, 405–423. [Google Scholar] [CrossRef]
  20. Nasello, J.A.; Triffaux, J.-M. The Role of Empathy in Trolley Problems and Variants: A Systematic Review and Meta-Analysis. Br. J. Soc. Psychol. 2023, 62, 1753–1781. [Google Scholar] [CrossRef]
  21. Samuel, S.; Yahoodik, S.; Yamani, Y.; Valluru, K.; Fisher, D.L. Ethical Decision Making behind the Wheel—A Driving Simulator Study. Transp. Res. Interdiscip. Perspect. 2020, 5, 100147. [Google Scholar] [CrossRef]
  22. Yahoodik, S.; Samuel, S.; Yamani, Y. Ethical Decision Making under Time Pressure: An Online Study. Proc. Hum. Factors Ergon. Soc. Annu. Meet. 2021, 65, 601–605. [Google Scholar] [CrossRef]
  23. Sütfeld, L.R.; Gast, R.; König, P.; Pipa, G. Using Virtual Reality to Assess Ethical Decisions in Road Traffic Scenarios: Applicability of Value-of-Life-Based Models and Influences of Time Pressure. Front. Behav. Neurosci. 2017, 11, 122. [Google Scholar] [CrossRef] [PubMed]
  24. Leben, D. A Rawlsian Algorithm for Autonomous Vehicles. Ethics Inf. Technol. 2017, 19, 107–115. [Google Scholar] [CrossRef]
  25. Mayer, M.M.; Bell, R.; Buchner, A. Self-Protective and Self-Sacrificing Preferences of Pedestrians and Passengers in Moral Dilemmas Involving Autonomous Vehicles. PLoS ONE 2021, 16, e0261673. [Google Scholar] [CrossRef]
  26. Skulmowski, A.; Bunge, A.; Kaspar, K.; Pipa, G. Forced-Choice Decision-Making in Modified Trolley Dilemma Situations: A Virtual Reality and Eye Tracking Study. Front. Behav. Neurosci. 2014, 8, 426. [Google Scholar] [CrossRef] [PubMed]
  27. Keeling, G. Against Leben’s Rawlsian Collision Algorithm for Autonomous Vehicles. In Proceedings of the 3rd Conference on Philosophy and Theory of Artificial Intelligence, Leeds, UK, 4–5 November 2017; Springer: Cham, Switerland, 2017; pp. 259–272. [Google Scholar]
  28. Wiedeman, C.; Wang, G.; Kruger, U. Modeling of Moral Decisions with Deep Learning. Vis. Comput. Ind. Biomed. Art 2020, 3, 27. [Google Scholar] [CrossRef]
  29. Aldred, R.; Johnson, R.; Jackson, C.; Woodcock, J. How does mode of travel affect risks posed to other road users? An analysis of English road fatality data, incorporating gender and road type. Inj. Prev. 2021, 27, 71–76. [Google Scholar] [CrossRef]
  30. Li, J.; Yin, G.; Wang, X.; Yan, W. Automated Decision Making in Highway Pavement Preventive Maintenance Based on Deep Learning. Autom. Constr. 2022, 135, 104111. [Google Scholar] [CrossRef]
  31. Shipe, M.E.; Deppen, S.A.; Farjah, F.; Grogan, E.L. Developing Prediction Models for Clinical Use Using Logistic Regression: An Overview. J. Thorac. Dis. 2019, 11, S574–S584. [Google Scholar] [CrossRef]
  32. Sahin, E.K. Comparative Analysis of Gradient Boosting Algorithms for Landslide Susceptibility Mapping. Geocarto Int. 2022, 37, 2441–2465. [Google Scholar] [CrossRef]
  33. Hancock, J.T.; Khoshgoftaar, T.M. CatBoost for Big Data: An Interdisciplinary Review. J. Big Data 2020, 7, 94. [Google Scholar] [CrossRef] [PubMed]
  34. Singh, A.; Yahoodik, S.; Murzello, Y.; Petkac, S.; Yamani, Y.; Samuel, S. Ethical Decision-Making in Older Drivers during Critical Driving Situations: An Online Experiment. J. Intell. Connect. Veh. 2024, 7, 30–37. [Google Scholar] [CrossRef]
  35. Peng, C.-Y.J.; Lee, K.L.; Ingersoll, G.M. An Introduction to Logistic Regression Analysis and Reporting. J. Educ. Res. 2002, 96, 3–14. [Google Scholar] [CrossRef]
  36. Seni, G.; Elder, J. Ensemble Methods in Data Mining: Improving Accuracy Through Combining Predictions; Morgan & Claypool Publishers: Williston, VT, USA, 2010; ISBN 978-1-60845-285-9. [Google Scholar]
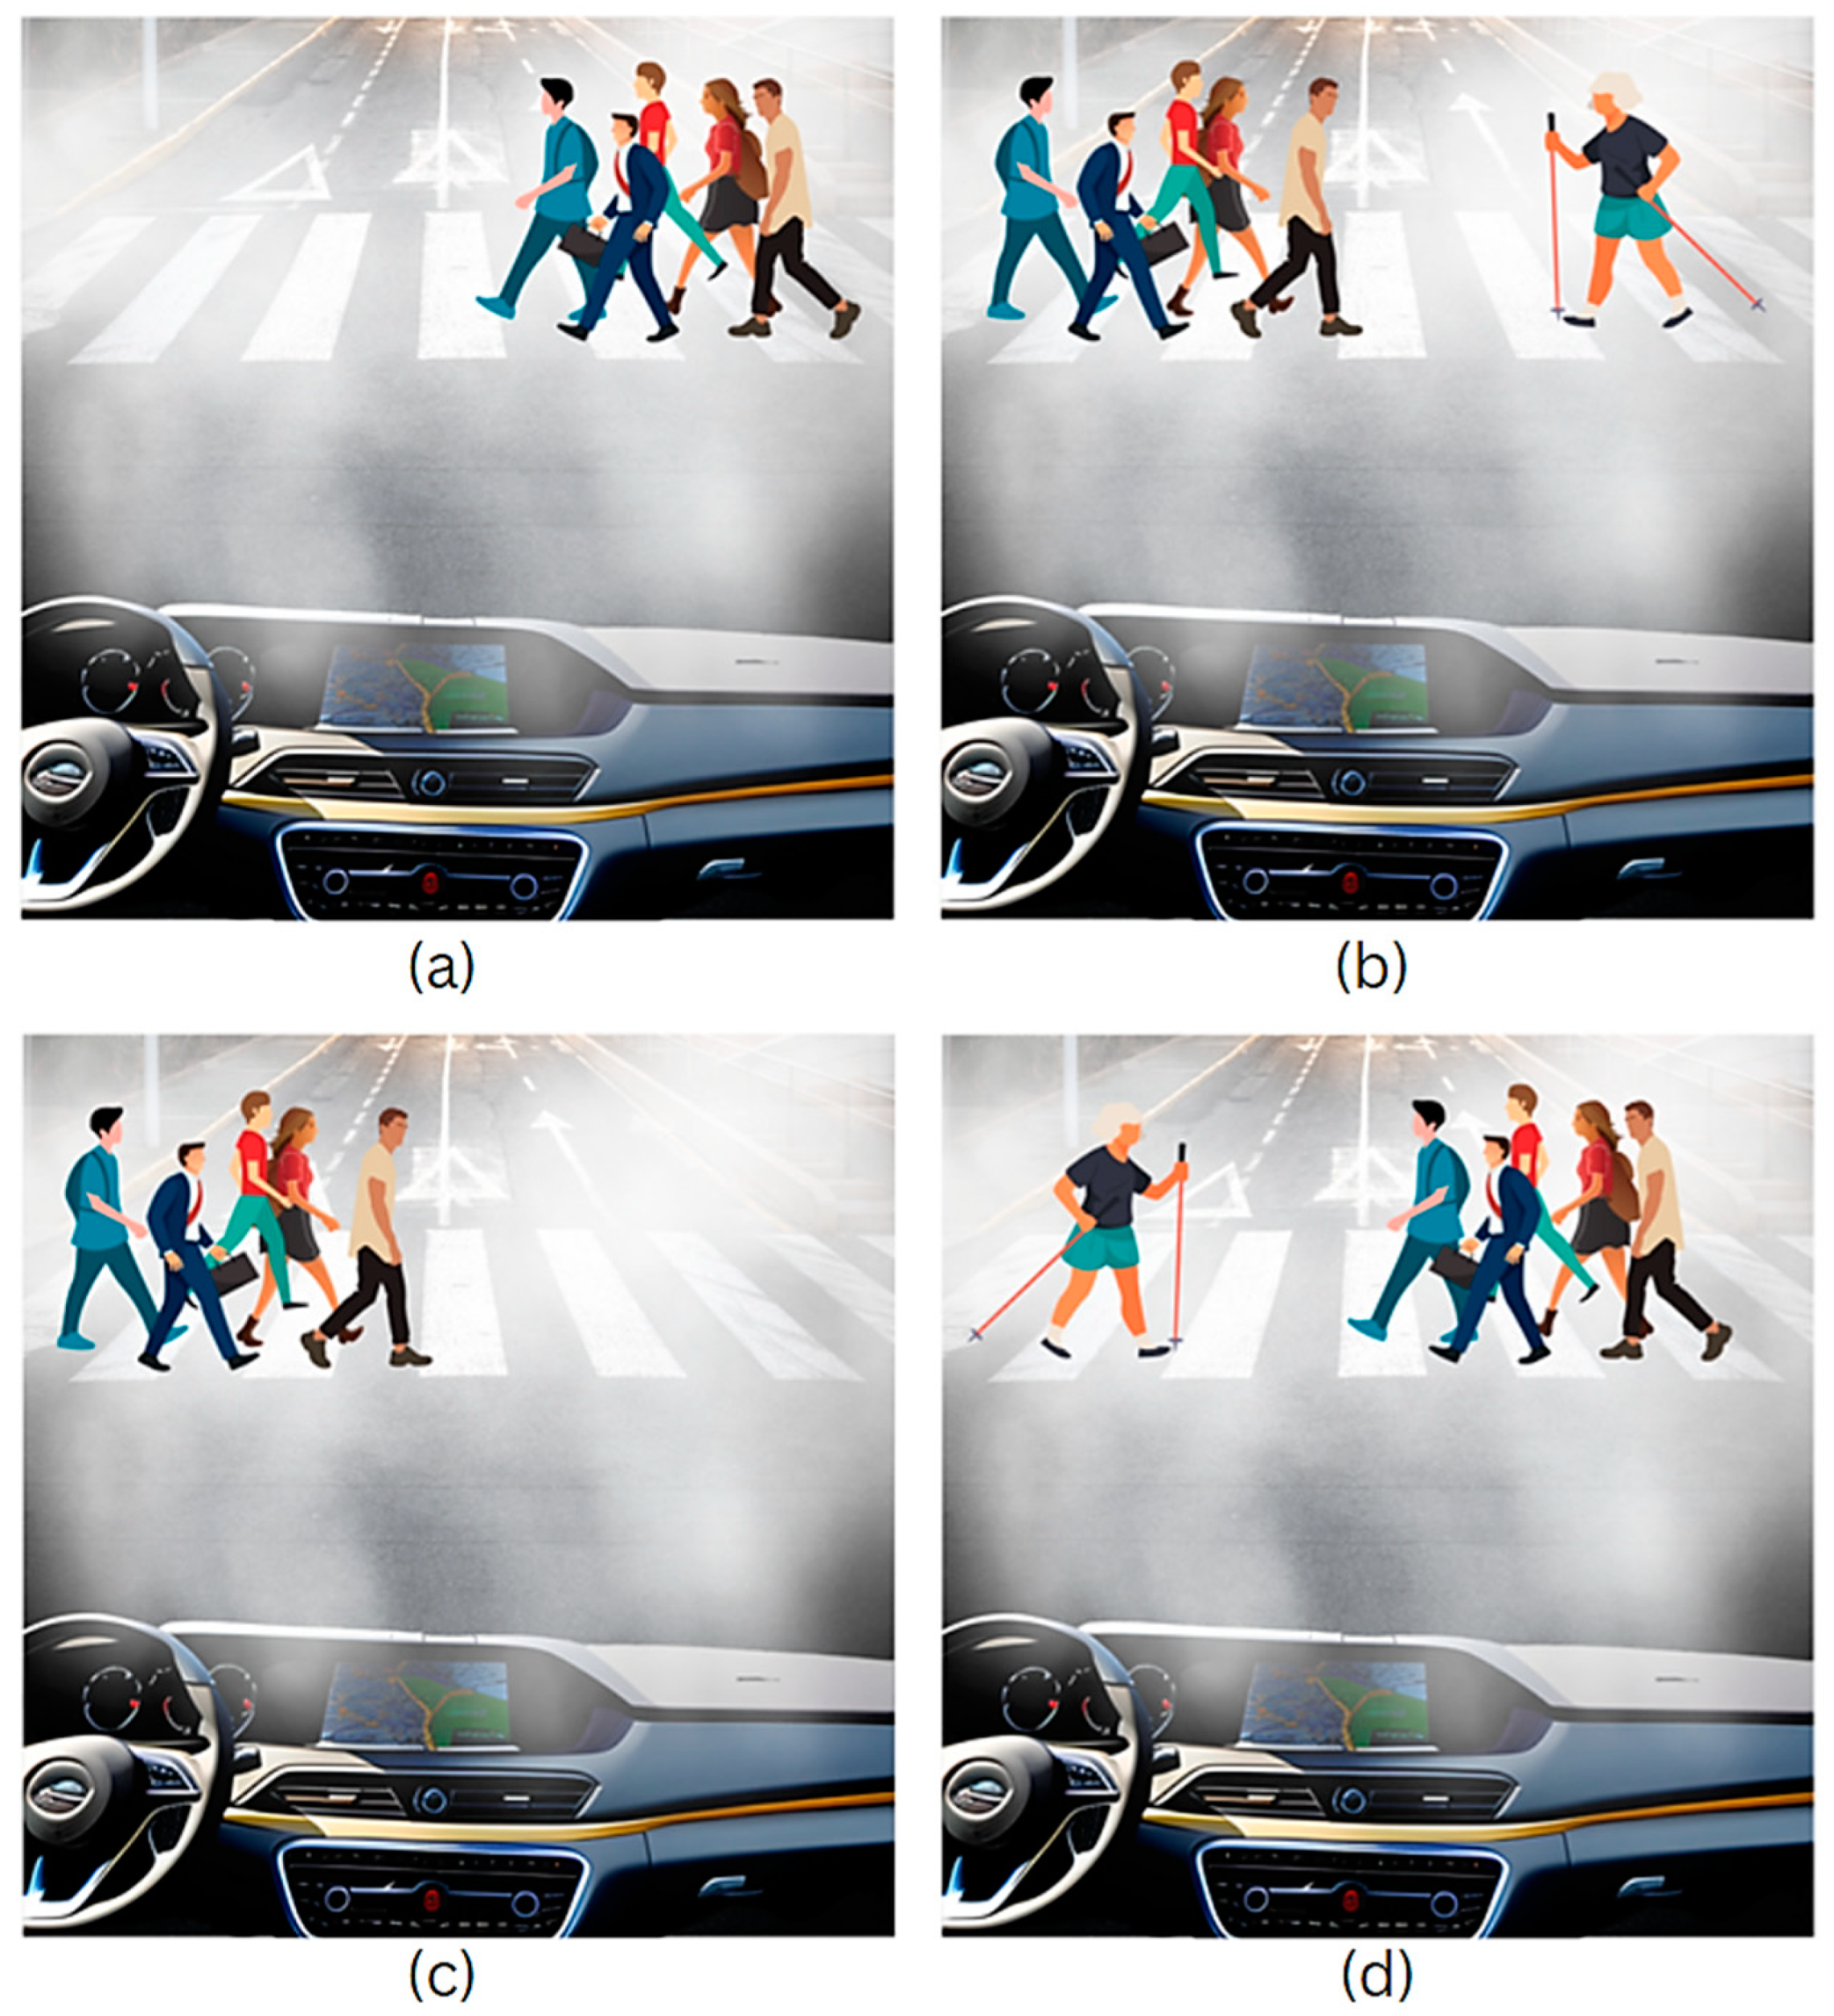
Figure 1. Examples of four different pedestrian configurations used in the simulated driving scenarios: (a) 5 pedestrians in the driving lane, 0 pedestrians in the alternate lane; (b) 1 pedestrian in the driving lane, 5 pedestrians in the alternate lane; (c) 0 pedestrians in the driving lane, 5 pedestrians in the alternate lane; and (d) 5 pedestrians in the driving lane, 1 pedestrian in the alternate lane [34].
Information 15 00562 g001
Figure 2. AUC-ROC curve of the logistic regression model.
Information 15 00562 g002
Figure 3. AUC-ROC curve of the AdaBoost model.
Information 15 00562 g003
Figure 4. Confusion matrix analysis of the logistic regression model.
Information 15 00562 g004
Figure 5. Confusion matrix analysis of the AdaBoost model.
Information 15 00562 g005
Figure 6. Learning curve analysis: (a) loss vs epoch and (b) accuracy vs epoch of AdaBoost Model.
Information 15 00562 g006
Table 1. Performance metrics for logistic regression model.
ModelAccuracyPrecisionRecallF1-ScoreMSE
1 Sec0.850.880.500.460.15
2 Sec0.890.910.500.470.11
3 Sec0.950.980.500.490.05
1 Sec (0-5)0.920.960.500.480.08
1 Sec (1-5)0.840.880.500.450.16
1 Sec (5-0)0.630.620.610.610.37
1 Sec (5-1)0.580.580.530.510.42
2 Sec (0-5)0.840.860.500.460.16
2 Sec (1-5)0.900.930.500.470.10
2 Sec (5-0)0.520.760.500.340.48
2 Sec (5-1)0.470.730.500.320.53
3 Sec (0-5)0.810.790.500.490.05
3 Sec (1-5)0.750.700.500.500.02
3 Sec (5-0)0.560.560.560.560.44
3 Sec (5-1)0.500.750.500.330.50
Table 2. Performance metrics for AdaBoost model.
ModelAccuracyPrecisionRecallF1-ScoreMSE
1 Sec0.950.960.850.900.05
2 Sec0.940.960.840.890.06
3 Sec0.960.980.870.920.04
1 Sec (0-5)0.950.970.860.910.05
1 Sec (1-5)0.930.950.830.880.07
1 Sec (5-0)0.850.820.780.800.15
1 Sec (5-1)0.860.840.790.810.14
2 Sec (0-5)0.940.960.840.890.06
2 Sec (1-5)0.930.950.830.880.07
2 Sec (5-0)0.870.850.800.820.13
2 Sec (5-1)0.880.860.810.830.12
3 Sec (0-5)0.960.980.870.920.04
3 Sec (1-5)0.980.990.880.930.02
3 Sec (5-0)0.820.80.760.780.18
3 Sec (5-1)0.830.810.770.790.17
Disclaimer/Publisher’s Note: The statements, opinions and data contained in all publications are solely those of the individual author(s) and contributor(s) and not of MDPI and/or the editor(s). MDPI and/or the editor(s) disclaim responsibility for any injury to people or property resulting from any ideas, methods, instructions or products referred to in the content.