Location Analytics of Routine Occurrences (LARO) to Identify Locations with Regularly Occurring Events with a Case Study on Traffic Accidents
Abstract
1. Introduction
2. LARO Algorithm
2.1. Identify the Periodicity of Routine Occurrences
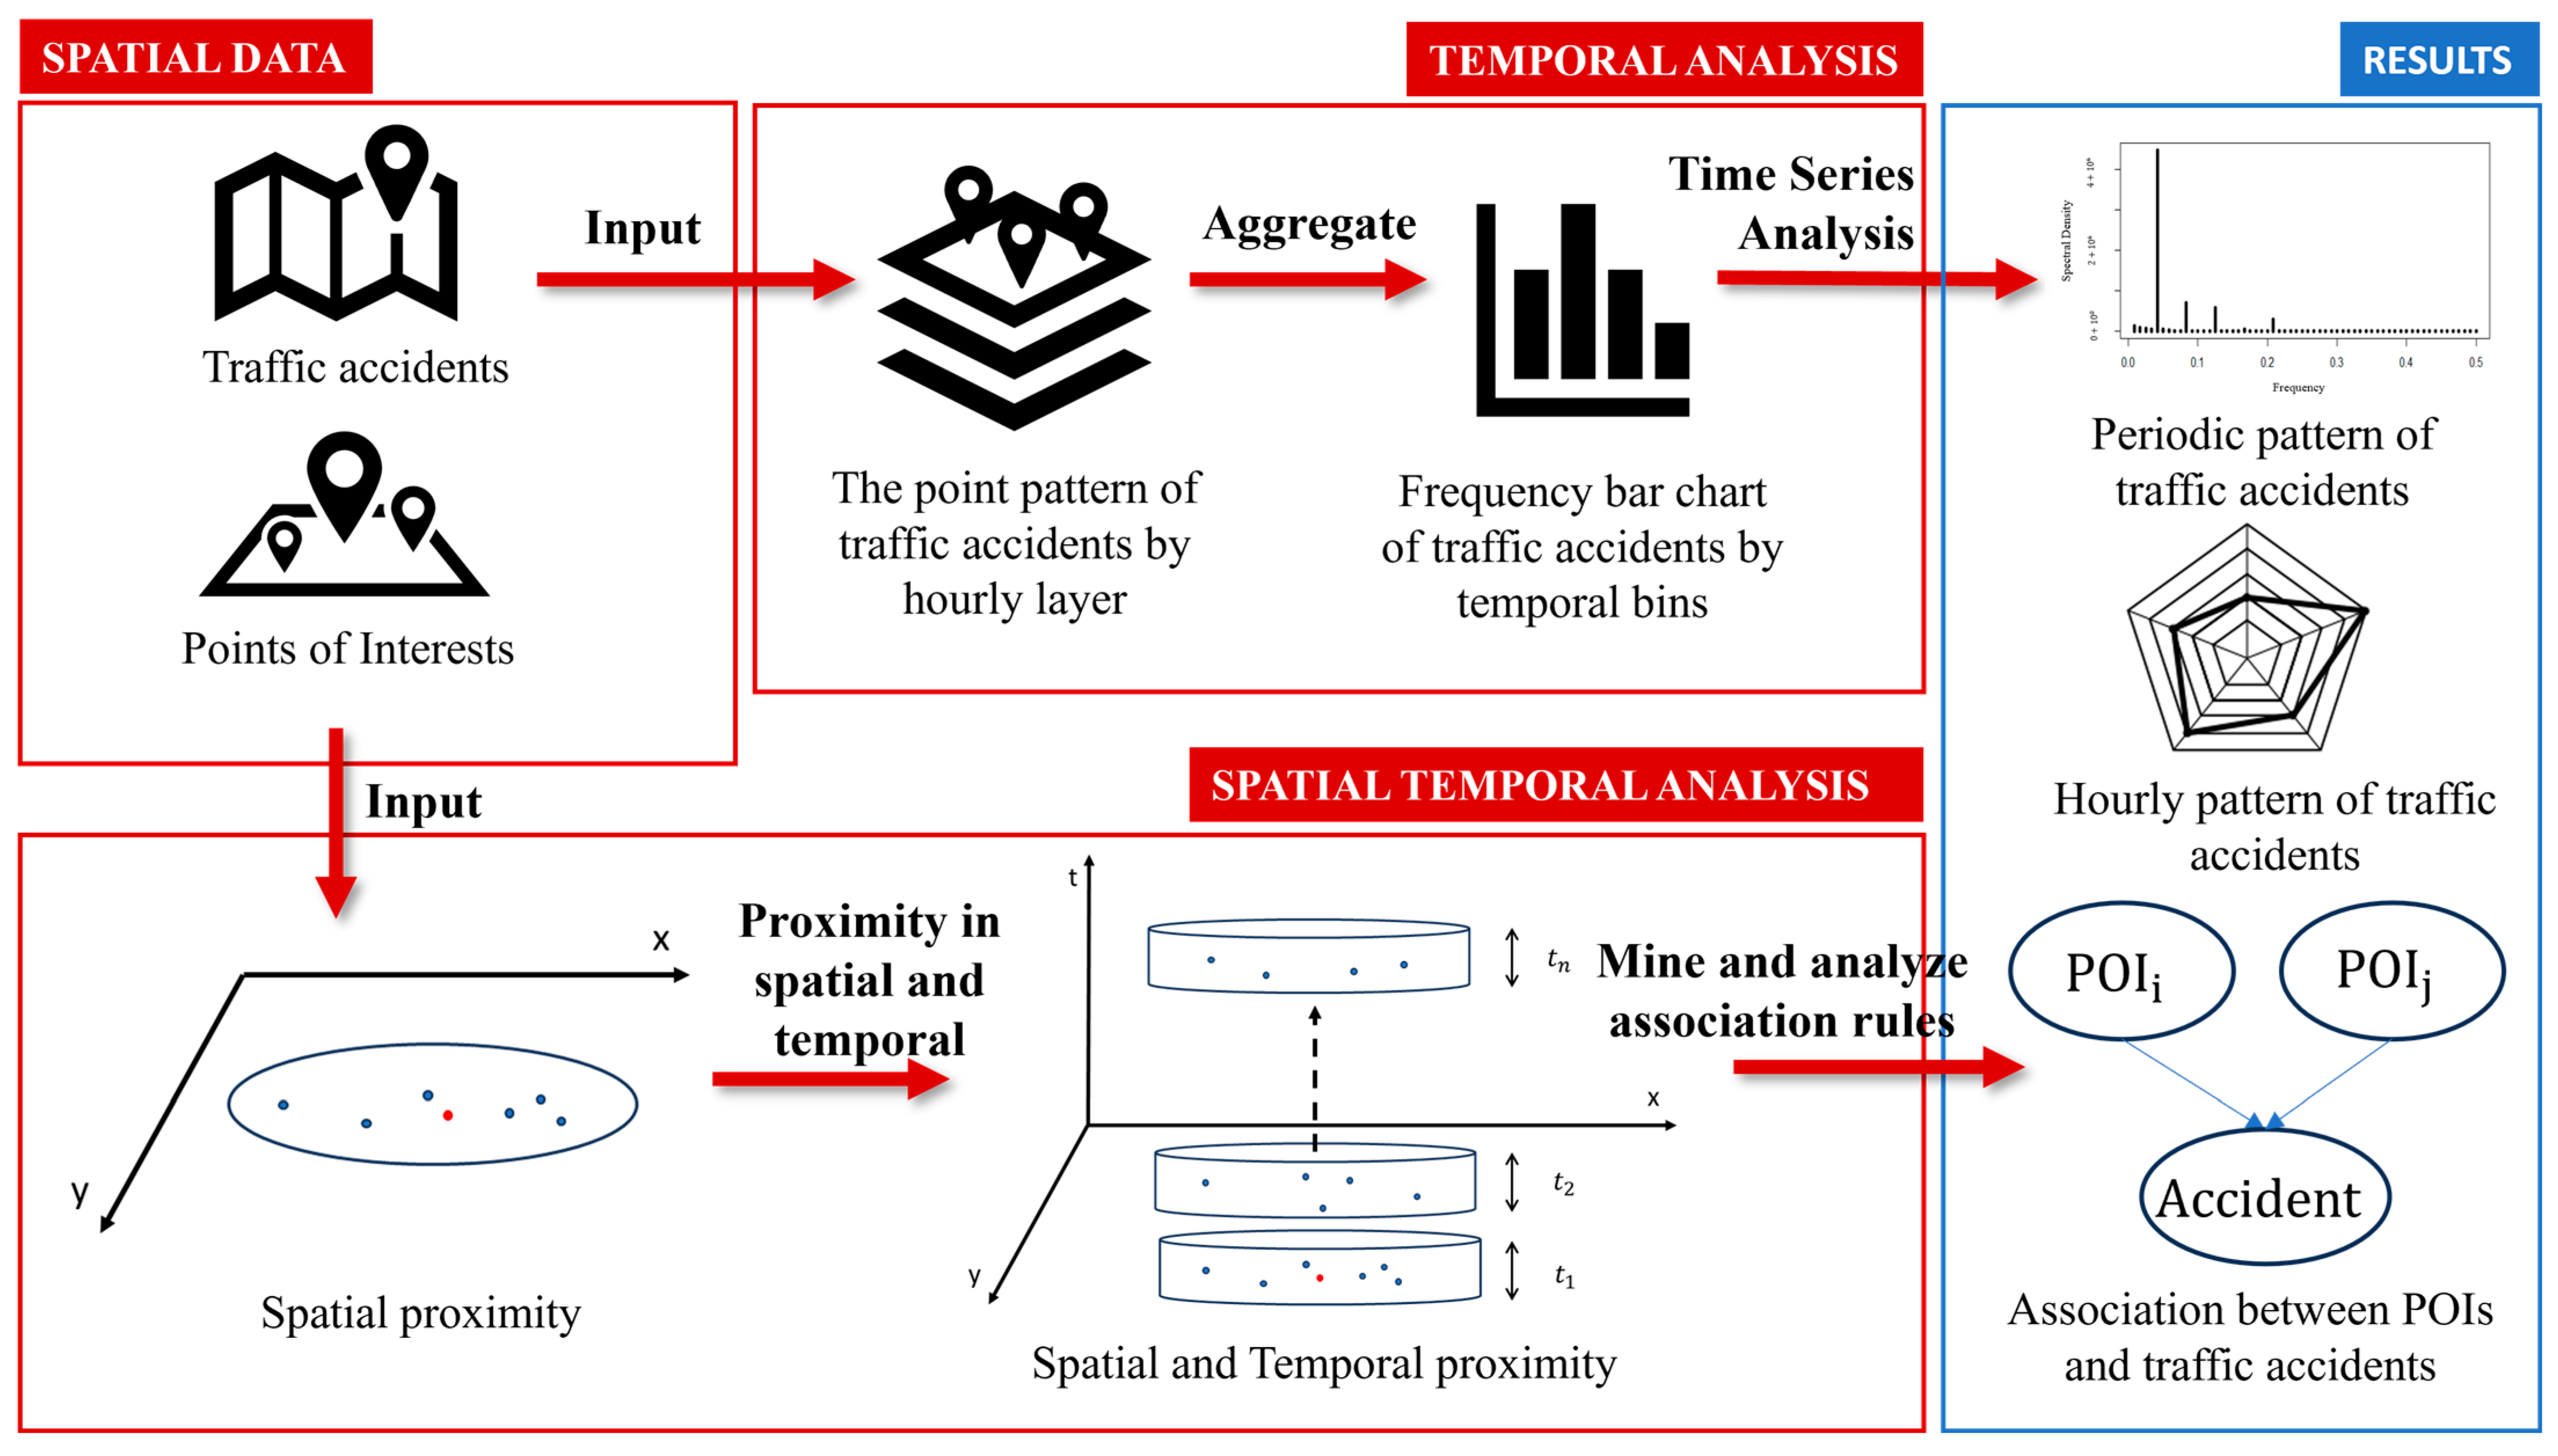
| Algorithm 1. Procedure for temporal analysis of event occurrences. |
| : raw point events Output: Fit the function to the frequency distribution of point events Step 1. Define temporal bins for a given period Step 2. Group point events into corresponding temporal bins for each if happen in group into Step 3. Calculate the frequency of point events in each bin , sum) Step 4. Build a periodogram to identify the dominant period in the time ) ) Step 5. Use cosine and sine waves to model the periodicity ~ Step 6. Use the function to predict the time series and evaluate R2 for the goodness of fit ) |
2.2. Identify Locations of Routine Occurrences
| Algorithm 2. Procedure for Spatial Analysis of Event Occurrences. |
| Step 1. Choose a search radius for ‘spatial proximity of occurrences’ : meaningful search radius for detecting nearby events Step 2. For every event location, identify events within the search radius For each in : Calculate Step 3. Determine the slope for each using Sen’s slope For each : Calculate |
2.3. Spatial Association Mining at Locations of Routine Occurrences
| Algorithm 3. Procedures for spatial association analysis at three locations. |
| Step 1.th category in comparative relation to a whole at regular grid locations For each grid location Append to Step 2 // Repeat step 2 for three locations (RO, SO, GO) = apriori (→ RO, SO, GO. parameter = list (sup = , conf =, target=„rules”)) Step 3. Relate the site features to situation characteristics for explanations |
3. Data and Methodology
3.1. Traffic Accident Data
3.2. Identify Locations of Routine Occurrences
3.2.1. Analyze the POI Distribution at Regular Gridded Locations in the Background
3.2.2. Analyze the Associations of Site Features at Three Location Types
4. Results
4.1. Hourly Temporal Pattern on Weekdays and Weekends
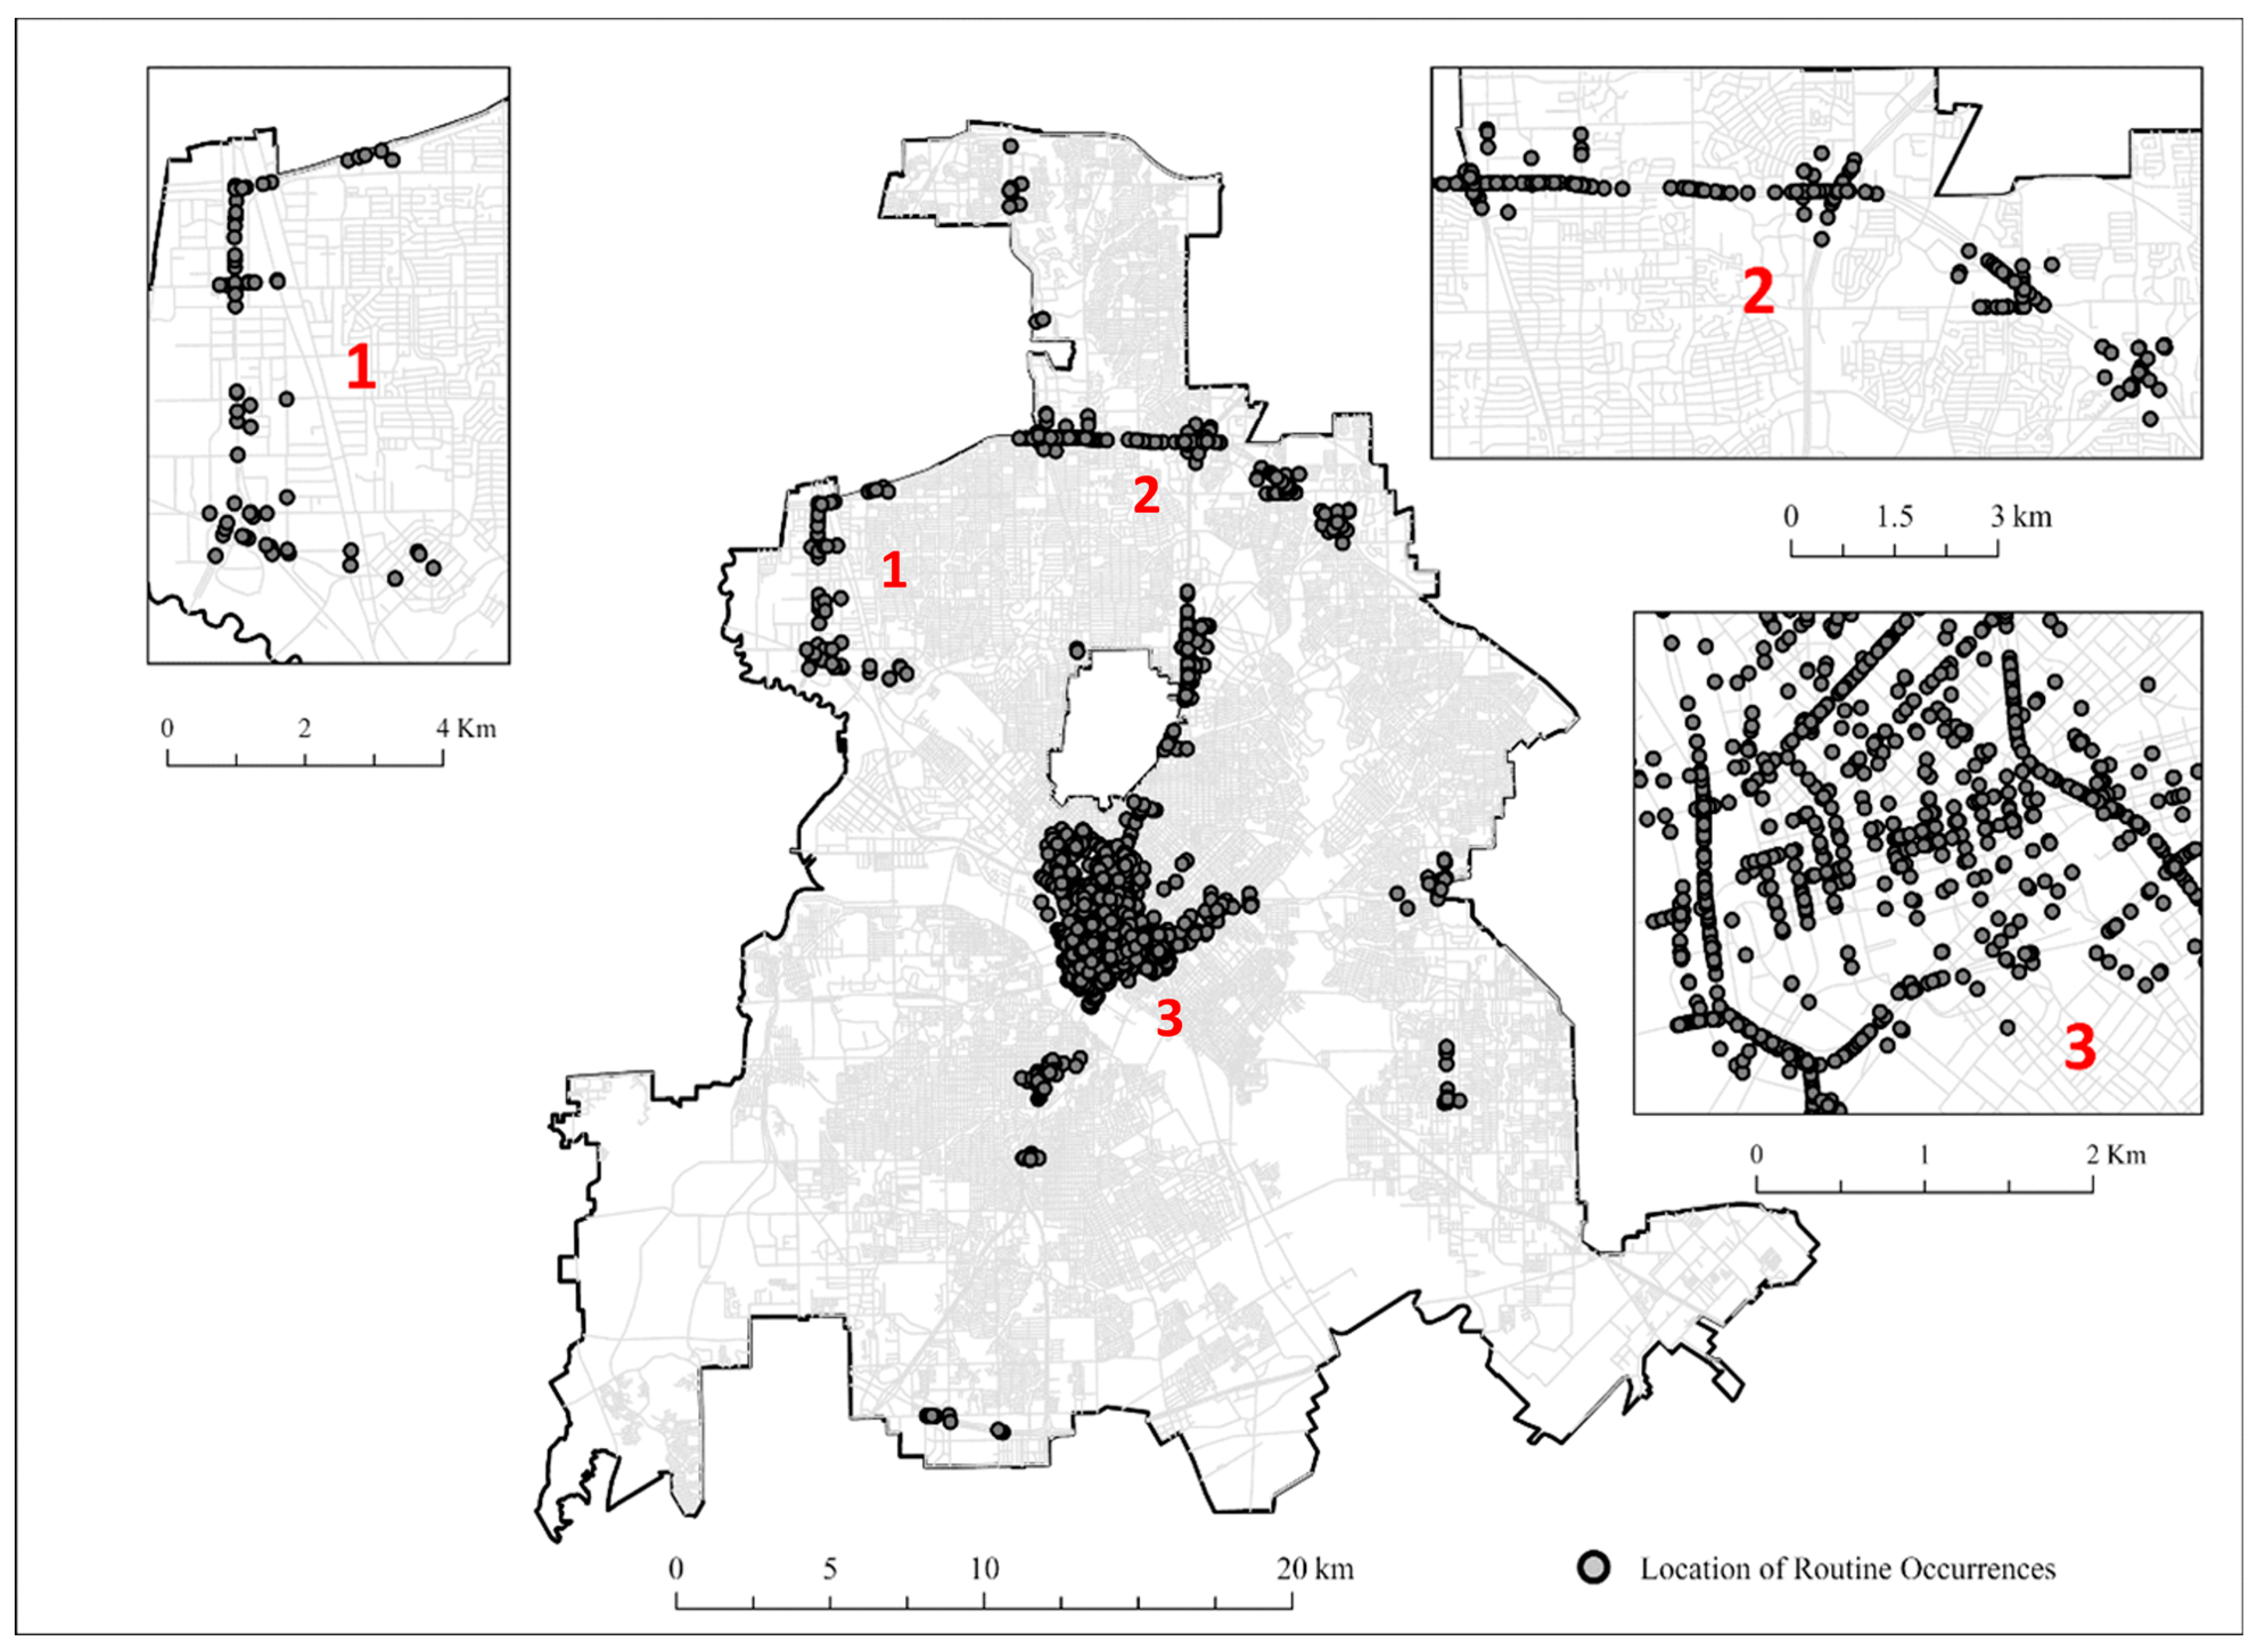
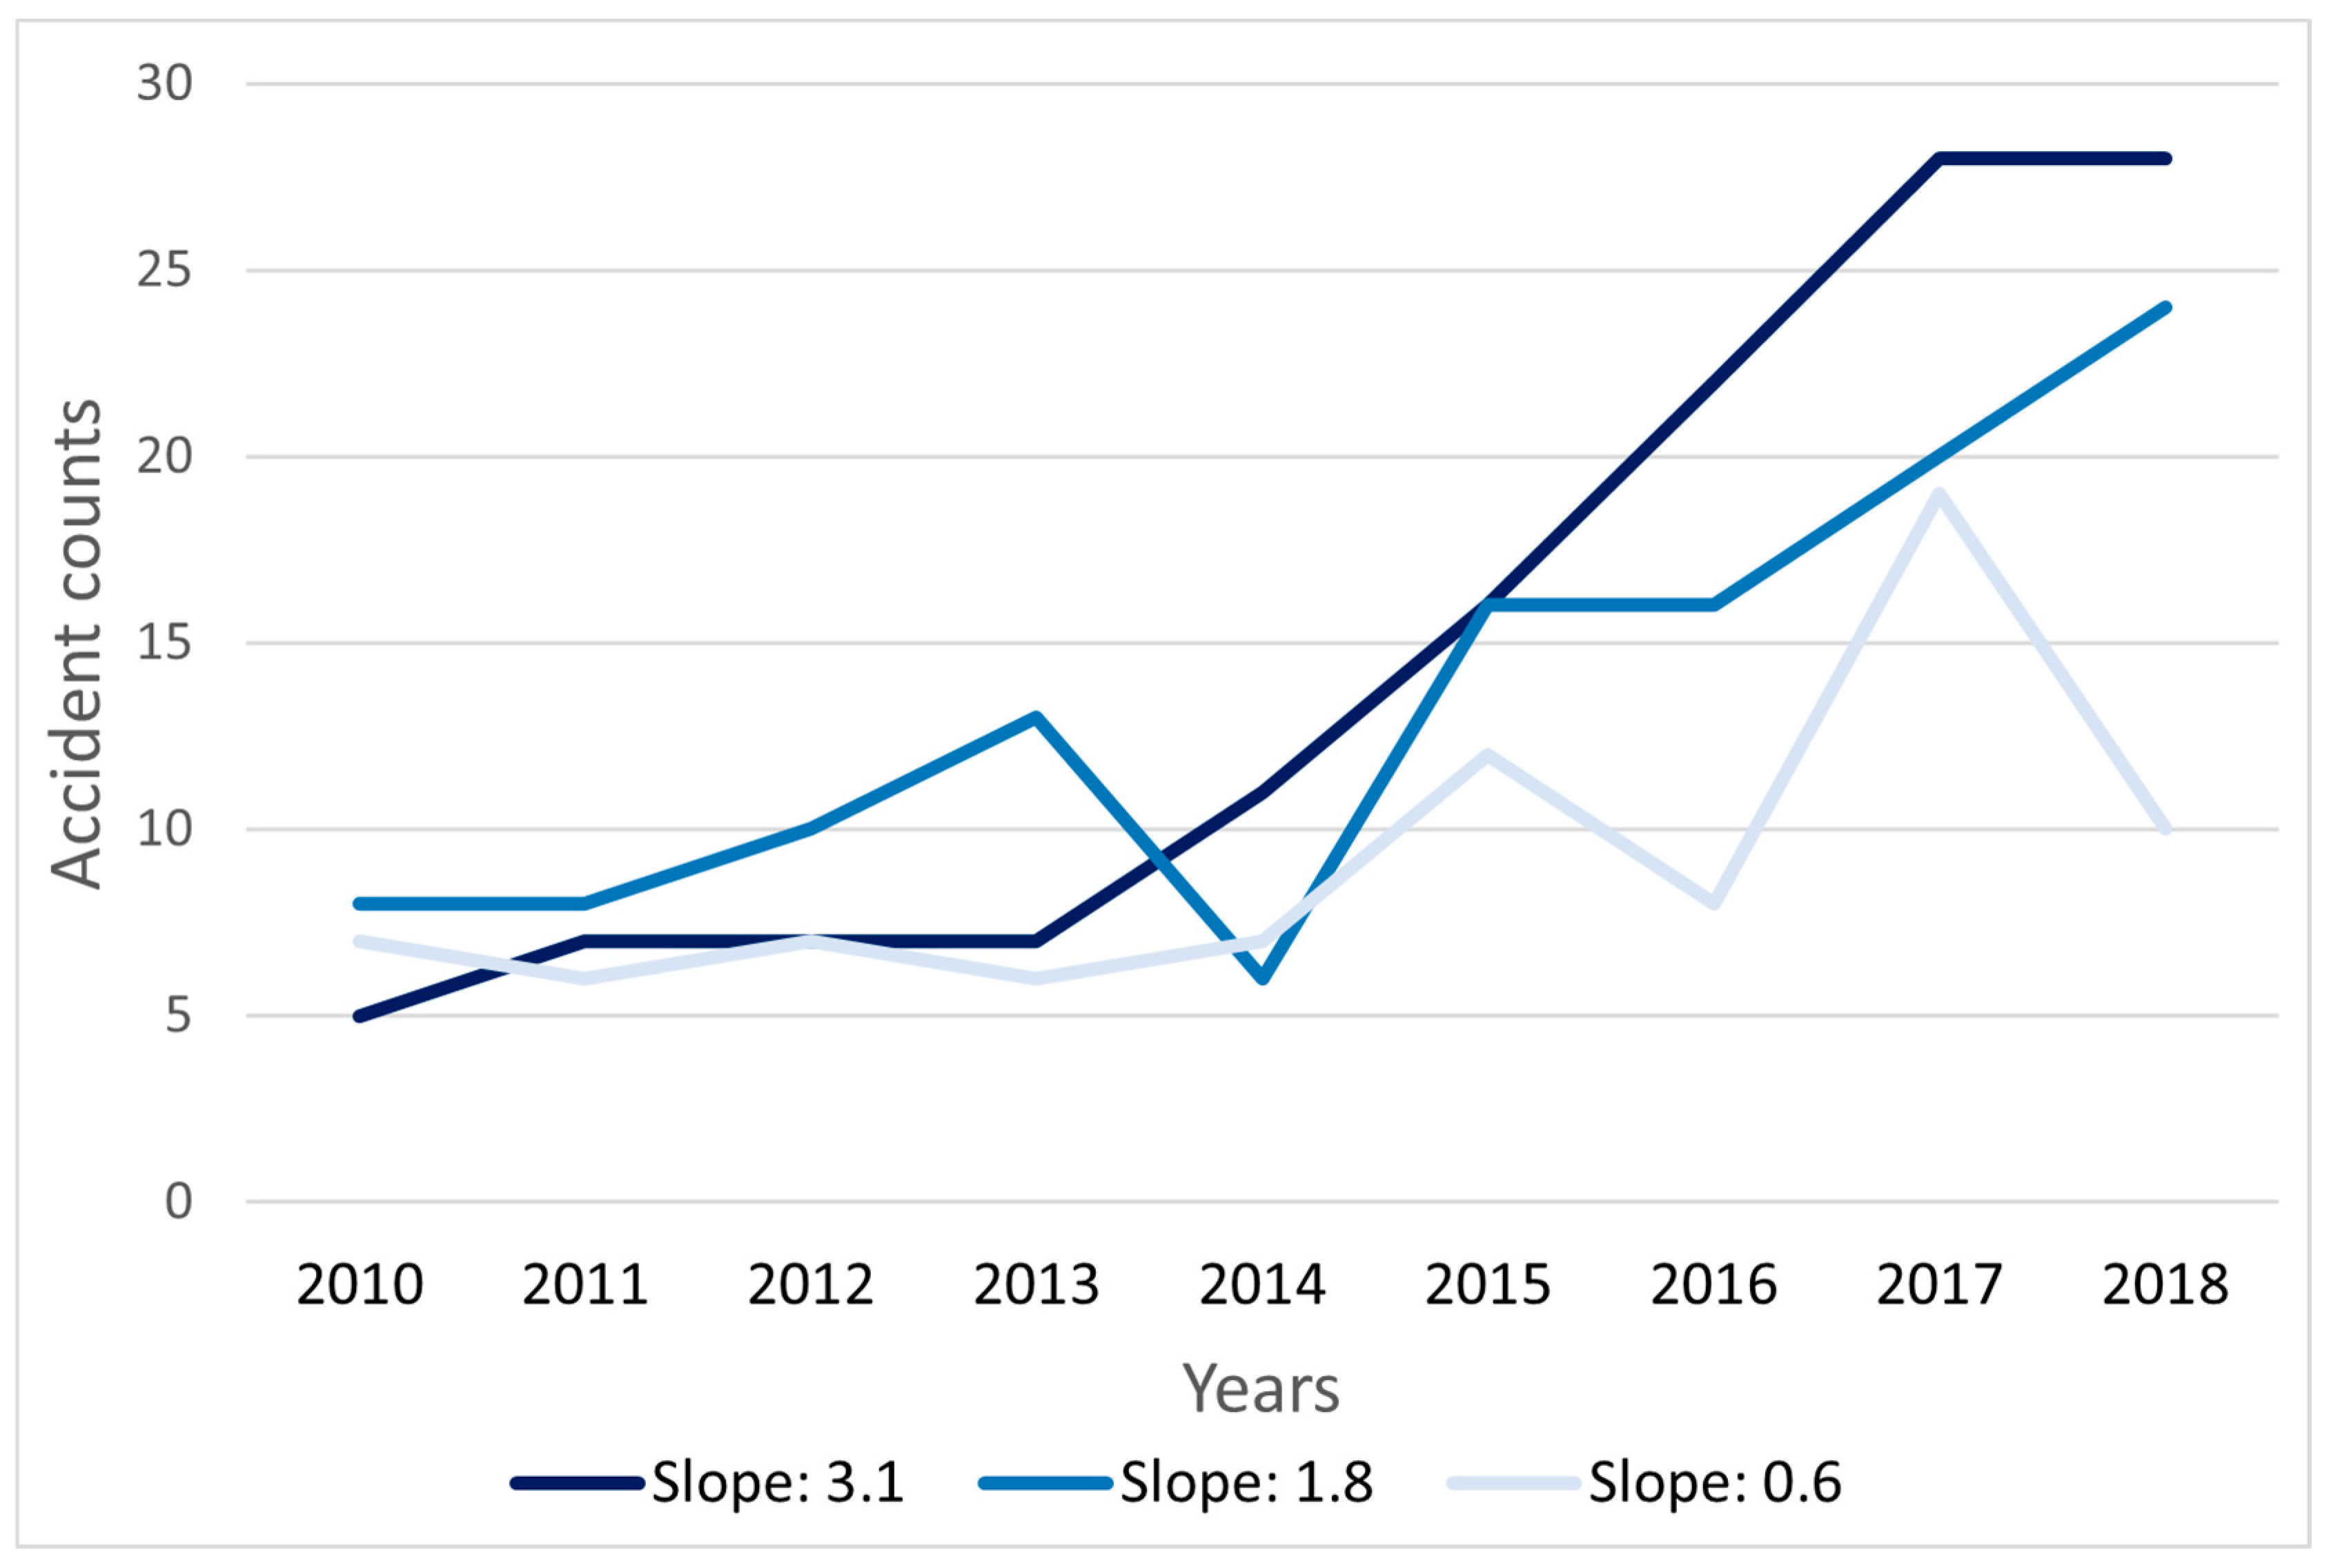
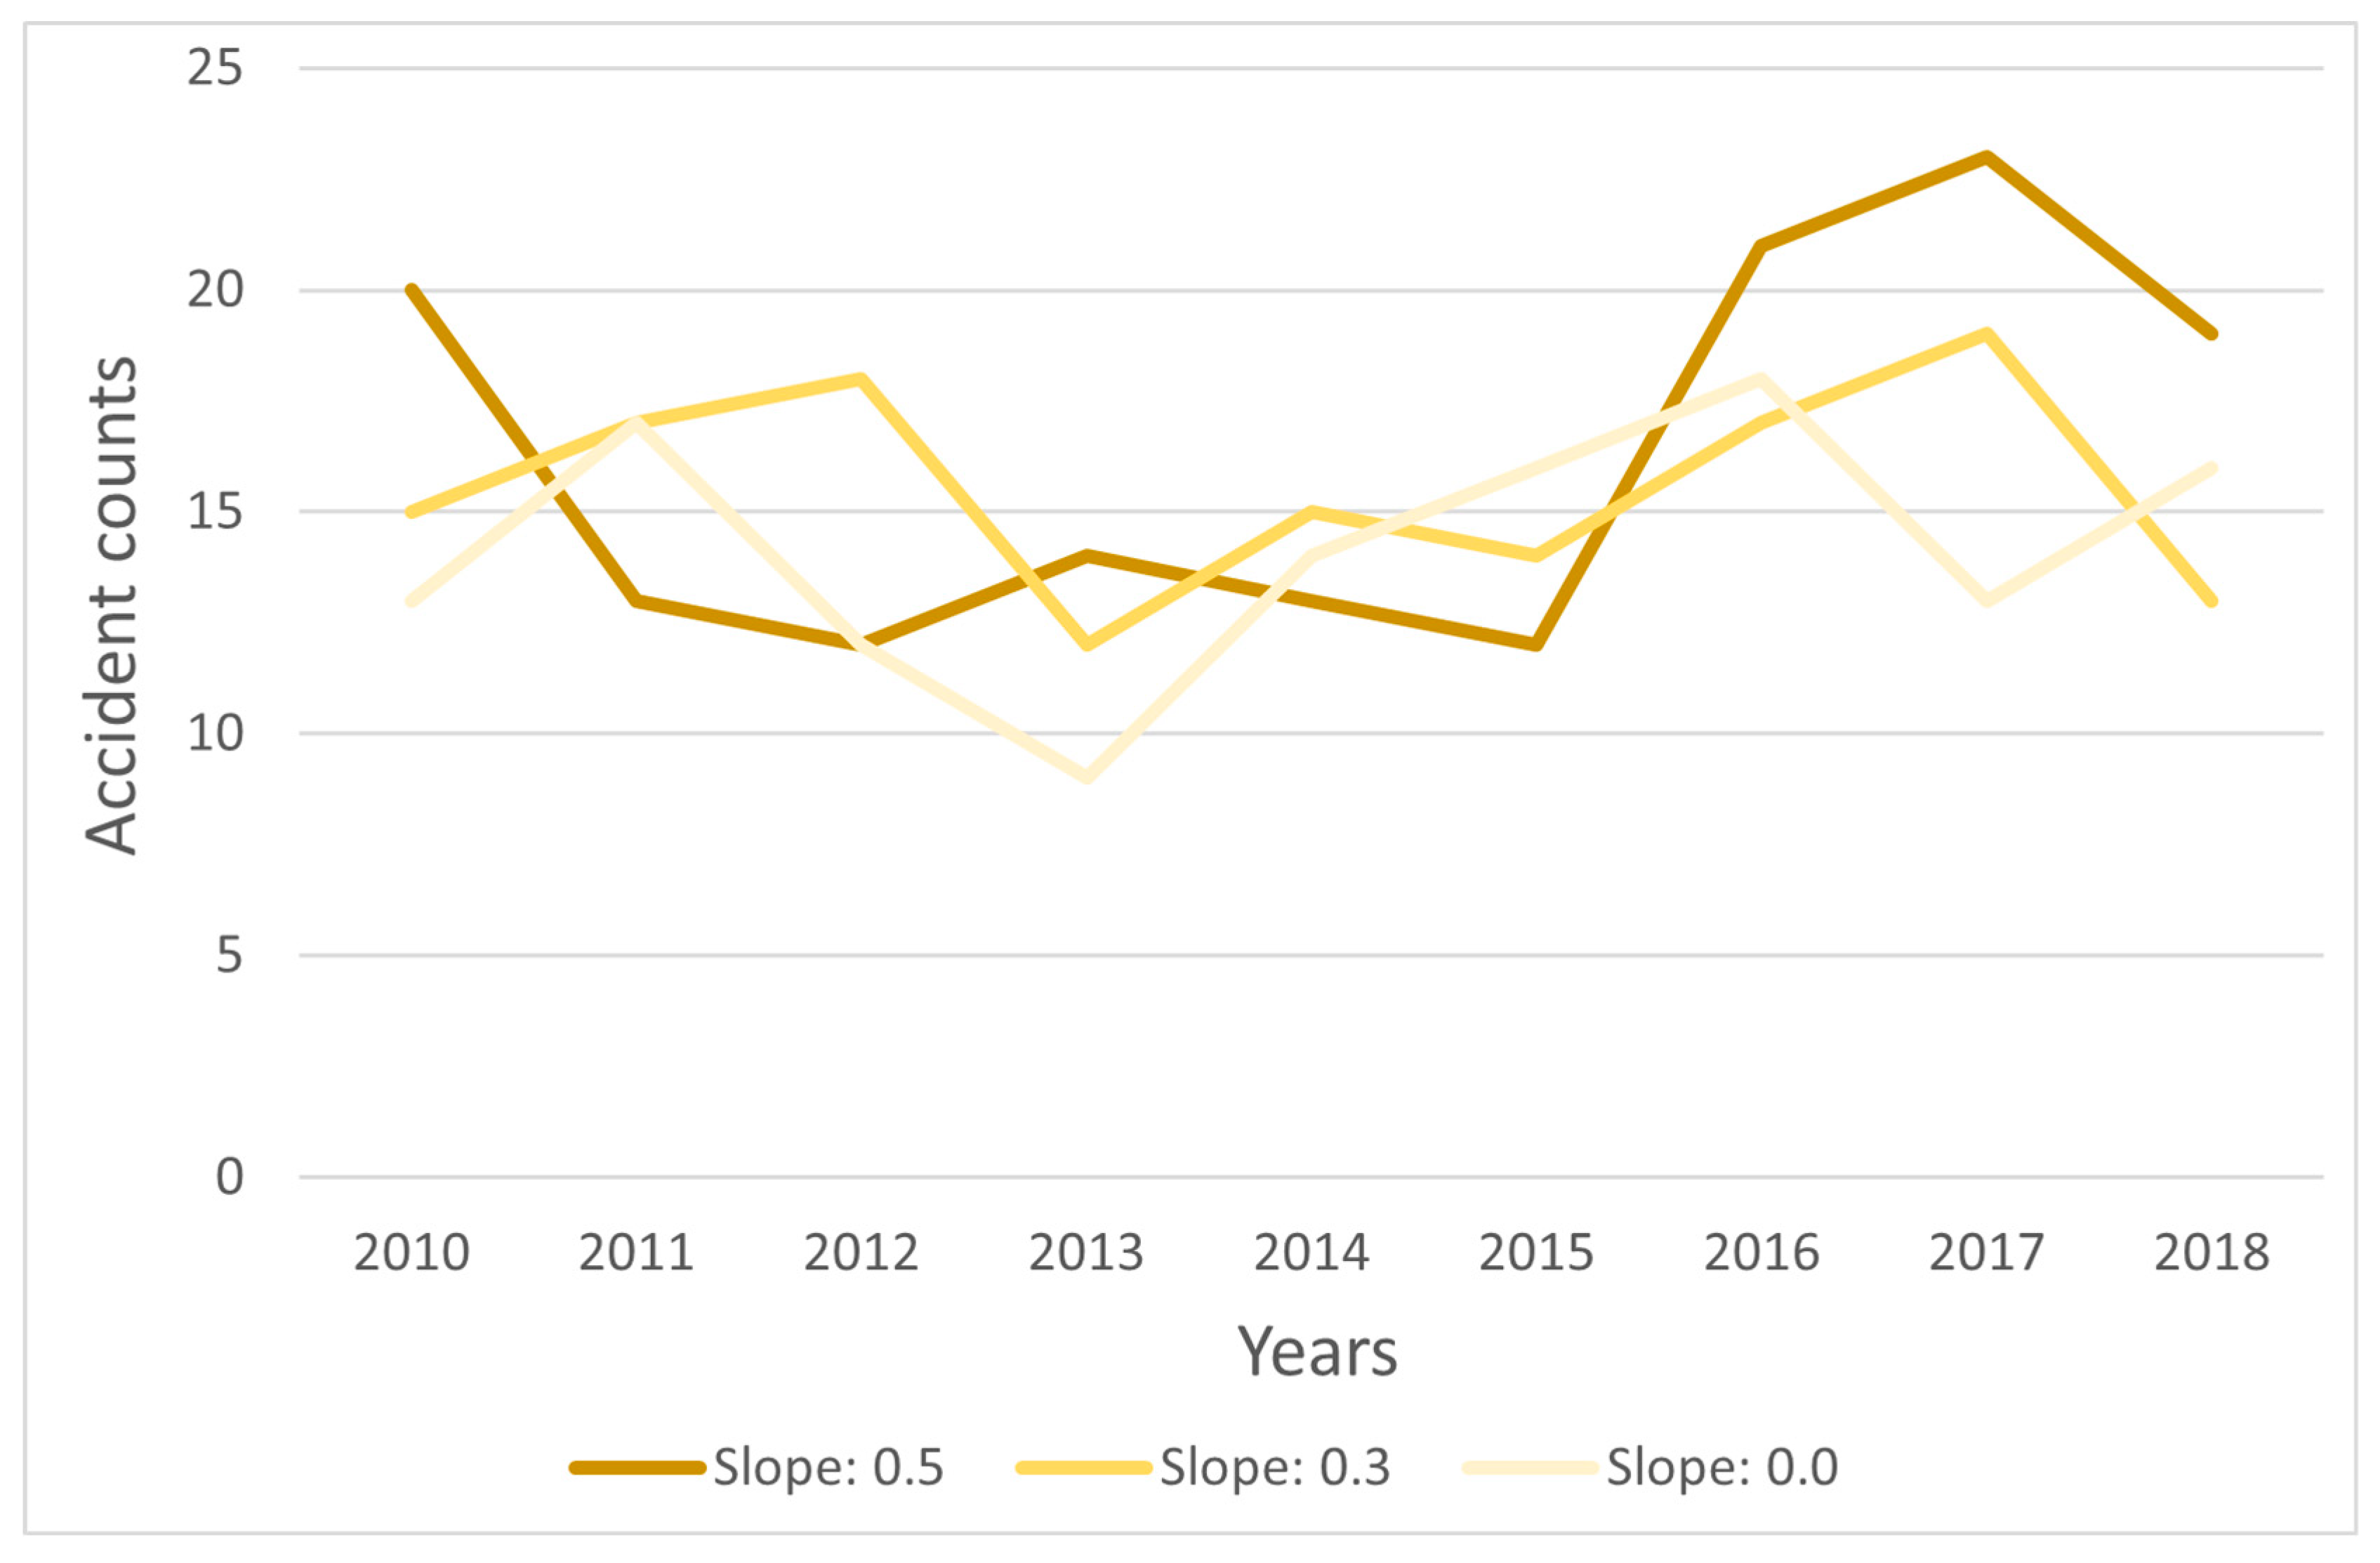
4.2. Spatial Patterns of RO Locations
4.3. Exploratory Analysis of the Distribution of POIs
4.4. Patterns from Association Rules between POI Features and Location Types
4.4.1. Patterns for RO Locations
4.4.2. Patterns for SO Locations and GO Locations
5. Conclusions
Author Contributions
Funding
Institutional Review Board Statement
Informed Consent Statement
Data Availability Statement
Acknowledgments
Conflicts of Interest
References
- Yuan, M. Why are events important and how to compute them in geospatial research? J. Spat. Inf. Sci. Number 2020, 21, 47–61. [Google Scholar] [CrossRef]
- Lu, Y.; Thill, J.C. Assessing the cluster correspondence between paired point locations. Geogr. Anal. 2003, 35, 290–309. [Google Scholar] [CrossRef]
- Brimicombe, A.J.; Brimicombe, A.J. Cluster detection in point event data having tendency towards spatially repetitive events. In Proceedings of the 8th International Conference on GeoComputation, London, UK, 23–25 June 2008. [Google Scholar]
- Erdogan, S.; Yilmaz, I.; Baybura, T.; Gullu, M. Geographical information systems aided traffic accident analysis system case study: City of Afyonkarahisar. Accid. Anal. Prev. 2008, 40, 174–181. [Google Scholar] [CrossRef]
- Cho, S.; Yuan, M. Cartography and Geographic Information Science Placial analysis of events: A case study on criminological places. Cartogr. Geogr. Inf. Sci. 2019, 46, 547–566. [Google Scholar] [CrossRef]
- Shiode, S. Analysis of a distribution of point events using the network-based quadrat method. Geogr. Anal. 2008, 40, 380–400. [Google Scholar] [CrossRef]
- Xie, Z.; Yan, J. Detecting traffic accident clusters with network kernel density estimation and local spatial statistics: An integrated approach. J. Transp. Geogr. 2013, 31, 64–71. [Google Scholar] [CrossRef]
- Thomas, I. Spatial data aggregation: Exploratory analysis of road accidents. Accid. Anal. Prev. 1996, 28, 251–264. [Google Scholar] [CrossRef] [PubMed]
- Wang, X.; Zhou, Q.; Yang, J.; You, S.; Song, Y.; Xue, M. Macro-level traffic safety analysis in Shanghai, China. Accid. Anal. Prev. 2019, 125, 249–256. [Google Scholar] [CrossRef] [PubMed]
- Dong, N.; Huang, H.; Zheng, L. Support vector machine in crash prediction at the level of traffic analysis zones: Assessing the spatial proximity effects. Accid. Anal. Prev. 2015, 82, 192–198. [Google Scholar] [CrossRef] [PubMed]
- Ziakopoulos, A.; Yannis, G. A review of spatial approaches in road safety. Accid. Anal. Prev. 2020, 135, 105323. [Google Scholar] [CrossRef] [PubMed]
- Anderson, T.K. Kernel density estimation and K-means clustering to profile road accident hotspots. Accid. Anal. Prev. 2009, 41, 359–364. [Google Scholar] [CrossRef]
- Andrey, J. Long-term trends in weather-related crash risks. J. Transp. Geogr. 2010, 18, 247–258. [Google Scholar] [CrossRef]
- Prasannakumar, V.; Vijith, H.; Charutha, R.; Geetha, N. Spatio-Temporal Clustering of Road Accidents: GIS Based Analysis and Assessment. Procedia Soc. Behav. Sci. 2011, 21, 317–325. [Google Scholar] [CrossRef]
- Harirforoush, H. Spatial and Temporal Analysis of Seasonal Traffic Accidents. Am. J. Traffic Transp. Eng. 2019, 4, 7. [Google Scholar] [CrossRef]
- Kumar, S.; Toshniwal, D. Analysis of hourly road accident counts using hierarchical clustering and cophenetic correlation coefficient (CPCC). J. Big Data 2016, 3, 13. [Google Scholar] [CrossRef]
- Petrov, A. Road Traffic Accident Rate as an Indicator of the Quality of Life. Econ. Soc. Changes Facts Trends Forecast 2016, 3, 154–172. [Google Scholar] [CrossRef]
- Mannering, F.L.; Shankar, V.; Bhat, C.R. Unobserved Heterogeneity and the Statistical Analysis of Highway Accident Data. Anal. Methods Accid. Res. 2016, 11, 1–16. [Google Scholar] [CrossRef]
- Abdel-Aty, M.; Lee, J.; Siddiqui, C.; Choi, K. Geographical unit based analysis in the context of transportation safety planning. Transp. Res. Part A Policy Pract. 2013, 49, 62–75. [Google Scholar] [CrossRef]
- Quddus, M.A. Modelling area-wide count outcomes with spatial correlation and heterogeneity: An analysis of London crash data. Accid. Anal. Prev. 2008, 40, 1486–1497. [Google Scholar] [CrossRef] [PubMed]
- Jia, R.; Khadka, A.; Kim, I. Traffic crash analysis with point-of-interest spatial clustering. Accid. Anal. Prev. 2018, 121, 223–230. [Google Scholar] [CrossRef] [PubMed]
- Chen, Q.; Song, X.; Yamada, H.; Shibasaki, R. Learning Deep Representation from Big and Heterogeneous Data for Traffic Accident Inference. Proc. AAAI Conf. Artif. Intell. 2016, 338-344, 338–344. [Google Scholar] [CrossRef]
- Wang, N.; Liu, Y.; Wang, J.; Qian, X.; Zhao, X.; Wu, J.; Wu, B.; Yao, S.; Fang, L. Investigating the potential of using POI and nighttime light data to map urban road safety at the micro-level: A case in Shanghai, China. Sustainability 2019, 11, 4739. [Google Scholar] [CrossRef]
- Louw, E.; Bruinsma, F. From mixed to multiple land use. J. Hous. Built Environ. 2006, 21, 1–13. [Google Scholar] [CrossRef]
- Pulugurtha, S.S.; Duddu, V.R.; Kotagiri, Y. Traffic analysis zone level crash estimation models based on land use characteristics. Accid. Anal. Prev. 2013, 50, 678–687. [Google Scholar] [CrossRef]
- Hu, T.; Yang, J.; Li, X.; Gong, P.; He, Y.; Weng, Q.; Koch, M.; Thenkabail, P.S. Mapping Urban Land Use by Using Landsat Images and Open Social Data. Remote Sens. 2016, 8, 151. [Google Scholar] [CrossRef]
- González, M.C.; Hidalgo, C.A.; Barabási, A.-L. Understanding individual human mobility patterns. Nature 2008, 453, 779–782. [Google Scholar] [CrossRef] [PubMed]
- Li, M.; Gao, S.; Lu, F.; Liu, K.; Zhang, H.; Tu, W. Prediction of human activity intensity using the interactions in physical and social spaces through graph convolutional networks. Int. J. Geogr. Inf. Sci. 2021, 35, 2489–2516. [Google Scholar] [CrossRef]
- Abdullah, U.; Ahmad, J.; Ahmed, A. Analysis of effectiveness of apriori algorithm in medical billing data mining. In Proceedings of the 2008 4th International Conference on Emerging Technologies, ICET 2008, Rawalpindi, Pakistan, 18–19 October 2008; IEEE: Piscataway, NJ, USA, 2008; pp. 327–331. [Google Scholar] [CrossRef]
- Mazid, M.M.; Ali, A.B.M.S.; Tickle, K.S. A comparison between rule based and association rule mining algorithms. In Proceedings of the 2009 Third International Conference on Network and System Security, NSS 2009, Queensland, Australia, 19–21 October 2009; IEEE: Piscataway, NJ, USA, 2009; pp. 452–455. [Google Scholar] [CrossRef]
- John, M.; Shaiba, H. Apriori-Based Algorithm for Dubai Road Accident Analysis. Procedia Comput. Sci. 2019, 163, 218–227. [Google Scholar] [CrossRef]
- Nidhi, R.; Kanchana, V. Analysis of road accidents using Data mining techniques. Int. J. Eng. Technol. 2018, 7, 40–44. [Google Scholar] [CrossRef]
- Yang, Y.; Yang, Y.; Yuan, Z.Z.; Sun, D.Y.; Wen, X.L. Analysis of the factors influencing highway crash risk in different regional types based on improved Apriori algorithm. Adv. Transp. Stud. Int. J. Sect. B 2019, 49, 165–178. [Google Scholar]
- Steenberghen, T.; Aerts, K.; Thomas, I. Spatial clustering of events on a network. J. Transp. Geogr. 2010, 18, 411–418. [Google Scholar] [CrossRef]
- Sillero, N.; Barbosa, A.M. Common mistakes in ecological niche models. Int. J. Geogr. Inf. Sci. 2021, 35, 213–226. [Google Scholar] [CrossRef]
- Brotons, L.; Thuiller, W.; Araújo, M.B.; Hirzel, A.H. Presence-Absence versus Presence-Only Modelling Methods for Predicting Bird Habitat Suitability. Ecography 2004, 27, 437–448. [Google Scholar] [CrossRef]
- Edsall, R.M.; Harrower, M.; Mennis, J.L. Tools for visualizing properties of spatial and temporal periodicity in geographic data. Comput. Geosci. 2000, 26, 109–118. [Google Scholar] [CrossRef][Green Version]
- Vlachos, M.; Yu, P.; Castelli, V. On periodicity detection and structural periodic similarity. In Proceedings of the 2005 SIAM International Conference on Data Mining, SDM 2005, Newport Beach, CA, USA, 21–23 April 2005; Society for Industrial and Applied Mathematics: Philadelphia, PA, USA, 2005; pp. 449–460. [Google Scholar] [CrossRef]
- Elfeky, M.G.; Aref, W.G.; Elmagarmid, A.K. Periodicity detection in time series databases. IEEE Trans. Knowl. Data Eng. 2005, 17, 875–887. [Google Scholar] [CrossRef]
- Sen, P.K. Estimates of the Regression Coefficient Based on Kendall’s Tau. J. Am. Stat. Assoc. 1968, 63, 1379–1389. [Google Scholar] [CrossRef]
- McKenzie, G.; Janowicz, K.; Gao, S.; Gong, L. How where is when? On the regional variability and resolution of geosocial temporal signatures for points of interest. Comput. Environ. Urban Syst. 2015, 54, 336–346. [Google Scholar] [CrossRef]
- El-basyouny, K.; Sayed, T. A full Bayes multivariate intervention model with random parameters among matched pairs for before—After safety evaluation. Accid. Anal. Prev. 2011, 43, 87–94. [Google Scholar] [CrossRef]
- Cui, G.; Wang, X.; Kwon, D.-W. A framework of boundary collision data aggregation into neighbourhoods. Accid. Anal. Prev. 2015, 83, 1–17. [Google Scholar] [CrossRef] [PubMed]



| General Class | # POIs | General Class | # POIs |
|---|---|---|---|
| Restaurant | 7221 | Entertainment | 1389 |
| Care Facility | 628 | Manufacturing | 1494 |
| Automotive | 1566 | Transportation | 377 |
| Bank | 2661 | Administration | 2265 |
| Education | 1565 | Utilities | 548 |
| Medical | 7744 | Business | 9048 |
| Store | 8082 |
| Variable | Min. | 1st Q. | Median | Mean | 3rd Q. | Max. |
|---|---|---|---|---|---|---|
| prop of administration | 0 | 0.000 | 0.037 | 0.077 | 0.100 | 1.000 |
| prop of automotive | 0 | 0.000 | 0.013 | 0.038 | 0.050 | 1.000 |
| prop of bank | 0 | 0.000 | 0.027 | 0.041 | 0.068 | 0.500 |
| prop of business | 0 | 0.100 | 0.186 | 0.194 | 0.239 | 1.000 |
| prop of care facility | 0 | 0.000 | 0.000 | 0.011 | 0.012 | 0.222 |
| prop of education | 0 | 0.000 | 0.018 | 0.052 | 0.053 | 1.000 |
| prop of entertainment | 0 | 0.000 | 0.000 | 0.026 | 0.037 | 0.500 |
| prop of manufacturing | 0 | 0.000 | 0.022 | 0.038 | 0.048 | 0.667 |
| prop of medical | 0 | 0.000 | 0.124 | 0.125 | 0.182 | 1.000 |
| prop of restaurant | 0 | 0.000 | 0.125 | 0.130 | 0.193 | 1.000 |
| prop of stores | 0 | 0.053 | 0.143 | 0.151 | 0.207 | 1.000 |
| prop of transportation | 0 | 0.000 | 0.000 | 0.009 | 0.005 | 0.250 |
| prop of utilities | 0 | 0.000 | 0.000 | 0.011 | 0.010 | 1.000 |
| Rules | Support | Confidence | Lift | |
|---|---|---|---|---|
| Location of routine occurrences (ROs) | ||||
| 1 | Business_level4,Care_Facility_level4,Stores_level4,Utilities_level4 | 0.104 | 0.824 | 2.473 |
| 2 | Entertainment_level4,Business_level4,Stores_level4 | 0.104 | 0.824 | 2.472 |
| 3 | Care_Facility_level4,Stores_level4,Utilities_level4 | 0.104 | 0.823 | 2.470 |
| 4 | Care_Facility_level4,Restaurant_level4,Stores_level4,Utilities_level4 | 0.104 | 0.823 | 2.469 |
| 5 | Restaurant_level4,Care_Facility_level4, Utilities_level4 | 0.110 | 0.811 | 2.434 |
| 6 | Business_level4,Care_Facility_level4,Restaurant_level4,Utilities_level4 | 0.108 | 0.810 | 2.430 |
| 7 | Business_level4,Care_Facility_level4,Utilities_level4 | 0.108 | 0.809 | 2.428 |
| 8 | Automotive_level4,Entertainment_level4,Restaurant_level4 | 0.104 | 0.784 | 2.353 |
| 9 | Automotive_level4,Restaurant_level4,Utilities_level4 | 0.103 | 0.784 | 2.353 |
| 10 | Manufacturing_level4,Restaurant_level4,Transportation_level4 | 0.102 | 0.784 | 2.352 |
| Location of stochastic occurrences (SOs) | ||||
| 11 | Bank_level3 | 0.125 | 0.514 | 1.541 |
| 12 | Entertainment_level3 | 0.141 | 0.510 | 1.530 |
| 13 | Business_level3 | 0.125 | 0.507 | 1.520 |
| 14 | Care_Facility_level3 | 0.130 | 0.502 | 1.505 |
| 15 | Restaurant_level3 | 0.118 | 0.496 | 1.486 |
| 16 | Manufacturing_level3 | 0.113 | 0.490 | 1.470 |
| 17 | Stores_level3 | 0.122 | 0.488 | 1.463 |
| 18 | Restaurant_level2 | 0.124 | 0.483 | 1.447 |
| 19 | Automotive_level3 | 0.119 | 0.474 | 1.421 |
| 20 | Education_level3 | 0.114 | 0.461 | 1.382 |
| Locations without traffic accidents (GOs) | ||||
| 21 | Bank_none,Manufacturing_none,Utilities_none | 0.109 | 0.965 | 2.896 |
| 22 | Bank_none,Manufacturing_none,Transportation_none | 0.106 | 0.964 | 2.893 |
| 23 | Automotive_none,Bank_none,Transportation_none,Utilities_none | 0.103 | 0.957 | 2.873 |
| 24 | Care_Facility_none,Entertainment_none,Manufacturing_none, Transportation_none | 0.107 | 0.956 | 2.869 |
| 25 | Bank_none,Care_Facility_none,Utilities_none | 0.137 | 0.956 | 2.868 |
| 26 | Care_Facility_none,Entertainment_none,Manufacturing_none, Utilities_none | 0.109 | 0.955 | 2.867 |
| 27 | Business_level1,Care_Facility_none,Entertainment_none | 0.101 | 0.907 | 2.723 |
| 28 | Business_level1,Care_Facility_none,Utilities_none | 0.123 | 0.904 | 2.714 |
| 29 | Business_level1,Care_Facility_none,Transportation_none, Utilities_none | 0.110 | 0.904 | 2.712 |
| 30 | Business_level1,Transportation_none,Utilities_none | 0.126 | 0.893 | 2.679 |
Disclaimer/Publisher’s Note: The statements, opinions and data contained in all publications are solely those of the individual author(s) and contributor(s) and not of MDPI and/or the editor(s). MDPI and/or the editor(s) disclaim responsibility for any injury to people or property resulting from any ideas, methods, instructions or products referred to in the content. |
© 2024 by the authors. Licensee MDPI, Basel, Switzerland. This article is an open access article distributed under the terms and conditions of the Creative Commons Attribution (CC BY) license (https://creativecommons.org/licenses/by/4.0/).
Share and Cite
Wu, Y.; Yang, Y.; Yuan, M. Location Analytics of Routine Occurrences (LARO) to Identify Locations with Regularly Occurring Events with a Case Study on Traffic Accidents. Information 2024, 15, 107. https://doi.org/10.3390/info15020107
Wu Y, Yang Y, Yuan M. Location Analytics of Routine Occurrences (LARO) to Identify Locations with Regularly Occurring Events with a Case Study on Traffic Accidents. Information. 2024; 15(2):107. https://doi.org/10.3390/info15020107
Chicago/Turabian StyleWu, Yanan, Yalin Yang, and May Yuan. 2024. "Location Analytics of Routine Occurrences (LARO) to Identify Locations with Regularly Occurring Events with a Case Study on Traffic Accidents" Information 15, no. 2: 107. https://doi.org/10.3390/info15020107
APA StyleWu, Y., Yang, Y., & Yuan, M. (2024). Location Analytics of Routine Occurrences (LARO) to Identify Locations with Regularly Occurring Events with a Case Study on Traffic Accidents. Information, 15(2), 107. https://doi.org/10.3390/info15020107


