Article

Research on Pedestrian Detection Based on the Multi-Scale and Feature-Enhancement Model

School of Computer and Communication, Lanzhou University of Technology, Lanzhou 730050, China
*
Author to whom correspondence should be addressed.
Information 2023, 14(2), 123; https://doi.org/10.3390/info14020123
Submission received: 7 November 2022 / Revised: 9 February 2023 / Accepted: 13 February 2023 / Published: 14 February 2023
(This article belongs to the Special Issue Deep Learning for Human-Centric Computer Vision)

Abstract

:
Pedestrian detection represents one of the critical tasks of computer vision; however, detecting pedestrians can be compromised by problems such as the various scale of pedestrian features and cluttered background, which can easily cause a loss of accuracy. Therefore, we propose a pedestrian detection method based on the FCOS network. Firstly, we designed a feature enhancement module to ensure that effective high-level semantics are obtained while preserving the detailed features of pedestrians. Secondly, we defined a key-center region judgment to reduce the interference of background information on pedestrian feature extraction. By testing on the Caltech pedestrian dataset, the AP value is improved from 87.36% to 94.16%. The results of the comparison experiment illustrate that the model proposed in this paper can significantly increase the accuracy.

1. Introduction

Computer vision technology plays an essential role in artificial intelligence research, which studies how to make computers intelligently perceive image data. Object detection aims to predict the position and category of targets and marks the location of targets by predicting a bounding box. Object detection, being one of the most essential aspects of computer vision, has been the focus of many studies in recent decades. Object detection is currently widely used in various real scenarios, such as autonomous driving, robot vision, pedestrian detection, etc.
Pedestrian Detection [1], as a hot topic in the field of object detection, has standalone value within a variety of applications, such as pedestrian attribute recognition [2], intelligent surveillance, unmanned driving, etc. Pedestrian feature extraction is a crucial foundation for pedestrian detection. However, pedestrians have non-rigid characteristics, multi-posture, image quality, and large-scale variation range, which present challenges for pedestrian feature extraction. Most early methods were based on manual feature construction, and due to the lack of effective image representations at that time, people had to choose to design complex feature representations. Some typical methods, such as the Histogram of Gradient Features (HOG) [3] and the deformation part model (DPM) [4], have been widely used in pedestrian detection. Traditional handcrafted features are easily affected by external conditions, and the robustness of the extracted features is weak, so the detection accuracy is relatively low. As deep learning develops, researchers have started to utilize deep neural networks to automatically capture features from the original input images. To compare it with the traditional methods, the algorithm based on deep learning can obtain higher-level features. such as the semantic feature, and then send these extracted features to a pre-trained detector.
Generally, deep learning pedestrian detection methods are classified into two main categories: the first is two-stage detectors, such as R-CNN [5] Fast R-CNN [6], Faster R-CNN [7], etc. These algorithms first create a succession of candidate regions to be utilized as samples, which are subsequently classified using neural networks to detect the location of the target. Such methods have a high degree of accuracy but are slower in speed. The second method is one-stage detectors, such as YOLO [8], SSD [9], etc. These types of algorithms are no longer required to create candidate regions and transform the localization problem into a regression problem. This kind of method is faster but less accurate. All of the aforementioned methods are based on anchors; Zhi et al. [10] argue that the aspect ratio and the number of anchors have a large impact on the detection performance. The parameters of anchors must be carefully calibrated. In most anchor-based algorithms, the model encounters problems when detecting candidate targets with large variations due to the fixed shape of the anchors. To avoid negative effects, the anchor-based algorithms need to redefine the anchor for different target sizes when detecting pedestrians with a wide range of scale variations.
The anchor-free algorithms can avoid these effects. However, the anchor-free algorithms may cause a significant disparity in the number of positive and negative samples, which affects the training effect. This happens because, without predefined anchors, most of the anchors generated in the step of generating candidate regions are marked as the negative sample, and too many negative samples will exacerbate the training’s imbalance between positive and negative samples. To solve this, we propose a pedestrian detection method that incorporates modules named key-center and feature-enhancement (FE-block). The method proposed in this paper can reduce the generation of low-quality positive samples in training. The F-E block can enhance the representation of pedestrian features and ultimately improve the model performance.

2. Related Works

The two main categories of pedestrian detection methods are traditional detection methods based on hand-designed features and detection algorithms based on deep neural networks.

2.1. Traditional Detectors

Before deep neural networks were used for pedestrian detection, many methods based on handcrafted features were investigated, such as SIFT [11], LBP [12], HOG, Haar [13], etc. These methods usually extract pedestrian edge information. As one of the most extensively utilized handcrafted features in pedestrian detection, the HOG feature is an edge feature that uses the edge orientation and intensity information to compute a histogram of the gradient orientation distribution of all pixels, which is aggregated to form the HOG feature. Meanwhile, Dalal et al. used an SVM classifier to classify the obtained HOG features. Zheng [14] improved on this by using the histogram from the directional gradient histogram and the LBP extracted features in order to detect pedestrians quickly in still images. However, the manual feature design is very labor-intensive. With the development of deep learning technology, researchers have worked on a method that does not require manual feature design and can learn the features from the image automatically, and deep neural networks start to be used in pedestrian detection.

2.2. CNN Based Detectors

In the last few years, deep convolutional neural networks have shown great promise in a variety of computer vision tasks, including image classification, object detection, and instance segmentation. Deep learning technology has achieved great success in object detection and has been used to extract features for pedestrian detection. Two-stage networks have obtained satisfactory results in object detection. However, the performance is below expectation when the two-stage network is directly used for pedestrian detection. This happens because the two-stage approach consists of two major parts in detecting targets. One is to implement region suggestion through a selective search, and another part is a convolutional neural network that is used to identify specific regions that are fed to a classifier in order to determine the appropriate classification labels. As a result, the detection speed is relatively slow. Although Zhang [15] introduced some modifications to the Faster R-CNN, such as scoring the anchor and processing the ignored regions, the speed improvement was not significant. Many single-stage detection networks have been created, including the YOLO series and SSD. In contrast to the two-stage methods, the one-stage networks perform regression directly to find targets in the picture without region suggestion, thus providing a faster detection speed. However, all of these methods require the pre-defined anchor at the time of detection. As the aspect ratio of the anchor is constant, the model will encounter trouble when detecting candidate targets with large variations, and most detection models need to redefine the anchor with different target sizes for different detection task scenarios, due to the large impact of the model predefined anchor on the model performance. Anchor-free approaches are simpler to construct than anchor-based methods because they avoid the need to manually design the scale and aspect ratio of the anchors. Song [16] proposed locating pedestrians in torso topography lines, and Liu [17] proposed a method to predict pedestrian centroids and height based on advanced semantic feature maps. Using deep neural networks based on anchor-free methods for pedestrian detection can avoid the design of the anchor while ensuring speed. However, the detection algorithm without the pre-defined anchor lacks the help of candidate regions in determining positive and negative samples, which is very likely to cause an imbalance between the positive and negative samples and generate a large number of low-quality positive samples, thus leading to the degradation of detection accuracy. In this paper, we propose a method to deal with this point.

3. Introduce FCOS Network
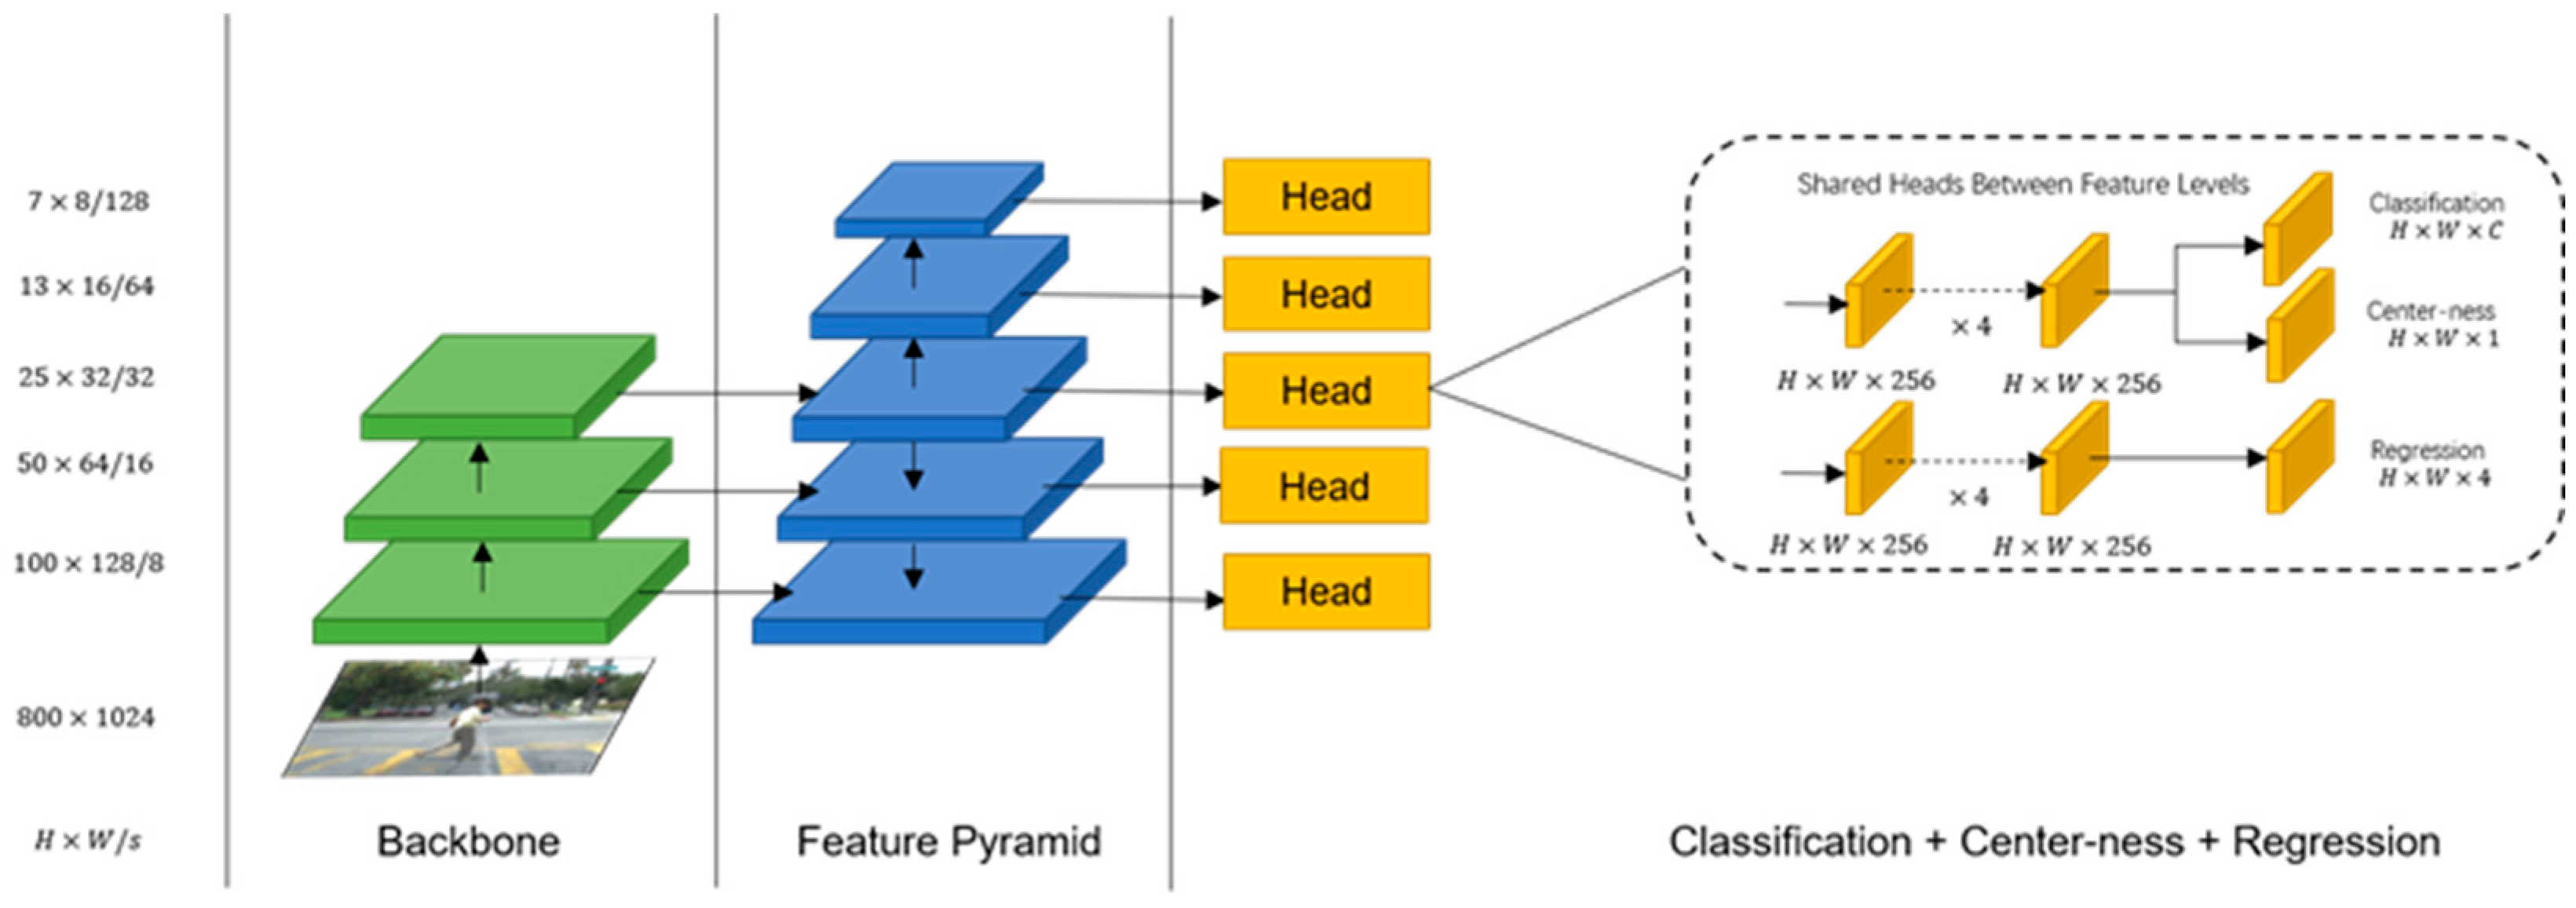
3.1. FCOS Network

In contrast to the other anchor-free networks, FCOS is a fully convolutional one-stage object detection network that detects targets on a pixel-by-pixel basis [10]. The network performs pixel-based regression on the multi-scale feature maps. DenseBox-based detection algorithms, such as Unitbox [18] FCOS, shows that the use of multi-level feature pyramid networks (FPN) prediction can improve the recall rate and increase the detection accuracy. The overall structure of the network is displayed in Figure 1 [10].
In contrast to the anchor-based detection algorithm, which first obtains the feature map of an image after inputting the image to the backbone network and then uses a predefined anchor to make predictions, FCOS performs a regression operation on each pixel point on the feature map directly. First, each point (x, y) must be mapped to the input image. If a point belongs to one of the ground-truth boxes and the class label corresponds, it is taken as a positive sample for training; if not, it is taken as a negative sample. Immediately afterward, regression is performed on (l, t, r, b), the distance between the center point and the box’s left, top, right, and bottom, as shown in Figure 2 (left).
An ambiguous sample is one in which a point falls into more than one bounding box, as shown in Figure 2 (right), it is classified as an ambiguous sample. For this type of sample, the algorithm directly takes the bounding box with the smallest area as its regression target. If a location (x, y) is related to a bounding box, the regression equation for that location is shown in (1) [10]:
l * = x x 0 i , t * = y y 0 i , r * = x 1 i x , b * = y 1 i y .
x 0 , y 0 and ( x 1 , y 1 ) denote the upper-left and lower-right coordinate values of the bounding box, respectively. The loss function in training is defined as in (2) [10].
L o s s = 1 N p o s x , y L c l s p x , y , C * x , y + 1 N p o s x , y I C * x , y > 0 L r e g t x , y , t * x , y
where x , y denotes a position on the feature map; p x , y means the predicted classification score; C * x , y denotes the true classification label; t x , y denotes the regression predicted target position; t * x , y denotes the true target location; L c l s is the Focal Loss classification loss, and   L r e g is the IoU Loss regression loss ;   N p o s denotes the total number of positive samples, and   I C * x , y > 0 denotes the number of positive samples when   C * x , y > 0 is 1, otherwise is 0.
In the pixel-by-pixel prediction of the feature map, many pixel points are in the truth box, but the closer the pixel points are to the center of the truth box, the higher the probability of predicting a high-quality prediction box, so the prediction centrality loss function is proposed, as shown in (3) [10]
c e n t e r n e s s * = min l * , r * min l * , r * × min t * , b * min t * , b *
l * , r * , t * , b * denotes the distance between the current pixel point and the box’s edge, and sqrt is used to delay the decay of the center-ness loss. The value of center-ness loss is in the range   0 , 1 , and the BCE loss is used for training. The center-ness loss will reduce when the sample is in the center. The box’s final score is calculated by multiplying the predicted loss of center-ness by the classification score, and this score is used to rank the quality of the predicted bounding box. As a result, the center-ness reduces the predicted bounding box scores distant from the target center, and low-score bounding boxes can be filtered out using an NMS process. It can significantly improve the detection performance.

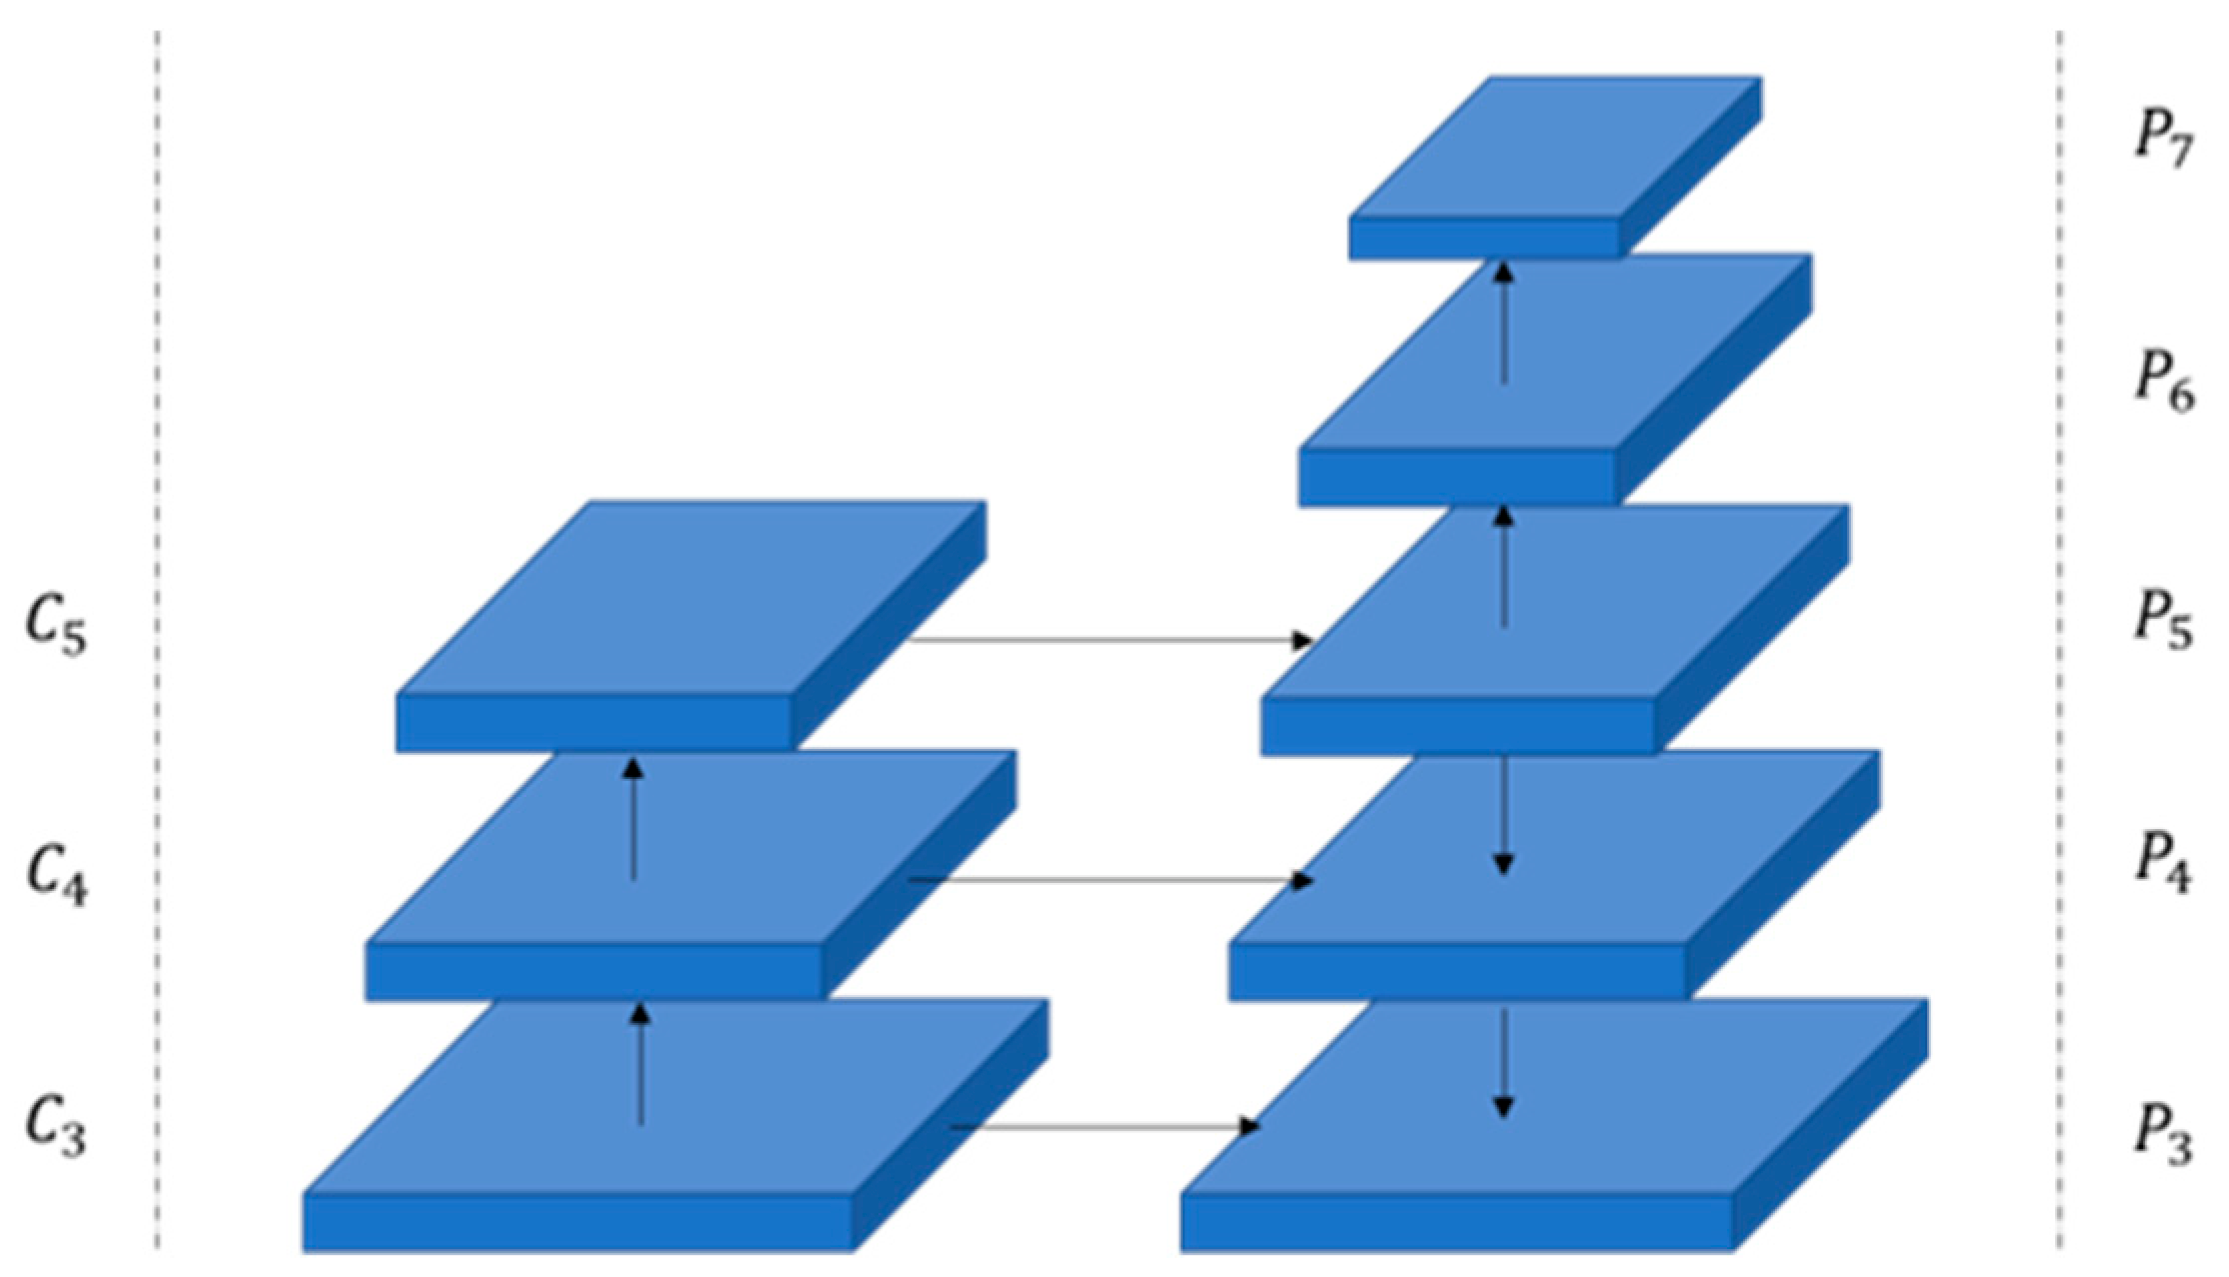
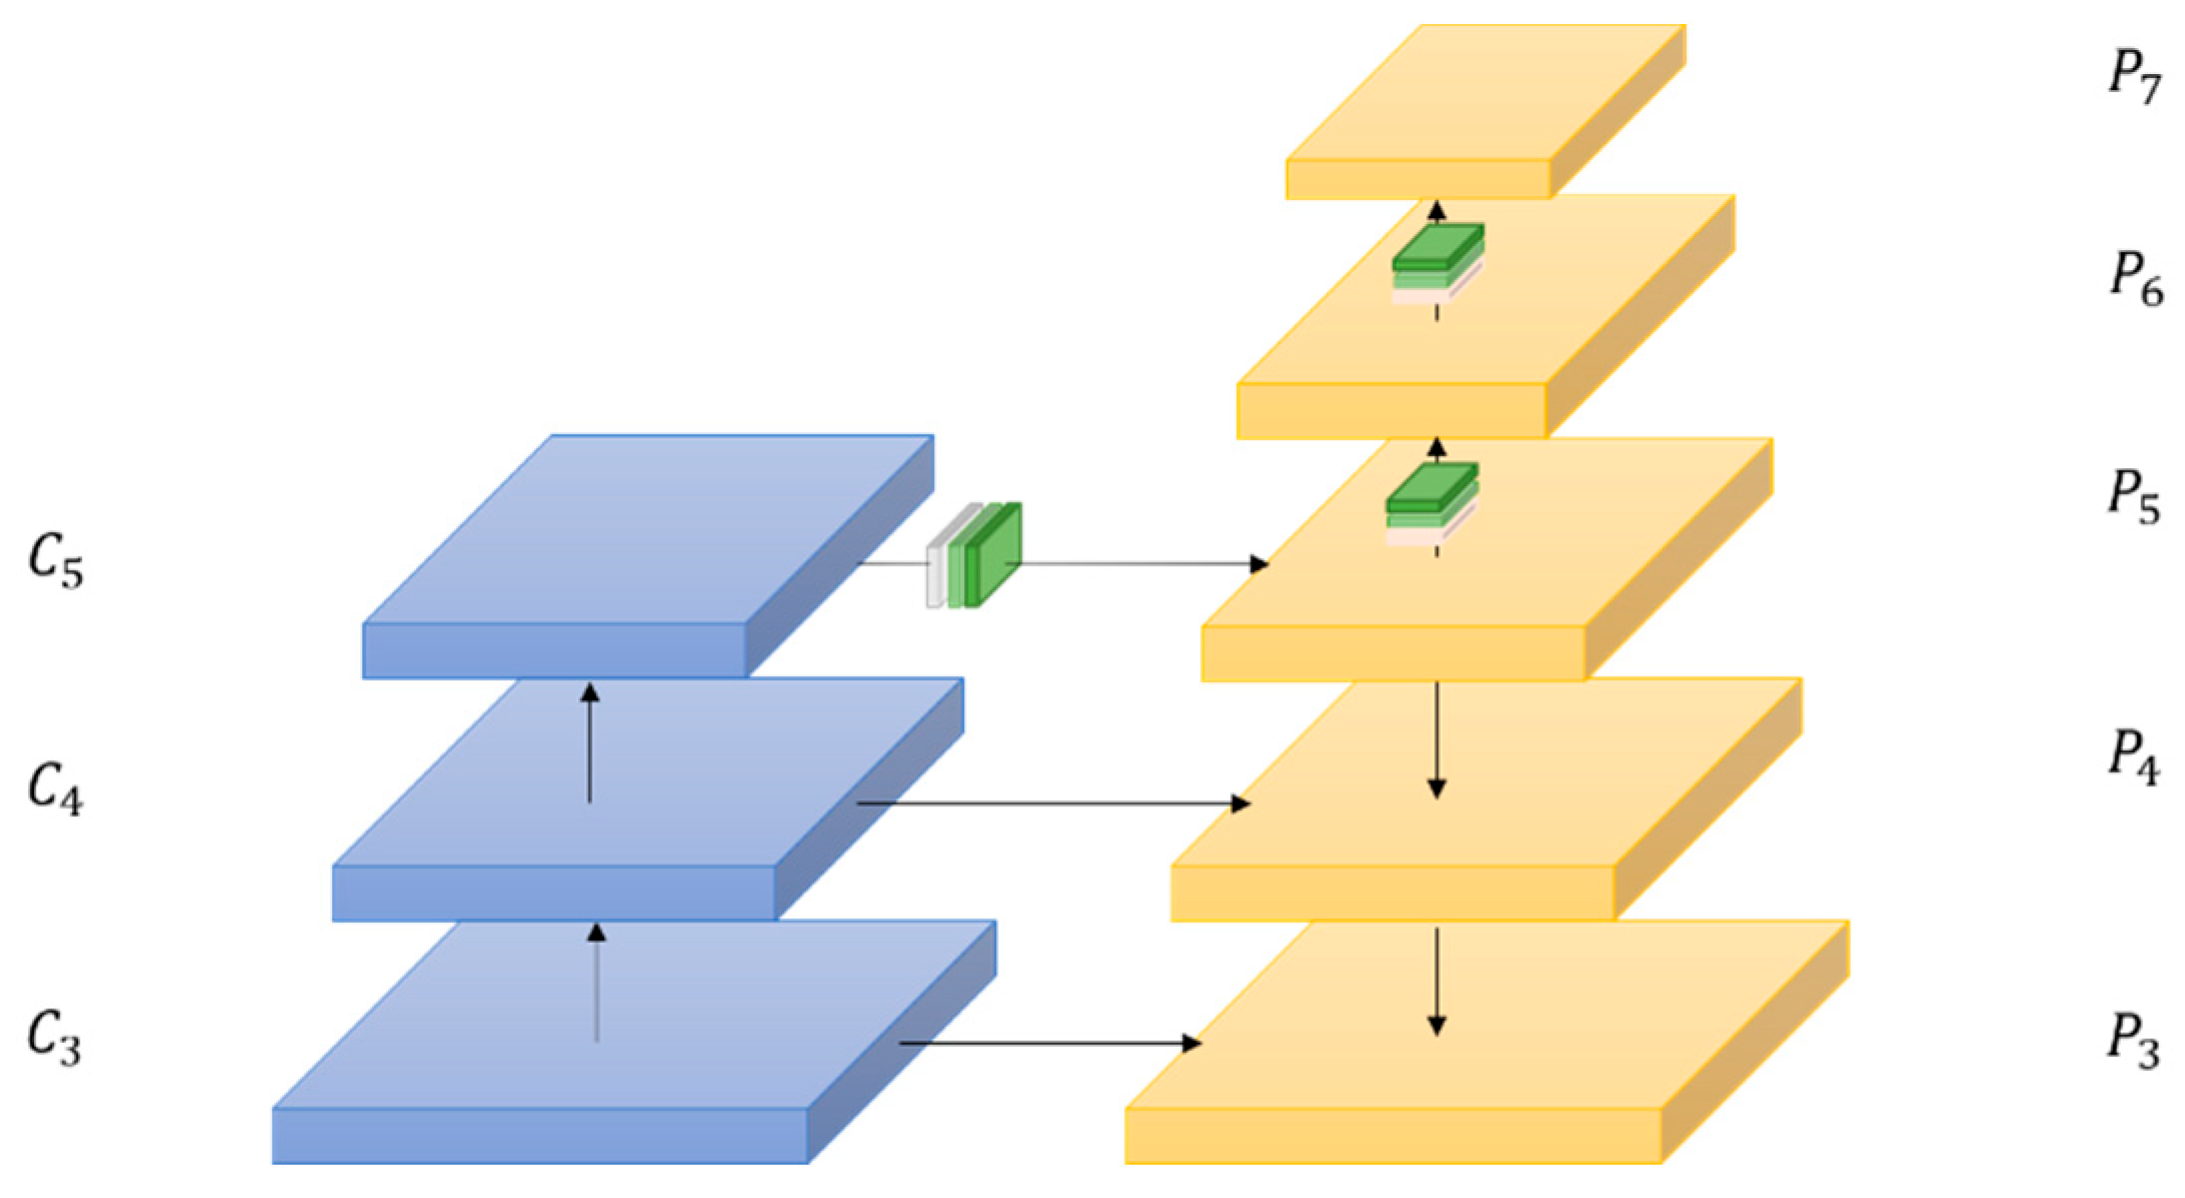
3.2. Feature Extraction Network

As shown in Figure 3, the feature extraction network of FCOS uses a backbone network plus FPN [19], and the backbone network uses ResNet [20] to extract the features. C 3 , C 4 and   C 5 are the feature maps generated by the backbone network. In the part of FPN, there are five different scales of layers: P 3 , P 4 , P 5 , P 6 , and P 7 . Each layer detects targets of different scale sizes, which means the network can detect multi-scale targets. As shown in Figure 3, the convolution is used to create P 3 , P 4 , and P 5 from   C 3 , C 4 and C 5 . P 6 and P 7 are produced by P 5 and P 6 through convolution with the stride being 2. The   P i layer detects the target that satisfies the condition, and the condition is defined as follows:
m a x l * , r * , t * , b * m i 1 , m i
l * , r * , t * , b * denotes the distance between the current pixel point and the boundary of the bounding box, m i 1 , m i is the range that feature layer i needs to regress, and m 2 , m 3 , m 4 , m 5 , m 6 and m 7 are set as 0, 64, 128, 256, 512 and , respectively.
Each feature map point x , y will be transferred to the original image as s 2 + x s , s 2 + y s . If the point x , y is included within a ground-truth box, it would be taken as a positive sample, otherwise, it would be considered a negative sample. However, all the points that fall into the ground-truth box are regarded as positive samples, which will lead to a large number of low-quality predicted anchors. As the pixel points located at the edge of the ground-truth box are often background, treating them as positive samples and predicting anchor boxes for regression will affect the accuracy of the model. FCOS introduces the center-ness to reduce the generation of the low-quality bounding box, the details of which have been explained in the previous subsection. However, this mechanism is used in pedestrian detection, which will complicate the simple problem and affect the performance of the model instead. The method proposed in this paper can improve this very well by enhancing the feature representation and speeding up the convergence of the model, the details of which are explained in the fourth section.

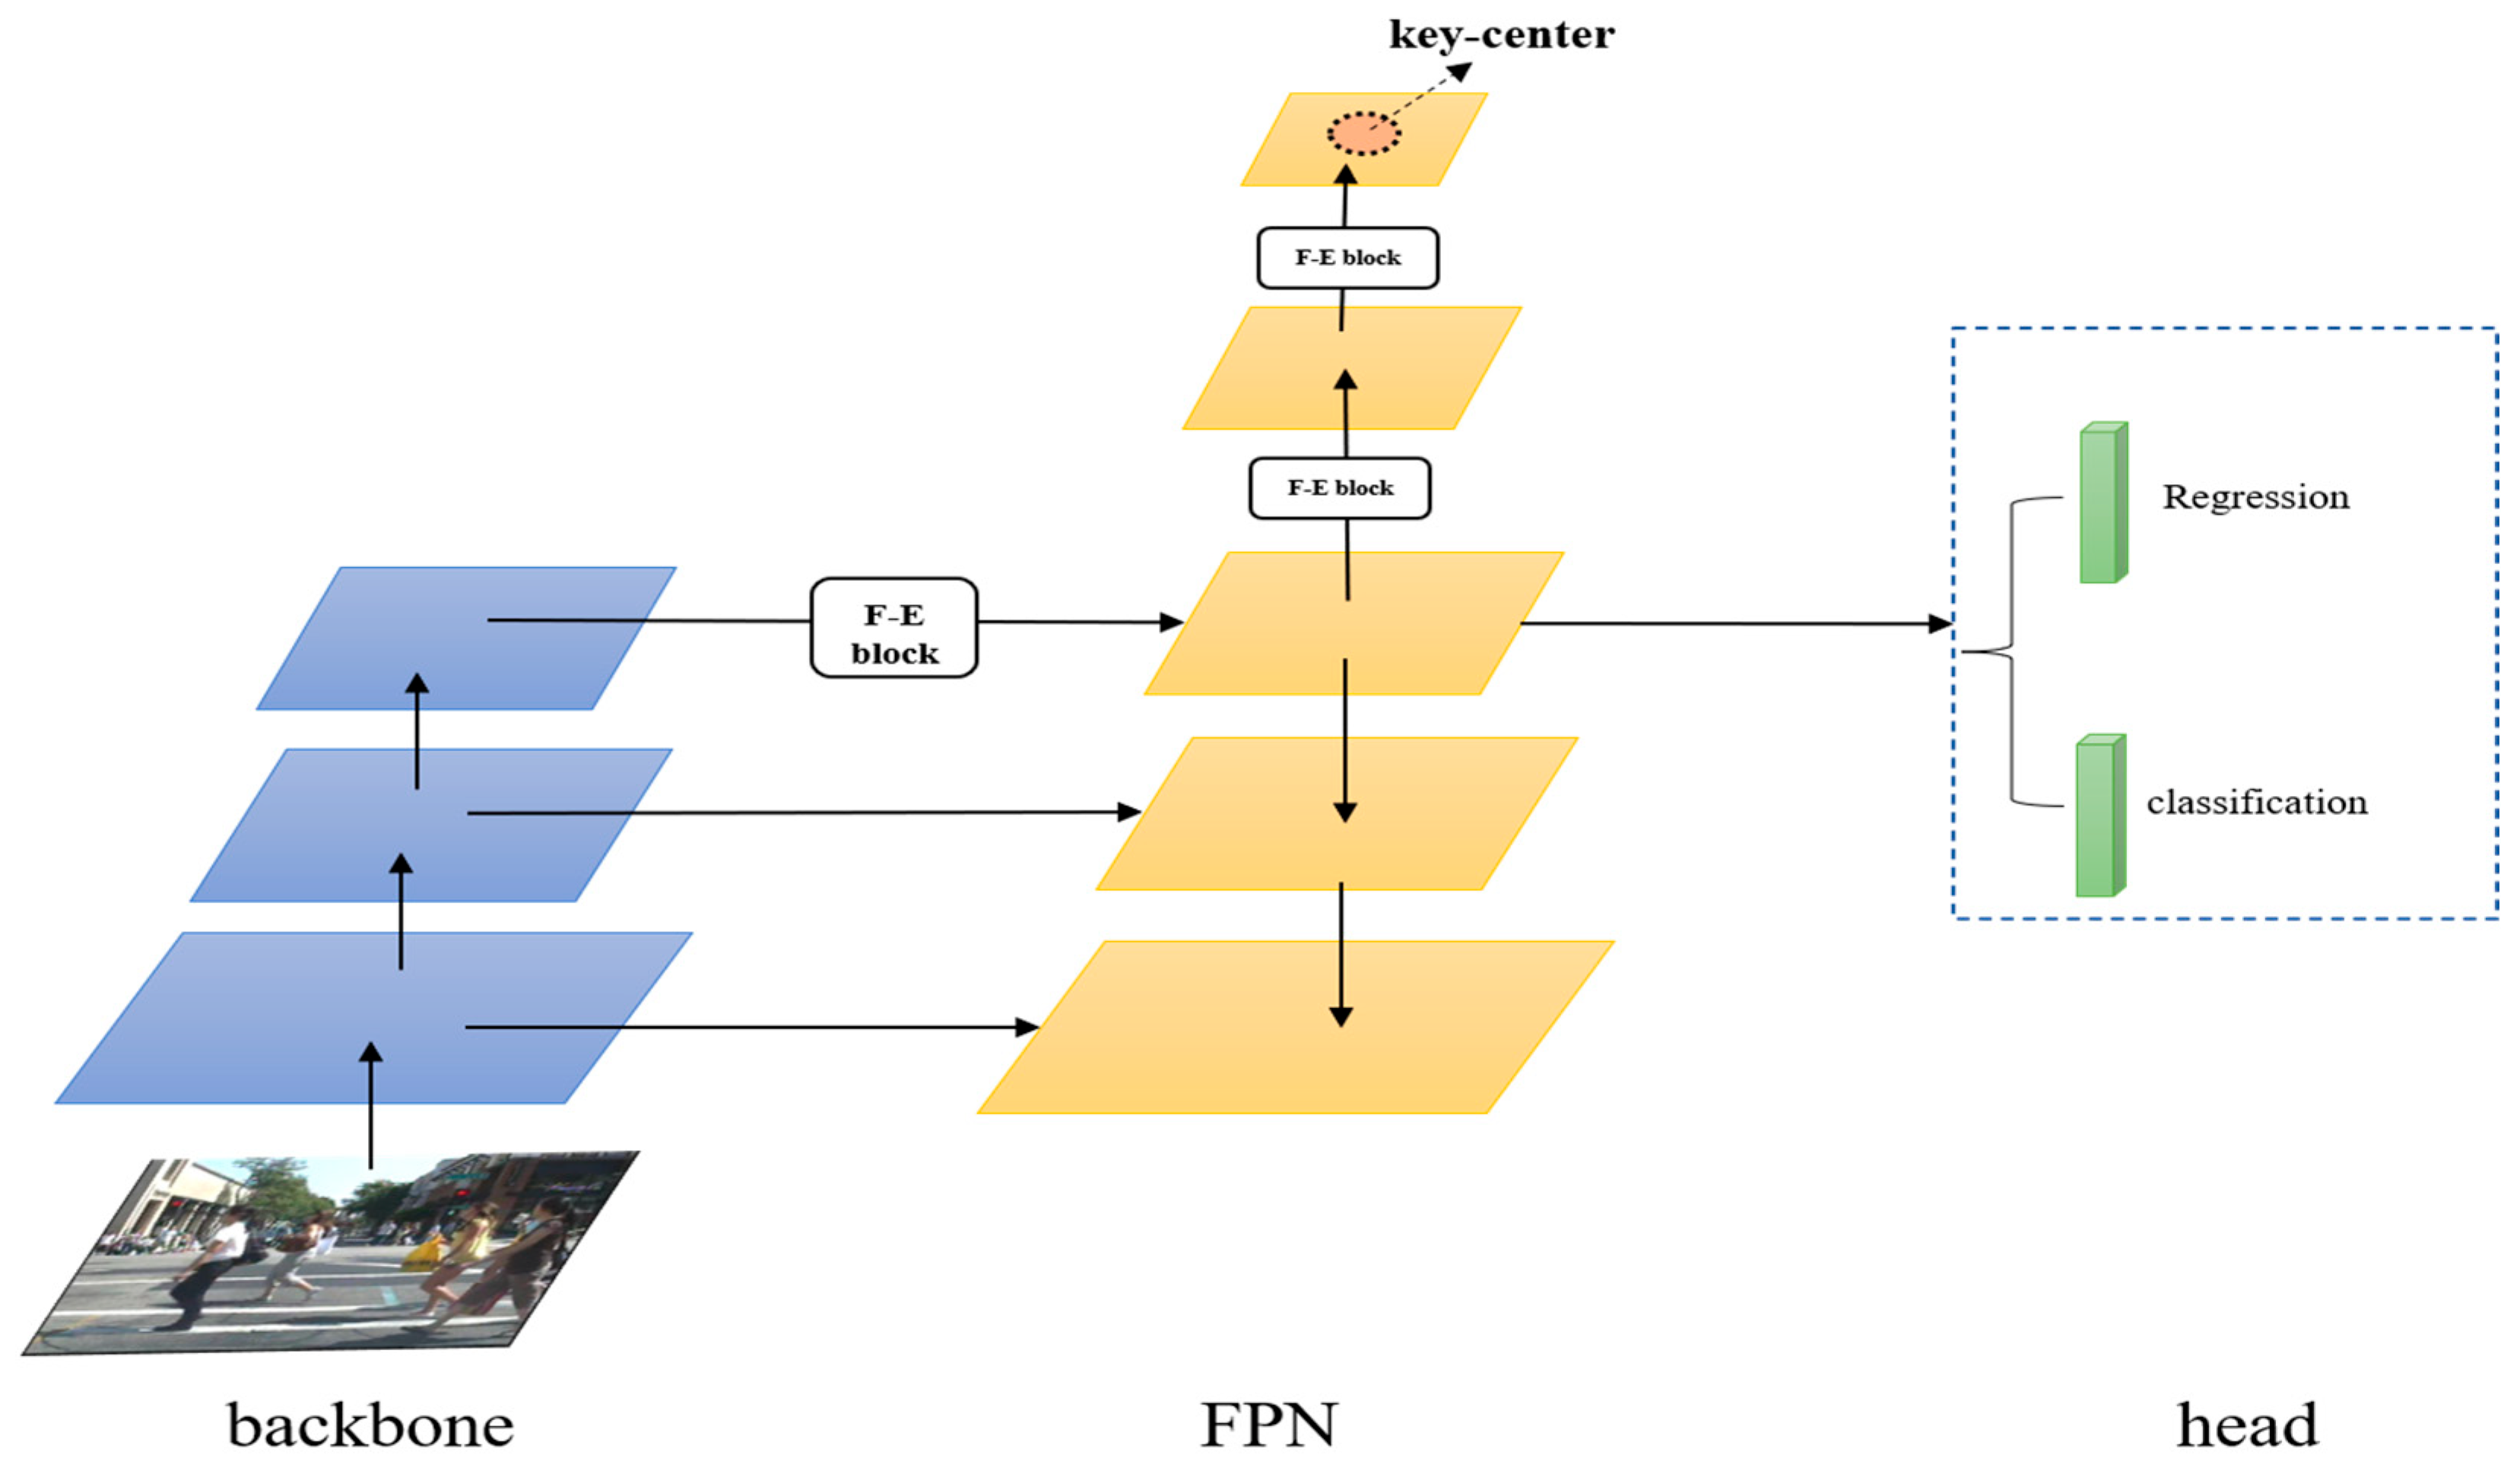
4. Improved Pedestrian Detection Method

In the previous section, we introduced the basic model of our method. If the point that is mapped back to the input images is in any ground-truth box, it will be taken into account as a positive sample. All positive samples are responsible for predicting the bounding box. To give different weights to the points at the edges and center, FCOS uses the center-ness branch to weight the samples, the weights of the central samples tend to be 1. Although this can somewhat mitigate the negative effect of the low-quality anchor on the model, it complicates a simple problem. The valid features likely overlap with the center of the bounding box, and the part at the edge has a high probability of being an invalid background. This is illustrated in Figure 4.
As can be seen from Figure 4, the useful part of the pedestrian (head, torso, etc.) is in the box’s center, and the edges of the box are background information; if the center-ness mechanism is still applied to each point, it will affect the model convergence speed and final performance. In this paper, we propose a method based on the anchor-free network. The method improves the FCOS algorithm by adding a feature-enhancement module and key-center region. The overall network model is shown in Figure 5.

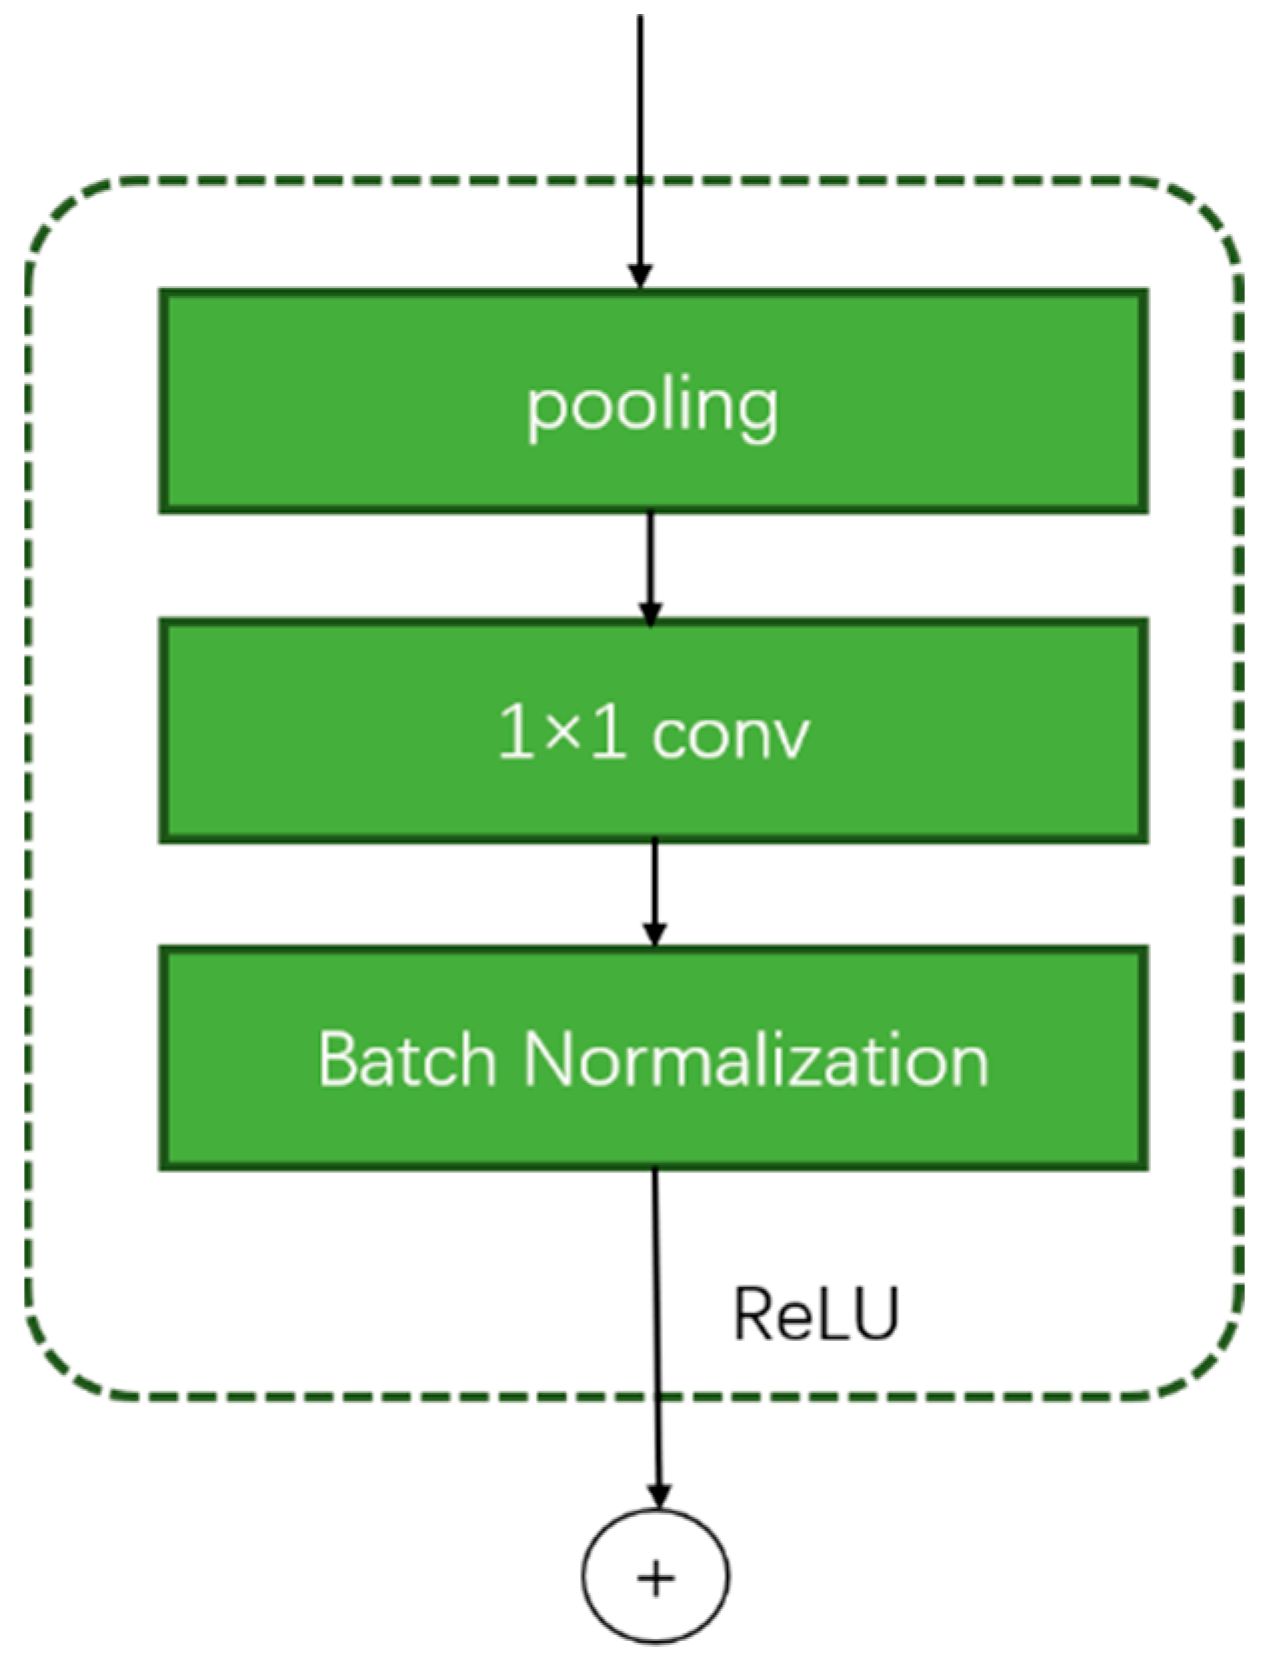
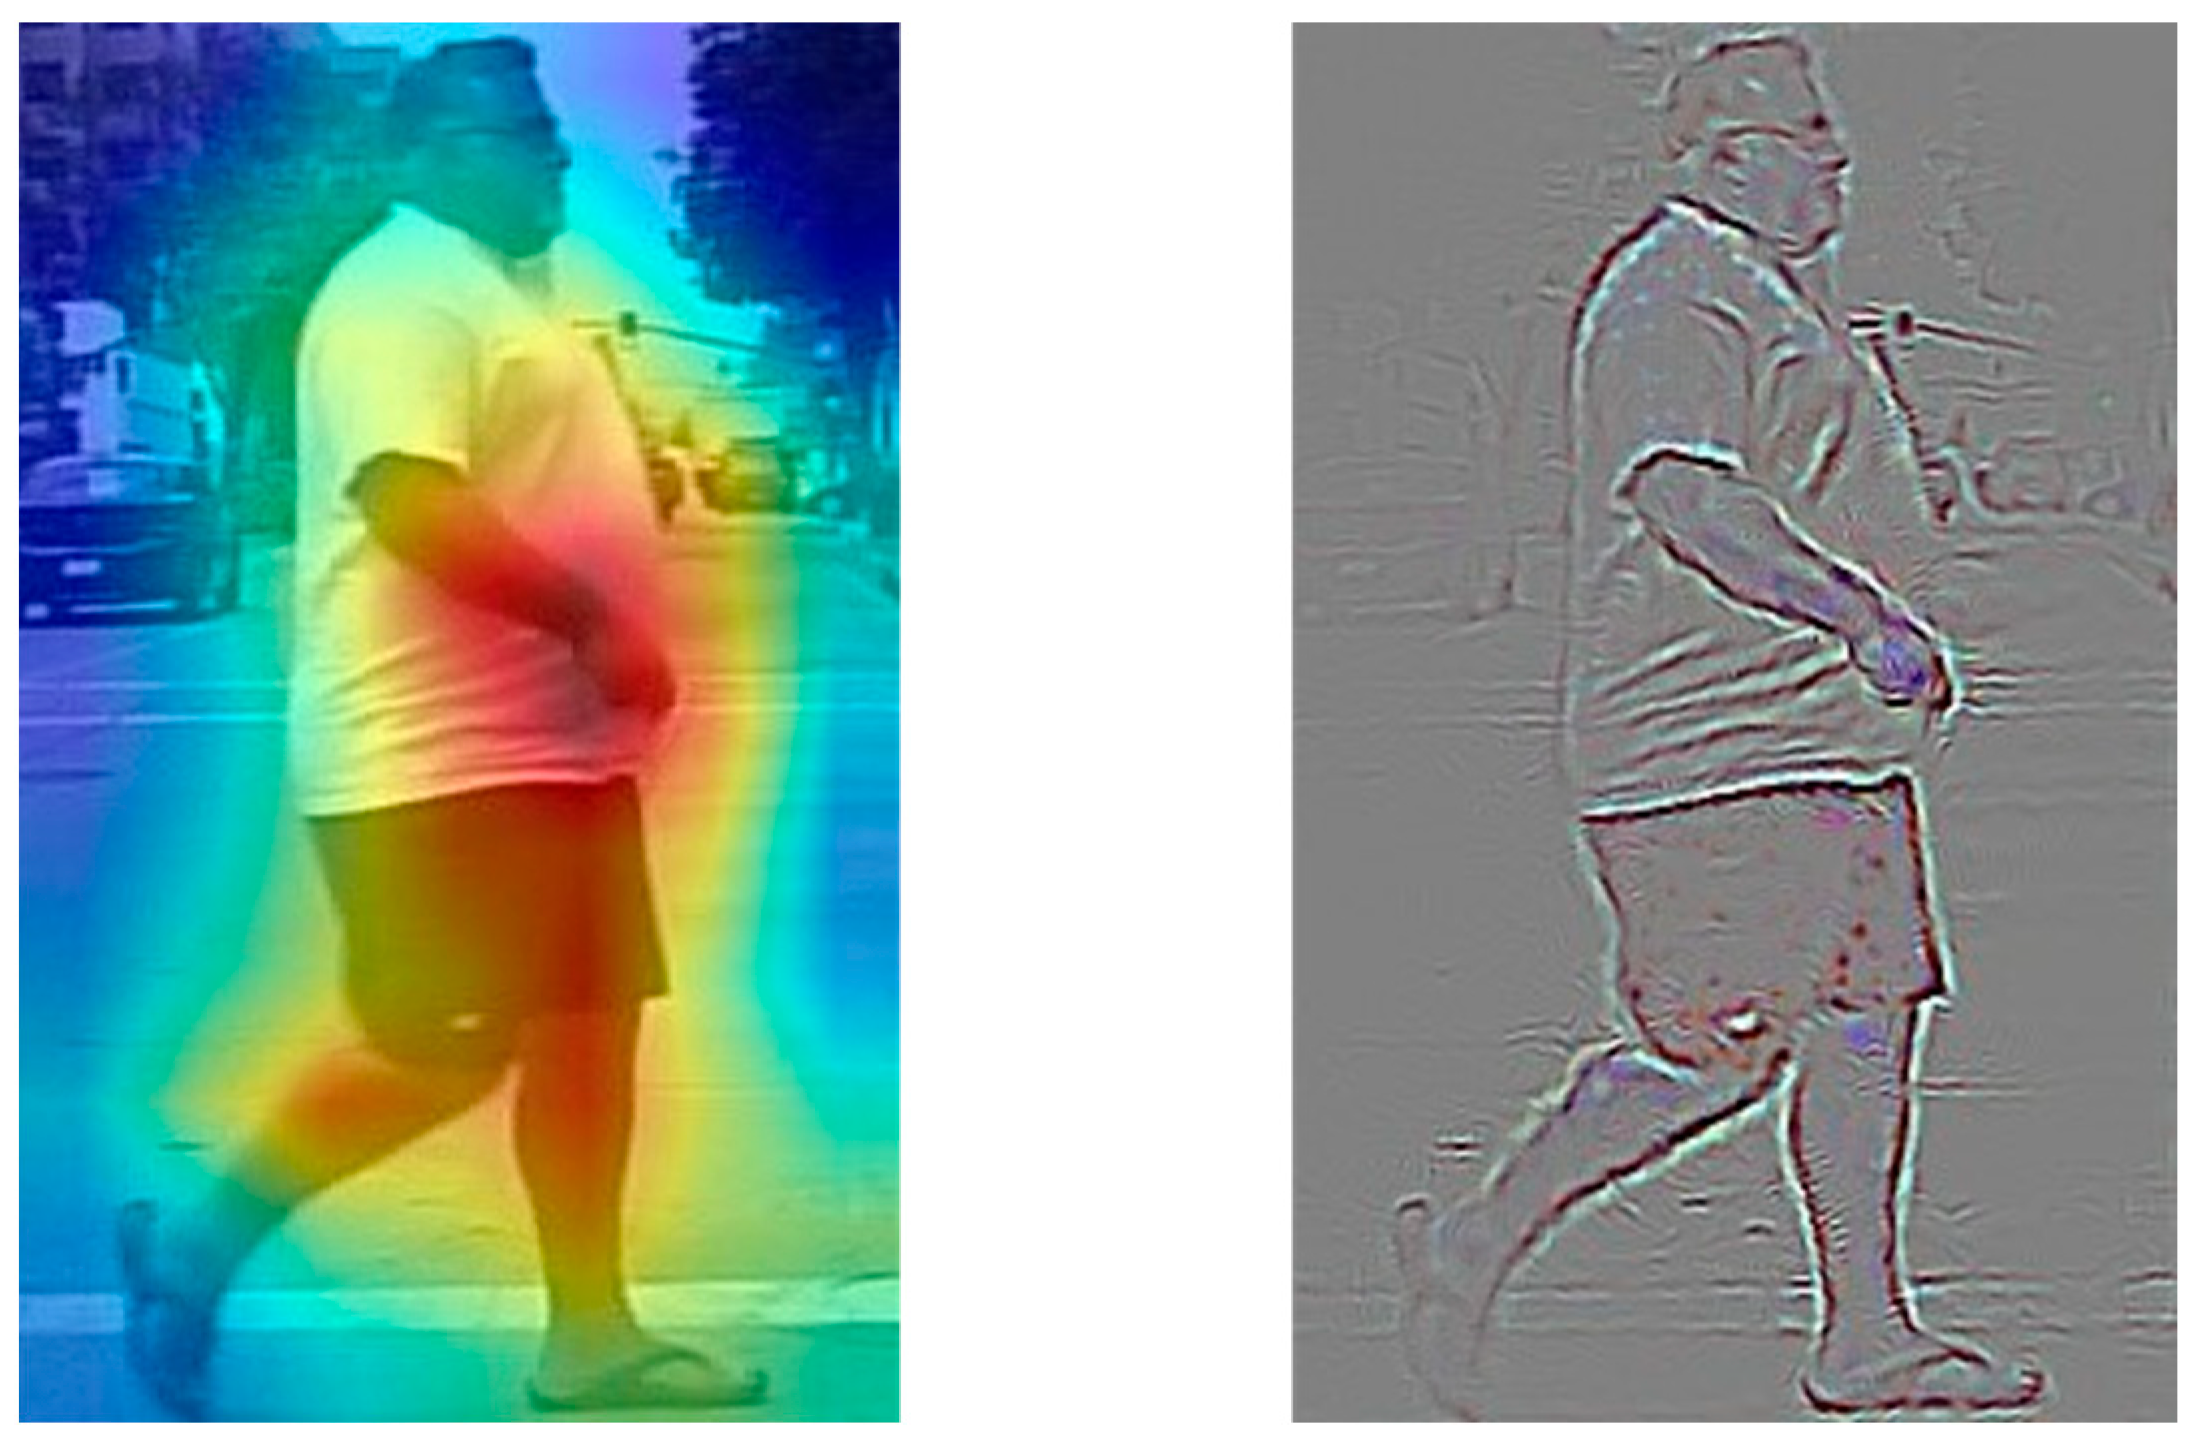
4.1. Feature Enhancement Module

The feature extracted by the convolution network not only incorporates spatial information but also includes channel information; a feature map is regarded as a channel. However, different features play different roles in the classification and localization of pedestrians. Deeper features contain more semantic information but lack spatial details, while shallow features have more texture detail information but less semantic information. Feature extraction is crucial for pedestrian detection. It plays a crucial role in classification and localization. We proposed a feature enhancement module in this paper.
The structure of the module we proposed in this paper is shown in Figure 6. The feature map is first subjected to a 2 × 2 max-pooling, which is a special operation in the convolutional neural network that serves to extract the key information in a certain region.
This approach is adopted because max-pooling can catch the crucial information of its region. After all, max-pooling takes the maximum value in the neighborhood region, which can reduce the error caused by the mean shift of the estimation due to the parameter error of the convolution layer and preserve more local details. The next part is 1 × 1 convolution, which plays the role of preserving the feature information that is extracted by max-pooling and changing the channel dimension. Batch Normalization avoids the problem of gradient disappearance through regularization. Subsequently, the activated information is added, point by point, with the feature map through the ReLU activation function to achieve the purpose of feature enhancement. In this paper, the F-E block is used for the P5, P6, and P7 layers. The improved feature network is shown in Figure 7.

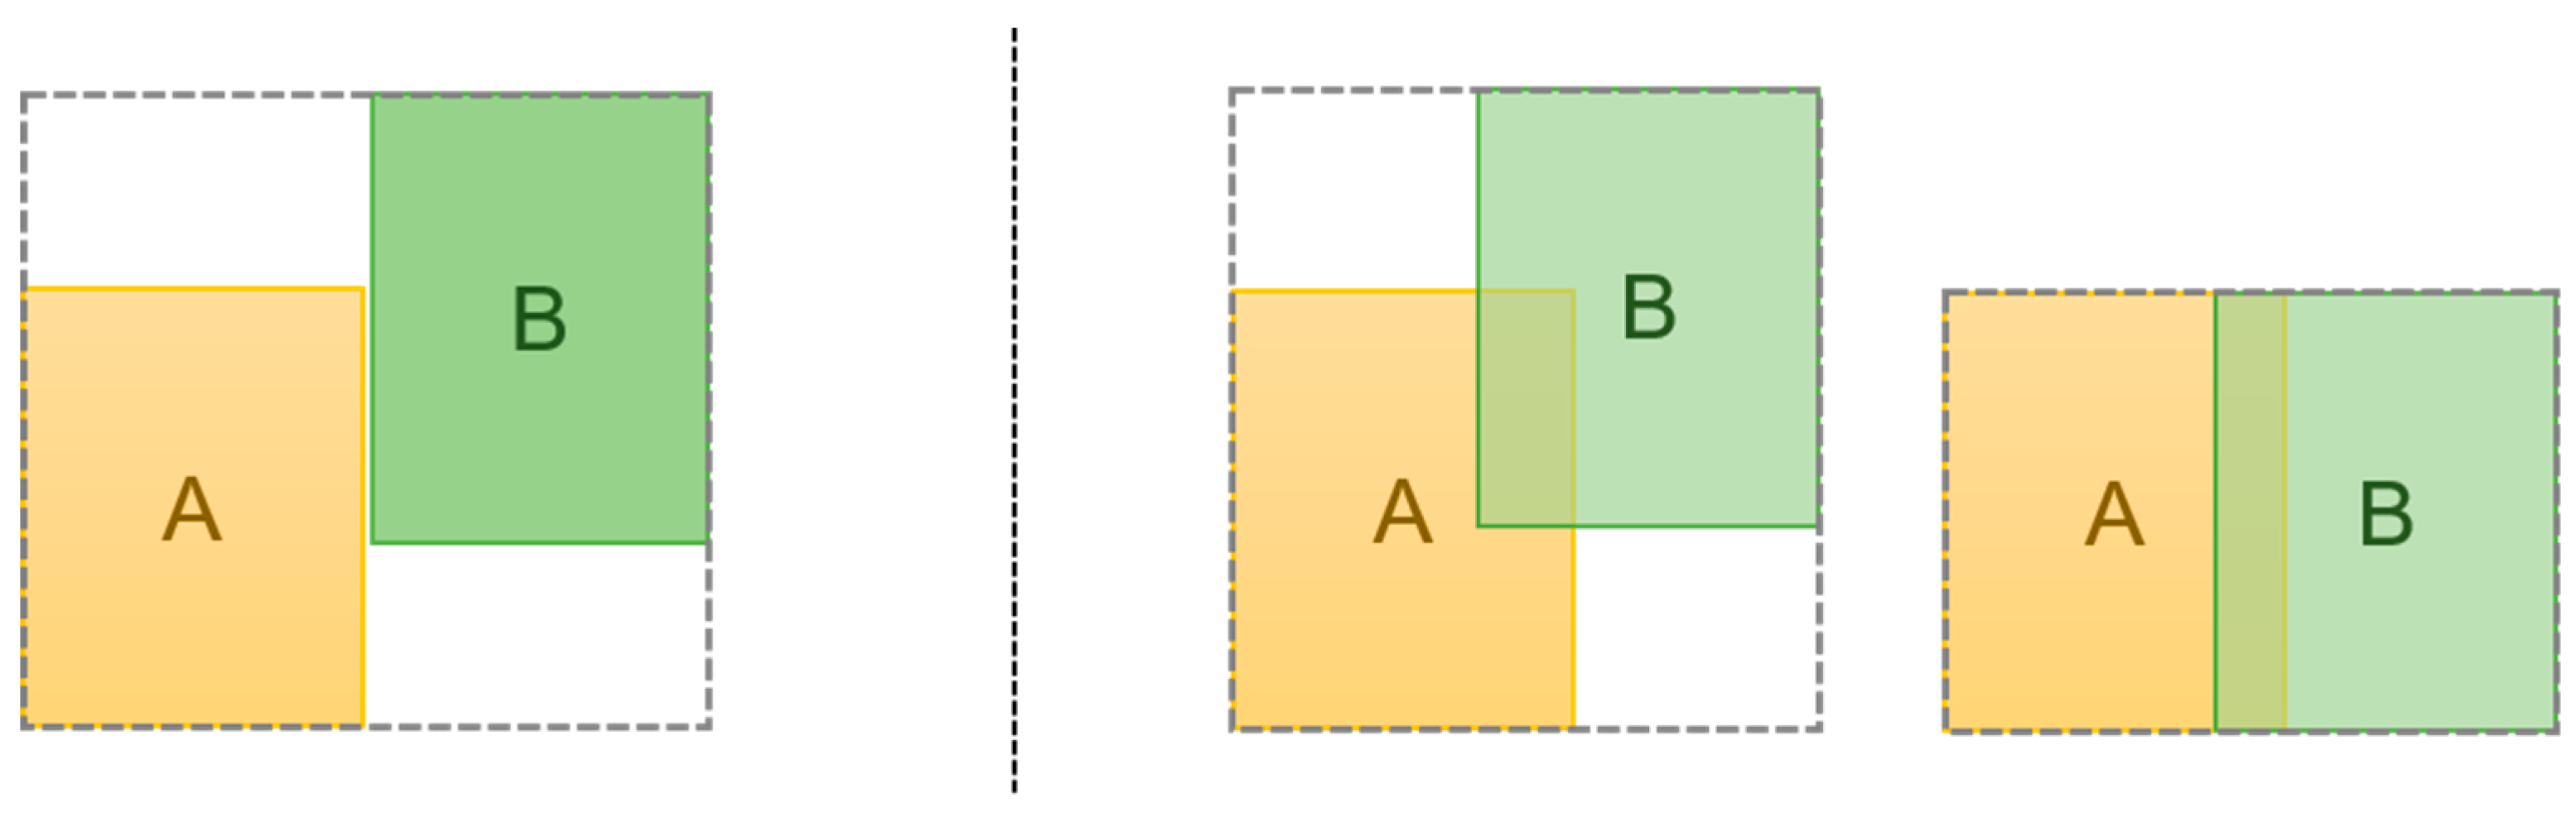
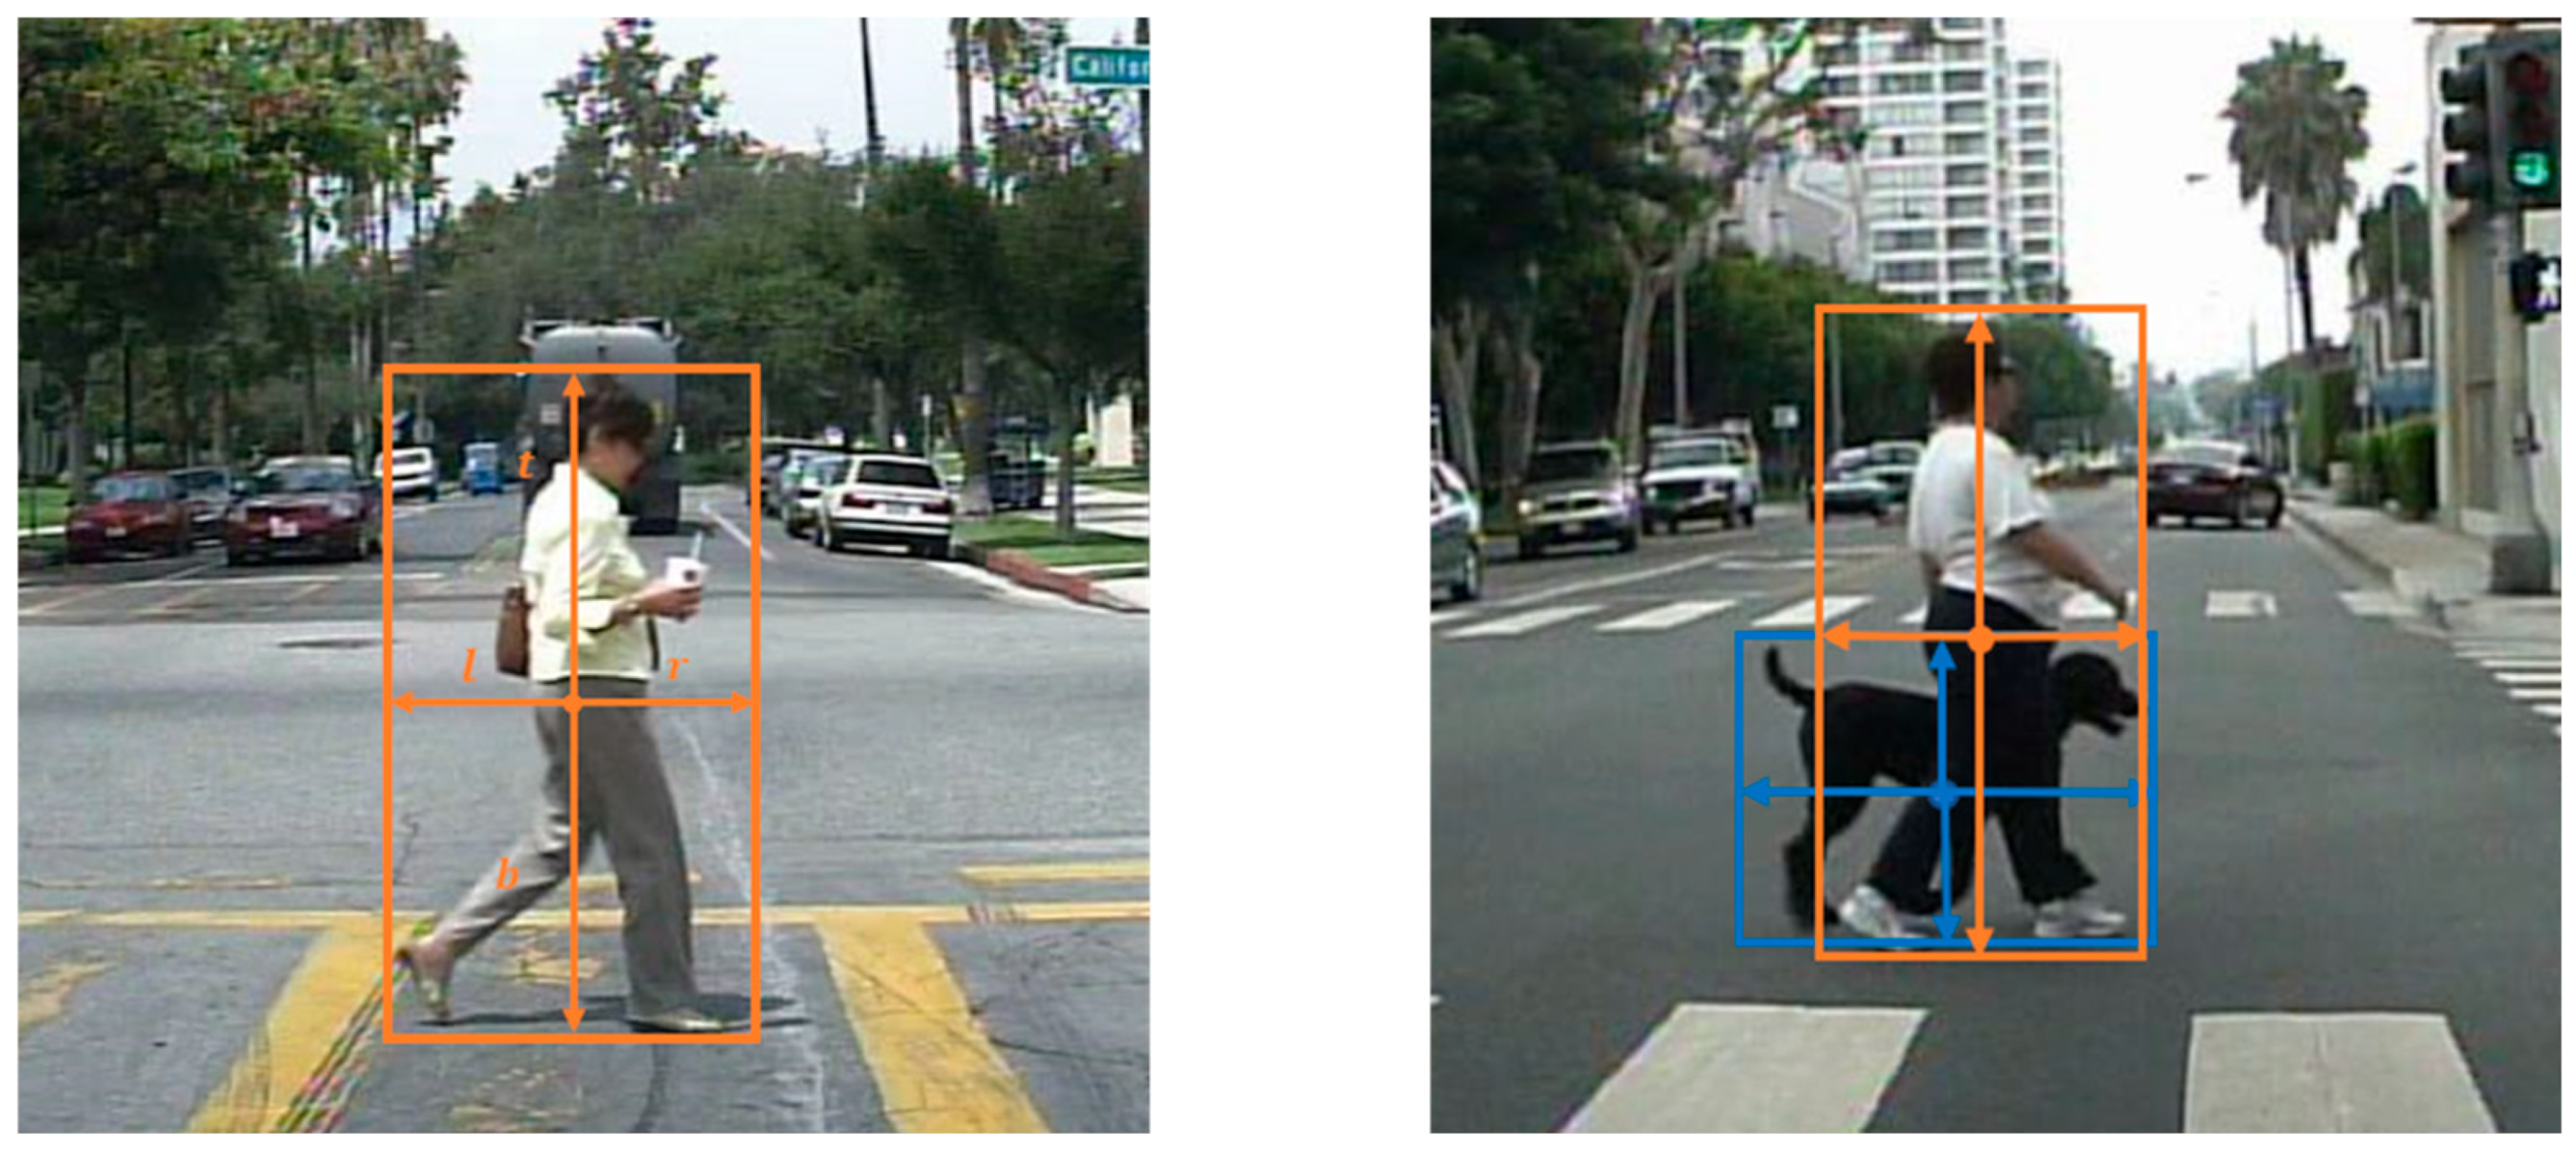
4.2. The Key-Center Region

In pedestrian detection, the effective part of the pedestrian features is likely the center of the image. In this case, using the center-ness mechanism to generate the predicted bounding box will have negative effects on the model. We propose a strategy called key-center to deal with the aforementioned concerns.
The key-center strategy is a result of the center of the box overlapping highly with the effective part of the pedestrian in most cases. This strategy uses the points located in the center region of the ground-truth box to learn the predicted bounding box, avoiding the use of center-ness to weigh all the points in the ground-truth bounding box. In the original center-ness strategy, it can be seen that the ground-truth box corresponds to a region on the feature map that is responsible for learning the candidate frame and weighting each pixel point by its center-ness.
The key-center strategy no longer treats all the pixel points located in the ground-truth box as positive samples. Only the points mapped to the original input image that fell into the key-center region will be treated as positive samples. Then, it will be responsible for learning the predicted bounding box. The key-center region is defined as a circular region with the center point of the ground-truth box as the center, and the radius is defined as:
r = m a x x 1 x 0 2 , y 0 y 1 2 / s
The   s denotes the stride size of the current feature map. The key-center region will be cropped to ensure that the original box is not exceeded.
As can be seen in Figure 8, the degree of the contribution of the pixel points and the ability to extract the features diminish from the center to the edge of the box. The effectiveness of the critical center region can also be demonstrated through experiments.

4.3. Loss Function

As mentioned in Section 3.1, the loss function of FCOS has two parts: classification and regression. The classification uses the focal loss function, and the regression loss uses the IoU loss [21] function. However, there are some obvious problems with the IoU loss function, which can be illustrated in Figure 9.
As shown in Figure 9, A and B mean two targets, and the overlapped part represents the intersection of them. The first problem is that the loss value cannot continue to optimize when the intersection of the regions is none. The loss function can be defined as:
I o U   L o s s = ln I n t e r s e c t i o n U n i o n
The intersection means the area where two targets overlap, and the union means all of the union areas of the two targets. Obviously, in the situation shown in Figure 9 (left), the gradient will be zero and will not be optimized. Another weakness can be shown in Figure 9 (right), in which the overlapped area is same, which means that the loss value of these two is the same. According to Equation (6), they will have the same loss, which means they will regress in the same way. However, the IoU cannot distinguish the difference between the two intersection cases, so the regression process cannot be optimized. To solve all the above problems of IoU Loss, Rezatofighi H et al. proposed GioU [22]; the core idea of GIoU is to find the smallest closed rectangle area that contains both targets, and then calculate the ratio of the area of C excluding two targets to the total rectangle area. Then, we can obtain GIoU by subtracting this value from the IoU of two targets:
G I o U = I o U C \ A B C
G I o U _ L o s s = 1 G I o U
For the problem that the optimization cannot continue when the IoU is 0, it can be seen from Equation (7) that the GIoU is not 0 when the IoU is 0, so the optimization can continue. GIoU focuses not only on overlapping regions but also on other non-overlapping regions, which can better reflect the degree of overlap between them.

5. Experiments

5.1. Dataset and Metrics

The Caltech pedestrian dataset was proposed by Dollár et al. [23] in 2009. It is one of the largest pedestrian detection datasets at present. The dataset is made up of about 10 h of video, captured from a vehicle moving through a regular traffic environment. The configuration of the video is 640 × 480 30 Hz and the total number of labeled pedestrians is approximately 350,000. It should be noted that, because most of the samples in the dataset are collected in consecutive frames, many of the frames have similar contents. Therefore, the training and testing sets in this paper are composed of frames taken from every 8 frames of the respective video clips. In the end, the dataset contains 15,274 images, there are 10,997 images in the training set, and the testing set has 4277 images.
The detection performance is generally judged by recall and precision. The classes of interest are generally classified as positive classes, while the other classes are classified as negative classes. The results predicted by the algorithm in the test set are classified into four cases, as follows.
  • TP: the positive class samples that are correctly predicted as positive samples.
  • FN: the positive class samples are predicted as negative samples.
  • FP: the negative class samples are predicted to be positive samples.
  • TN: the negative class samples are predicted as negative samples.
The accuracy rate is calculated as:
P = T P T P + F P
The recall rate is calculated as:
R = T P T P + F N
Other commonly used metrics are the miss detection rate (1-recall rate), F1 value, etc.
The metric of the generic target detection algorithm is generally Mean Average Precision (mAP), which is the rubric for detection on the PASCAL VOC dataset. It is computed by sorting the prediction frames in descending order of confidence and calculating the precision and recall at each confidence level, with the precision getting lower and the recall getting higher. Assuming that there are M positive cases in the category, there are M recall rates, respectively, 1/M, 2/M, …M/M. For each recall rate, find the maximum precision corresponding to it to obtain M precision rates, and calculate the average value to obtain the average precision of this category.
The metric for pedestrian detection was developed based on the above metrics. A coordinate plot of False Positive Per Window (FPPW)-miss rate (MR) for each pedestrian frame was used to evaluate the pedestrian detection algorithms, while, later, Dollar et al. found that the metric FPPW could not reasonably evaluate the merits of the algorithm and that the frame as the basic unit of the metric could not measure the detection error due to the incorrect detection of a certain part of the pedestrian body. Therefore, pedestrian detection algorithms are mostly evaluated using the False Positive Per Image (FPPI), proposed by Dollar et al. [24] instead of FPPW.
The FPPI-MR evaluation curve is plotted by ranking the confidence levels of the predicted pedestrian frames from highest to lowest, calculating the number of false positives and missed pedestrians for each confidence level, dividing the number of false positives by the total number of images to obtain the horizontal coordinate of the evaluation curve FPPI, and dividing the number of missed pedestrians by the total number to obtain the vertical coordinate of the curve MR, and plotting the evaluation curve in a logarithmic coordinate system.

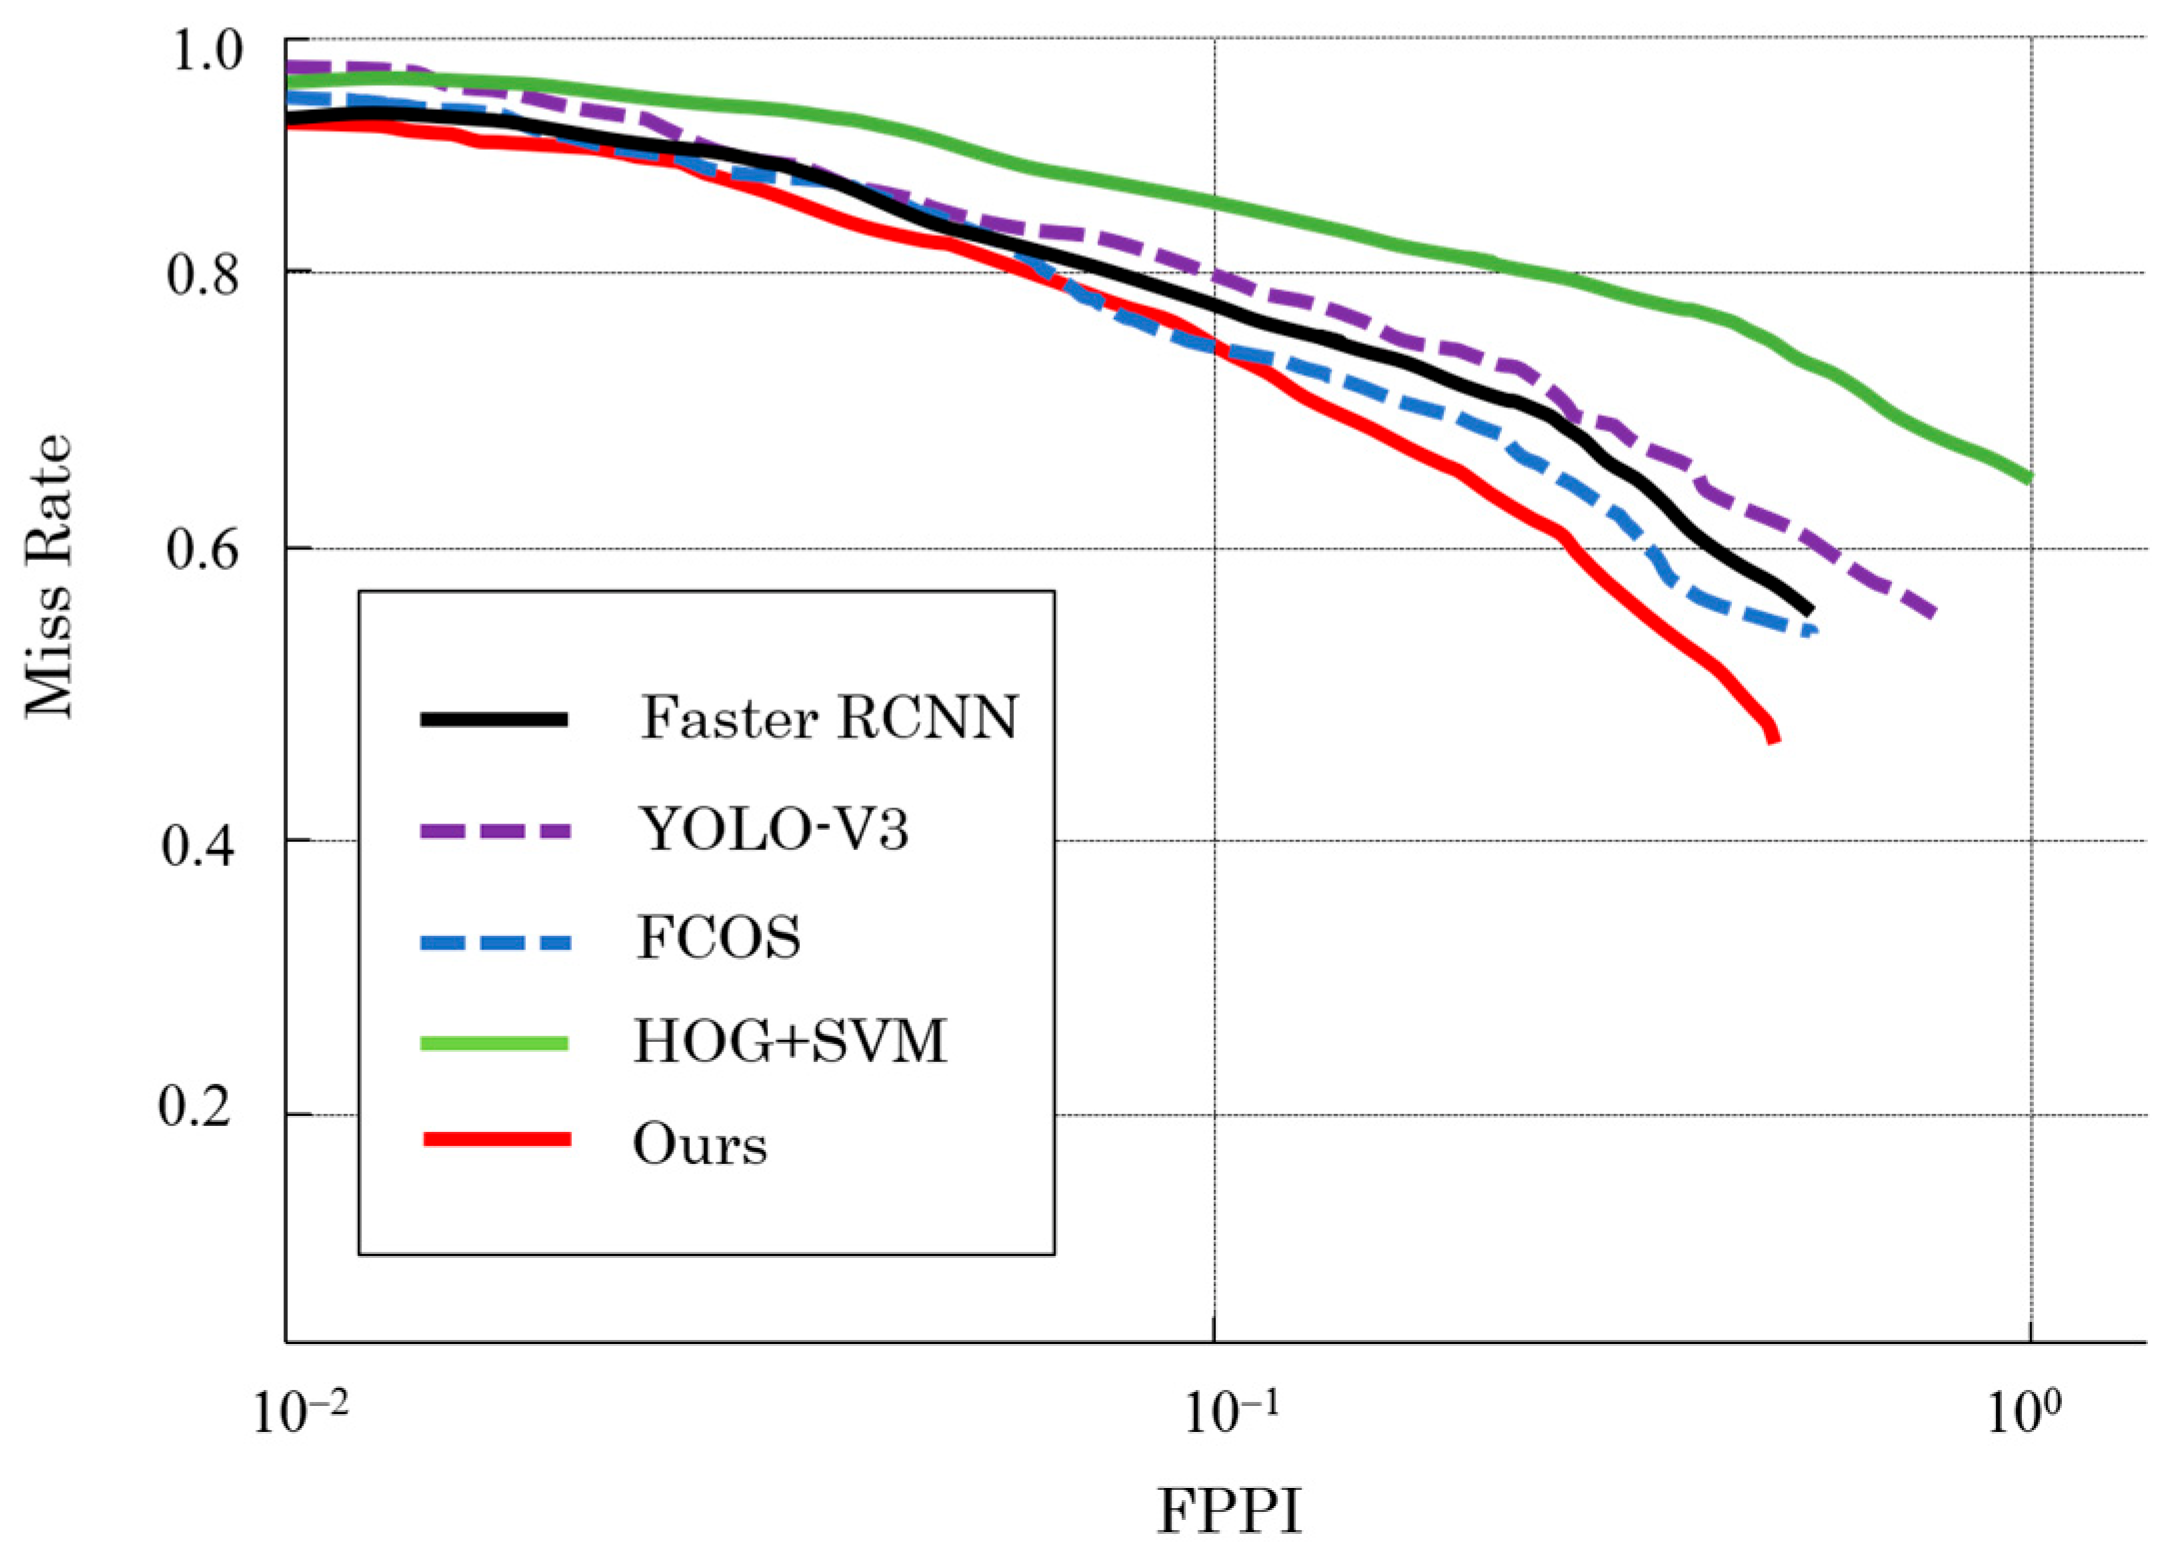
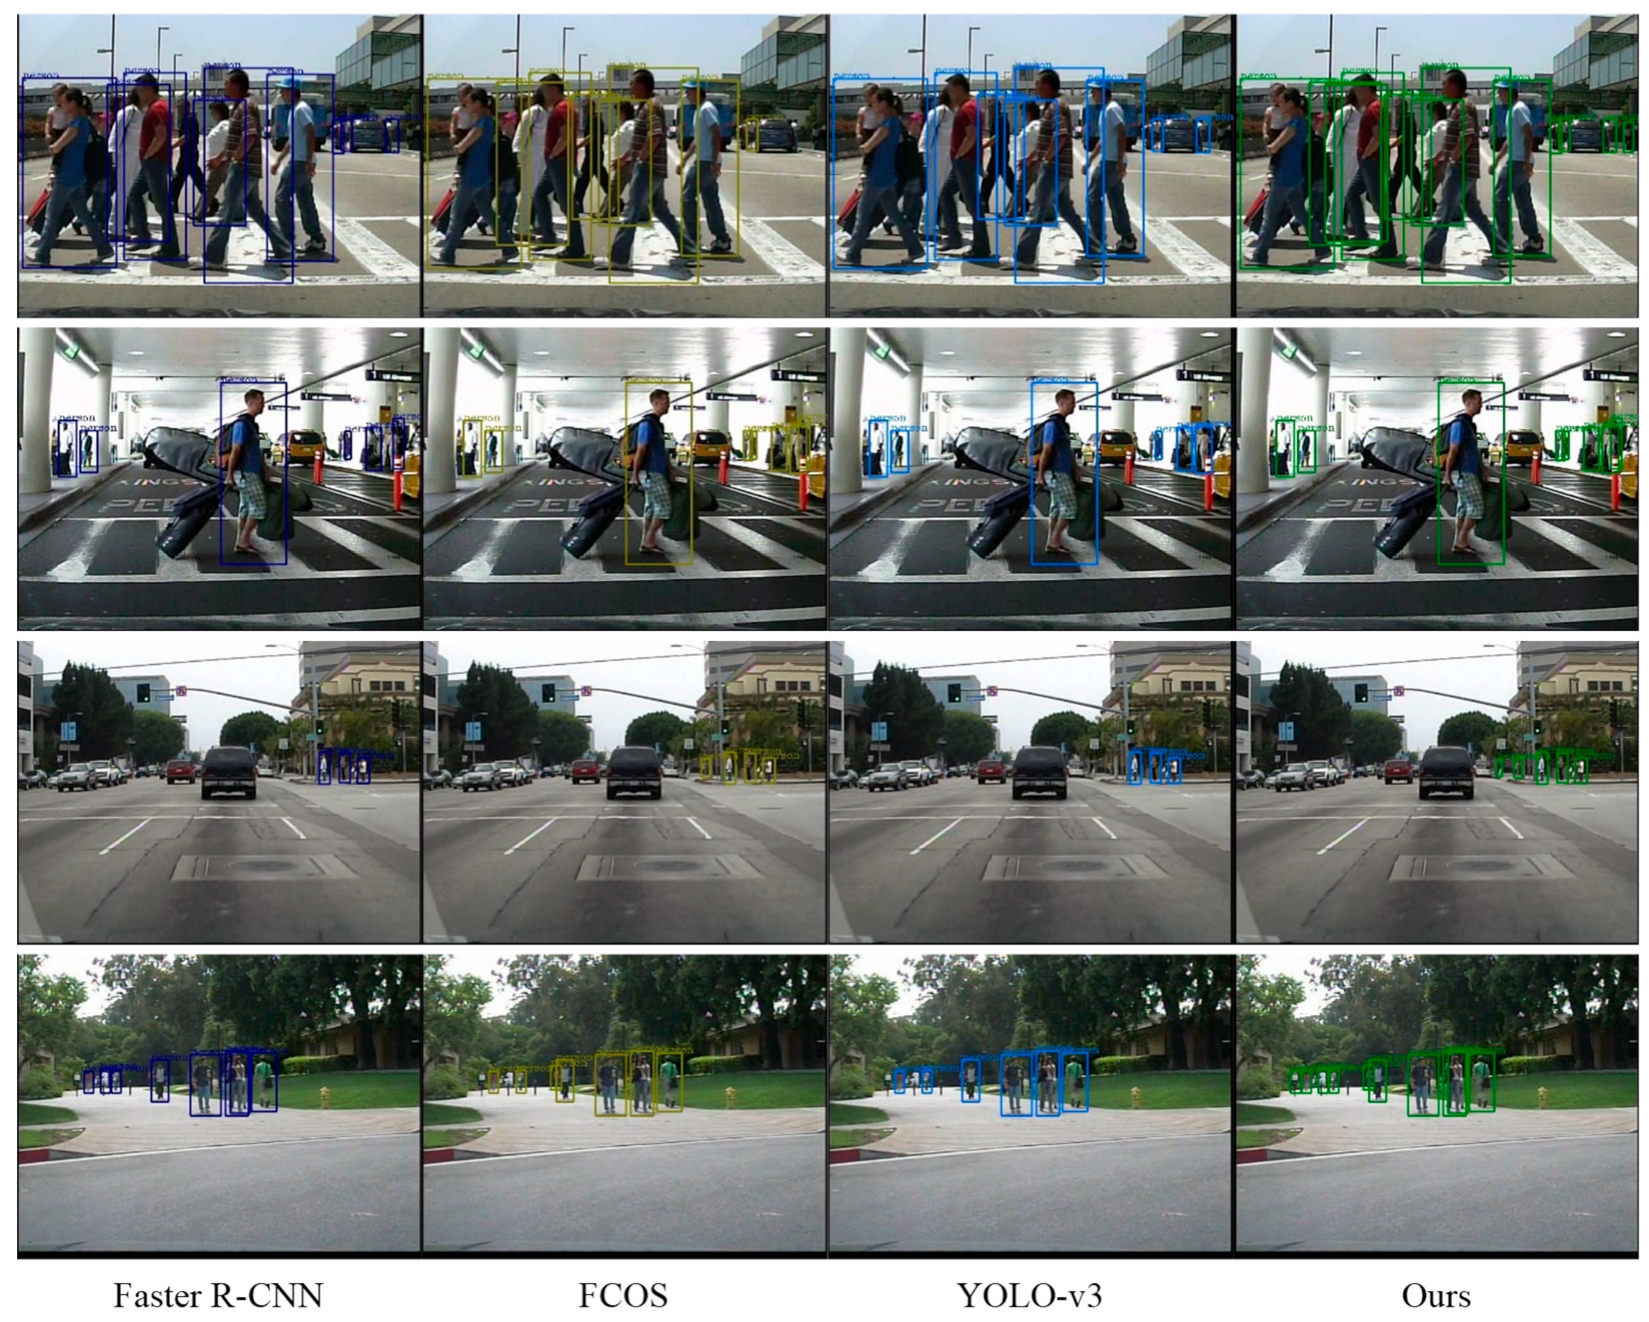
5.2. Analysis of Experimental Results

Implementation details. The configuration of the experiments in this paper is shown in Table 1. Among them, the parameters of the experiments are set as follows: initial learning rate = 0.002, batch size = 16, optimizer = Adam. The pre-trained ResNet50 is used as the backbone of the model.
This paper performs experiments on the Caltech pedestrian dataset, which is used to demonstrate the validity of each design. The results are shown in Table 2. The parameters set for each variable are the same to ensure impartiality in the evaluation. The original FCOS network with an AP of 87.36%, and with the addition of the feature enhancement method, the AP is improved by 2.16%. The detection model with the key center region judgment has a 1.71% improvement in AP compared to the detection model without this judgment method. After redesigning the loss function, the AP improves by 1.58%. After adding all the methods proposed in this paper, the AP increases by 6.8%, and the results demonstrate the efficacy of the proposed methods for pedestrian detection.
To demonstrate the effectiveness of the method in this paper, the classical HOG + SVM method and several other advanced algorithms in the field of pedestrian detection are selected for plotting the FPPI-MR evaluation curve, and the results are shown in Figure 10. The vertical coordinate of the evaluation curve is the leakage rate of the algorithm, and the horizontal coordinate is the false positive rate in an average image, which is the false detection rate of pedestrians, and it is more convincing to compare these two metrics together than to compare only one of them. According to the character of the FPPI-MR, the curve performs better when it nears the lower-left corner. We can see that the curve of our method has the best performance.
Table 3 displays the test results of the various approaches. The table shows that the method we proposed in this paper outperforms the original FCOS algorithm in terms of the AP and recall. In comparison to Faster R-CNN and YOLO-v3, the performance of our method is still good. Although our method is lower than Faster R-CNN in recall value, our method has a higher AP value than Faster R-CNN. The comparison of different methods is shown in Figure 11.
It is seen that the method we proposed has a better performance than the other methods. Faster R-CNN and YOLO-v3 have some problems with missed detection and FCOS has some wrong detection results of the pedestrian.

6. Conclusions

In this paper, we propose a pedestrian detection method based on an anchor-free algorithm: first, the enhancement module FE-block is incorporated into the network of the feature extraction to improve the feature representation; second, the center-ness mechanism is modified to include the key-center region judgment to improve the model accuracy; third, the loss function is optimized to better fit the pedestrian detection. The results show that the AP value of the improved FCOS is improved from 87.36% to 94.16%. The FPPI-MR curve, one of the most important evaluation metrics in the field of pedestrian detection, is also chosen to evaluate the model and to compare it with other popular methods, and the method in this paper can achieve a highly competitive detection result. However, the method still needs improvement when dealing with changing scenes, such as environments with strong lighting changes, etc. How to further optimize the algorithm and improve its detection capability in complex scenes will be the focus of future research.

Author Contributions

Conceptualization, R.L.; Data curation, Y.Z.; Funding acquisition, R.L.; Methodology, Y.Z.; Project administration, R.L.; Software, R.L. and Y.Z.; Supervision, R.L.; Writing—Original draft preparation, Y.Z.; Writing—Review and editing, R.L. All authors have read and agreed to the published version of the manuscript.

Funding

This research was funded by National Natural Science Foundation of China, grant no. 62161020.

Data Availability Statement

Not applicable.

Conflicts of Interest

The authors declare no conflict of interest.

References

  1. Bansod, S.; Nandedkar, A. Crowd anomaly detection and localization using histogram of magnitude and momentum. Vis. Comput. 2020, 36, 609–620. [Google Scholar] [CrossRef]
  2. Gray, D.; Tao, H. Viewpoint invariant pedestrian recognition with an ensemble of localized features. In Proceedings of the 10th European Conference on Computer Vision, Marseille, France, 12–18 October 2008; Springer: Berlin/Heidelberg, Germany, 2008; pp. 262–275. [Google Scholar] [CrossRef]
  3. Dalal, N.; Triggs, B. Histograms of oriented gradients for human detection. In Proceedings of the 2005 IEEE Computer Society Conference on Computer Vision and Pattern Recognition, San Diego, CA, USA, 20–25 June 2005; pp. 886–893. [Google Scholar] [CrossRef]
  4. Felzenszwalb, P.; McAllester, D.; Ramanan, D. A discriminatively trained, multiscale, deformable part model. In Proceedings of the IEEE Conference on Computer Vision and Pattern Recognition, Anchorage, AK, USA, 23–28 June 2008; pp. 1–8. [Google Scholar] [CrossRef]
  5. Girshick, R.; Donahue, J.; Darrell, T.; Malik, J. Rich feature hierarchies for accurate object detection and semantic segmentation. In Proceedings of the IEEE Conference on Computer Vision and Pattern Recognition, Columbus, OH, USA, 23–28 June 2014; pp. 580–587. [Google Scholar] [CrossRef]
  6. Girshick, R. Fast r-cnn. In Proceedings of the IEEE International Conference on Computer Vision, Washington, DC, USA, 7–13 December 2015; pp. 1440–1448. [Google Scholar] [CrossRef]
  7. Ren, S.; He, K.; Girshick, R.; Sun, J. Faster R-CNN: Towards Real-Time Object Detection with Region Proposal Networks. IEEE Trans. Pattern Anal. Mach. Intell. 2017, 39, 1137–1149. [Google Scholar] [CrossRef]
  8. Redmon, J.; Divvala, S.; Girshick, R.; Farhadi, A. You only look once: Unified, real-time object detection. In Proceedings of the IEEE Conference on Computer Vision and Pattern Recognition, Las Vegas, NV, USA, 27–30 June 2016; pp. 779–788. [Google Scholar] [CrossRef]
  9. Liu, W.; Anguelov, D.; Erhan, D.; Szegedy, C.; Reed, S.; Fu, C.Y.; Berg, A.C. Ssd: Single shot multibox detector. In Proceedings of the European Conference on Computer Vision, Amsterdam, The Netherlands, 11–14 October 2016; pp. 21–37. [Google Scholar] [CrossRef]
  10. Tian, Z.; Shen, C.; Chen, H.; He, T. Fcos: Fully convolutional one-stage object detection. In Proceedings of the IEEE/CVF International Conference on Computer Vision, Seoul, Republic of Korea, 27–28 October 2019; pp. 9627–9636. [Google Scholar] [CrossRef]
  11. Lowe, D.G. Distinctive image features from scale-invariant keypoints. Int. J. Comput. Vis. 2004, 60, 91–110. [Google Scholar] [CrossRef]
  12. Ahonen, T.; Hadid, A.; Pietikainen, M. Face description with local binary patterns: Application to face recognition. IEEE Trans. Pattern Anal. Mach. Intell. 2016, 28, 2037–2041. [Google Scholar] [CrossRef]
  13. Viola, P.; Jones, M. Rapid object detection using a boosted cascade of simple features. In Proceedings of the 2001 IEEE Computer Society Conference on Computer Vision and Pattern Recognition, Kauai, HI, USA, 8–14 December 2001; pp. 511–518. [Google Scholar] [CrossRef]
  14. Zheng, C.H.; Pei, W.J.; Yan, Q.; Chong, Y.W. Pedestrian detection based on gradient and texture feature integration. Neurocomputing 2017, 228, 71–78. [Google Scholar] [CrossRef]
  15. Zhang, S.; Benenson, R.; Schiele, B. Citypersons: A diverse dataset for pedestrian detection. In Proceedings of the IEEE Conference on Computer Vision and Pattern Recognition, Honolulu, HI, USA, 21–26 July 2017; pp. 3213–3221. [Google Scholar] [CrossRef]
  16. Song, T.; Sun, L.; Xie, D.; Sun, H.; Pu, S. Small-scale pedestrian detection based on topological line localization and temporal feature aggregation. In Proceedings of the European Conference on Computer Vision, Munich, Germany, 8–14 September 2018; pp. 554–569. [Google Scholar] [CrossRef]
  17. Liu, W.; Liao, S.; Ren, W.; Hu, W.; Yu, Y. High-level semantic feature detection: A new perspective for pedestrian detection. In Proceedings of the IEEE/CVF Conference on Computer Vision and Pattern Recognition, Long Beach, CA, USA, 15–20 June 2019; pp. 5187–5196. [Google Scholar] [CrossRef]
  18. Huang, L.; Yang, Y.; Deng, Y.; Yu, Y. Densebox: Unifying landmark localization with end to end object detection. arXiv 2015, arXiv:1509.04874. [Google Scholar]
  19. Lin, T.Y.; Dollár, P.; Girshick, R.; He, K.; Hariharan, B.; Belongie, S. Feature pyramid networks for object detection. In Proceedings of the IEEE Conference on Computer Vision and Pattern Recognition, Honolulu, HI, USA, 21–26 July 2017; pp. 2117–2125. [Google Scholar]
  20. He, K.; Zhang, X.; Ren, S.; Sun, J. Deep residual learning for image recognition. In Proceedings of the IEEE Conference on Computer Vision and Pattern Recognition, Las Vegas, NV, USA, 27–30 June 2016; pp. 770–778. [Google Scholar] [CrossRef]
  21. Yu, J.; Jiang, Y.; Wang, Z.; Cao, Z.; Huang, T. Unitbox: An advanced object detection network. In Proceedings of the 24th ACM International Conference on Multimedia, Amsterdam, The Netherlands, 15–19 October 2016; pp. 516–520. [Google Scholar] [CrossRef]
  22. Rezatofighi, H.; Tsoi, N.; Gwak, J.; Sadeghian, A.; Reid, I.; Savarese, S. Generalized intersection over union: A metric and a loss for bounding box regression. In Proceedings of the IEEE/CVF Conference on Computer Vision and Pattern Recognition, Long Beach, CA, USA, 15–20 June 2019; pp. 658–666. [Google Scholar] [CrossRef]
  23. Dollár, P.; Wojek, C.; Schiele, B.; Perona, P. Pedestrian detection: A benchmark. In Proceedings of the 2009 IEEE Conference on Computer Vision and Pattern Recognition, Miami, FL, USA, 20–25 June 2009; pp. 304–311. [Google Scholar] [CrossRef]
  24. Dollár, P.; Wojek, C.; Schiele, B.; Perona, P. Pedestrian detection: An evaluation of the state of the art. IEEE Trans. Pattern Anal. Mach. Intell. 2011, 34, 743–761. [Google Scholar] [CrossRef]
Figure 1. FCOS overall structure.
Information 14 00123 g001
Figure 2. The left image shows single-objective regression, (l, t, r, b) means the distance from the center point to the bounding box. The right plot shows multi-objective regression. When points fall into the overlapping area, it might be difficult to determine which box should regress.
Information 14 00123 g002
Figure 3. FCOS feature extraction network.
Information 14 00123 g003
Figure 4. Valid information (center of the bounding box) and background information (edge of the bounding box).
Information 14 00123 g004
Figure 5. Structure of pedestrian detection model based on feature enhancement and multi-scale detection. The backbone is ResNet, while the feature network is a multi-scale feature pyramid network. The F-E block means feature-enhancement module, and the key-center region is also added to the feature network. The detection head is shared by different feature levels.
Information 14 00123 g005
Figure 6. Feature enhancement module.
Information 14 00123 g006
Figure 7. The multi-scale feature extraction network with FE-block module added.
Information 14 00123 g007
Figure 8. The left figure is a heat map of the pedestrian. The figure on the right shows the gradient diagram for a pedestrian. The two figures show that the intensity of the contribution of pedestrian features decreases from the center to the surroundings.
Information 14 00123 g008
Figure 9. The left image shows the situation where two targets are not overlapped, the overlapped area is none, while the value of IoU will be zero. As shown in the right image, we can see two overlapped situations in that targets have the same overlapped area. That means these targets have the same IoU loss values and will regress in the same way. Obviously, the left situation will encounter more difficulties than the right.
Information 14 00123 g009
Figure 10. FPPI-MR curve.
Information 14 00123 g010
Figure 11. Comparison of our method results with other methods on the Caltech pedestrian dataset.
Information 14 00123 g011
Table 1. Experimental environment configuration.
NamesRelated Configuration
Operating systemWindows 10
CPUIntel(R) Xeon(R) Gold 5218R
GPUTesla V100
GPU RAM/GB16
Table 2. Ablation experiments.
MethodAP
FCOS87.36
FCOS + FE89.52
FCOS + KeyCenter89.07
FCOS + GIoU88.94
FCOS + FE + KeyCenter92.04
FCOS + FE + KeyCenter + GIoU94.16
Table 3. The results of different models on test datasets.
MethodAP/%Recall/%
FCOS87.3670.32
YOLO-v380.7565.22
Faster R-CNN89.2272.65
Ours94.1671.58
Disclaimer/Publisher’s Note: The statements, opinions and data contained in all publications are solely those of the individual author(s) and contributor(s) and not of MDPI and/or the editor(s). MDPI and/or the editor(s) disclaim responsibility for any injury to people or property resulting from any ideas, methods, instructions or products referred to in the content.

