Article

Towards a Conceptual Framework for Data Management in Business Intelligence

by
Ramakolote Judas Mositsa
1,*,
John Andrew Van der Poll
2,* and
Cyrille Dongmo
1
1
Department of Computer Science, School of Computing, College of Science, Engineering and Technology (CSET), Science Campus, University of South Africa (Unisa), Johannesburg 1709, South Africa
2
Digital Transformation and Innovation, Graduate School of Business Leadership (SBL), Midrand Campus, University of South Africa (Unisa), Midrand 1686, South Africa
*
Authors to whom correspondence should be addressed.
Information 2023, 14(10), 547; https://doi.org/10.3390/info14100547
Submission received: 10 August 2023 / Revised: 12 September 2023 / Accepted: 27 September 2023 / Published: 6 October 2023
(This article belongs to the Special Issue Storage Method for Real-Time Big Data on the Internet of Things)

Abstract

:
Business intelligence (BI) refers to technologies, tools, and practices for collecting, integrating, analyzing, and presenting large volumes of information to enable improved decision-making. A modern BI architecture typically consists of a data warehouse made up of one or more data marts that consolidate data from several operational databases. BI further incorporates a combination of analytics, data management, and reporting tools, together with associated methodologies for managing and analyzing data. An important goal of BI initiatives is to improve business decision-making for organizations to increase revenue, improve operational efficiency, and gain a competitive advantage. In this article, we analyze qualitatively various prominent business intelligence (BI) frameworks in the literature and develop a comprehensive BI framework from these. Through the technique of qualitative propositions, we identify the properties, respective advantages, and possible disadvantages of the said BI frameworks to develop a comprehensive framework aimed mainly at data management, incorporating the advantages and eliminating the disadvantages of the individual frameworks. The BI landscape is vast, so as a limitation, we note that the new framework is conceptual; hence, no implementation or any quantitative measurement is performed at this stage. That said, our work exhibits originality since it combines numerous BI frameworks into a comprehensive framework, thereby contributing to conceptual BI framework development. As part of future work, the new framework will be formally specified, followed by a practical phase, namely, conducting case studies in the industry to assist companies in their BI applications.

1. Introduction

Data have become one of a company’s most valuable organizational resources, and the accuracy, timeliness, and cost-effectiveness of data and information are important for corporate success [1,2]. These have led to the development of various frameworks and methodologies for managing data in a BI environment. Arguably, the most reliable, economical, and widely used approach for data collection is an online survey to reach a larger audience. The said data are then analyzed, reported on, and presented to management to facilitate strategic decision-making [3]. Naturally, the structuring of the data collected during all three phases mentioned may impose challenges regarding the format and type of the data.
Operational BI, which differs from BI in such a way that is measured in real-time, means that the insights you gain have relevance now as opposed to BI, which may have a lag of several hours or even days depending on how and to whom the insights are, and it imposes several requirements on the BI architecture, and in particular on the back-end data integration processes. These include handling a much larger number and diversity of data sources and data types (unstructured and semi-structured formats, enterprise content, external data feeds, and other forms of streaming data), low latency requirements to support online decision-making, fast refresh cycles, more complex analytic and reporting tools, a larger number of data mart connections, 24 × 7 availability, and so forth.
The BI landscape is vast, and numerous BI frameworks have been developed and proposed in the literature. BI frameworks, or BI systems, refer to systems that include various software programs that aid with the organization and management of data and other valuable information within the organization. For the most part, these involve data mining, online processing, reporting, and querying [1,3]. Included in a modern BI system is a decision support system, which, in the context of BI, embodies a computerized system that facilitates decision-making within an organization. Its primary goal is to analyze more extensive data areas and compile such information, i.e., it is a data application that produces far-reaching data for an organization. Owing to the sheer size of the BI landscape, some of these frameworks constitute strict subsets of larger BI structures, for example, the data layer framework in references [1,3] discussed later in this article. Despite the advantages of specialization offered by these strict subset frameworks, the researchers believe that using numerous specialized BI frameworks in a company may lead to fragmentation and uncertainty, and a comprehensive framework should instead be developed. Such a framework would incorporate the desirable properties of the various (sub)frameworks while at the same time avoiding challenging aspects of the said frameworks.
The challenge of which BI sub-framework to utilize in an organization is isomorphic to the challenge of using theorem-proving software to reason about the properties of a system at the specification phase. Numerous reasoning assistants exist, each with their own set of advantages and disadvantages. One way to address this challenge was the development of a set of integrated reasoners under one umbrella, for example, the versatile Event-B/Roden suite of reasoners [4].
The layout of the article is as follows: Following the above introduction, the research questions and objectives underlying this research are formulated in Section 1.1. The research methodology used in this article is presented in Section 2, followed by a literature review of various BI frameworks in Section 3, culminating in a comprehensive framework as developed by the researchers in Section 4. A brief analysis and validation of the new framework are conducted in Section 5. Conclusions and future work in this area are presented in Section 6, followed by a list of references to conclude the article.

1.1. Research Questions (RQs) and Objective

The research questions posed in this work are:
  • What are some of the prominent BI (sub)frameworks? (RQ1)
  • What are the advantages and disadvantages of the said BI frameworks? (RQ2)
Our objective is to:
Develop a comprehensive BI framework that combines the advantages of the sub-frameworks and eliminates possible omissions from the individual sub-frameworks.

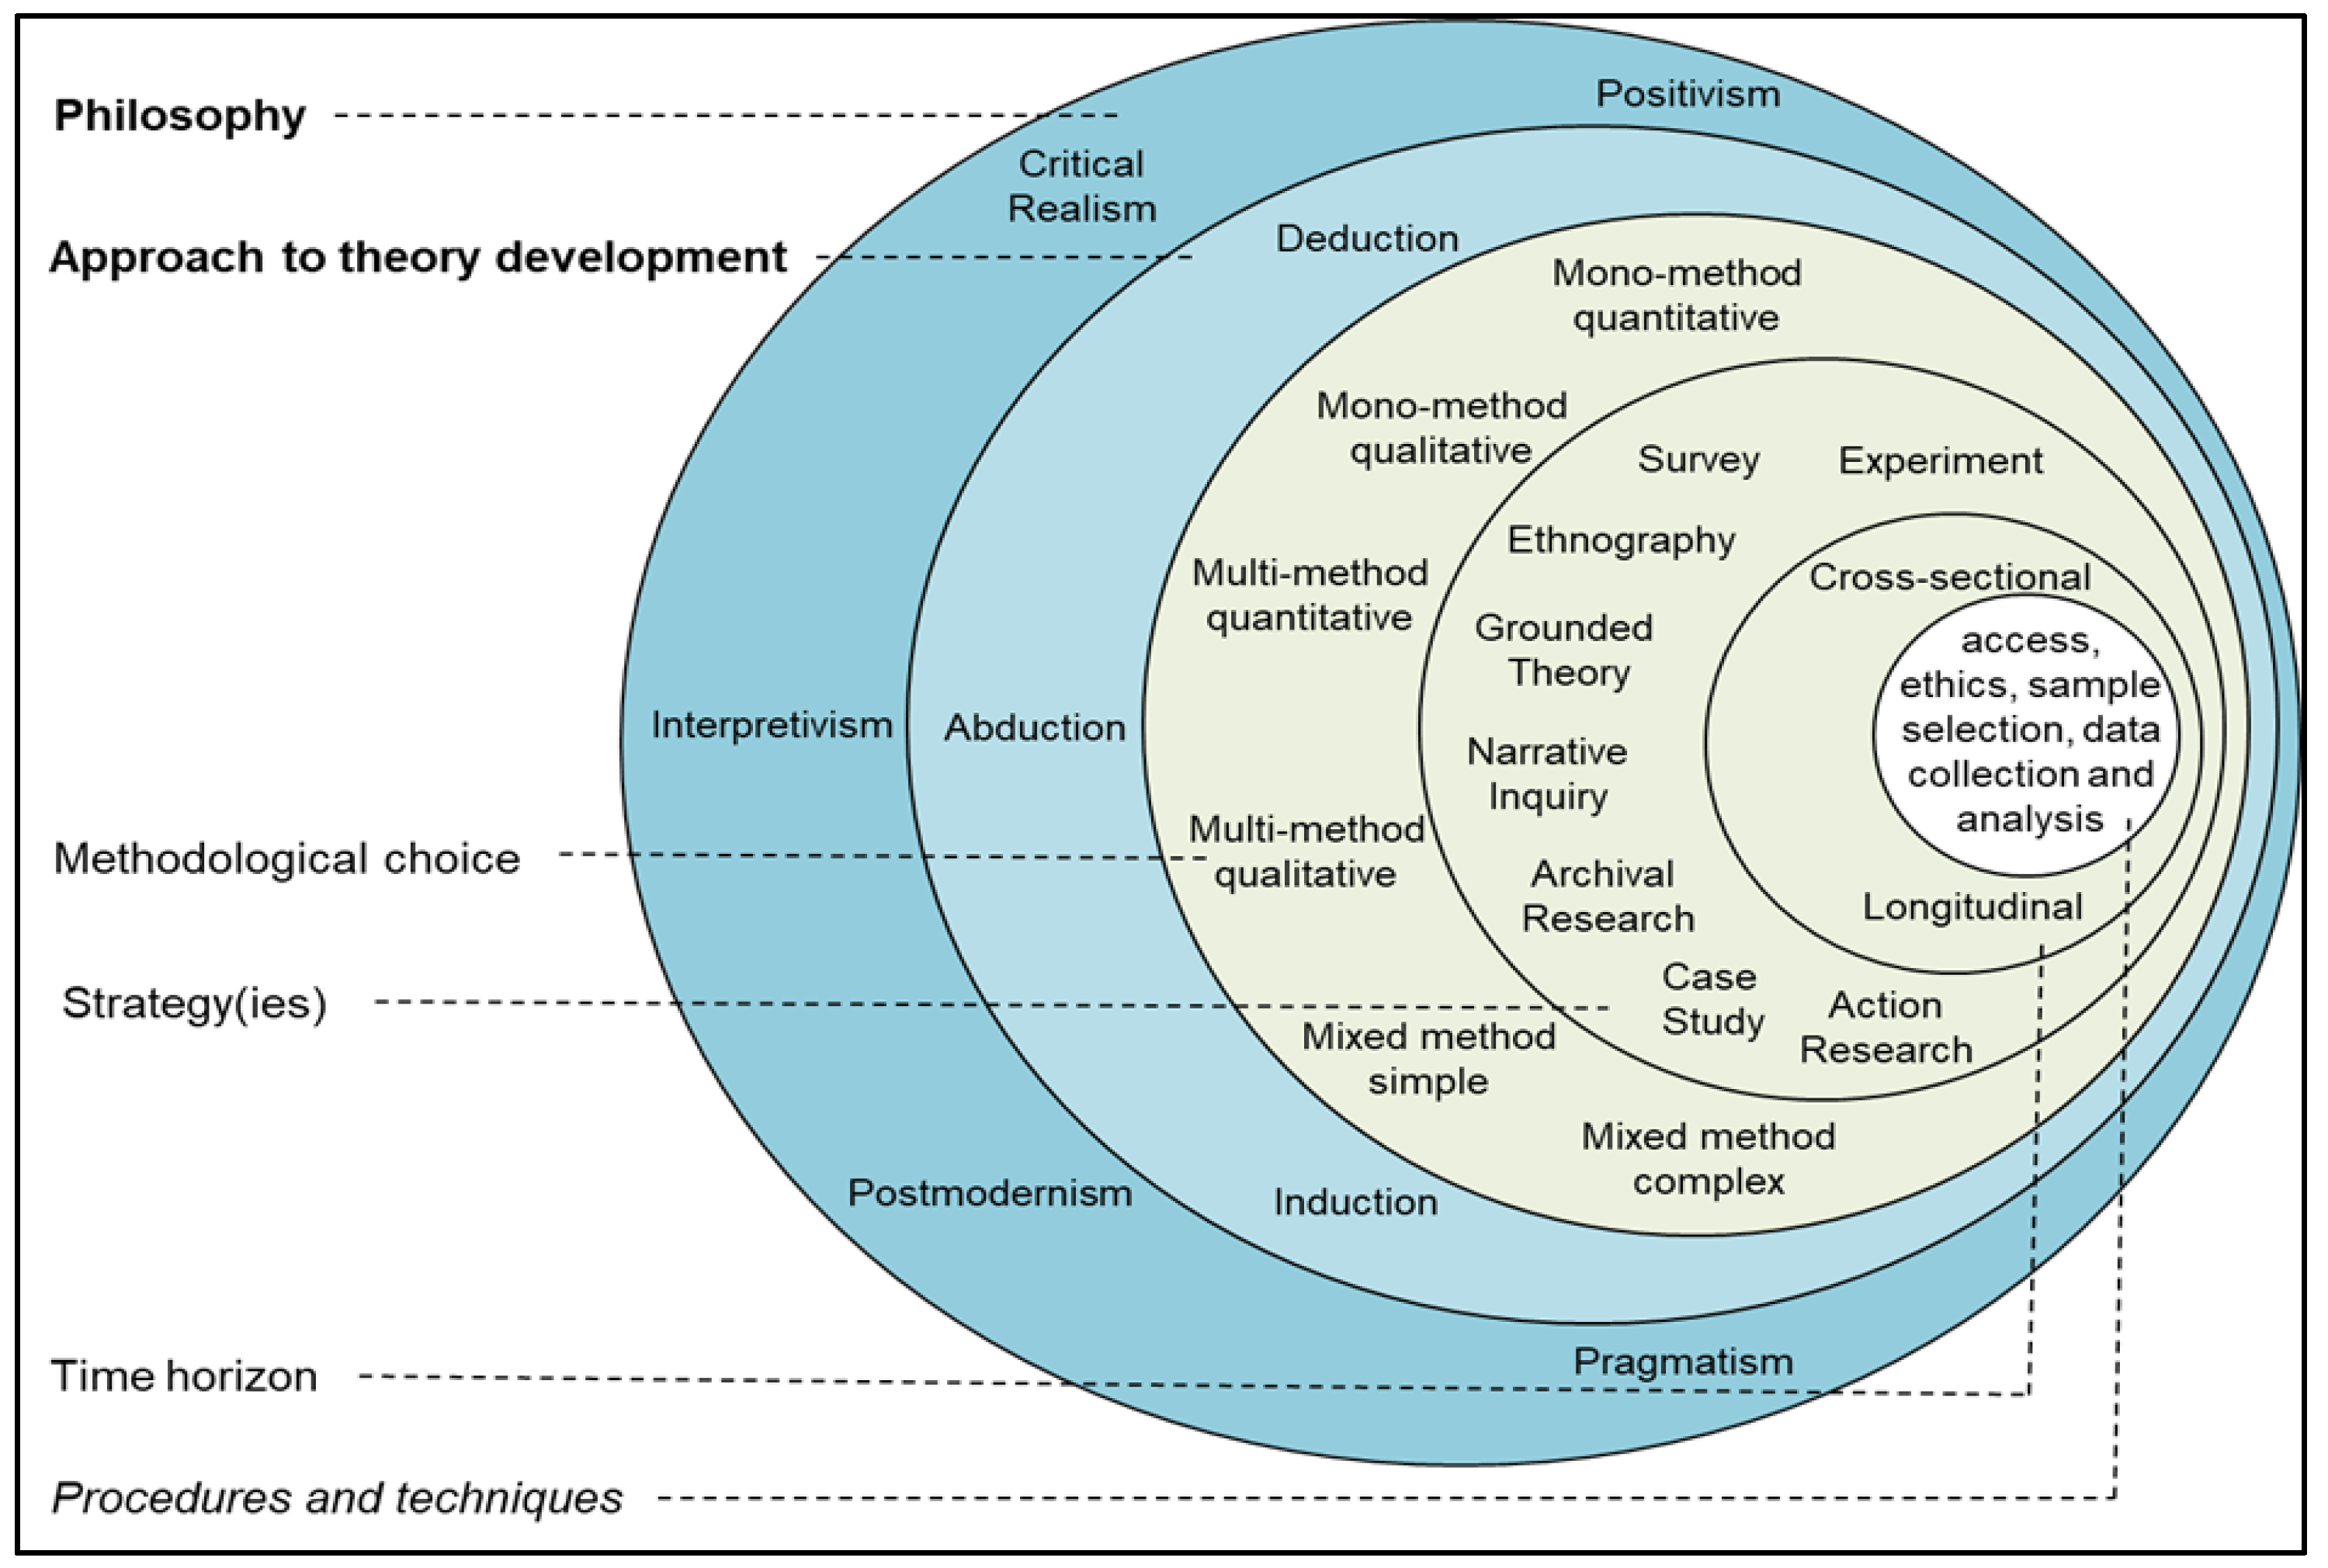
2. Materials and Methods

The research in this article is conducted in line with Saunders et al.’s research onion [5], depicted in Figure 1. As shown, the onion comprises six layers: layer one, which is the outer layer, named philosophy; layer two, named theory development; layer three, named methodological choice; layer four, named strategy; layer five, named time horizon; and layer six, which is the inner layer, called techniques and procedures. Our research methodology is subsequently discussed in terms of the six layers, starting from the outer layer, research philosophy.
Our research philosophy exhibits interpretivism since we are considering BI frameworks defined in the literature in the form of diagrams, i.e., semi-formal notations and accompanying text. Moving towards the next layer, our approach to theory development is primarily inductive since we develop a more comprehensive BI framework from numerous specialized BI frameworks. This is followed by a brief theoretical validation of the framework, reminiscent of a pseudo-deductive approach. Our methodological choice in the third layer from the outer rim is essentially mono-qualitative since we analyze BI frameworks presented as diagrams and descriptive text. The strategy in layer four involves a literature survey and pseudo-cases by viewing each specialized framework as a case. Our time horizon is cross-sectional since this research is conducted at a specific point in time. The techniques and procedures with respect to data collection and analysis are found in the literature. Future work will involve a formal specification of the framework developed in this article, followed by a survey among BI practitioners or case studies in the industry. This may move our work towards a longitudinal time horizon.
Next, we give a brief introduction to proposition development, a technique that we utilize [6] to arrive at our framework in Section 4.

The Use of Qualitative Propositions

Various propositions are defined in the literature review section, and these are informed by the components and structures of the specialized BI frameworks that we analyze. The propositions informed by [6] are used to develop the new framework, which we present in Section 4, our results section.
Our propositions indicate the high-level content of components in the framework, hence the denotation content propositions.
  • Content propositions are labeled as pC1, pC2, …, pCi for i ϵ {1, 2, 3, … n}. For a preliminary version of a proposition, we may add an alphabetic character after the number represented by “i” above. The use of these is illustrated throughout this article.

3. Literature Review

Numerous BI frameworks, some more comprehensive than others, have been defined, each aimed at addressing one or more BI aspects. Thirteen (13) BI frameworks in the literature are analyzed, and for each, respective advantages and disadvantages are elicited. Propositions are defined based on the strength of the analyses and are used to formulate the structures of the new framework, thereby meeting our objective in Section 1.1.
The 13 frameworks discussed in this article appear to have exhibited the largest number of desirable features and were carefully chosen from numerous BI frameworks in the literature. These appeared to be fit for purpose with respect to contributing to a comprehensive BI framework constructed towards the end of this article.
We start with a presentation and analysis of a data-layer BI framework.

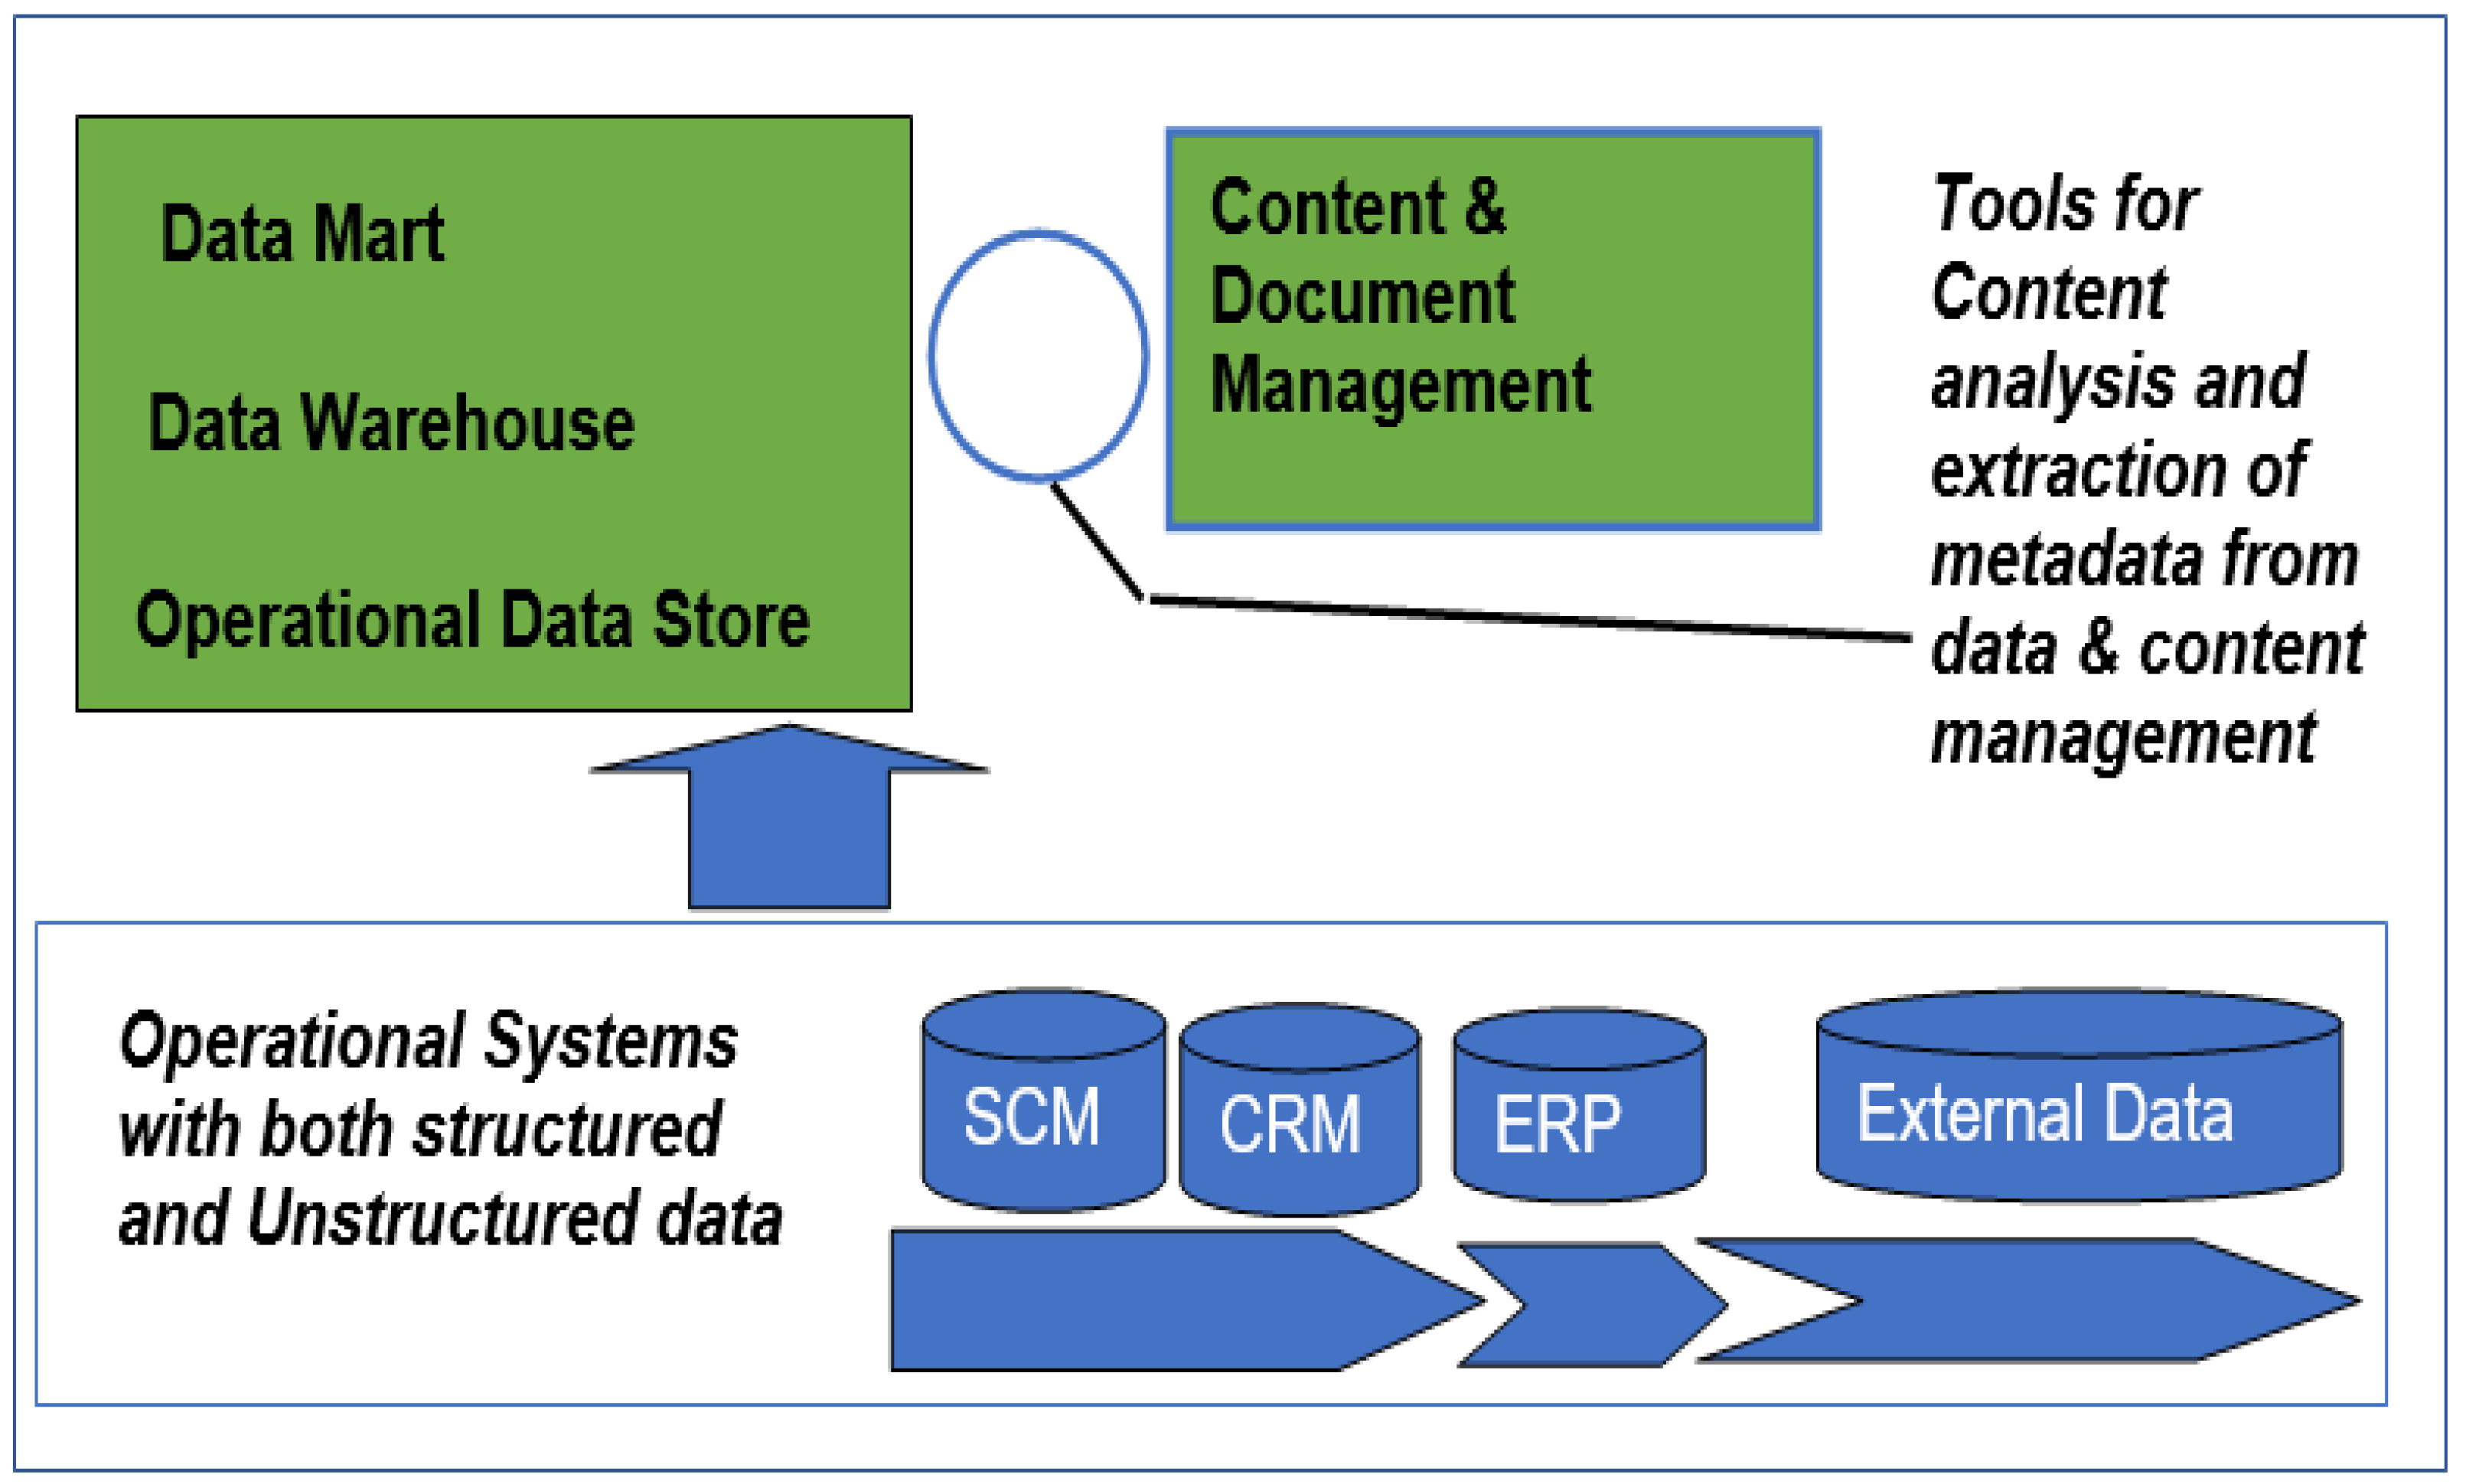
3.1. Data Layer Framework of Business Intelligence

The data layer framework [1,3] is a popular BI framework and is depicted in Figure 2. Data are extracted from operational sources, transformed, and loaded into a data warehouse, from where tools are used to extract and analyze information from one or more content management systems. The data extracted includes sales records, customer databases, feedback, social media channels, marketing lists, and email archives; in short, all data collected from monitoring or measuring aspects of business operations.
As alluded to in Figure 2, our new framework should include an operational source system component since it is where all data from different operational source systems are extracted and combined as a single unit before it is transformed and loaded into the data warehouse [7]. It facilitates data management as it is combined as one unit.
The operational source system contains structured and unstructured data from different sources, for example, CRM (customer relationship management), SCM (supply chain management), ERP (enterprise resource planning), and other external data sources. The CRM subsystem maintains information about the customers on the operational side of the business; the SCM subsystem maintains data about the suppliers in the organization; and the ERP subsystem is responsible for human capital management. External data sources, for example, social media channels, maintain mostly unstructured data used for marketing [1,3].
The operational sources part of the data layer framework exhibits a number of advantages, as discussed next.
The SCM subsystem provides for data usage covering a broad range of activities required to plan, control, and execute a product’s flow, from requiring raw materials and production through distribution to the customer, in a streamlined and cost-effective way [1,3]. CRM stores and maintains data about all customer-oriented activities; amongst others, it integrates all marketing, sales, and service processes. It supports day-to-day operational activities and provides a consistent and complete view of customers based on an integrated data pool, usually implemented through a customer data warehouse (DW) [1,7]. The ERP subcomponent manages and integrates core business processes [1].
The above advantages of a data layer BI framework inform a preliminary version of our first content proposition:
  • Proposition pC1a: An operational sources system made up of CRM, SCM, ERP, and external sources subsystems is a vital component of a BI framework as it facilitates data management through the transformation and loading of the data.
Still, with Figure 2, a DW is defined as a subject-oriented, integrated, time-variant, and non-volatile collection of data facilitating decision-making by management [6,7]. Unlike an operational data store (ODS), a DW keeps a permanent record of data once the transformation process is completed. Such data are supported by historical information to maintain a record of transactions [7]. A DW may consist of one or more of the data marts discussed next.
A data mart (DM) in the context of a DW fulfills a role similar to that of a view in a database. A DM may be viewed as a simplified DW in which we focus on a single subject or line of business. Through data marts, users and developers can access data and gain insights faster since they avoid searching within a more complex data warehouse or manually aggregating data from different sources [6,8]. Given the importance of a DW, it forms part of our new BI framework.
The above discussion on data warehousing leads to a revised version of an earlier proposition:
  • Proposition pC1b: A BI framework should include the following components, as these facilitate data management through the transformation and loading of the data:
    An operational sources system made up of CRM, SCM, ERP, and external sources subsystems.
    A data warehouse is based on one or more data marts.
Next, we turn to the content and document management (CDM) component in Figure 2 above.
The CDM component comprises an operational data store (ODS) (discussed below) and a data warehouse (DW) made up of one or more data marts (DMs), as indicated before. The CDM is used to capture, track, and store electronic documents such as word processing files, PDFs, and digital images of paper-based content. The advantage of a content and document management system is that it can save a company time and money since it can index, archive, and provide version management for electronic documents. It brings together data sources of different origins and formats [8,9].
The advantages of a CDM component point to our next proposition.
  • Proposition pC2: Owing to the said advantages, a BI framework should include a content and document management (CDM) component to address the capturing, tracking, and storing of electronic documents.
We note further that the notion of metadata enters the scene, yet we shall defer a proposition on metadata (in fact, proposition pC4) till further frameworks have been discussed.
The ODS is an interim logical-area database of data destined for the DW. It captures a snapshot of the most recent data from multiple transactional systems for operational reporting. It also enables an organization to combine data in its original format from various sources into a single destination to make it available for business reporting [1,8]. A disadvantage of using an ODS is that once data are stored in the operational data store, it becomes volatile, i.e., it can be overwritten or updated with new data that may flow into it. Consequently, an ODS does not maintain historical data, compromising organizational decision-making [1,8].
From the above discussions on volatile and permanent storage aspects and an ODS being an interim logical-area database, we suggest the introduction of an operational data landing zone (ODLZ) as captured by the following proposition:
  • Proposition pC3: A BI framework should include an operational data landing zone (ODLZ) where all combined data are stored after it has been combined from different sources.
Next, we discuss a three-layered architectural BI framework.

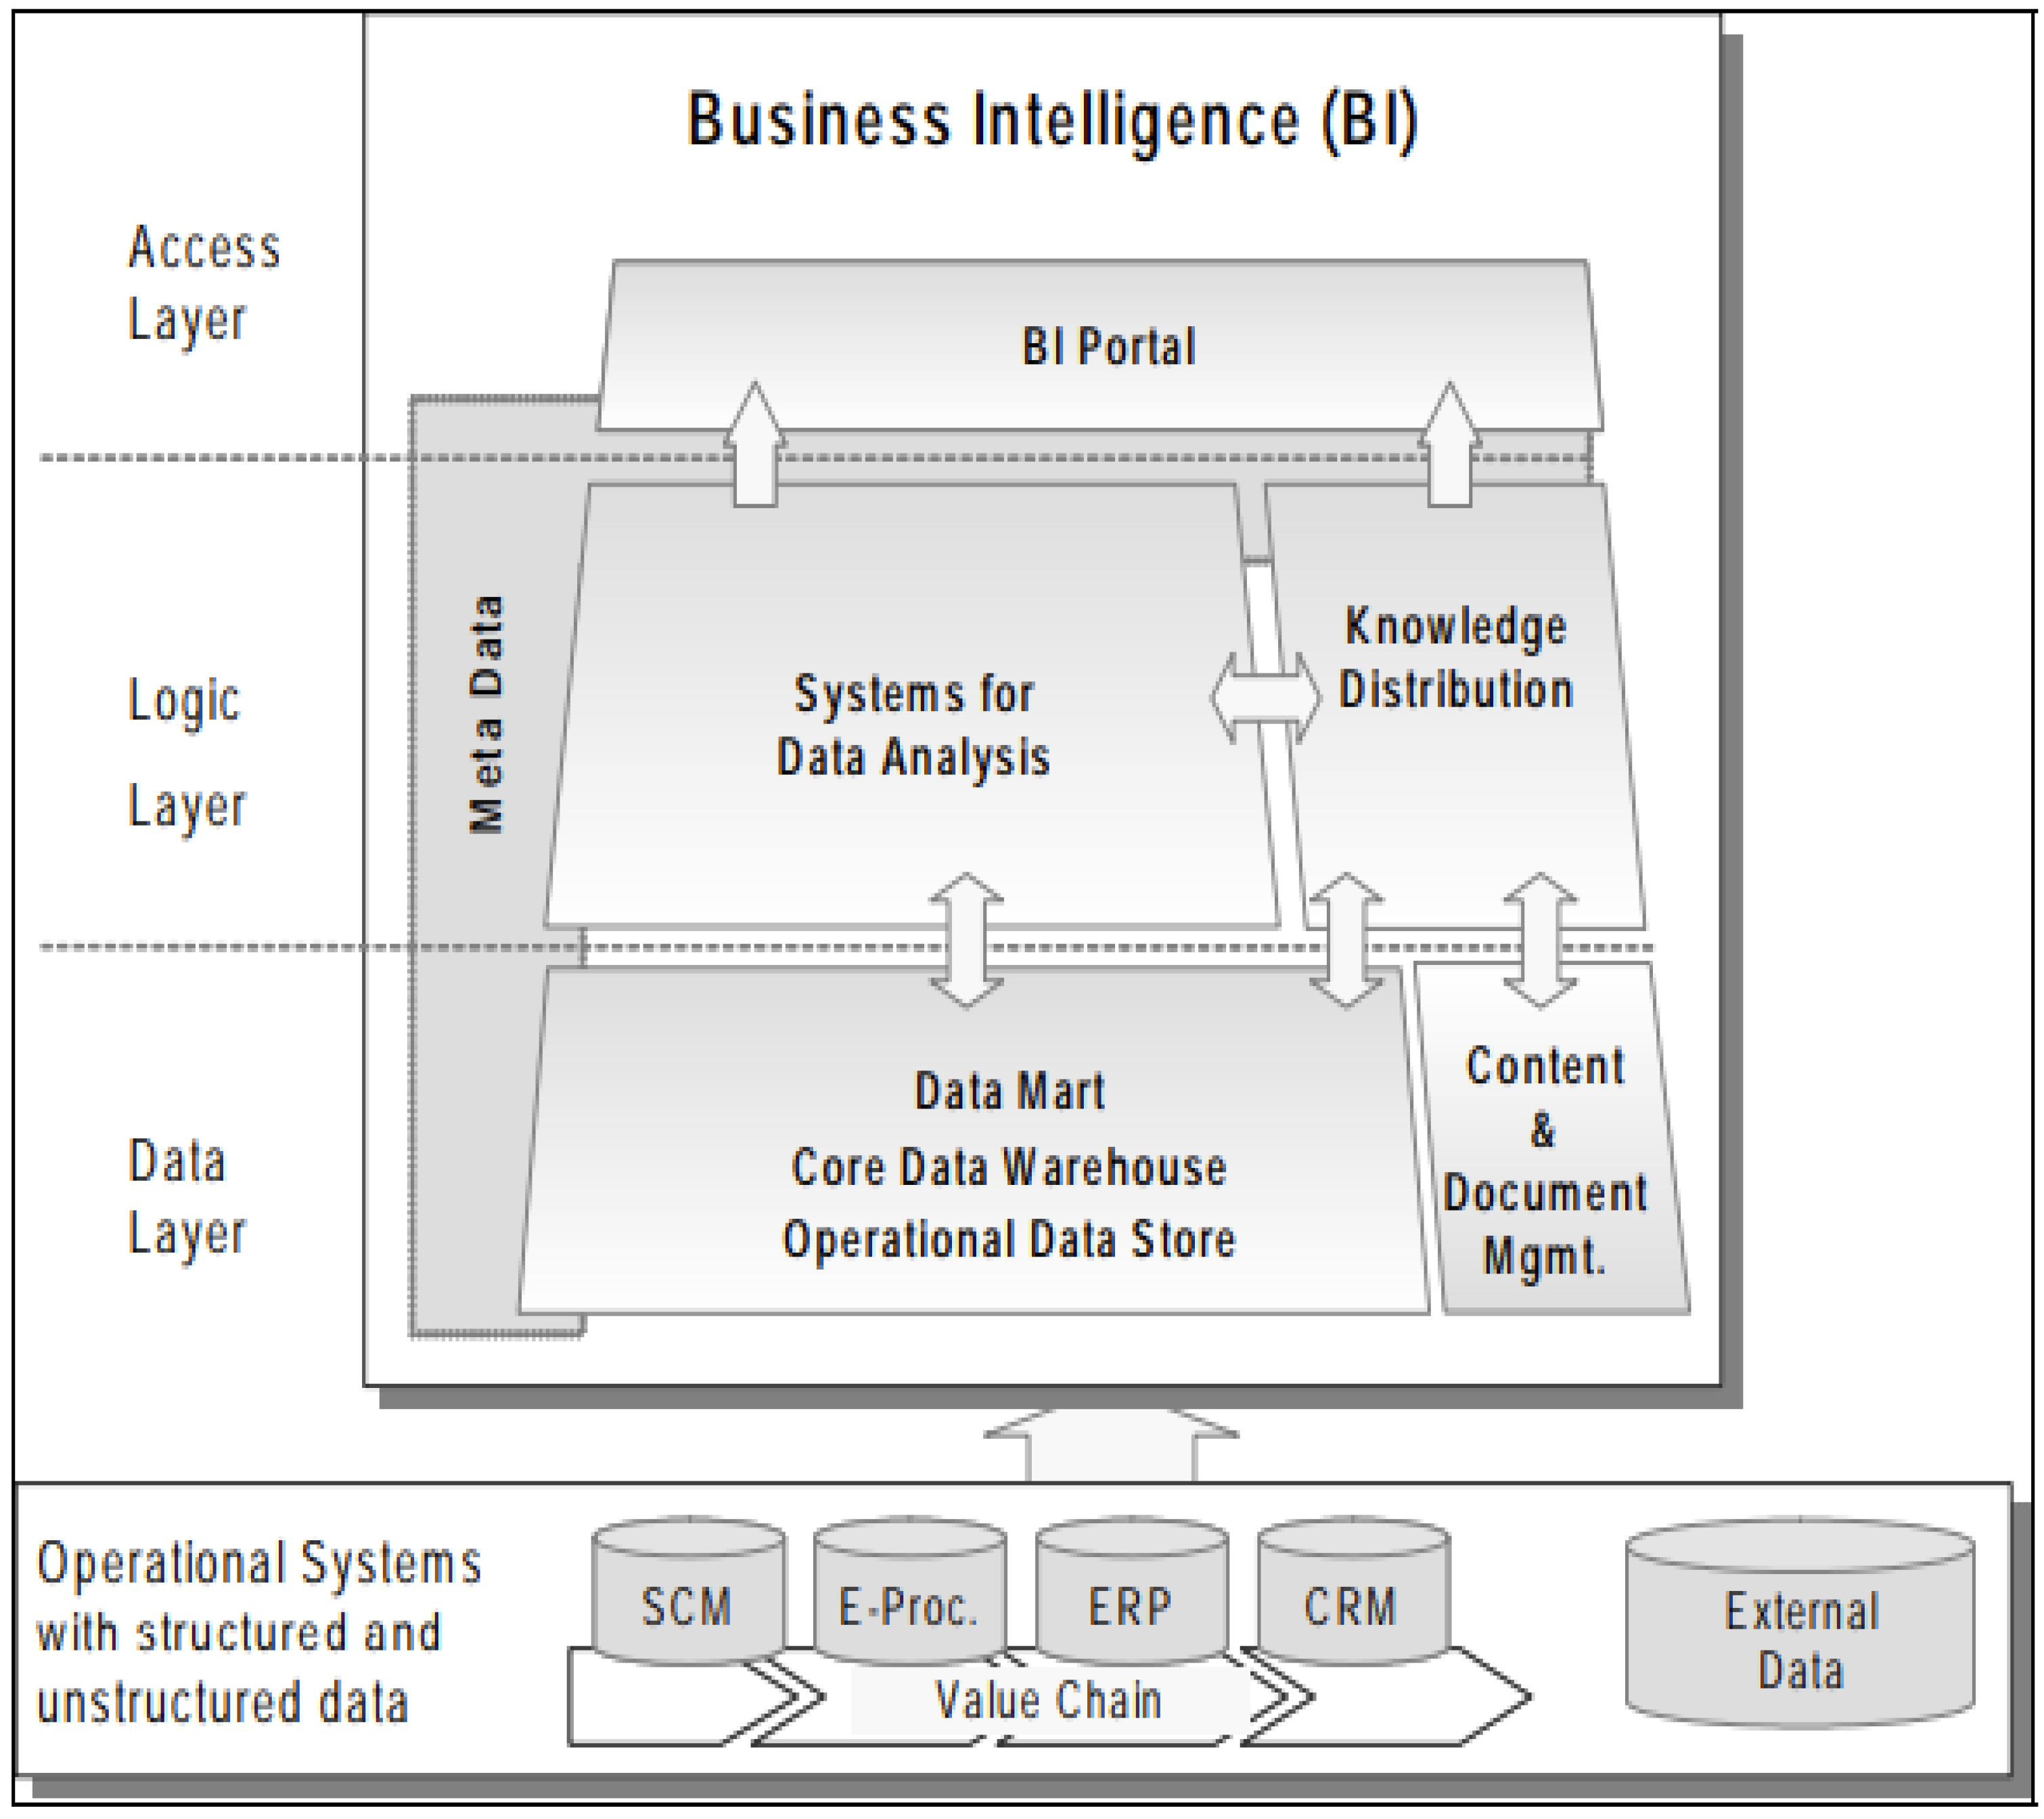
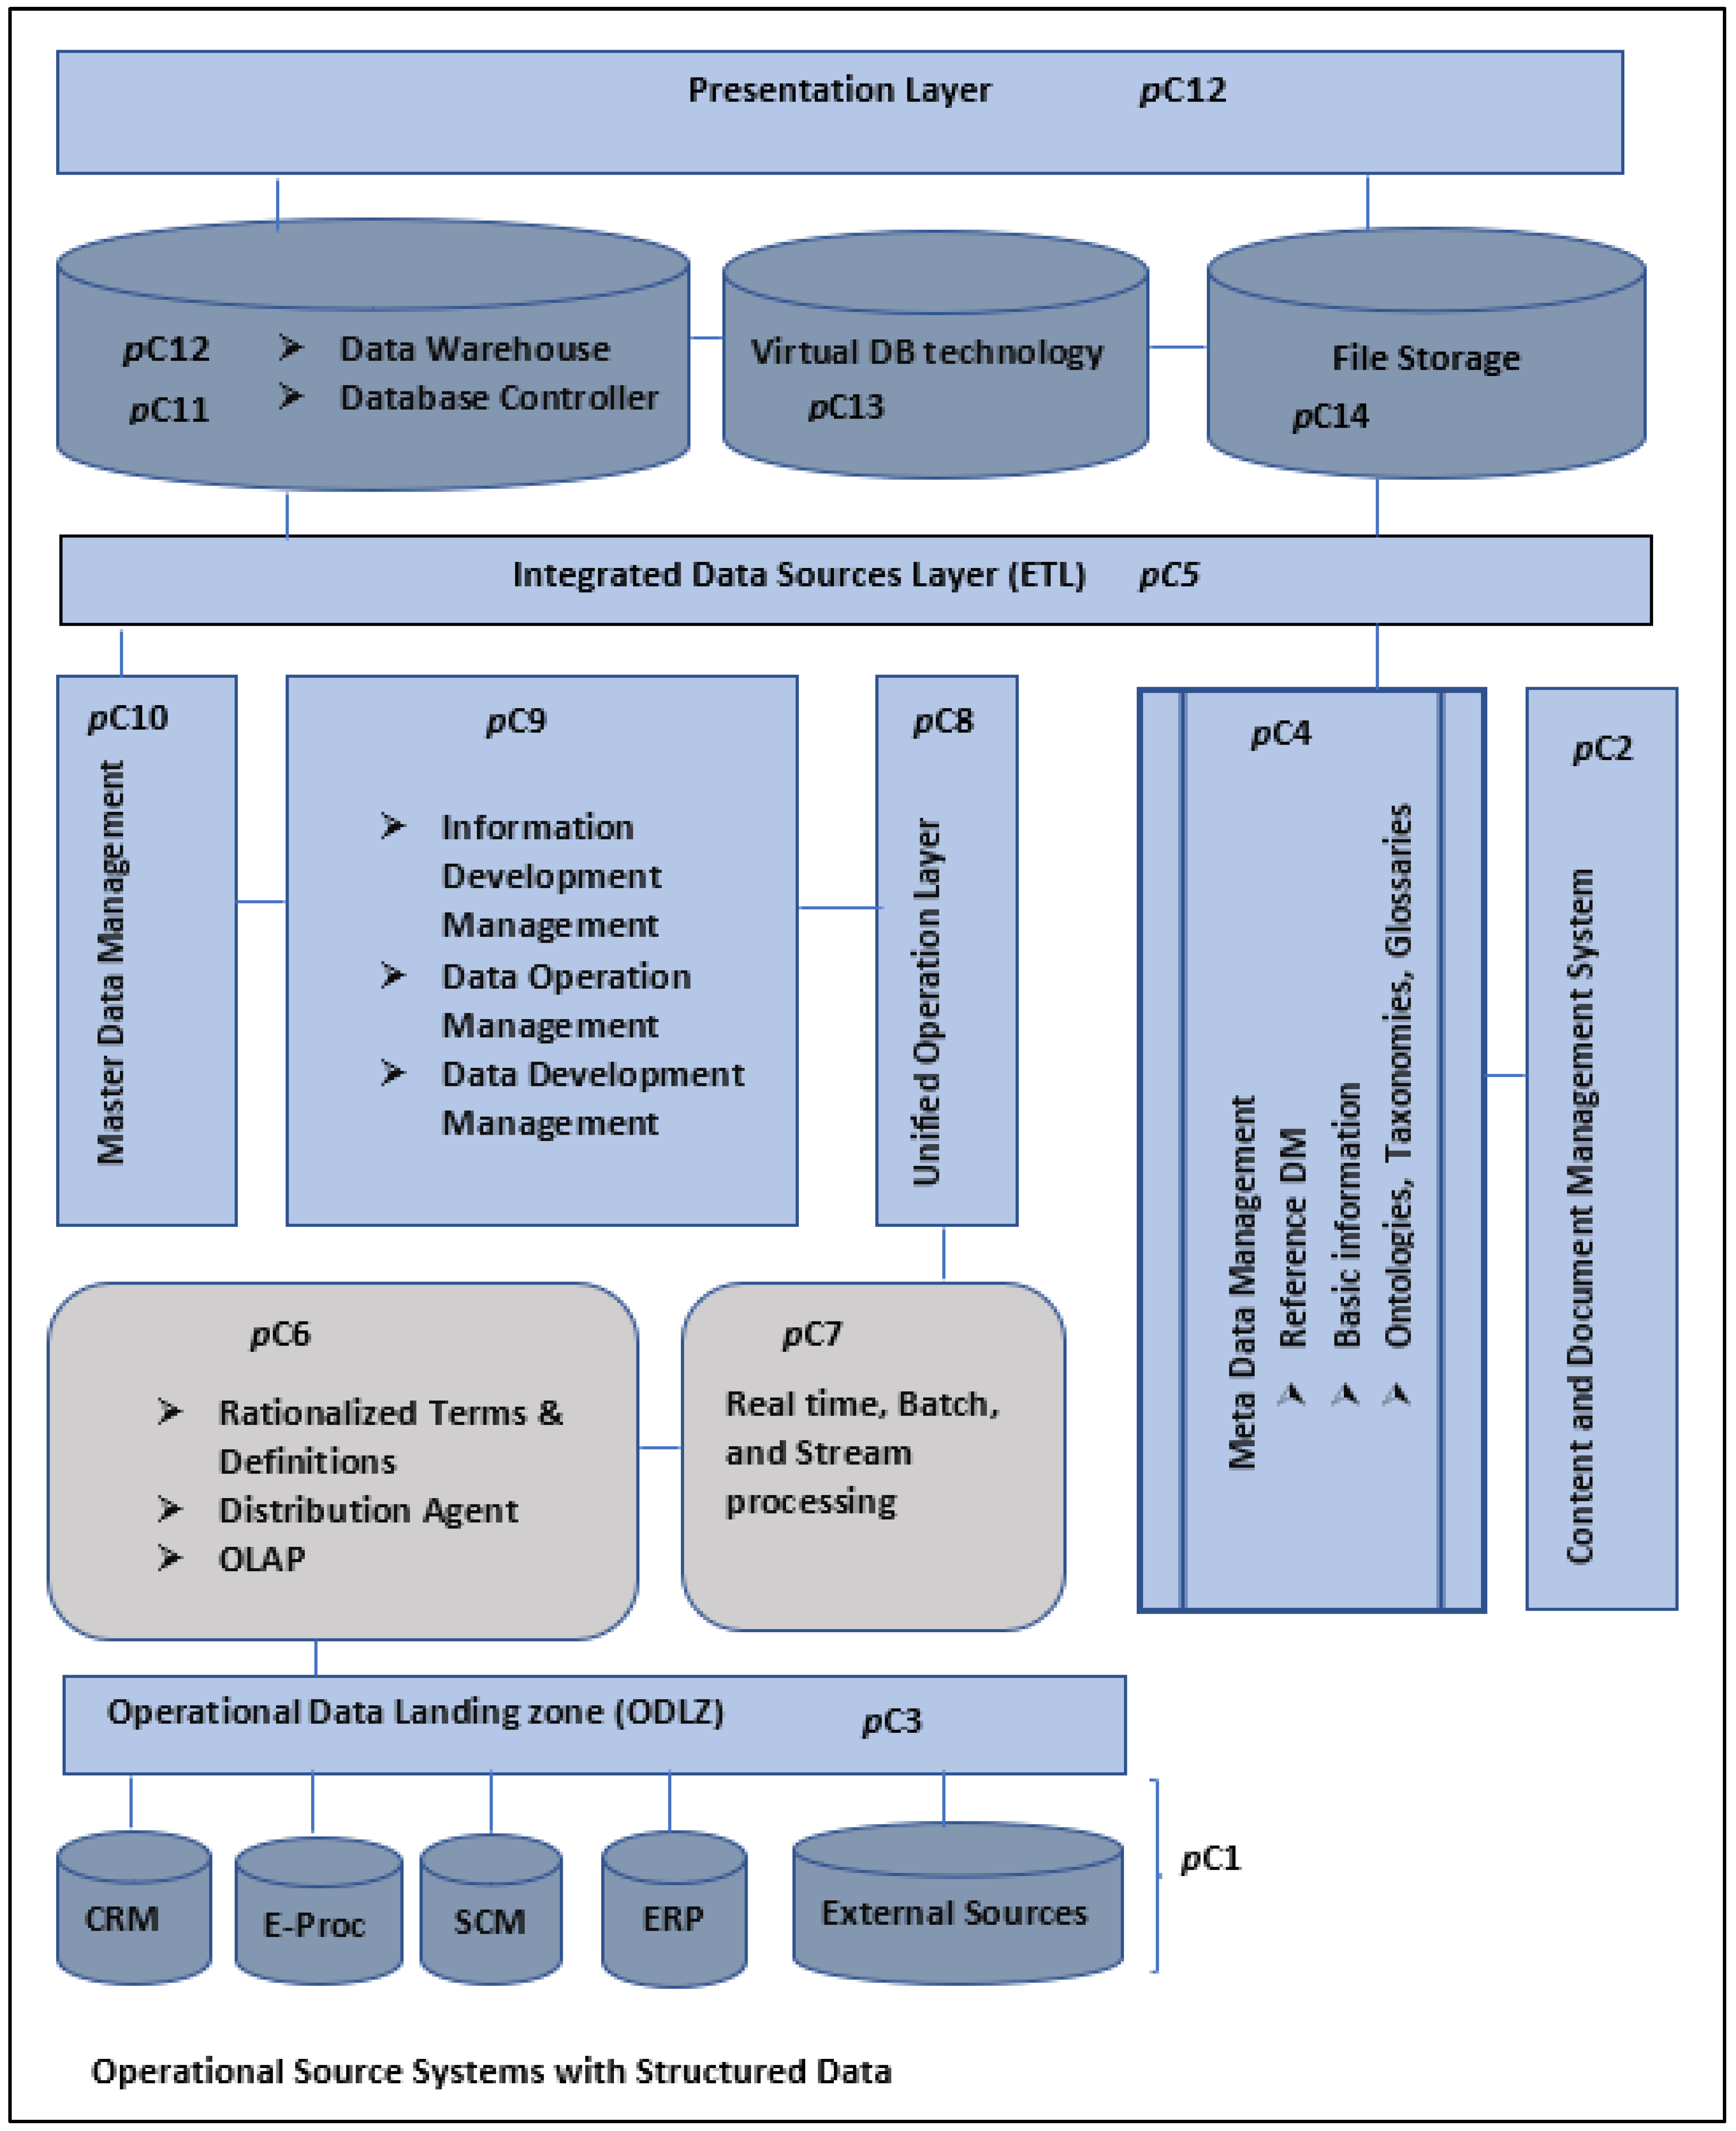
3.2. Conceptual Three-Layer Business Intelligence Architecture

A conceptual three-layer BI architecture, depicted in Figure 3, defines an access layer (a BI portal), a logic layer (essentially, data analytics and knowledge management), and a data layer (data warehousing and content and data management) [1,9]. Additionally, Figure 3 embeds a composite component that includes operational systems containing both structured and unstructured data. The said component feeds into the data layer as indicated.
The operational systems include subcomponents, namely, SCM, E-Proc, ERP, CRM, and an external data source, like the subcomponents in the data layer framework in Figure 2. In addition, an e-procurement (E-proc) system with an explicit value chain has been added to streamline the regular procurement process [9]. Figure 3 likewise comprises an operational data store (ODS) and a data warehouse (DW) [1,9,10]. Naturally, the three-layer framework has advantages similar to those of the data-layer framework identified above. In addition, it includes an e-procurement system, leading to a slight enhancement, and also the final version of an earlier proposition:
  • Proposition pC1: A BI framework should include the following components, as these facilitate data management through the transformation and loading of data:
    An operational sources system is made up of CRM, SCM, ERP, subsystems for external sources, and e-procurement (E-Proc).
    A data warehouse is based on one or more data marts.
The access layer, comprising a BI portal, offers the benefit of displaying the results to the user, or, to put it another way, to present the data that we acquire from the business access layer and offering the results to the front-end user. The logic layer comprises systems for data analysis. It enables a business to take raw data and uncover patterns, assists companies in making informed decisions, creates a more effective marketing strategy, improves the customer experience, and streamlines operations [9,11]. In the data layer, data from an operational source system is extracted and transformed, whereafter it is moved into the access layer.
We note that the components in Figure 3, e.g., a data warehouse and the operational data landing zone, have been discussed previously in the context of Figure 2. Also, propositions on the data layer, logic layer, and access layer will be defined when we discuss frameworks that follow later in this article.
A meta data based ETL service framework is discussed next.

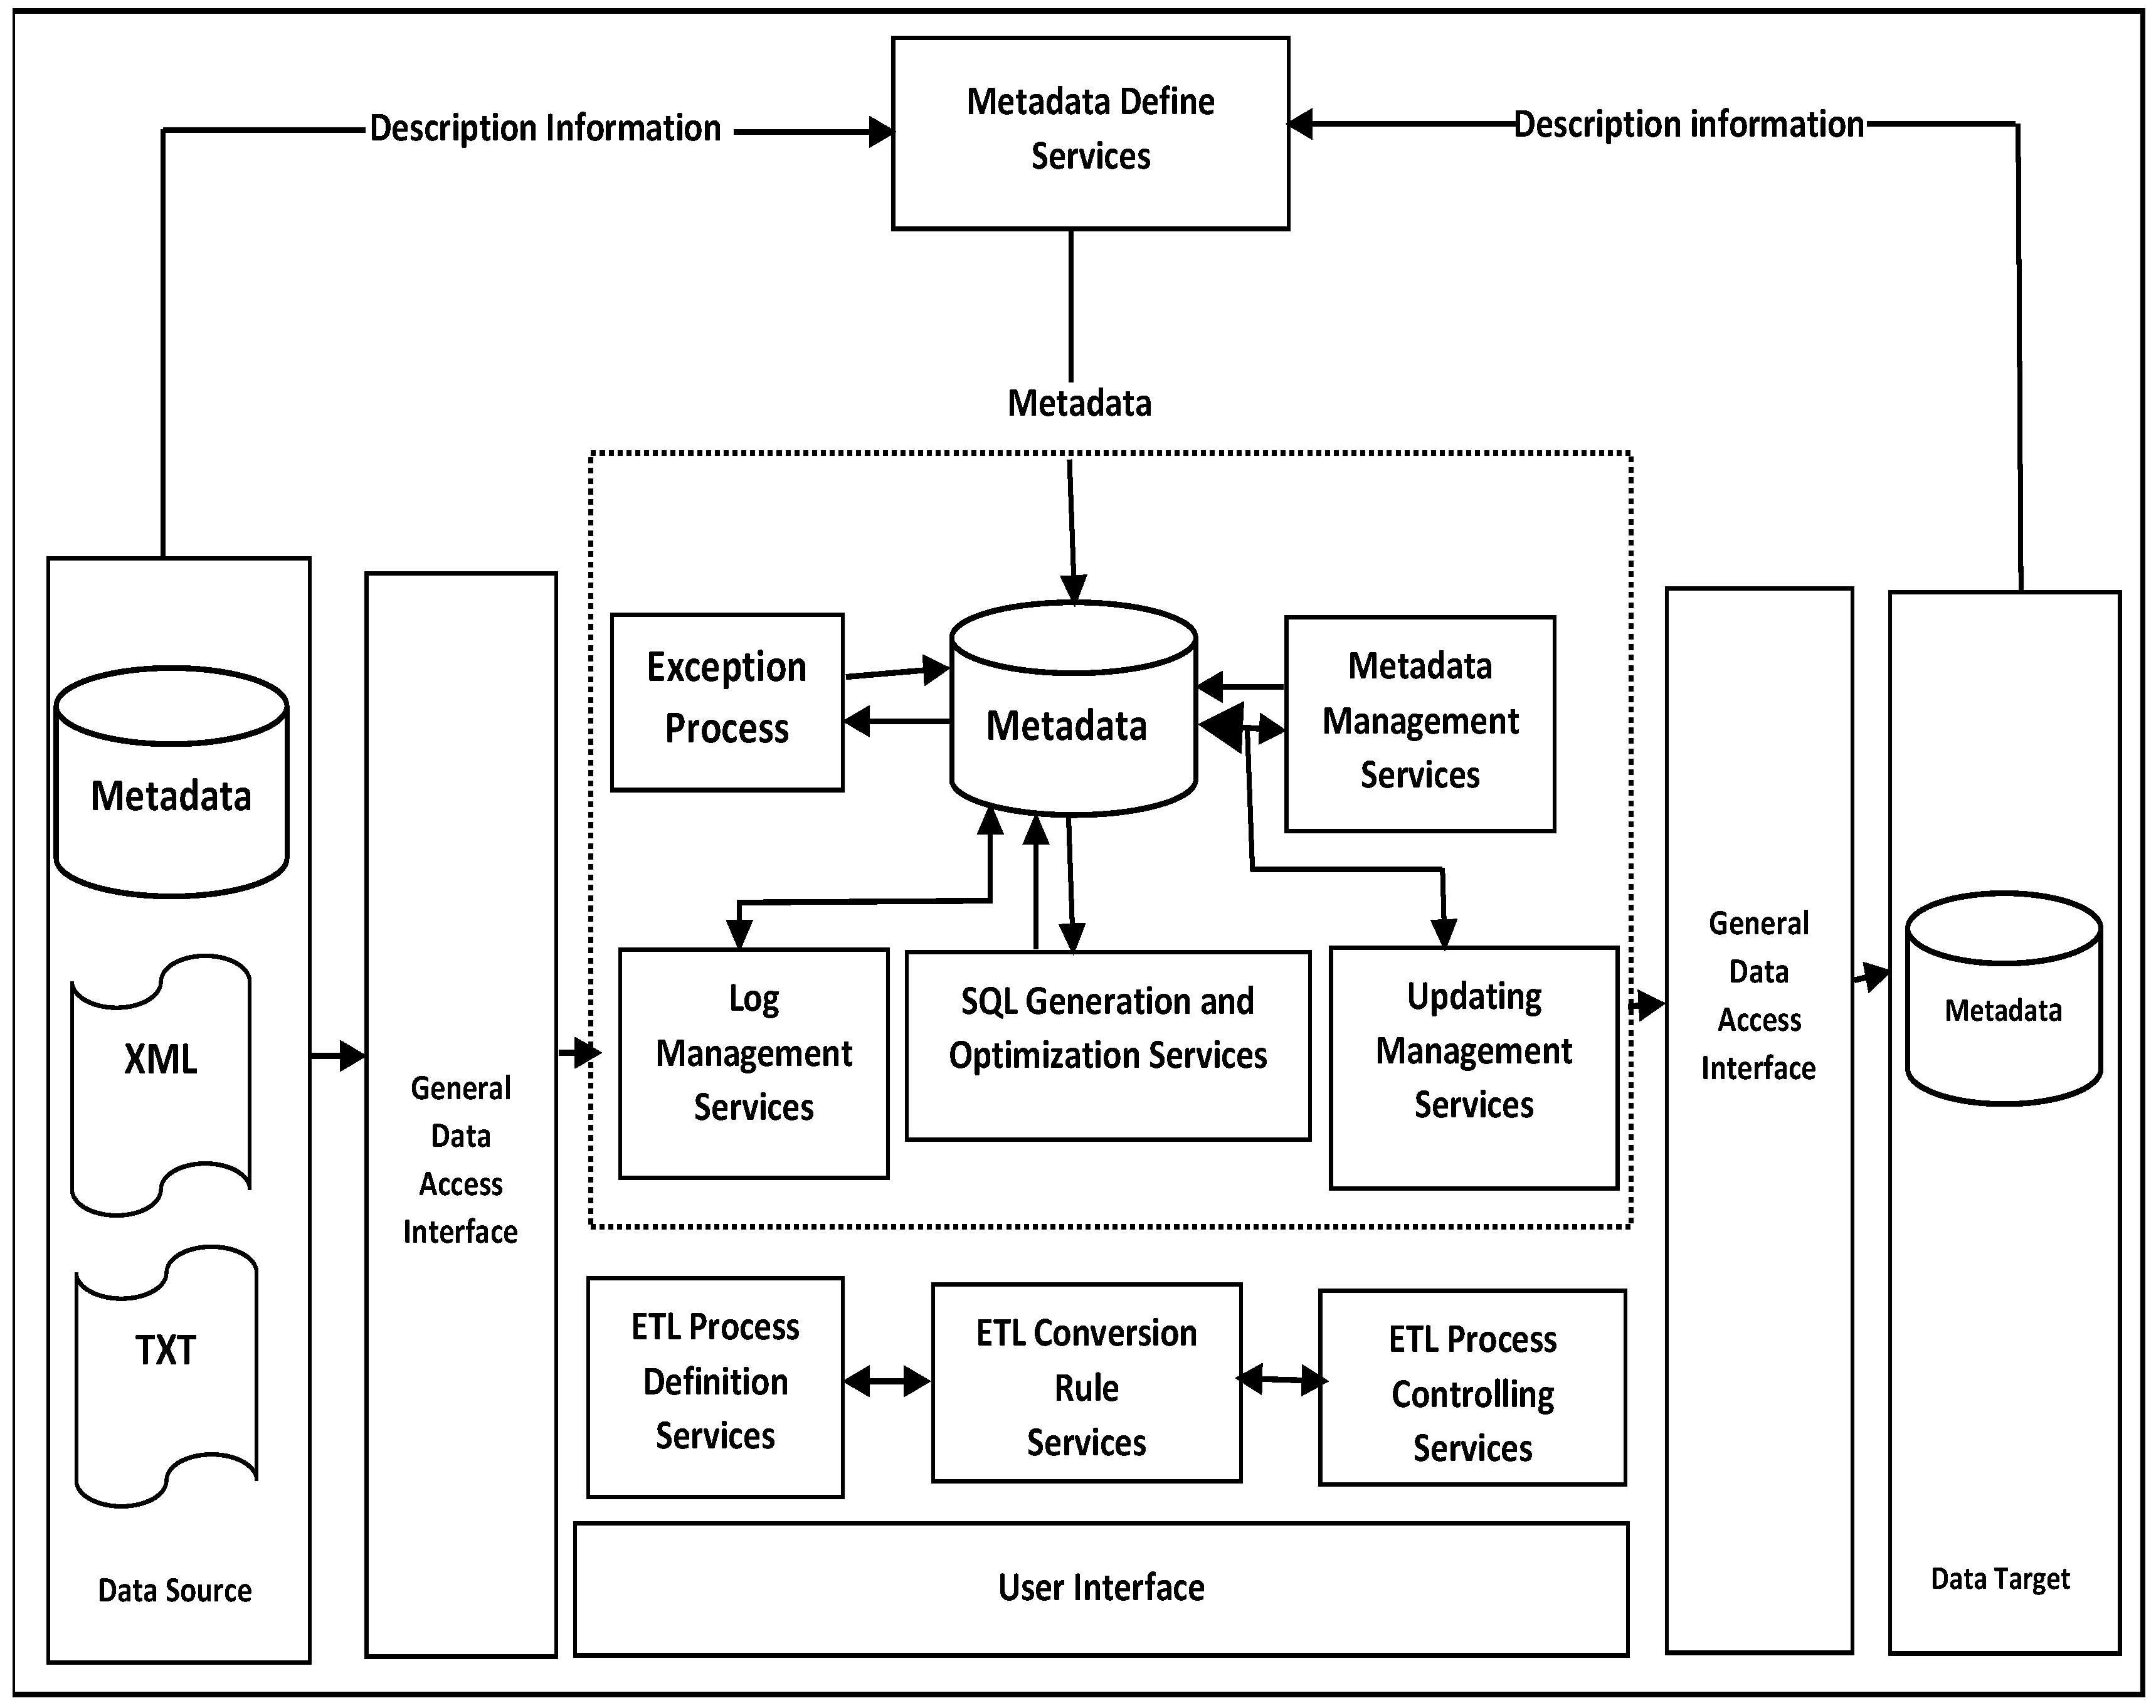
3.3. ETL Service Framework Based on Metadata

As shown in Figure 4, an ETL service framework based on metadata is one of the critical parts needed for creating a data warehouse and standardizing incoming data. It helps to simplify what can be a complex process of managing incoming data and assists in speeding up the development on the ETL side by providing more flexibility during the process of incorporating different data sources into a data warehouse [12]. Figure 4 is “encapsulated” in the “metadata management” entity of our framework.
The ETL Service Framework in Figure 4 is based on metadata comprised of the following components [12,13]: A data source part comprising metadata components and files, e.g., XML and TXT files; a general data access interface that draws data from the data source part to the user interface; a user interface, which is a component where all the exception processes, log management services, SQL generation, optimization services, updating management services, and ETL processes, including ETL conversion rule services and ETL process control services, which are also referred to as metadata define services, are defined. The general data access interface is a component that draws data from metadata definition services to the data target part of the framework.
An advantage of the ETL service framework for metadata is that it shows how metadata is managed from the data source to the data target, as well as the metadata definition services that are applied. The limitations of the ETL service framework in Figure 4 are that it only focuses on data about external data, hence metadata, and it describes and gives information about other data, not the entire data of the organization [12,13,14].
The advantage of having a metadata management component leads to:
  • Proposition pC4a: A BI framework should include a metadata management component as part of general data management.
    Metadata in the form of reference data management, whereby the structure used in the organization (internal department codes, internal product codes, employee organization codes, internal location codes, and so forth) is described, should be included [6].
Since the Figure 4 framework is relatively complex, we shall not show its detail in our new framework; rather, we denote metadata management as a composite component in our framework, indicated by the parallel blue lines in the corresponding entity in the framework (refer to Figure 15 towards the end of the article).
Next, we discuss a further detailed metadata BI framework.

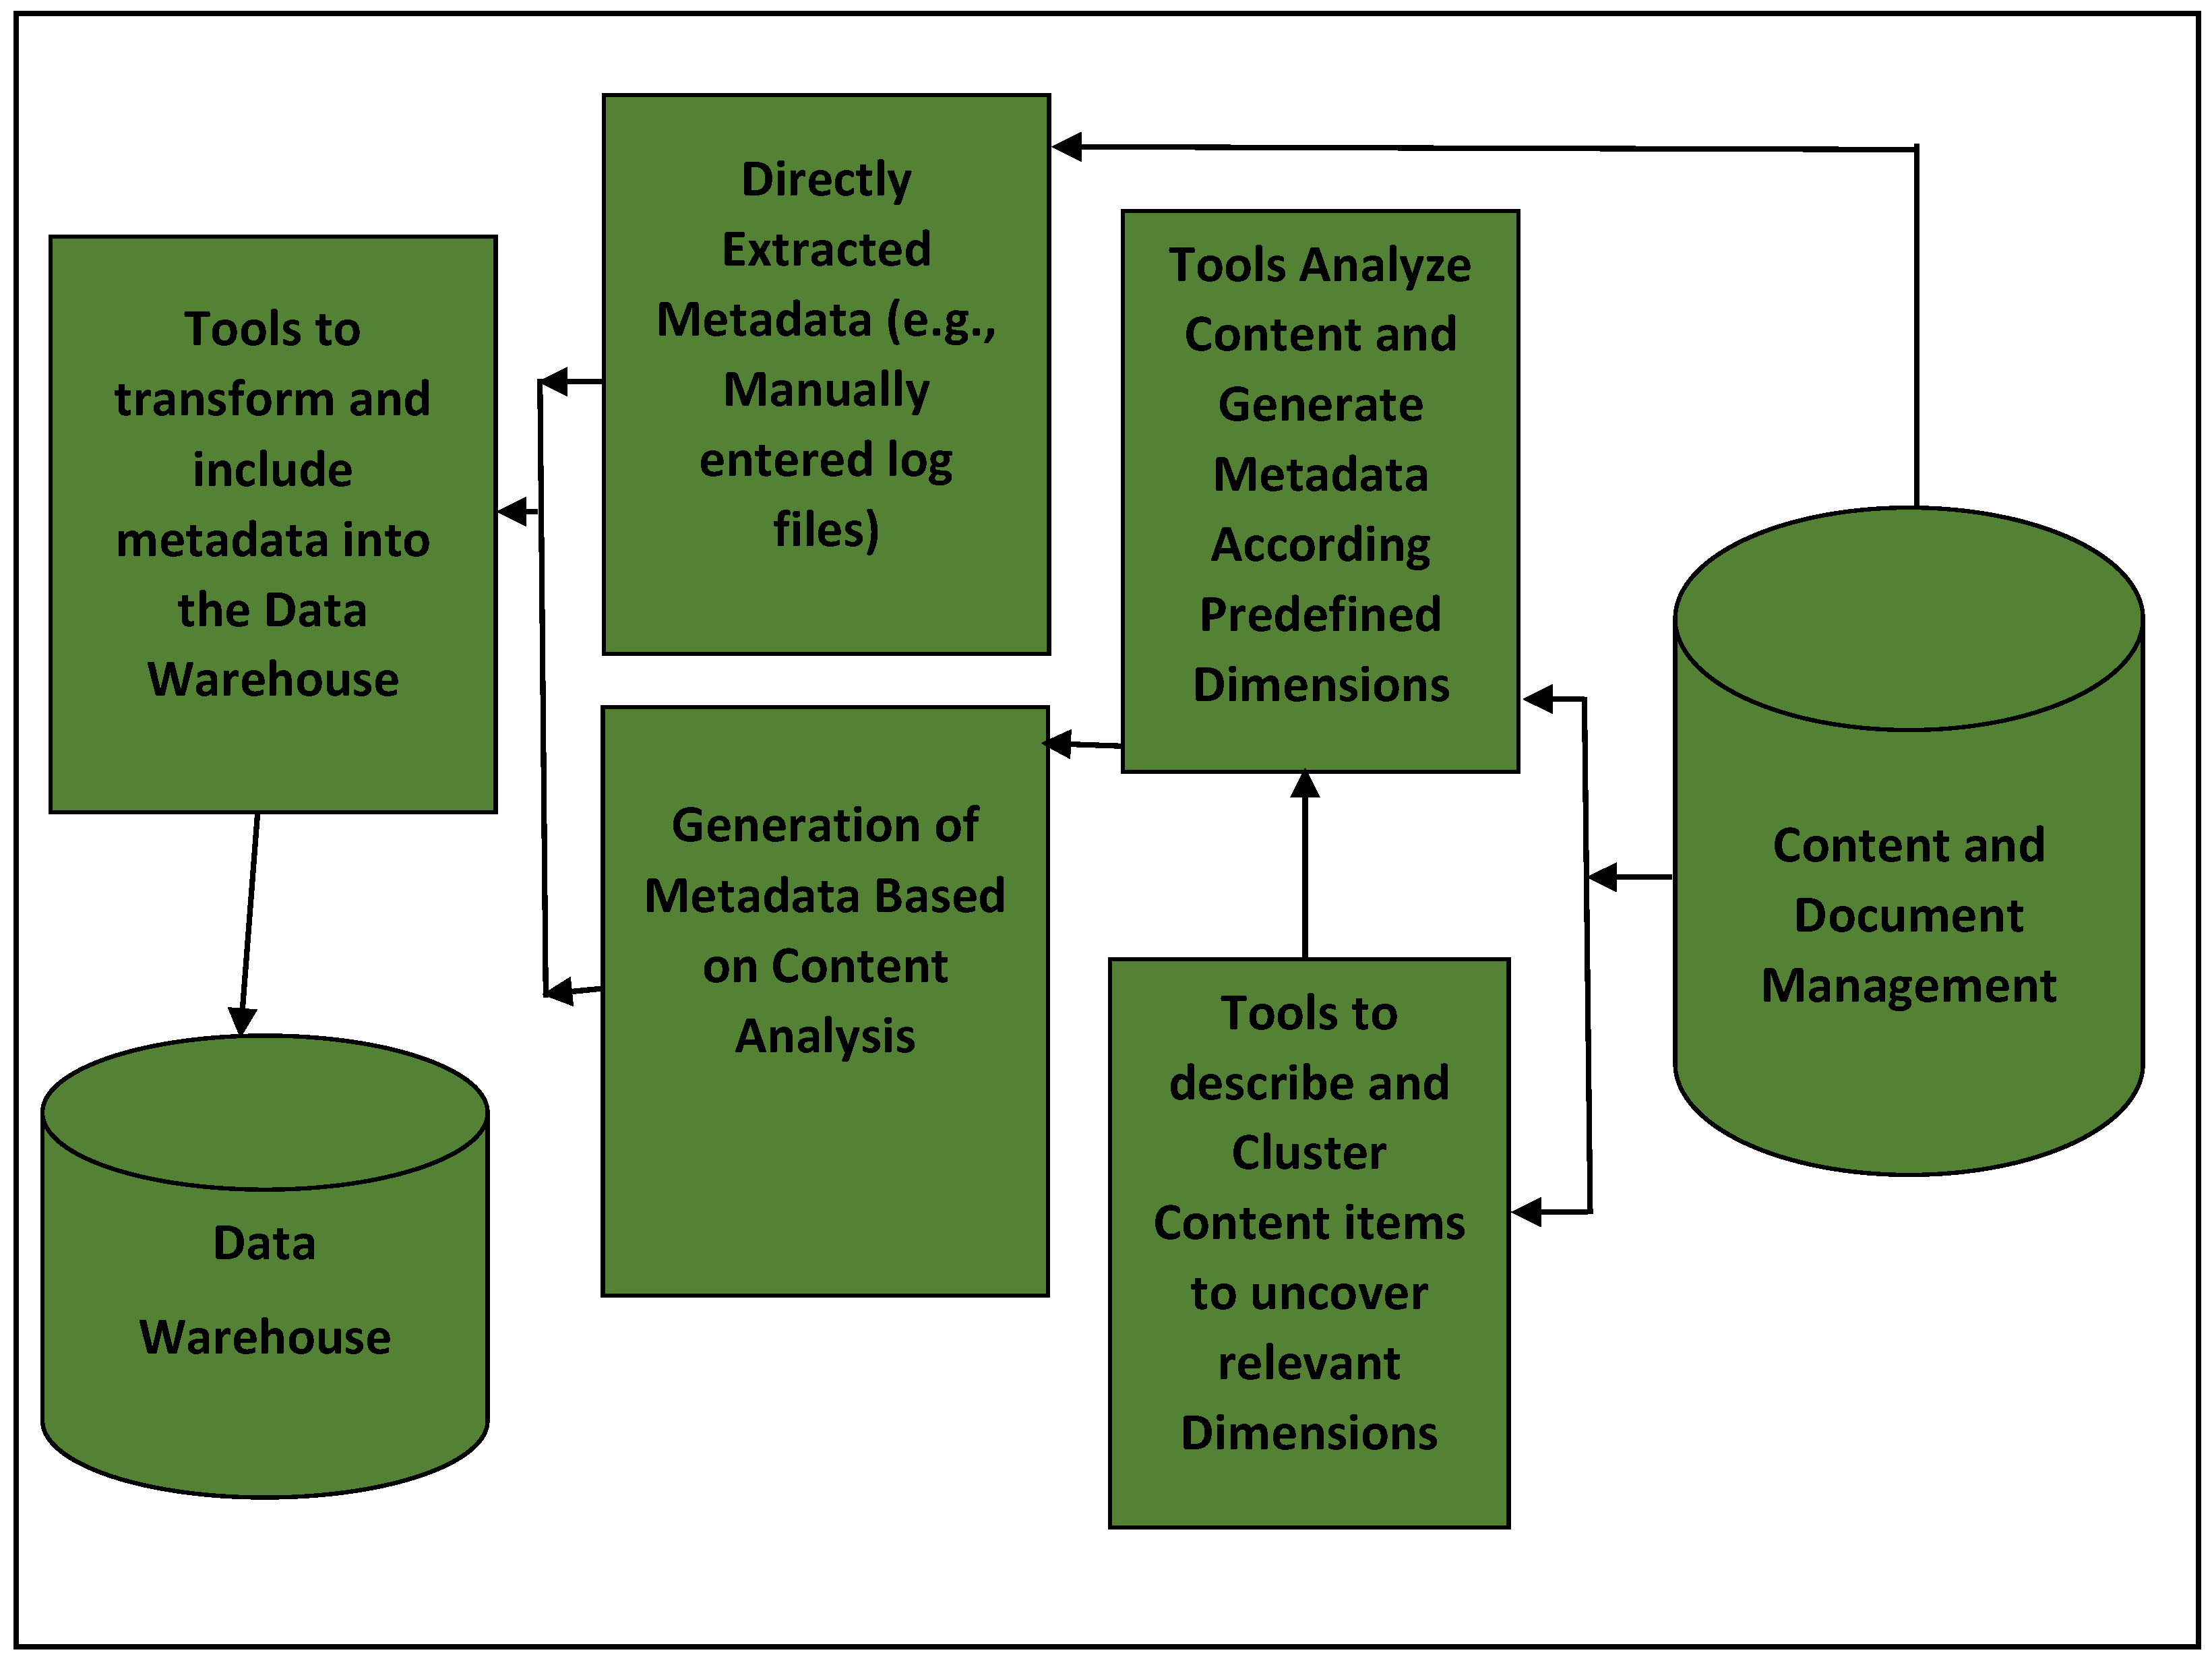
3.4. Framework of a Metadata Extract from Content and Document Management

As shown in Figure 5, the framework of metadata extracted from content and document management deals with data about documents (i.e., metadata) rather than the data within documents (object data). The information produced in the framework facilitates the classification and organization of files. Such information is usually not visible unless an IT professional explicitly looks for it [1,15].
Regarding Figure 5, unstructured data are extracted and stored in the content and document management components. The framework also presents tools to analyze content, generate metadata according to predefined dimensions, and describe and cluster content items to discover relevant dimensions. Regarding document metadata, dimensions might include a collection of information like author, file size, the date the document was created, and keywords to describe the document. The directly extracted metadata component stores metadata extracted directly from the content and document management components. Having been extracted, the data are transformed and loaded into the data warehouse shown in Figure 5.
The generated metadata based on the content analysis component stores metadata generated based on content analysis for predefined and relevant dimensions. Once generated, these are analyzed according to the predefined dimensions [1,15,16].
From the above discussions, we note that our new BI framework should include an integrated data source layer, as captured by the following proposition:
  • Proposition pC5a: A BI framework should include an integrated data source (IDS) layer because it is the part where all source data, including metadata extracted from content and document management systems, are combined.
During the said combination process, the ETL quality metrics (QoX) facilitate ETL pipelines meeting the requirements of data transformation. The ETL quality metrics include affordability, auditability, availability, consistency, flexibility, freshness, maintainability, recoverability, reliability, robustness, scalability, and traceability [15].
The above observation on ETL quality metrics leads to an enhanced and final version of proposition pC5a:
  • Proposition pC5: A BI Framework should include an integrated data source (IDS) layer:
    In the IDS, all source data, including metadata extracted from content and document management systems, are combined.
    The underlying ETL pipelines should adhere to the said ETL quality metrics (QoX).
The Figure 5 framework offers a number of advantages since it [1,15]:
  • Assists with managing documents.
  • Supports content-driven collaboration.
  • Facilitates information creation, retention, and retrieval and embeds controlled and improved document distribution. These actions are often described by three simple verbs: scan, store, and retrieve.
  • Bring together data sources of different origins and formats (e.g., structured and unstructured data). Consequently, it can apply single or multiple taxonomies or categorizations to a document or folder that allow documents to be classified and stored in more than one way from a “single instance”. Naturally, this may not be possible with paper formats.
  • Provides high-level information security and centralized storage of data.
  • Offers automated workflows.
The above advantages slightly enhance our earlier proposition pC4a on metadata document management:
  • Proposition pC4: A BI framework should include a metadata management component, catering for metadata management as part of general data management to:
    Allow for reference data management whereby the structure used in the organization (internal department codes, internal product codes, employee organization codes, internal location codes, and so forth) is described [8].
    Summarize basic information about data, work with instances of data, and make findings.
    Use ontologies, taxonomies, and glossaries to categorize and classify electronic information to be stored in more than one way [1,2,17].
Ontologies, in the context of BI, define concepts that constitute a business process and relationships among them. Taxonomies, in turn, are crucial for executing business intelligence (BI) applications by preventing users from being overwhelmed with information.
Glossaries define terminology unique to the business or technical domain and are delivered. It is used to ensure that all stakeholders (business and technical) understand what is meant by the terminology, acronyms, and phrases used inside an organization. Hence, it provides for a shared understanding of business terminology across the organization.
The Figure 5 framework incurs some disadvantages, however [1,18,19]:
  • Assembling metadata from content and document management systems presents a challenge with respect to the efficiency of its extraction process(es).
  • Server resources may be constrained since some content management systems (CMSs) can put a load on server resources.
We note, however, that the above disadvantages are implementation or non-functional considerations, while our article concerns functional aspects. Further consideration of these is, therefore, beyond the scope of this article.
Next, we discuss a BI framework for structured data.

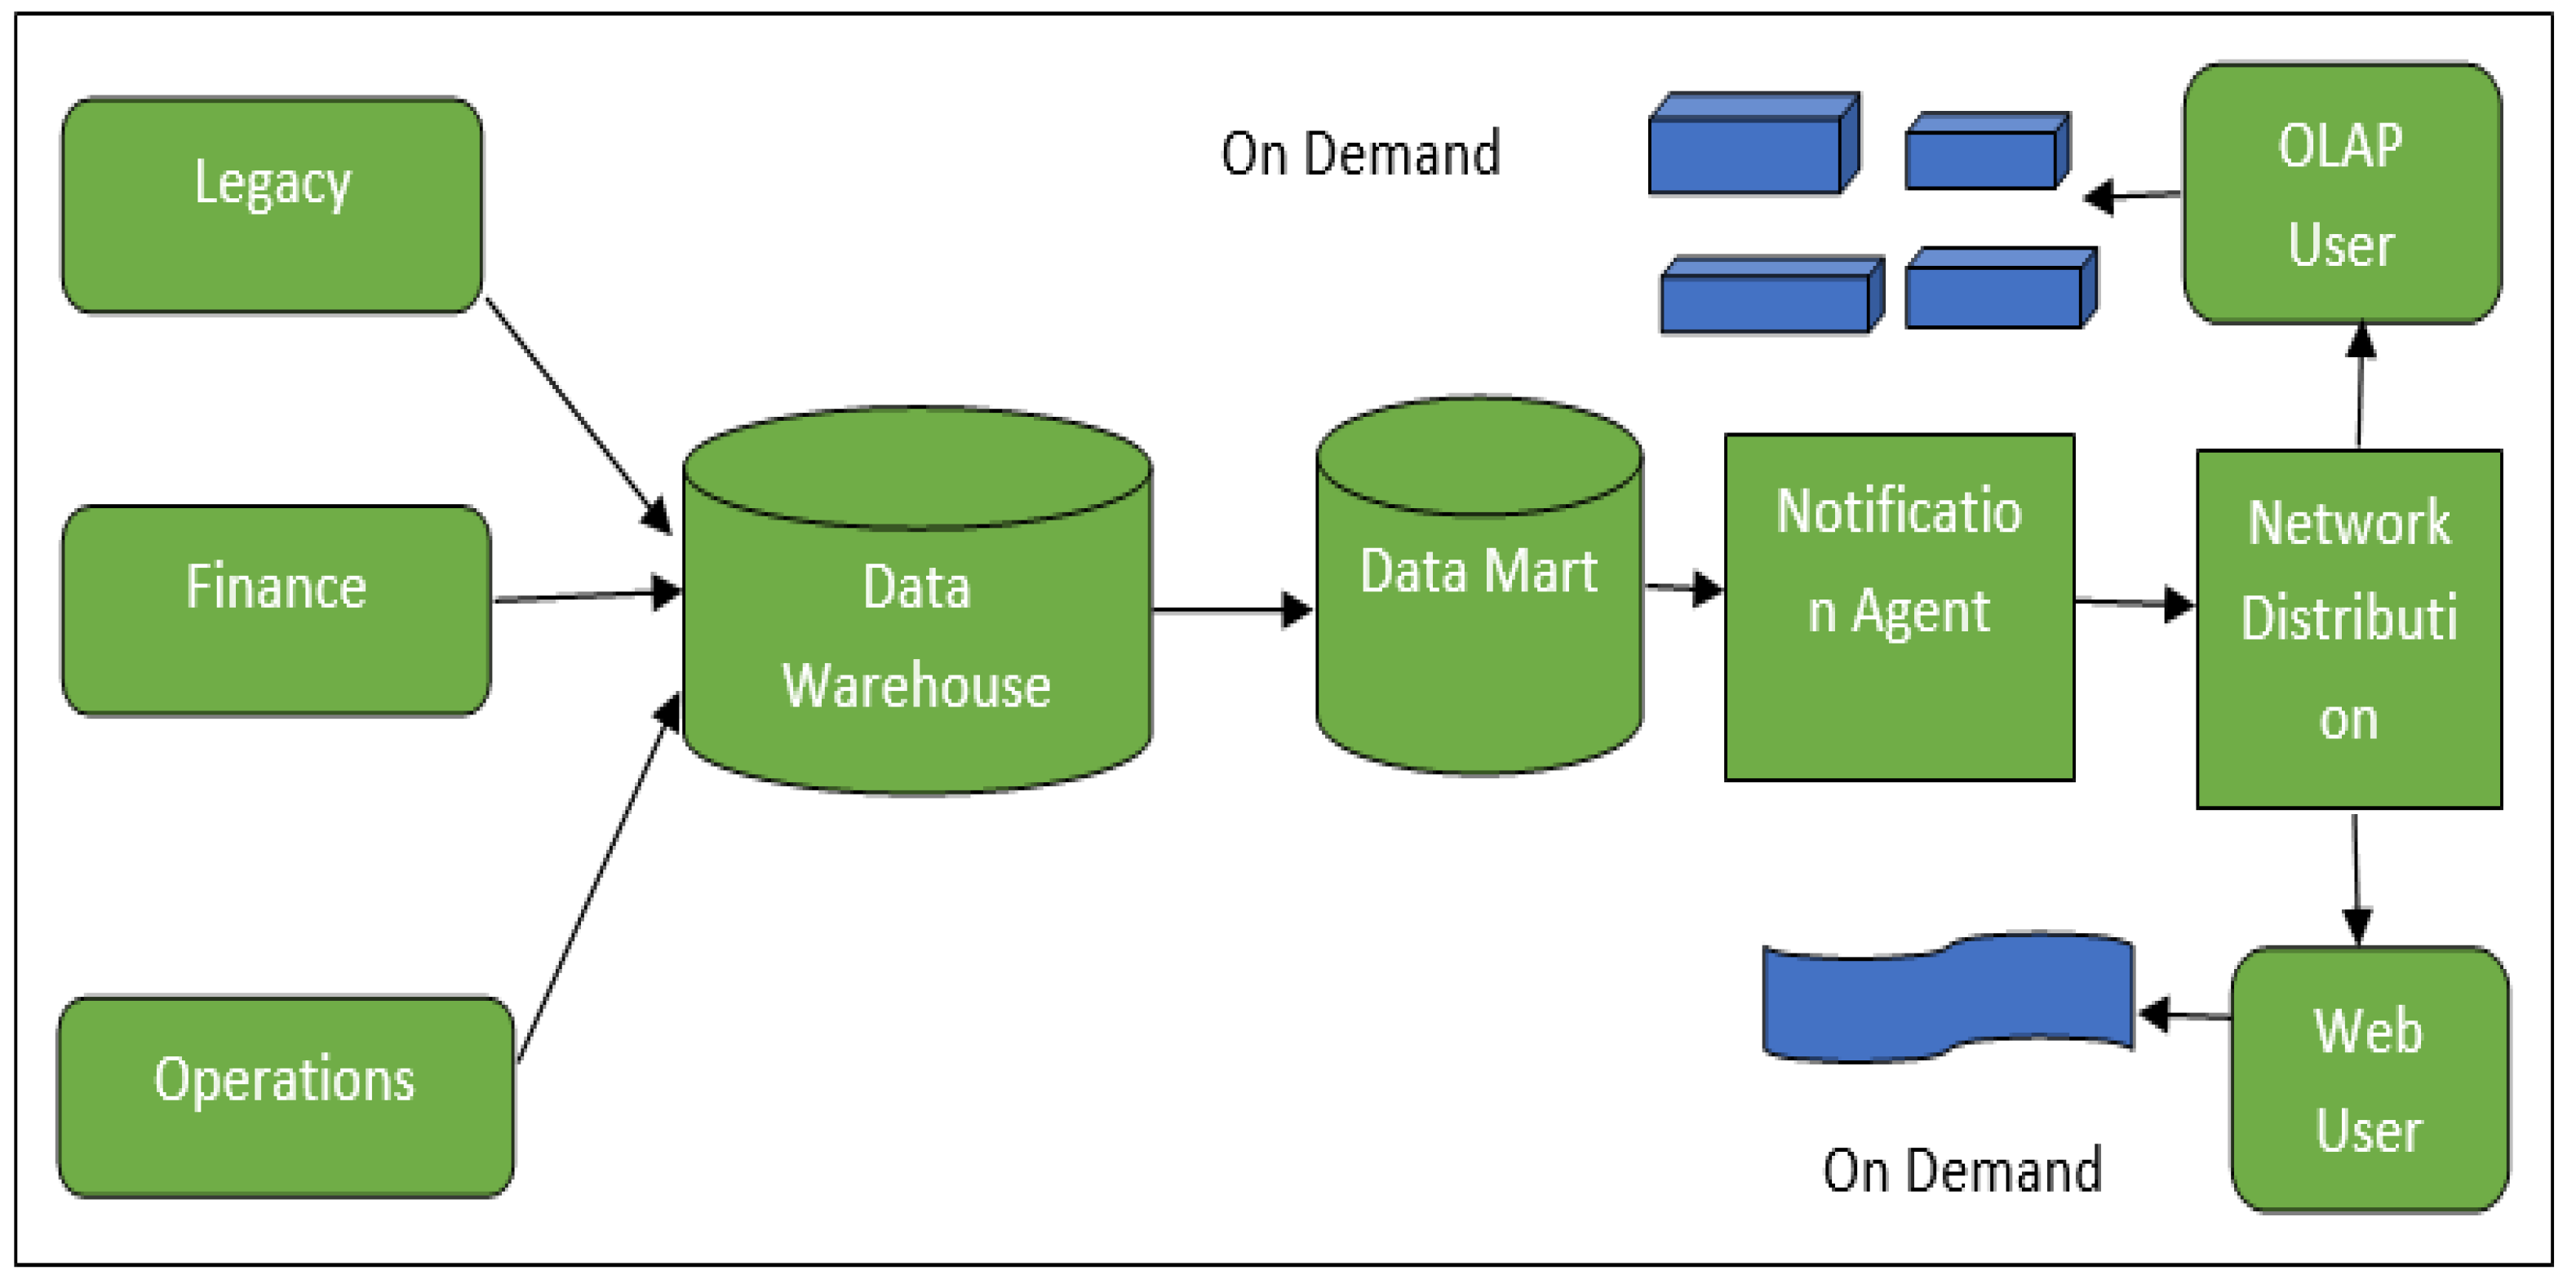
3.5. BI Framework for Structured Data

Figure 6 depicts a business intelligence architecture for structured data centers utilizing a data warehouse. It also shows how data are removed from operational systems to a data warehouse and distributed to the end user using internet browser technologies [20].
The Figure 6 framework comprises legacy (i.e., (out)dated) computing software and/or hardware still in use but not developed further) and finance systems with associated operations, all feeding into a data warehouse discussed before. The data warehouse comprises one or more data marts that link with a notification agent, which conducts a network distribution to online analytical processing (OLAP) users and web users. The said users provide on-demand services [17,20].
In line with the spirit of BI, the financial system analyzes financial data used for optimal financial planning and forecasting decisions and outcomes, while OLAP maintains the data warehouse and supports complex analyses of these.
A notification agent, in the context of Figure 6, is a pluggable component (software) that sends a notification to the user when a CMS activity occurs [17,20,21]. The network distribution component forms part of a distributed computing architecture in which enterprise IT infrastructure resources are divided over several networks, processors, and intermediary devices.
The results are obtained when data are routinely pushed from the data source in response to explorations by OLAP analysts and Web users. The output can be in several different formats and documents (refer to the discussion of structured and unstructured data in the previous section). These documents include routine reports, exception reports, and responses to specific requests. The results are generated whenever boundaries are outside the pre-specified bounds [17,20].
The Figure 6 framework is supported by Table 1, which shows the attributes of the structured data. These include the type of data in the framework as well as the focus derivation, which in turn includes the format, the administration, and the functionality, again in turn including capacity planning, space allocation, indexing, and disk utilization [20].
Observations from Figure 6, with the support of Table 1 containing the attributes of the structured data, lead to our following content proposition.
  • Proposition pC6a: A BI framework dealing with both structured and unstructured data ought to include a notification agent, a distribution agent, and an OLAP component to assist the finance and operations sections that may be running legacy systems.
The above observation of dealing with data from different source systems such as legacy, finance, and operations, together with such data being structured and unstructured, creates a need for BI rationalization and information development management, leading to an enhanced and final version of the proposition pC6a:
  • Proposition pC6: A BI framework dealing with both structured and unstructured data ought to include:
    A notification agent, a distribution agent, and an OLAP component to assist the finance and operations sections that may be running legacy systems.
    Rationalized terms and definitions components, as well as an information development management component [15,20]. as follows:
    Rationalized terms and definitions aim to reduce overlapping tools and data duplication and also promote BI standards.
    With respect to information development management, structured and unstructured data should be transformed into useful information, which in turn may be transformed into knowledge.
A BI rationalized terms and definitions component aims to effectively exploit, manage, reuse, and govern enterprise data assets (including models that describe them). Knowledge resulting from information development denotes information on which an action can be taken.
Figure 6 further contains the usual data warehouse and data mart components discussed before; consequently, the same considerations mentioned before hold for these.

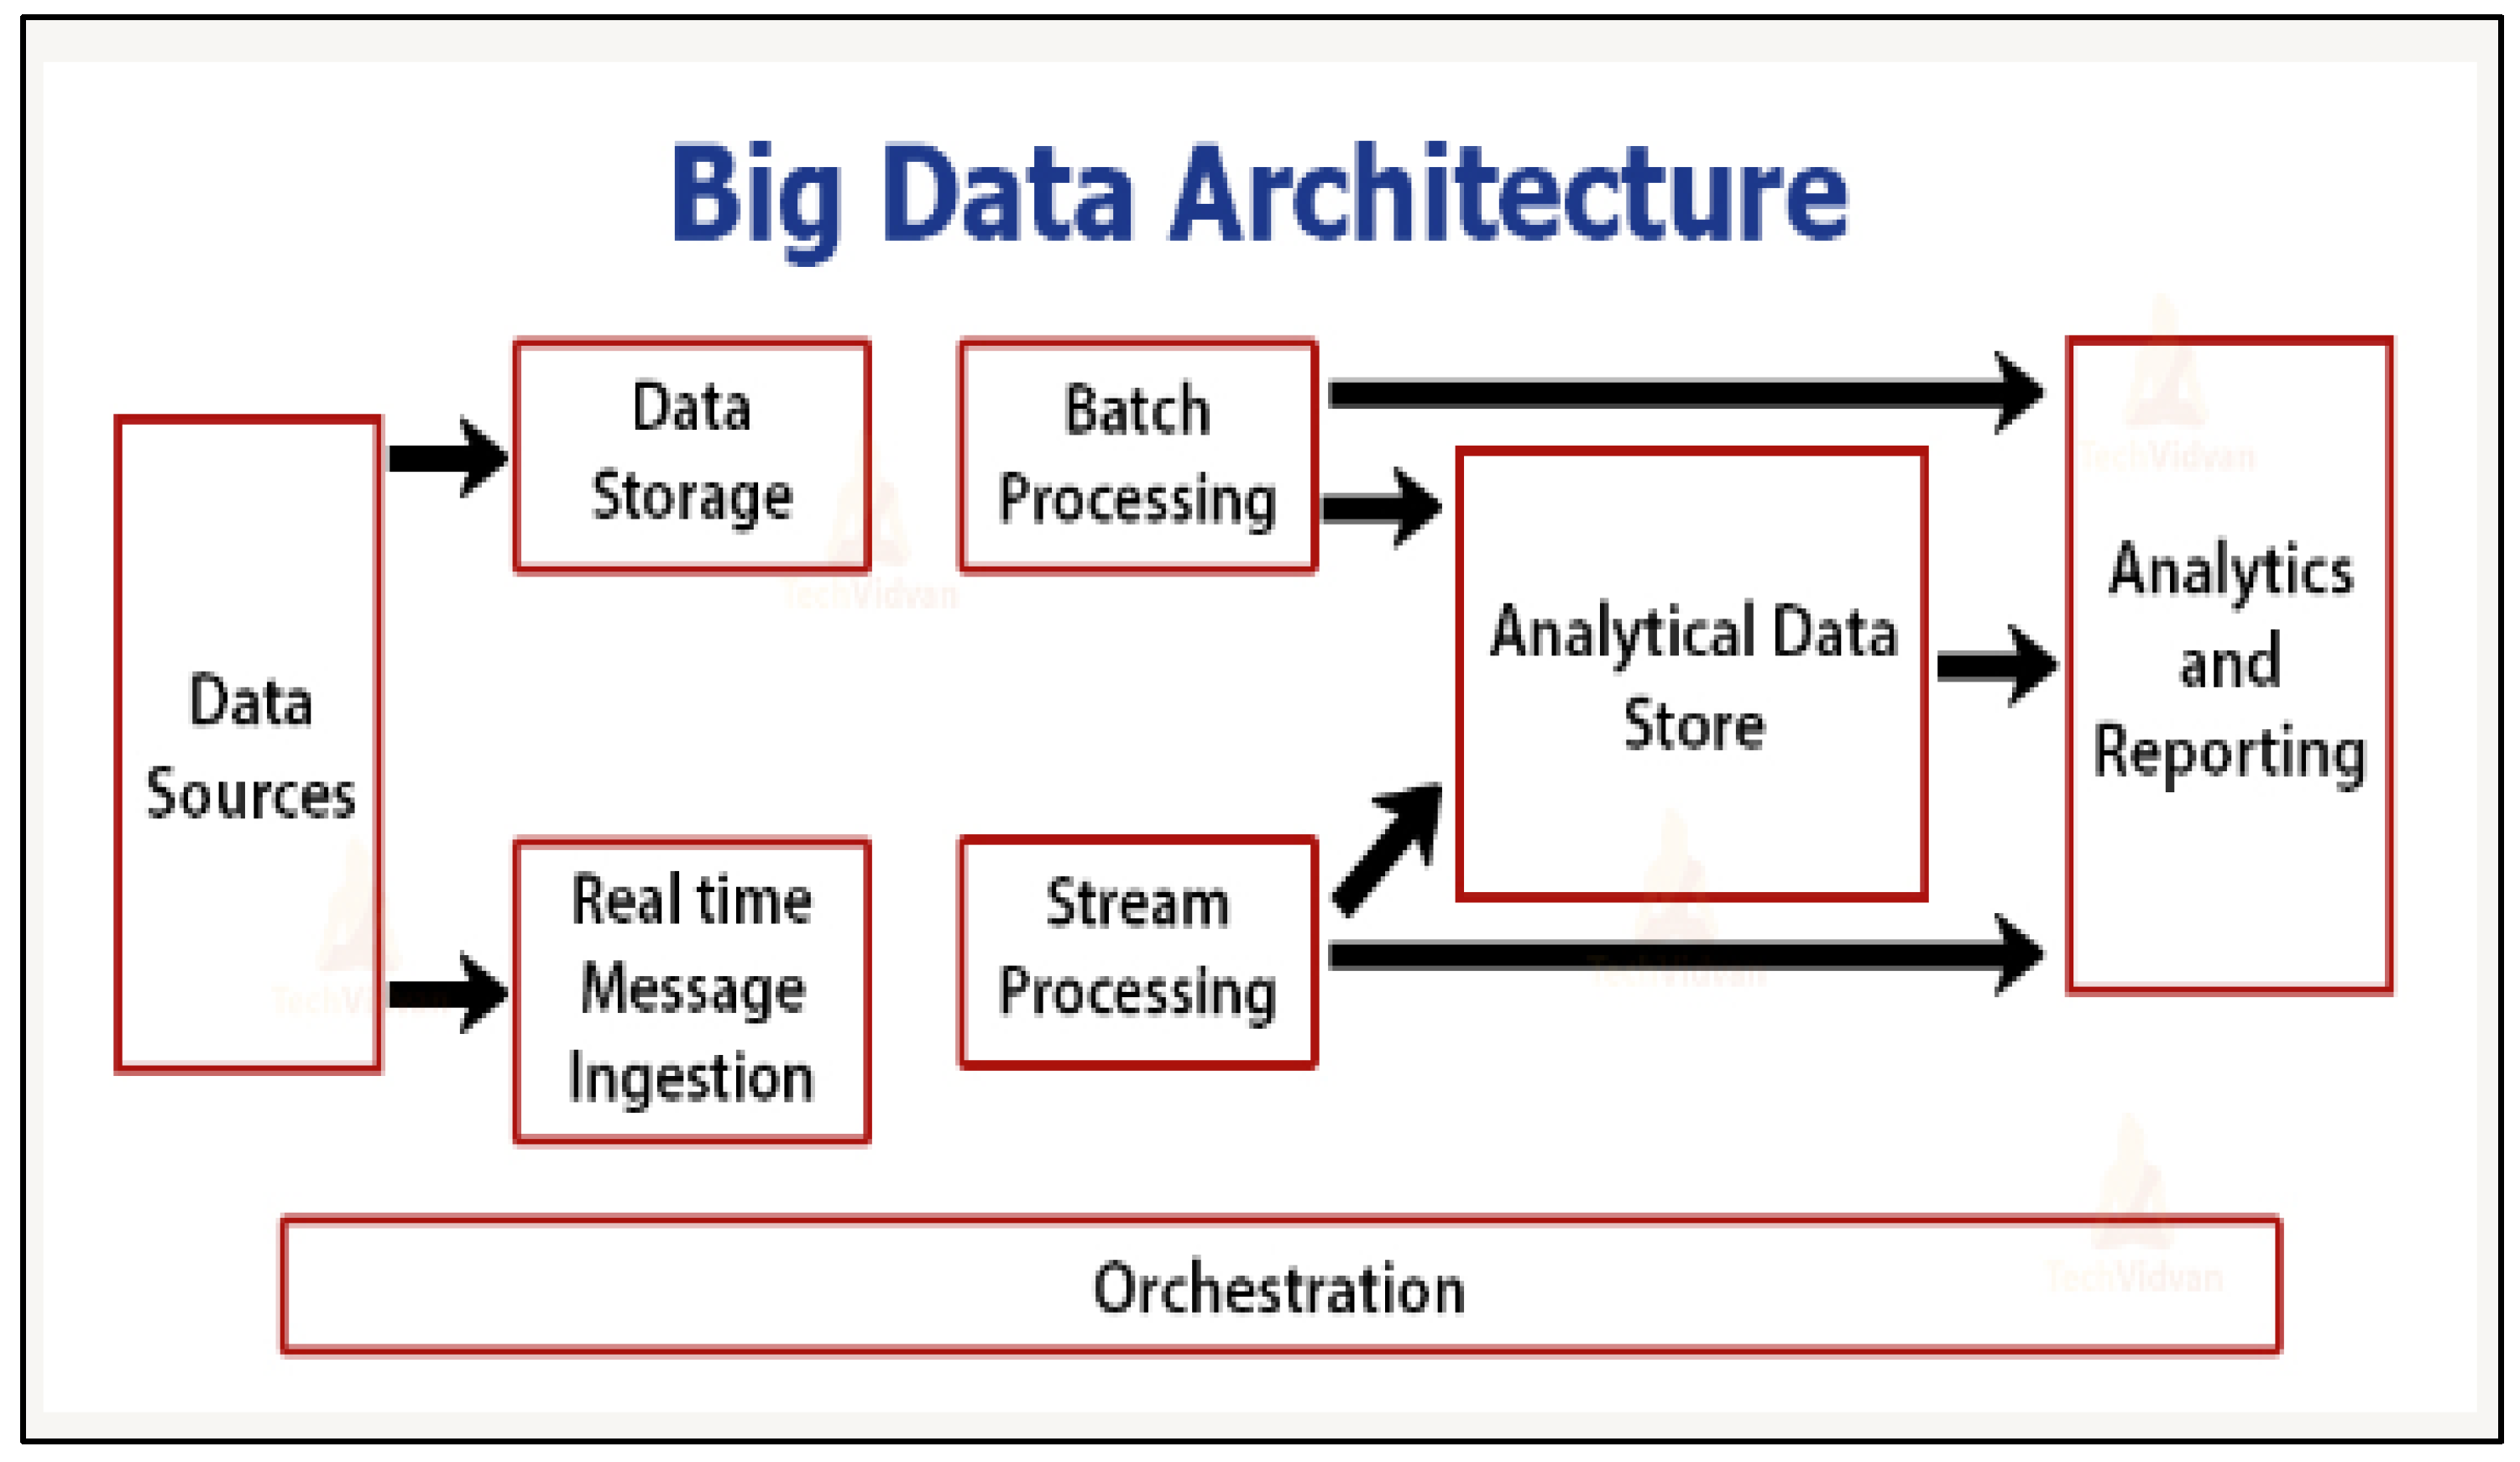
3.6. Big Data Architecture and Patterns Framework

A big data architecture and patterns BI framework shown in Figure 7 refers to the logical and physical structure that indicates how large volumes of data are embedded, processed, stored, managed, and accessed [22].
The Figure 7 framework comprises a data sources component, which serves as the data source for the framework. The data storage component links with a data store and a real-time message ingestion system responsible for dealing with real-time communication. The batch- and stream-processing components feed into the analytical data store, which in turn feeds into the processes for analytics and reporting. Both batch processing and stream processing individually also feed into processes for analytics and reporting [22,23].
An analytical data store, in the context of Figure 7, receives input from data sources either in batches or streams and stores these for analytical purposes. The analytics and reporting component is a BI tool for analyzing data and producing data insights (in the form of knowledge—refer to proposition pC6) for the business. It receives data either from batch processing and stream processing or from the analytical data store. The orchestration in the context of Figure 7 is the execution processes that indicate how data are utilized, from the data source components to the analytical and reporting components [22,23].
The Figure 7 framework offers advantages in that it [22,23]:
  • Maintains a data source component for source data.
  • Offers a data-storage component for maintaining data.
  • Embeds the functionality of ingesting data streams continuously for quick analysis via the stream processing component.
  • Filters, transforms, and enhances data before passing it to the applications data stores and other processing engines.
The above advantages of the Figure 7 framework lead to:
  • Proposition pC7: A BI framework dealing with data processing ought to include real-time, batch, and stream processing to assist with the processing of data either in batches or continuously as transactions happen on the operational side of the business.
The Figure 7 framework incurs a disadvantage [22,24] and an ambiguity:
  • As a disadvantage, it makes data extraction hard as, most of the time, the data are not partitioned per business unit.
  • As an ambiguity, neither the data storage nor the real-time message ingestion seem to feed into further components. Therefore, while the Figure 7 framework may appear to be an operational (dynamic) framework in which there is a left-to-right flow, it may indeed be a static framework.
The Figure 7 framework contains the usual data sources, which are the operational data sources, and a data storage component. These have been discussed before; consequently, the same considerations mentioned before hold for them.
Next, we discuss a data lake architecture framework.

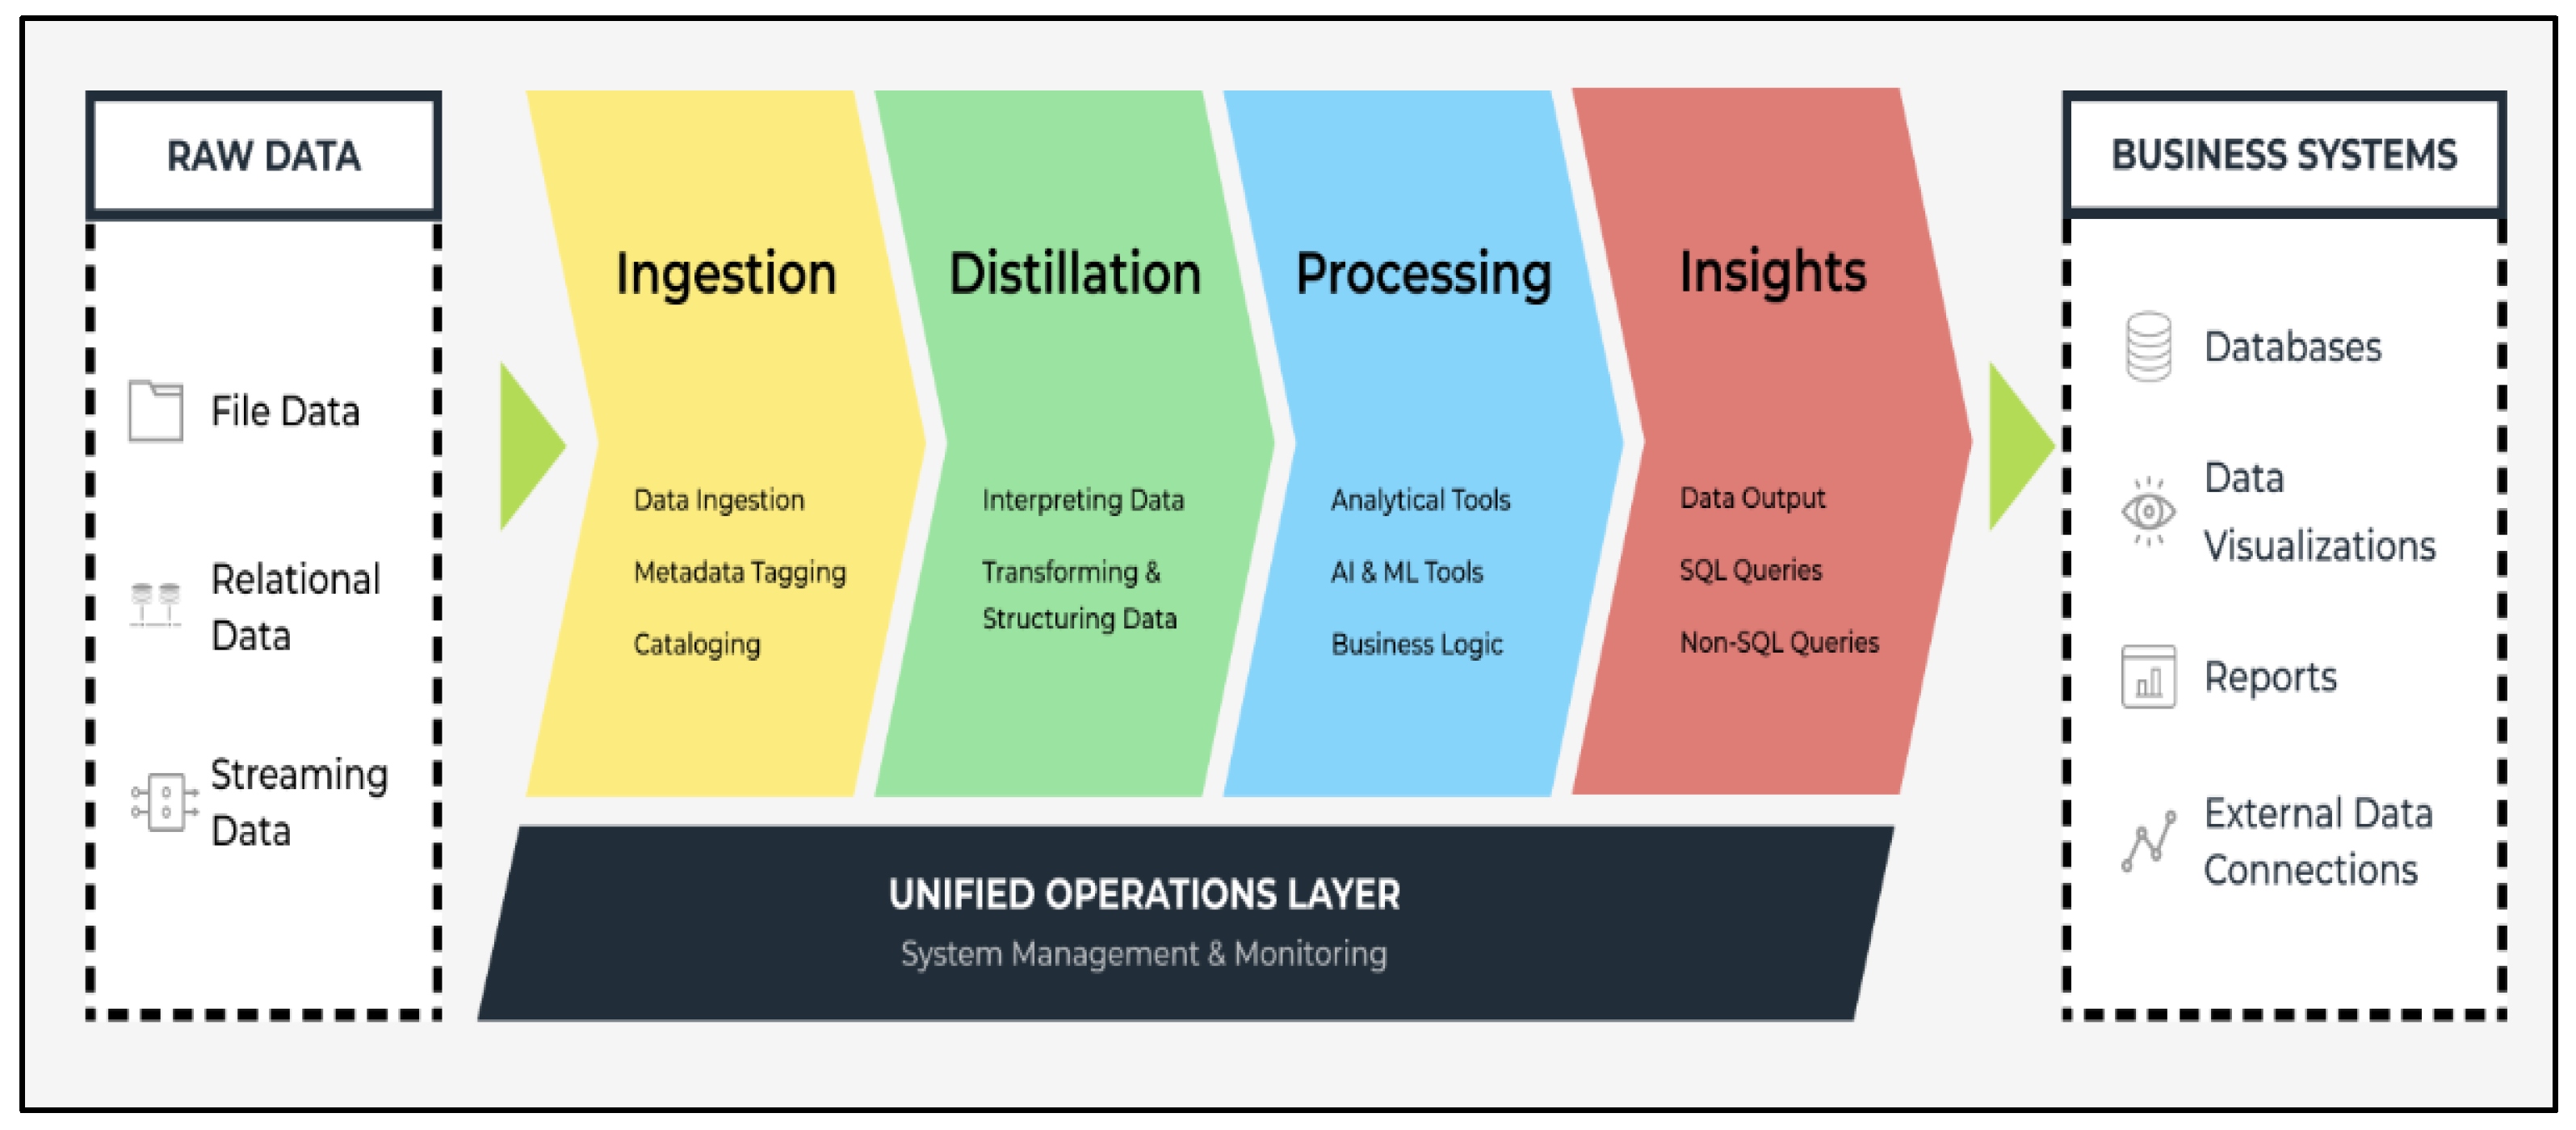
3.7. BI Data Lake Architecture Framework

As shown in Figure 8 below, a data lake architecture framework is a centralized repository that allows an organization to manage structured and unstructured data. One of the lucrative features of the data lake architecture is that one can store all the data in native format [25], meaning the framework defines a future-proof environment for raw data, unconstrained and unfiltered by traditional, strict database rules and relations at write-time. The ingested raw data are omnipresent, and they can be re-interpreted and analyzed as needed [25].
The Figure 8 framework comprises raw data components, containing file data, relational data, and streaming data. The unified operations layer component comprises a sequence of associated operations, all feeding data into a business system component. The business system component comprises BI tools for analyzing, visualizing, and producing reports for internal business use as well as external parties through data connections [25,26].
The Figure 8 unified operations layer provides a finer context for the link between the raw data and the business systems. The said layer ingests, interprets, processes, and produces data for the business systems. As indicated, data are sourced from a raw data layer, which connects to a unified operations layer, and deposited into the business system databases for reporting purposes. Ingestion involves metadata tagging and cataloging; data interpretation; data transformation; and structuring in the distillation subcomponent. The data are subjected to analytical and artificial intelligence tools, and business logic is applied before the said information is presented for visualization and business reporting [25].
The following advantages are incurred by the Figure 8 framework [25,27]:
  • A variety of data, with respect to format, semantics, and so forth, are processed.
  • The framework interfaces with external databases.
  • The relational database model is supported.
  • Backup and restore capabilities are provided.
  • Data ingestion, data distillation, data processing, and data insight are supported.
  • The framework is an operational (dynamic) framework since there is a left-to-right flow of data.
The advantages of the Figure 8 framework lead to our next content proposition.
  • Proposition pC8: A BI framework dealing with processing operational data ought to embed a unified operation layer that includes steps of ingestion, distillation, processing, which in turn utilizes various tools and business logic, and insights, all aimed at moving from raw data to business systems for reporting.
The above observation of raw data and unified operations data that include data ingestion, data interpretation, data processing, and data output led to [25,26]:
  • Proposition pC9: A BI framework dealing with raw data should include:
    Data definition Management involves embedding all the formal processes for defining data.
    Data development management to:
    Develop, collect, process, and interpret data.
    Perform backup, restore, archive, and recall functions.
    Cater for business restrictions and rules catered for by business logic (cf. proposition pC8).
    Data operations management to integrate people, processes, and products to enable consistent, automated, and secured data in large databases (or a warehouse—refer to proposition pC1).
Naturally, the backup, restore, archive, and recall functions cater to data storage should data stored in the data warehouse become corrupted or lost. A copy of the same data can be restored to the data warehouse.
The Figure 8 framework also contains the usual operational data sources component and external data connection functionality in the business system component discussed before. Consequently, the same considerations mentioned before hold for these.
Next, we consider a BI framework that uses an active database approach.

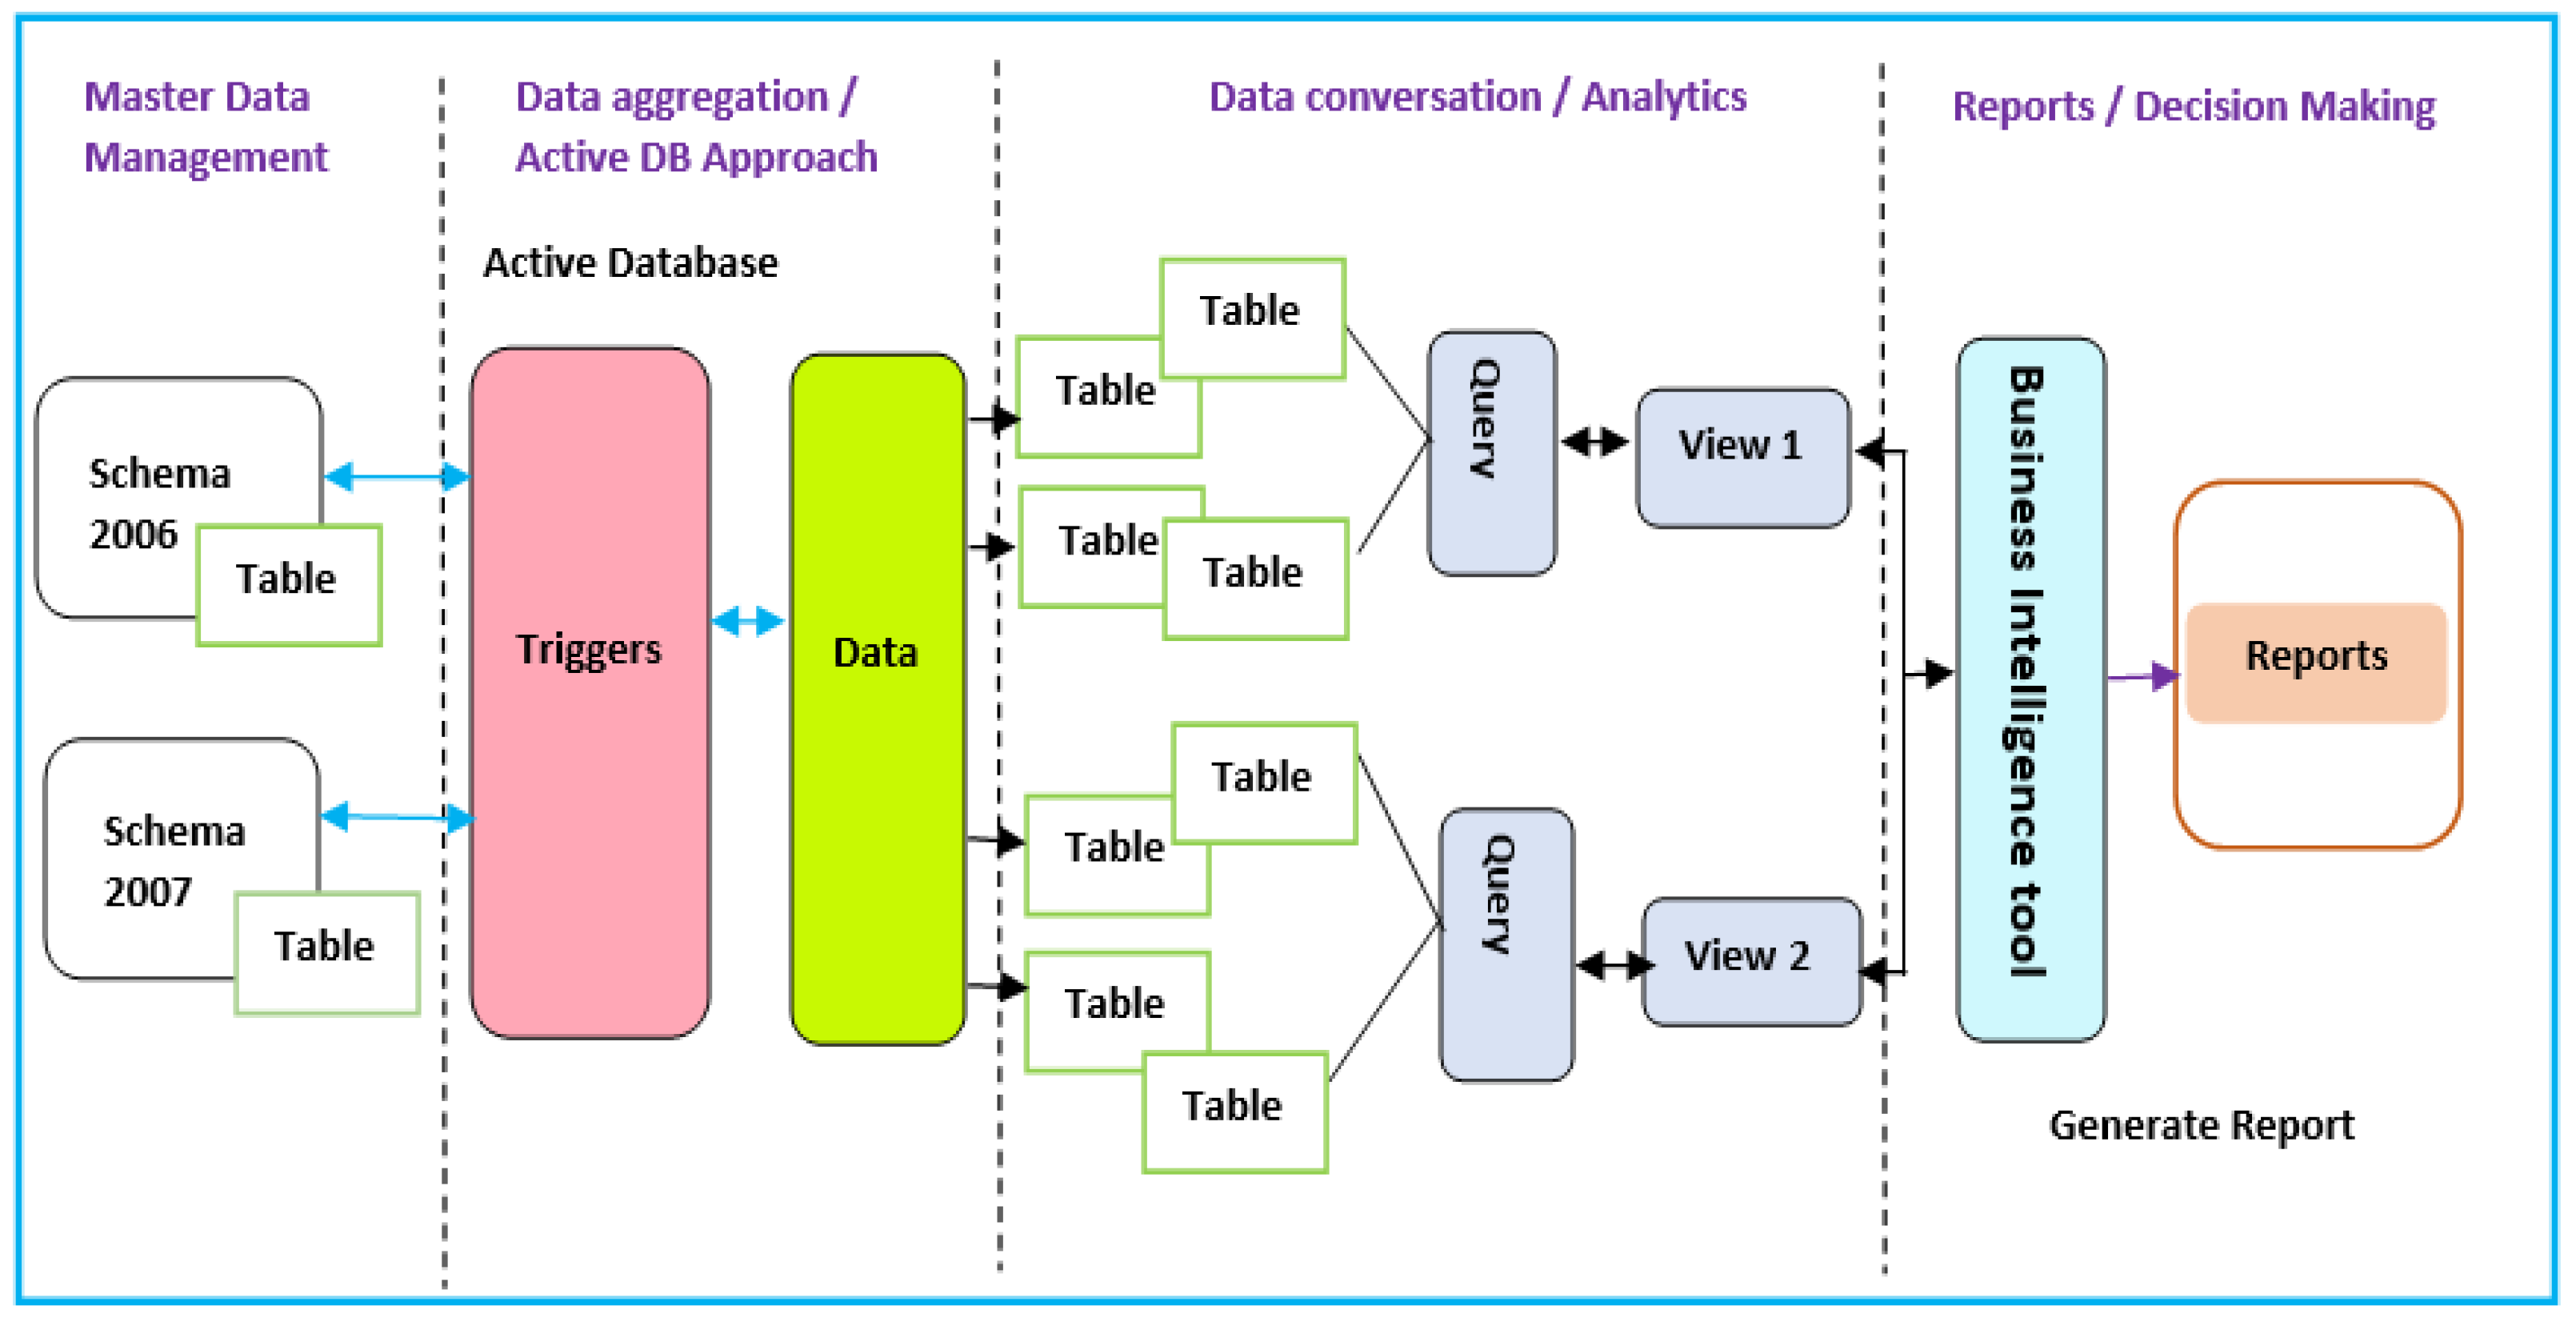
3.8. Business Intelligence Framework Using an Active Database Approach

An active database BI framework in Figure 9 below includes an event-driven architecture to respond to conditions both internal and external to the database. Possible uses of the framework include security monitoring, alerting, statistics gathering, and authorization [27].
The Figure 9 framework comprises a master data management component that links with a data aggregation/active database component, comprising triggers that control the movement of data from the master to an active database and vice versa. Master data management, as the central source, contains schemas made up of tables. Data aggregation comprises triggers that compile information from databases with the intent of preparing combined datasets for further processing. Data conversation/analytics analyze the raw data to make deductions from such information; they assist a business in performing more efficiently, increasing profit, and making strategically guided decisions [6,27].
Report generation and decision-making, in the context of Figure 9, is a pluggable component comprising BI tools that draw data from the data analytics component, visualize data, and generate reports. In line with 4IR technologies, BI tools come with more variety depending on what the business prefers or which tool can handle what volume of data. The tools may be a selection of Tableau, Qlik Sense, QlikView, and Power BI [6,27].
The Figure 9 framework offers the following advantages [6,27].
  • Master data management assists businesses in sourcing facts from a central source.
  • Data analytics assist businesses in improving their performance.
  • Data aggregation facilitates data analysis, providing leaders with improved insight.
  • BI tools enable a business to visualize data and generate reports.
  • Traditional database functionalities are enhanced through powerful rules for processing capabilities.
  • A uniform and centralized description of the business rules relevant to the information system is enabled (cf. proposition pC8).
  • Redundancy with respect to checking and repair operations is reduced.
The advantages of the Figure 9 framework inform the following content proposition:
  • Proposition pC10: A BI framework dealing with processing in the context of an active database ought to:
    Include a master data management (MDM) component that facilitates data reconciliation, offering the benefit of maintaining data external to the organization as well as other data sources, for example, historical data (cf. Schema 2006, Schema 2007 in Figure 9).
    Embed data aggregation, whereby data are gathered from multiple sources and expressed in a summary form, i.e., reporting.
The Figure 9 framework contains the usual data analytics and BI tool components discussed before. Consequently, similar considerations mentioned before hold for these.

3.9. Traditional Business Intelligence (TBI) Architecture Framework

A traditional business intelligence architecture depicted in Figure 10 is designed for strategic decision-making, where a small number of expert users analyze historical data to prepare reports or build models. Decision-making cycles typically last weeks or months [28].
The Figure 10 framework comprises data sources with operational databases and external data that link with a staging area using data integration pipelines. Data are moved by ETL processes via a staging area to a data warehouse. An operational system moves data into and receives data from various databases through online transactional processing (OLTP). A monitoring and administration component manages metadata between the data sources and staging area through the ETL processes. A data warehouse comprises data marts for use in data mining, involving analytics, OLAP, and query processing [28,29,30,31].
The Figure 10 framework offers advantages of [28,29,30]:
  • Real-time data extraction.
  • Multidimensional analysis at high speed on large volumes of data.
  • Data storage via a staging area.
  • Online transactional processing (OLTP).
The Figure 10 framework does not bring any new content for our BI framework. But it supports earlier propositions, among others, proposition pC5 in terms of ETL aspects and underlying quality metrics (QoX). Aspects around data warehousing, OLAP, and analytic applications were likewise observed in earlier frameworks and captured by earlier propositions.
A logic-layer framework is discussed next.

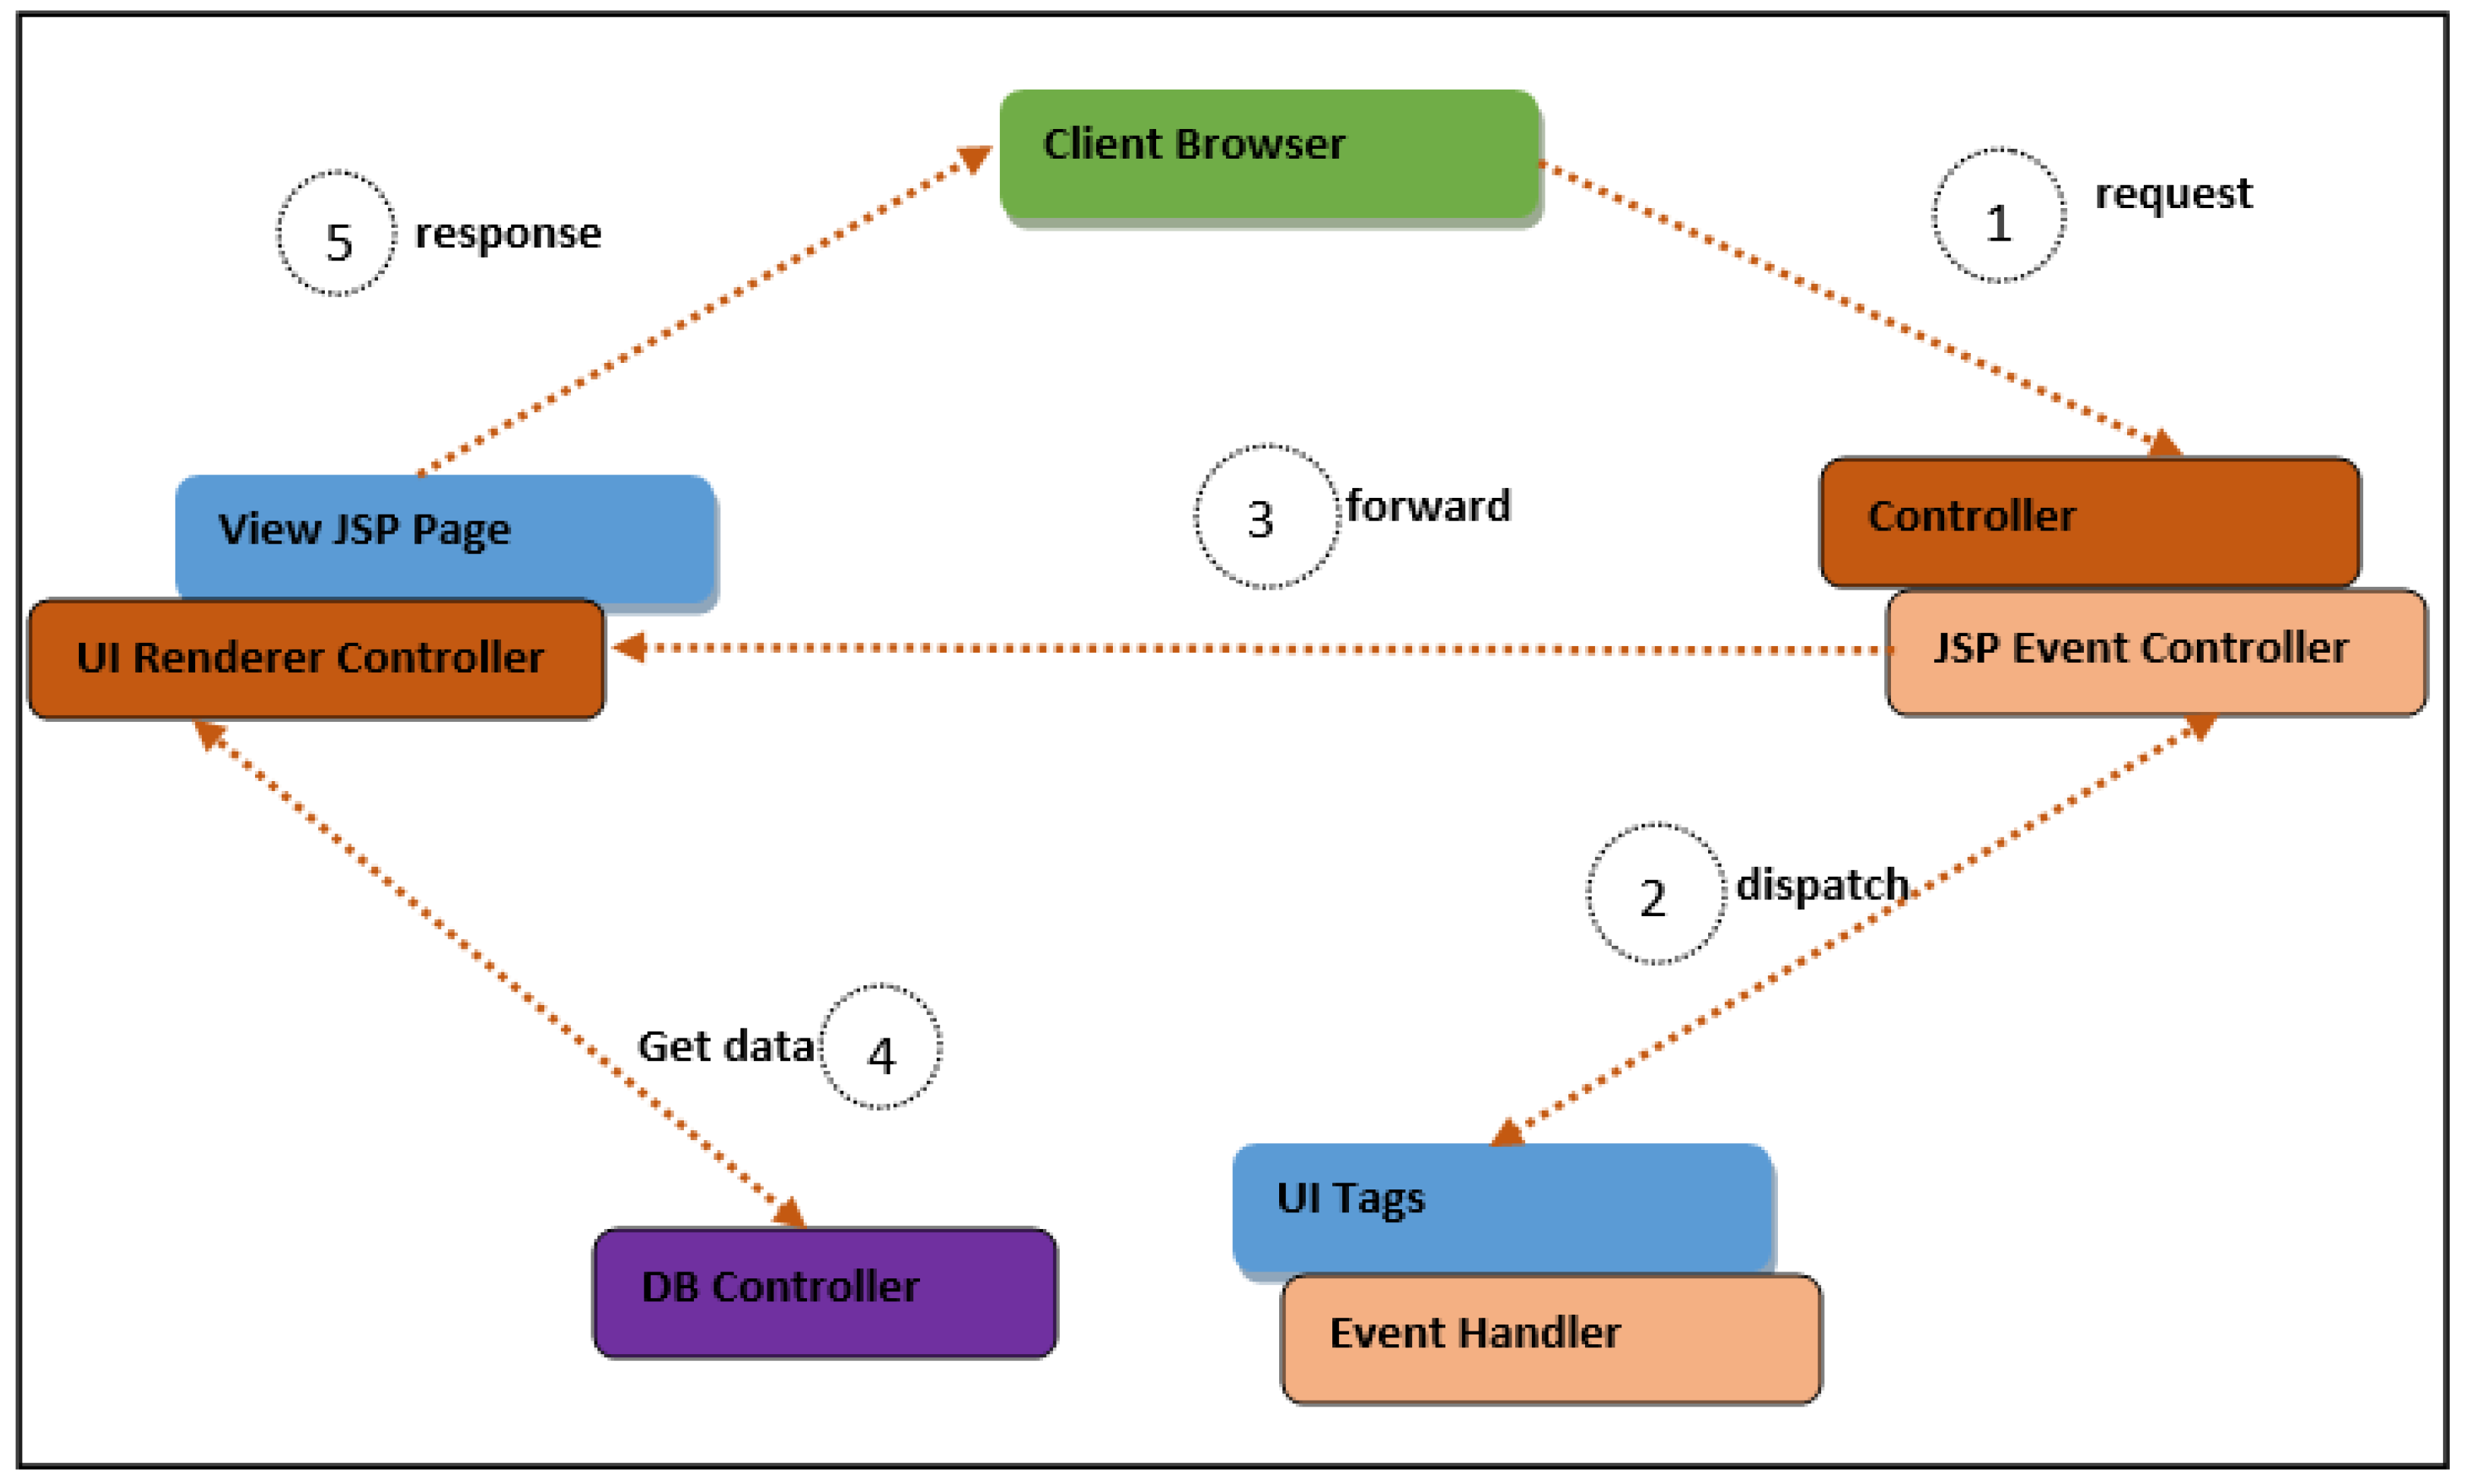
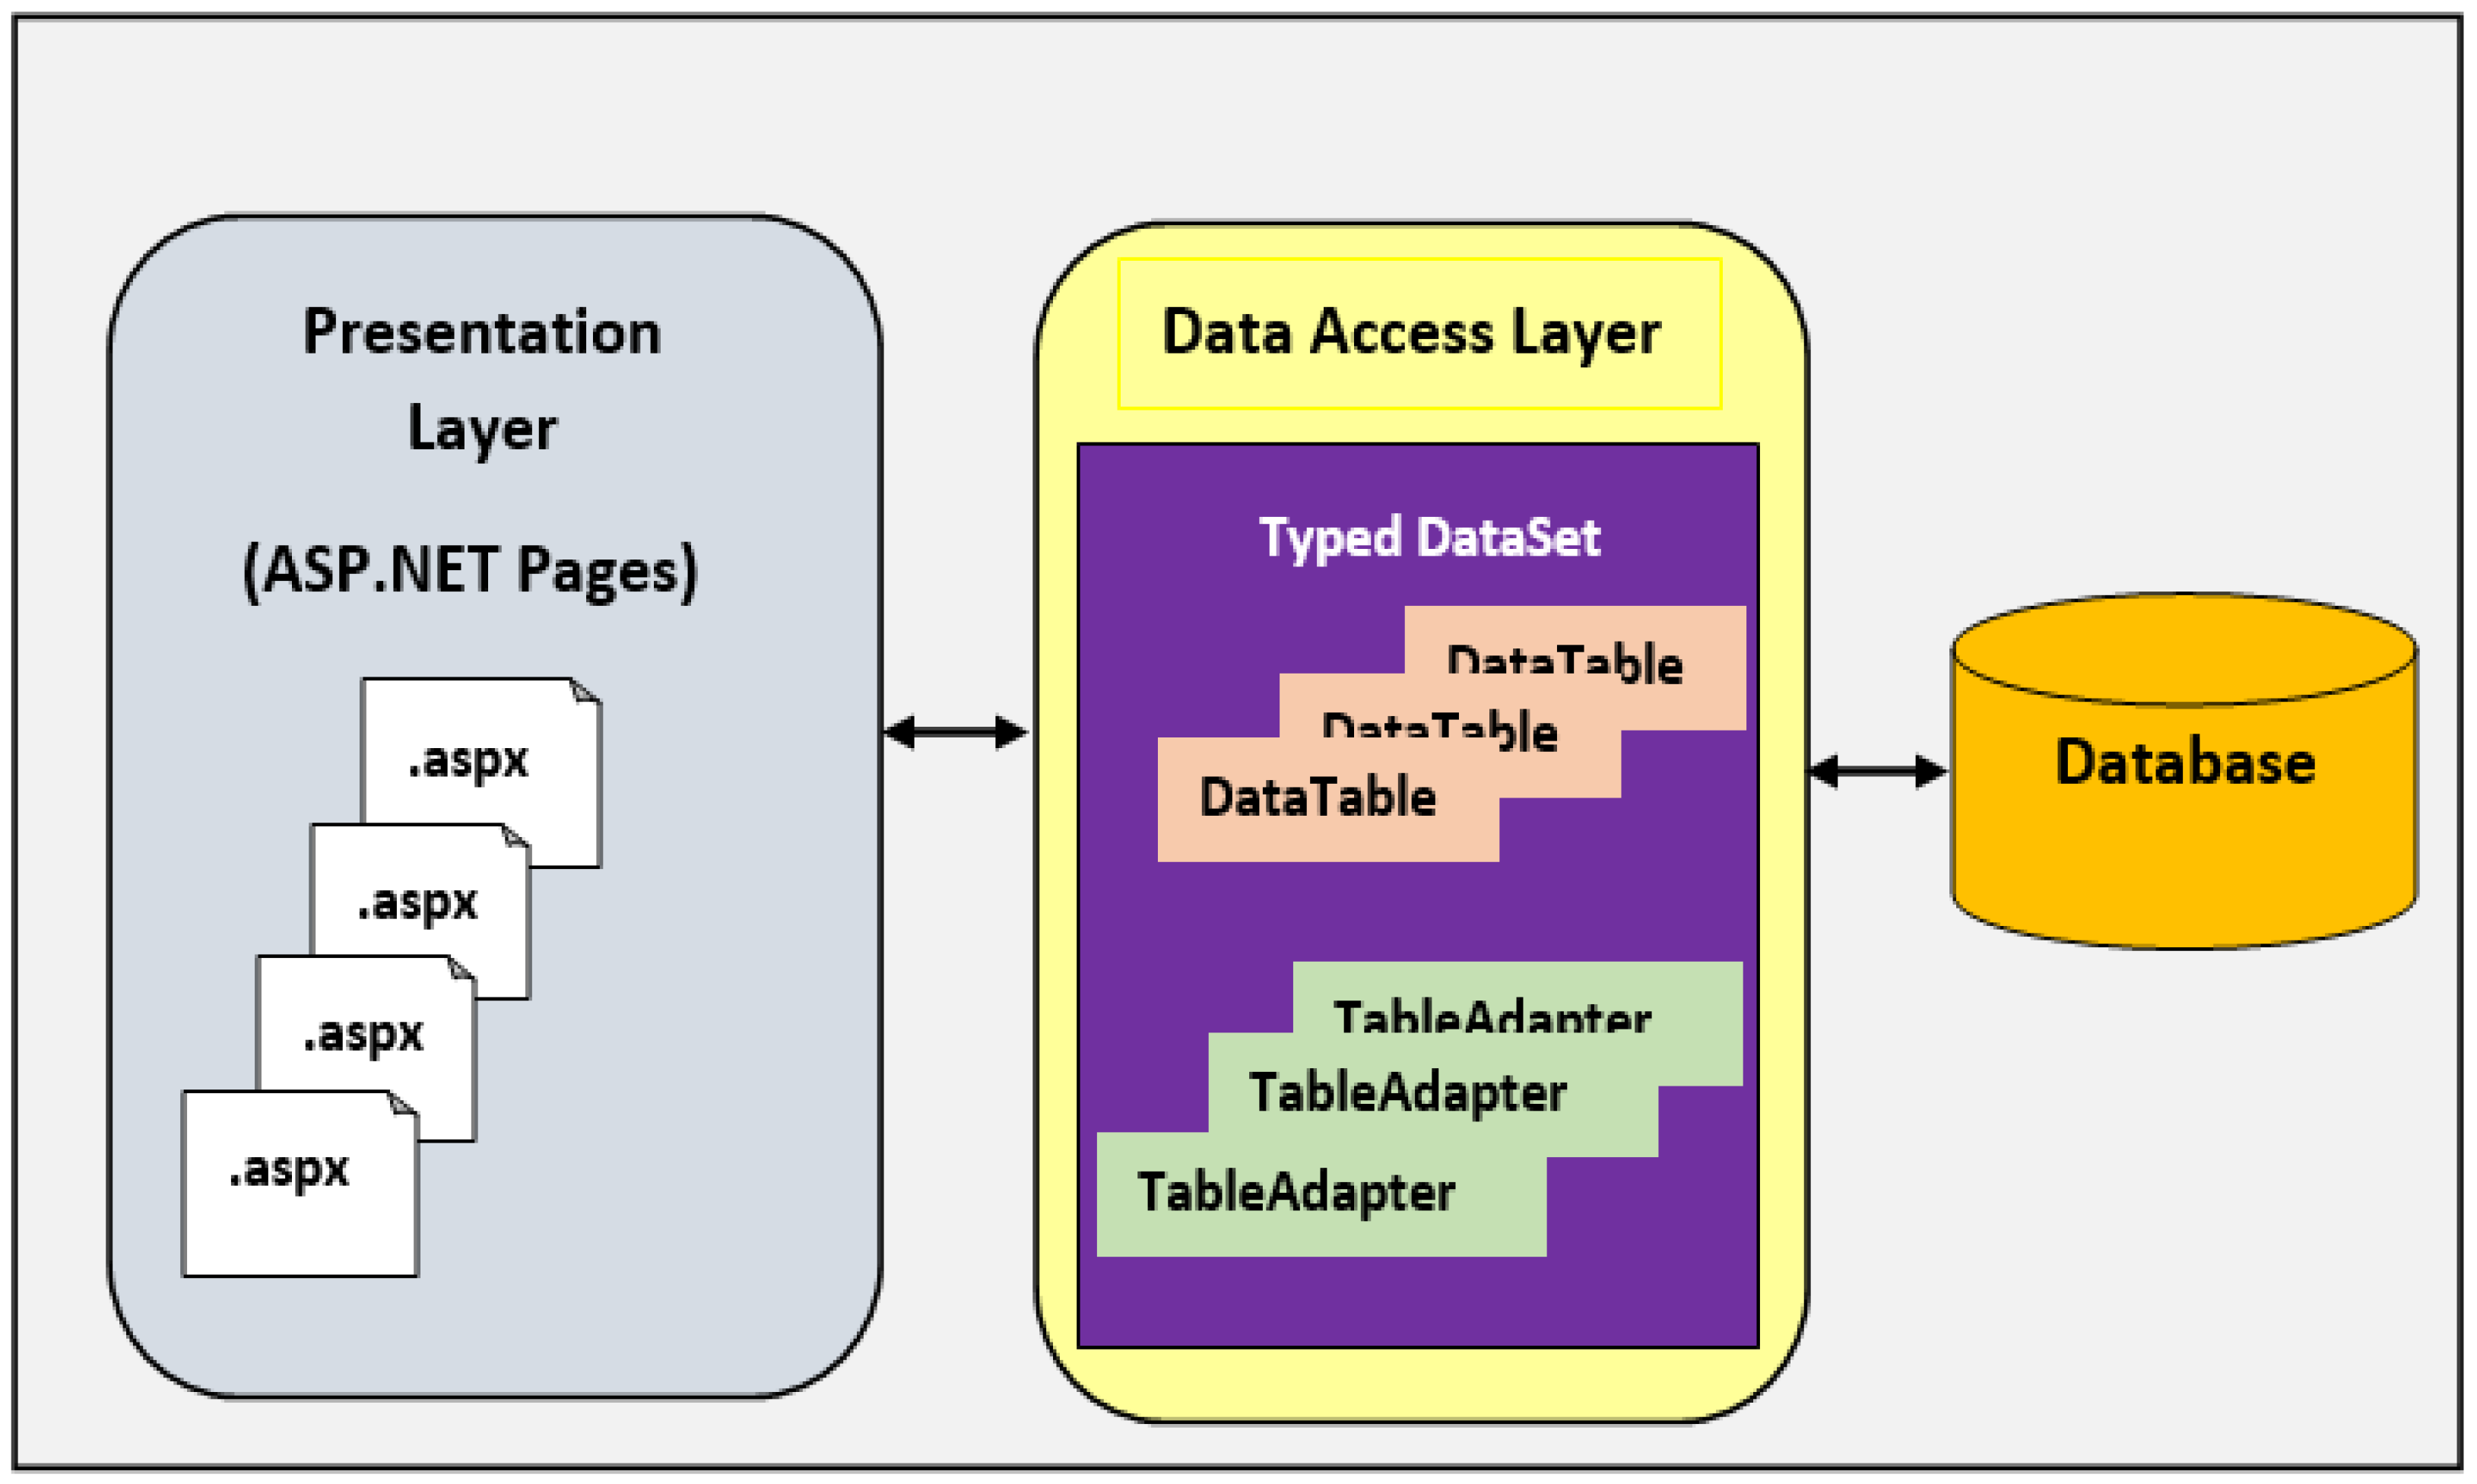
3.10. Logic Layer BI Framework

The logic layer of a BI framework shown in Figure 11 [32] below acts as an intermediate between the data layer and the access layer, as in the Figure 3 framework above, but it does not contain data storage.
The Figure 11 framework comprises a client browser, which is an extension and helper application that enhances the browser for dealing with special services from the site. The JSP Event controller links with the client browser when a request is initiated by the client browser. The UI tags are used to label, organize, or categorize objects (cf. the discussion on taxonomies and ontologies above), and the event handler component links to the JSP event controller when the event is dispatched [32].
The View JSP page links with the client browser when the response is required by the client browser, and the UI renderer controller links with the JSP event controller that forwards the event to the UI renderer to convert all the JSP files into servlets before executing them. The DB controller, which is the data controller that determines the purpose for which and how personal data are processed, links with the UI renderer to facilitate the process of obtaining data [32].
The Figure 11 framework offers advantages by [32]:
  • Facilitating the creation of components containing non-Java code.
  • Acting as an intermediate between the access layer and the data layer.
  • Providing database control functionality that determines which data are to be processed and how such data are processed.
Many of the components in Figure 11 may be part of a standard ICT infrastructure, yet the above advantages make the case for an embedded database controller, leading to:
  • Proposition pC11: If not part of the standard ICT infrastructure, a BI framework ought to embed a DB controller to determine the purpose for which and how such data are processed.
Our next BI framework is related to the Figure 3 framework, which embeds, amongst others, a data access component.

3.11. Access Layer Framework in a BI Environment

An access layer framework depicted in Figure 12 represents a lower level of a BI framework. It delivers data to an end-user device and is sometimes referred to as the desktop layer since it focuses on connecting client nodes to a network. It is the layer at which a user interacts with an application, and the final data will be visible to the user at this interface [33].
The Figure 12 framework comprises a data access layer component that bidirectionally links with both a presentation layer component and a database component. As indicated, it comprises dataset types with data tables and table adapters. Data tables are fundamental building blocks of business intelligence. The table adapter provides communication between the application and the database. It connects to the database, executes stored procedures (e.g., queries), and initializes new tables or amends existing tables [33,34].
The presentation layer is a logical tier where business intelligence client software is used by business users. The responsibility of these visual tools is to surface the data cleanly from the database (which could instead be a data warehouse embedding one or more data marts) to the user. The presentation layer embeds ASP.NET pages containing information from the data access layer [33,34]. Naturally, the database is managed by a DBMS.
The Figure 12 framework offers advantages of [33]:
  • Improved self-service data access.
  • Lower ownership costs.
  • Advanced querying leads to faster reporting and model building.
  • Improved access to open-source capabilities.
The presentation layer is a new component with respect to the frameworks discussed before; hence, we have:
  • Proposition pC12: A BI framework ought to embed a presentation layer that is used to surface data cleanly from a data warehouse or data mart to the user.
Next, we discuss a BI framework for collecting data from diverse sources.

3.12. Data Federation Framework

A data federation framework shown in Figure 13 collects data from diverse sources and converts it into a common model. It allows multiple databases to function as one and provides a single data source for front-end applications [35].
The Figure 13 framework comprises familiar components we encountered with earlier BI frameworks. The virtual databases component is a type of database management system that acts as a container, allowing the view and query of multiple databases [35,36]. Consequently, it amalgamates data from different sources into virtual databases and a data warehouse made up of data marts, hence the idea of a “federation”.
Transactional data represent the information recorded from transactions, and a transaction, in this context, is a sequence of information exchange and related work, e.g., database updating. Historical data in the form of past events or circumstances are maintained in the data warehouse. The system is driven by business intelligence processes. The underlying ETL pipelines should adhere to the said ETL quality metrics (QoX) discussed before.
The Figure 13 framework offers the following advantages [35,36]:
It embeds the idea of a virtual database; hence, no additional storage space is required—the software does not make a full copy of the data from the data source. A virtual database (VDB) in the context of BI is an artifact that defines the logical schema model by combining one or more physical data sources to readily provide for data integration. It maps onto a physical database via a computer network and is accessed as if the two concepts (virtual and multiple physical sources) form a unit. Its goal is to be able to view and access data in a unified way without having to copy and duplicate data in several databases or manually combine a result from several queries.
The above advantages of the Figure 13 framework inform the following content proposition:
  • Proposition pC13: A BI framework should embed virtual database technology to act as a container, allowing the view and query of multiple databases through a single API drawing from numerous sources.
A BI framework based on visualization structures is presented next.

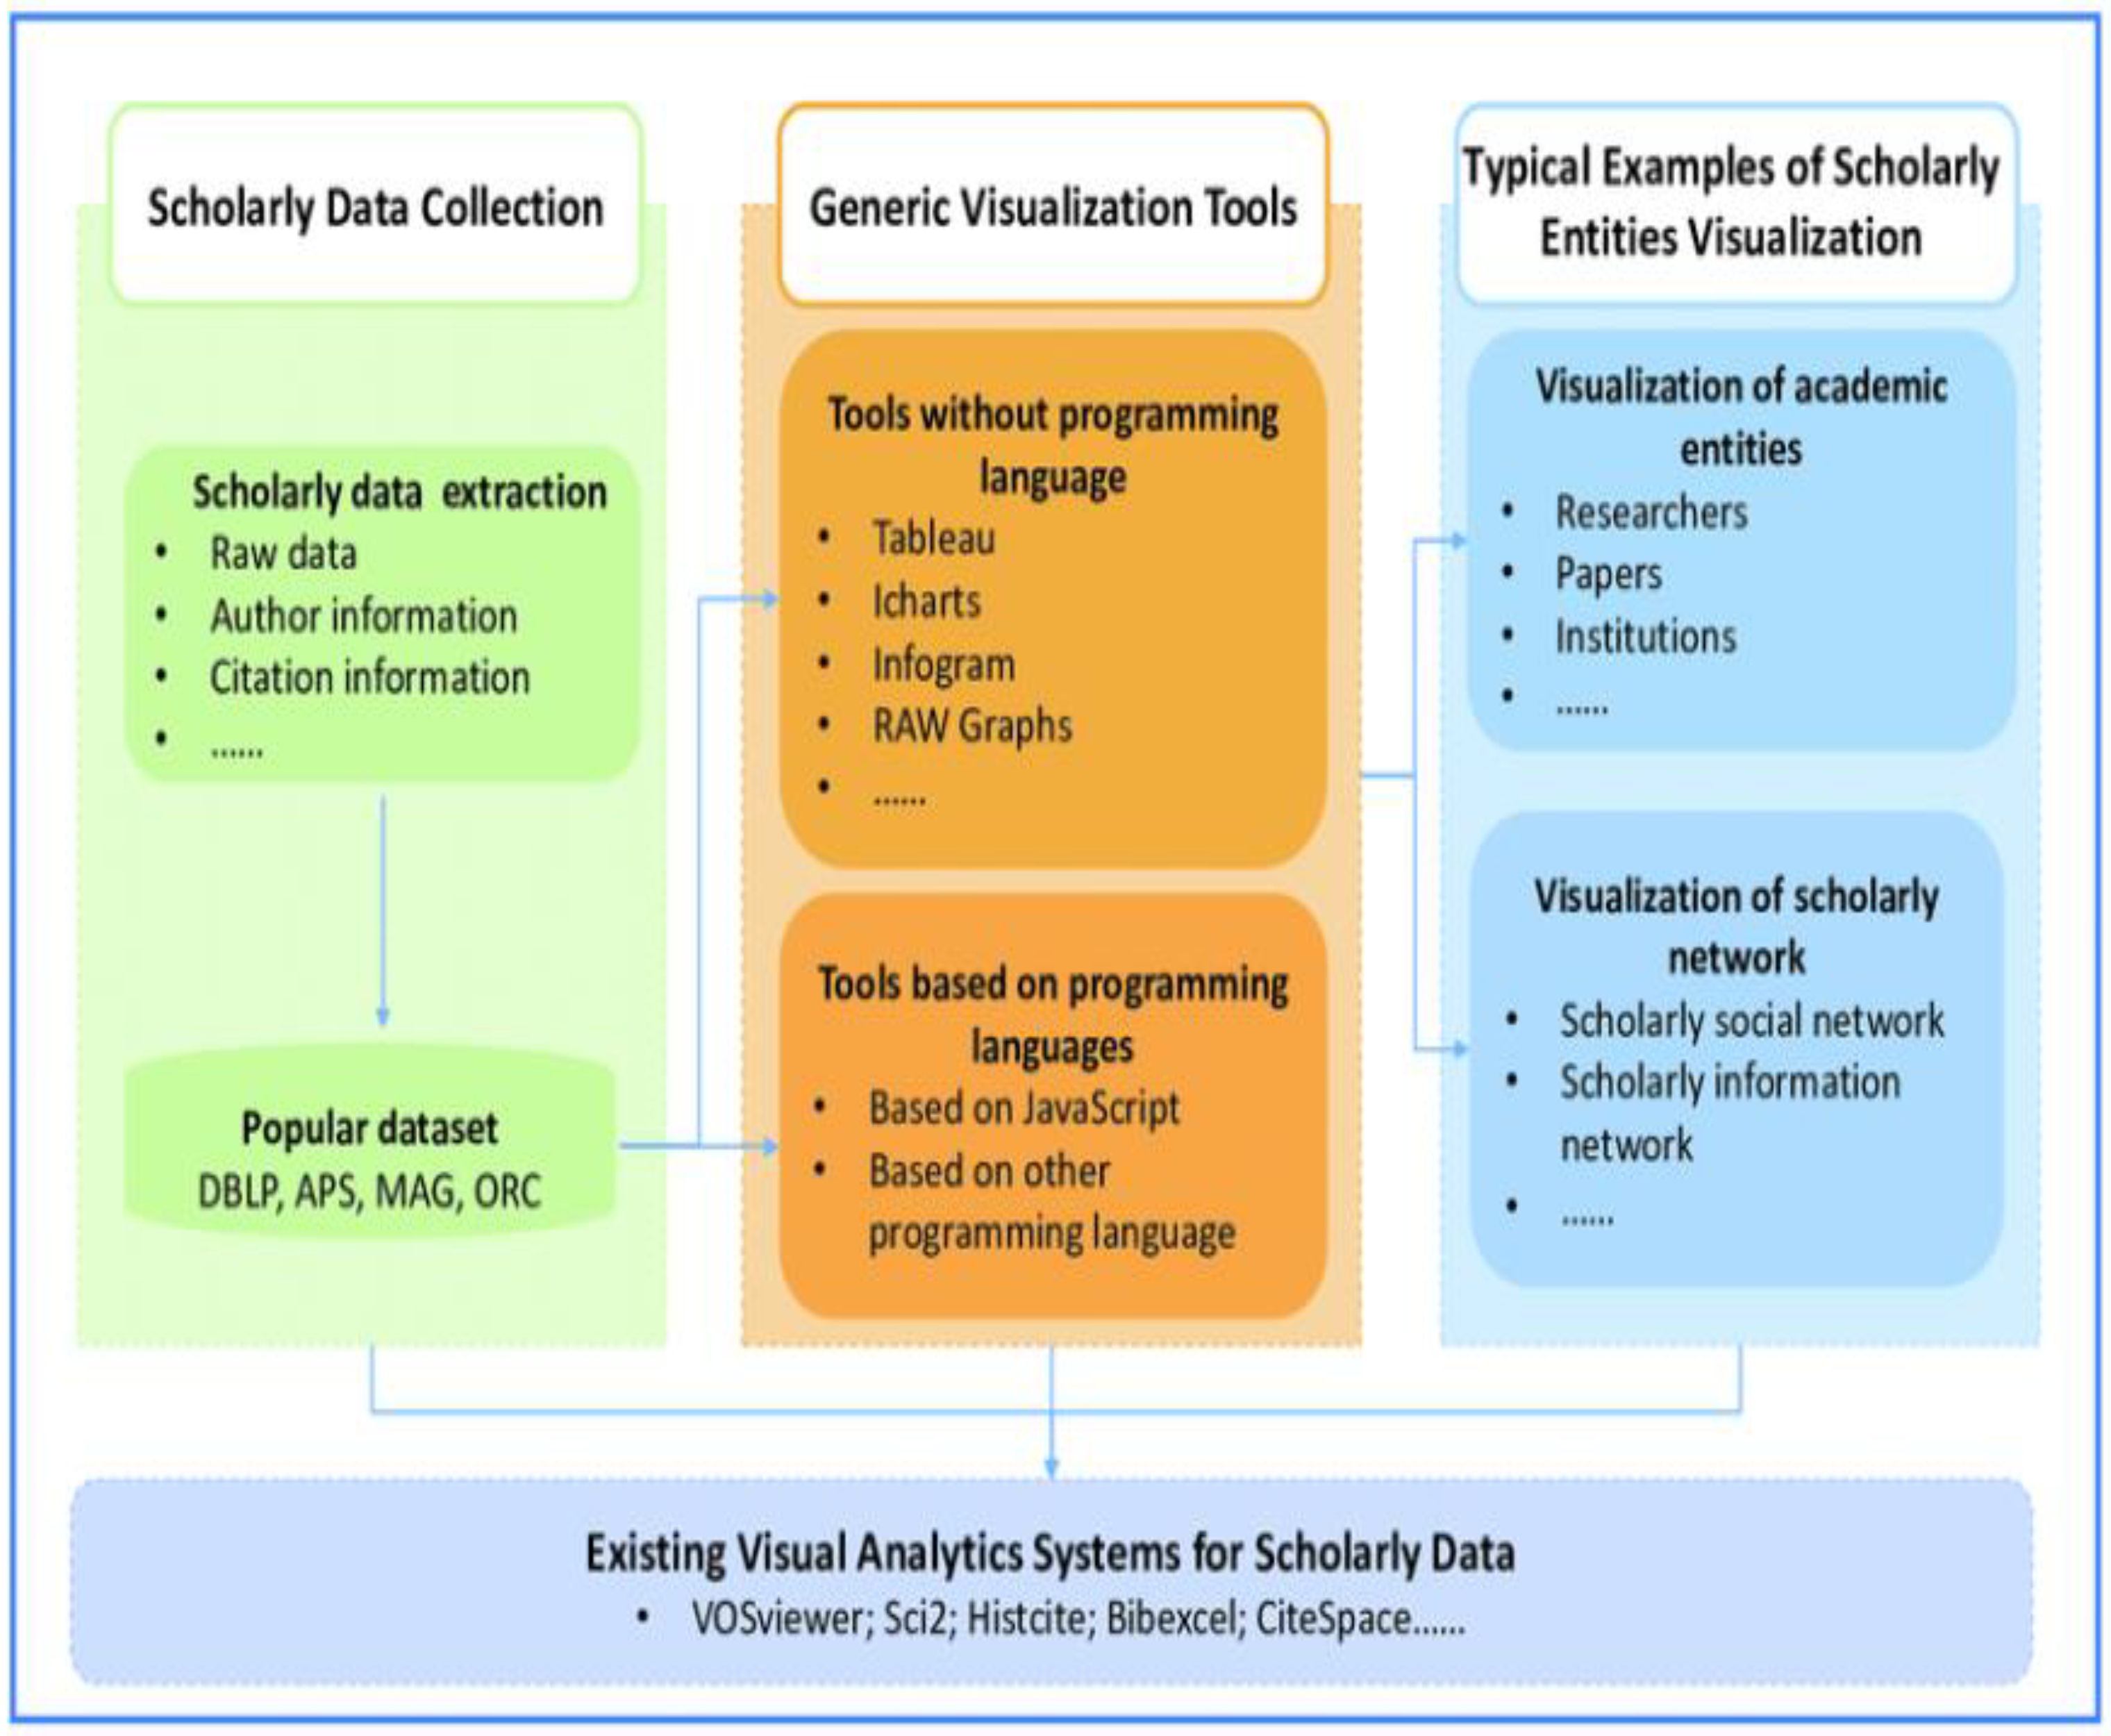
3.13. Data Visualization Conceptual Framework

A BI data visualization framework depicted in Figure 14 utilizes common graphics, such as charts, plots, infographics, and even animations. These visual displays of information communicate complex data relationships and data-driven insights in a way that is relatively easy to understand [37].
The Figure 14 framework comprises a data collection component that contains raw data, author information, citation information, and so forth for scholarly works. The generic visualization tools, devoid of technical programming languages (Tableau, icharts, infograms, and raw graphs), and tools based on programming languages make up the visualization aspect of the framework. Examples of academic entities (researchers, publications, institutions, etc.) and visualization of scholarly networks (social networks, information networks, and so forth) comprise the remainder of the framework [37,38].
Popular datasets, in the context of Figure 14, are DBLP, APS, MAG (Microsoft academic graph), and ORC. DBLP is a dataset consisting of bibliography data in computer science, and each record in DBLP is associated with several attributes such as abstract, authors, year, venue, title, and reference ID. APS is a dataset consisting of the basic metadata of all APS journals. MAG is a knowledge graph of scholarly publications structured around publication and author attributes. ORC (optimized row columnar) is a data storage file designed for Hadoop and other major data processing systems [37,38].
The Figure 14 framework, being a specialized framework for academia, offers several advantages [37,38]:
  • Data sets define attributes such as abstract, year, and authors.
  • Data sets are described by metadata.
  • Big data storage systems, for example, Hadoop.
The advantages of the Figure 14 framework lead to:
  • Proposition pC14: A BI framework ought to cater to file storage aspects, specifically for Hadoop-like big data aspects through visualization.
Table 2 summarizes our foregoing propositions.

4. Results

On the strength of the propositions formulated from the various BI frameworks in Section 3, we define a comprehensive framework that incorporates the lucrative aspects of the said frameworks. As indicated in the introduction to this article, the aim of developing a comprehensive framework built from various strict-subset frameworks is to have one BI framework that a company can use instead of having to search for a specific framework that may serve its purpose. Our framework brings together the advantages of the various frameworks in Section 3. As indicated, the said frameworks offer aspects mainly around managing data in a BI environment. Consequently, our framework follows suit, but in an integrated fashion.
A framework may take many forms, be it a table as indicated in [40], a list of instructions, or a diagram, in line with the format of the frameworks described in this article. We opted for a diagram, and our new framework is depicted in Figure 15 below.

5. Discussion

The Figure 15 framework is developed on the strength of the content propositions labeled pC1, pC2, …, pC14, as defined before.
From our analyses, a presentation layer depicts the top layer of the framework, in line with having a user interface as an upper layer of a computing system. Storage components in the form of a data warehouse, underwritten by file storage, viz., a database system and virtual technology, all interface with the presentation layer. Aspects of master data management, metadata management, and unified operations have been captured in the framework in line with the observations made before.
Real-time, batch, and stream processing interfacing with rationalized terms and definitions and important online analytical processing (OLAP) have been captured. An operational landing zone (ODLZ) embedding customer relationship management (CRM), e-procurement, supply chain management (SCM), an omnipresent enterprise resource planning system (ERP), and external sources have been included. Ontologies, taxonomies, and glossaries were likewise included as part of metadata management. As indicated, owing to the relative complexity of the Figure 4 framework, we encapsulate its detail in the metadata entity in our framework. The order in which the propositions were defined does not necessarily follow suit with the layout of the components in the framework; for example, components defined by pC1 are lower down in the framework, while the top-level presentation layer was defined by proposition pC12.
Through inspection of the framework, we were able to define various associations (lines) among the entities (shapes) in the framework. Future aspects mentioned below elaborate on this aspect in future work.

6. Conclusions

In this article, we presented and analyzed numerous modern business intelligence frameworks and identified important components and properties of each. On the strength of the advantages and properties of the said frameworks, we formulated a set of qualitative propositions that exhibit desirable components and properties of a comprehensive business intelligence framework. Our propositions were summarized in Table 2. We noted that many of the important components of the said BI frameworks overlap; for example, the components of the ODLZ are indicated by both propositions pC1 and pC3. Important concepts like metadata management, including ontologies and taxonomies, amongst others, and modern structures like data warehouses were identified and included in the framework.
We note that the Figure 15 framework is conceptual and has to be enhanced and validated from a practical point of view. Such enhancements are elaborated on in the following paragraph on future work. Consequently, the conceptual nature of the framework informs a limitation of the present work, namely, that it should be exercised in industry to determine its practicability.
Future work in this area may be pursued along a number of avenues. As observed before, associations among the entities in the framework have been identified through inspection. Yet, future work should investigate the presence of these associations through the processes described in [6]. The Figure 15 framework embodies a static structure, in line with the characteristics of the frameworks analyzed in this article. Consequently, a dynamic component should be added to the framework. Adding a dynamic layer to the framework links with the next phase of this research, namely validating and further enhancing the framework through formally specifying the framework structures, augmented by operations on these structures.
Having formally specified the framework, we anticipate a number of surveys to be conducted among stakeholders in the industry. Such surveys are anticipated to be in the form of sets of interviews to determine the strengths and weaknesses of the framework. Having enhanced the framework on the strength of the surveys, we should conduct one or more case studies in companies to determine the applicability of the framework given their specific BI settings.

Author Contributions

Conceptualization, R.J.M. and J.A.V.d.P.; methodology, R.J.M. and J.A.V.d.P.; software, R.J.M.; validation, R.J.M., J.A.V.d.P. and C.D.; formal analysis, R.J.M., J.A.V.d.P. and C.D.; investigation, R.J.M., J.A.V.d.P. and C.D.; data curation, R.J.M.; writing—R.J.M., J.A.V.d.P., and C.D.; original draft preparation, R.J.M., writing—review and editing, R.J.M., J.A.V.d.P. and C.D.; visualization, R.J.M., J.A.V.d.P. and C.D.; supervision, J.A.V.d.P. and C.D. All authors have read and agreed to the published version of the manuscript.

Funding

This research was funded by a University of South Africa (Unisa) bursary for the lead author. The APC was funded by Unisa and the Research Professor Fund of the second author.

Data Availability Statement

Not applicable.

Conflicts of Interest

The authors declare no conflict of interest. The funders had no role in the design of the study; in the collection, analyses, or interpretation of data; in the writing of the manuscript; or in the decision to publish the results.

References

  1. Kemper, H.G.; Baars, H. Management Support with Structured and Unstructured Data—An Integrated Business Intelligence Framework. Inf. Syst. Manag. 2008, 25, 132–148. [Google Scholar]
  2. Martins, A.; Martins, P.; Caldeira, F.; Sá, F. An evaluation of how big-data and data warehouses improve business intelligence decision making. Trends Innov. Inf. Syst. Technol. 2020, 1, 609–619. [Google Scholar]
  3. Alsmadi, I. Using Formal method for GUI model verification. In Design Solutions for User-Centric Information Systems; IGI Global: Hershey, PA, USA, 2017; pp. 175–183. [Google Scholar]
  4. Ackermann, J.G.; van der Poll, J.A. Reasoning Heuristics for the Theorem-Proving Platform Rodin/Event-B. In Proceedings of the 2020 International Conference on Computational Science and Computational Intelligence (CSCI’20), Las Vegas, NV, USA, 16–18 December 2020. [Google Scholar]
  5. Saunders, M.N.K.; Lewis, P.; Thornhill, A. Research Methods for Business Students, 8th ed.; Pearson: London, UK, 2022. [Google Scholar]
  6. van der Poll, J.A.; van der Poll, H.M. Assisting Postgraduate Students to Synthesis Qualitative Propositions to Develop a Conceptual Framework. J. New Gener. Sci. (JNGS) 2023, 21, 1061. [Google Scholar]
  7. Mbala, I.N.; van der Poll, J.A. Towards a Formal Modelling of Data Warehouse Systems Design. In Proceedings of the 18th JOHANNES-BURG Int’l Conference on Science, Engineering, Technology & Waste Management (SETWM-20), Johannesburg, South Africa, 16–17 November 2020. [Google Scholar]
  8. Shubham, J.; Sharma, S. Application of Data Warehouse in Decision Support and Business Intelligence System. In Proceedings of the 2018 Second International Conference on Green Computing and Internet of Things (ICGCIoT 2018), Bangalore, India, 19–18 August 2018. [Google Scholar]
  9. Inmon, W.H.; Nesavich, A. Tapping into Unstructured Data: Integrating Unstructured Data and Textual Analytics into Business Intelligence; Pearson Education: London, UK, 2007. [Google Scholar]
  10. Zafary, F. Implemetation of business intelligence considering the role of information systems integration and enterprise resource planning. J. Intell. Stud. Bus. 2020, 1, 59–74. [Google Scholar] [CrossRef]
  11. El Ghalbzouri, H.; El Bouhdidi, J. Integrating business intelligence with cloud computing: State of the art and fundamental concepts. Netw. Intell. Syst. Secur. Proc. NISS 2021 2022, 237, 197–213. [Google Scholar]
  12. Wang, H.; Ye, Z. An ETL Services Framework Based on Metadata. In Proceedings of the 2nd International Workshop on Intelligent Systems and Applications, Wuhan, China, 22–23 May 2010; IEEE: Piscataway, NJ, USA, 2010. [Google Scholar]
  13. Sachin, S.; Goyal, S.K.; Avinash, S.; Kamal, K. Nuts and Bolts of ETL in Data Warehouse. In Emerging Trends in Expert Applications and Security, Proceedings of ICETEAS; Springer: Singapore, 2018; pp. 1–9. [Google Scholar]
  14. Sreemathy, J.; Nisha, S.; Gokula Priya, R.M. Data Integration in ETL Using Talend. In Proceedings of the 6th International Conference on Advanced Computing and Communications Systems (ICACCS), Coimbatore, India, 6–7 March 2020; pp. 1444–1448. [Google Scholar]
  15. Ariyachandra, T.; Watson, H.J. Which Data Warehouse Architecture Is Most Successful? Bus. Intell. J. 2006, 11, 4–6. [Google Scholar]
  16. Cody, W.F.; Kreulen, J.T.; Krishna, V.; Spangler, W.S. The integration of business intelligence and knowledge management. IBM Syst. J. 2002, 41, 697–713. [Google Scholar] [CrossRef]
  17. Habermann, T. Metadata Life Cycles, Use Cases and Hierarchies. Geosciences 2018, 8, 179. [Google Scholar] [CrossRef]
  18. Ahmad, H.S.; Bazlamit, I.M.; Ayoush, M.D. Investigation of Document Management Systems in Small Size Construction Companies in Jordan. Procedia Eng. 2017, 182, 3–9. [Google Scholar] [CrossRef]
  19. Lemordant, P.; Bouzillé, G.; Mathieu, R.; Thenault, R.; Gibaud, B.; Garde, C.; Campillo-Gimenez, B.; Goudet, D.; Delarche, S.; Roland, Y.; et al. How to Optimize Connection Between PACS and Clinical Data Warehouse: A Web Service Approach Based on Full Metadata Integration. In MEDINFO 2021: One World, One Health–Global Partnership for Digital Innovation; IOS Press: Amsterdam, The Netherlands, 2022. [Google Scholar]
  20. Negash, S. Business Intelligence. Commun. Assoc. Inf. Syst. 2004, 13, 177–195. [Google Scholar] [CrossRef]
  21. Baker, O.; Thien, C.N. A new Approach to Use Big Data Tools to Substitute Unstructured Data Warehouse. In Proceedings of the 2020 IEEE Conference on Big Data and Analytics (ICBDA), Kota Kinabalu, Malaysia, 17–19 November 2020; pp. 26–31. [Google Scholar]
  22. TechVidvan. Available online: https://Techvidvan.com/tutorials/big-data-architecture/. (accessed on 23 September 2023).
  23. Alnoukari, M. From business intelligence to big data: The power of analytics. In Research Anthology on Big Data Analytics, Architecture, and Applications; IGI Global: Hershey, PA, USA, 2022; pp. 823–841. [Google Scholar]
  24. Corallo, A.; Crespino, A.M.; Lazoi, M.; Lezzi, M. Model-based Big Data Analytics-as-a-Service framework in smart manufacturing, A case study. Robot. Comput.-Integr. Manuf. 2022, 76, 102331. [Google Scholar] [CrossRef]
  25. Harjdarbegovic, M. Data Lake Architecture: A Comprehensive Guide. Available online: https://www.virtasant.com/blog/data-lake-architecture (accessed on 23 September 2022).
  26. Kuppusamy, P.; Suresh Joseph, K. Building an Enterprise Data Lake for Educational Organizations for Prediction Analytics Using Deep Learning. In Proceedings of the International Conference on Deep Learning, Computing and Intelligence: ICDCI 2021, Chennai, India, 7–8 January 2021; Springer: Singapore, 2022; Volume 1396, pp. 65–81. [Google Scholar]
  27. Alwashahi, M. Business Intelligence Framework in Higher Education Admission Center (HEAC). Int. J. Adv. Res. Comput. Sci. Softw. Eng. 2015, 5, 86–89. [Google Scholar]
  28. Dayal, U.; Castellanos, M.; Simitsis, A.; Wilkinson, K. Data Integration Flows for Business Intelligence. In Proceedings of the 12th International Conference on Extending Database Technology: Advances in Database Technology, Saint Petersburg, Russia, 24–26 March 2009. [Google Scholar]
  29. Zhao, J.; Feng, H.; Chen, Q.; de Soto, B.G. Developing a conceptual framework for the application of digital twin technologies to revamp building operation and maintenance processes. J. Build. Eng. 2022, 49, 104028. [Google Scholar] [CrossRef]
  30. Basile, L.J.; Carbonara, N.; Pellegrino, R.; Panniello, U. Business intelligence in the healthcare industry: The utilization of a data-driven approach to support clinical decision making. Technovation 2022, 120, 102482. [Google Scholar] [CrossRef]
  31. Sudarshan, T.S.; Jeandin, M.; Stiglich, J.J. Surface Modification Technologies XVIII: Proceedings of the Eighteenth International Conference on Surface Modification Technologies Held in Dijon, France, 15–17 November 2004; CRC Press: Boca Raton, FL, USA, 2023; Volume 18. [Google Scholar]
  32. Hussain, A.; Tahir, H.M.; Nuruzzaman, M. Industrial Web Application Customization Mechanism to Develop Quality Software and Improve Productivity through Object-oriented Application Toolkit Implementation. In Proceedings of the 14th International Conference on Software Engineering, Parallel and Distributed Systems, Dubai, United Arab Emirates, 22–24 February 2015. [Google Scholar]
  33. Mitchell, S. Microsoft. Available online: https://learn.microsoft.com/en-us/aspnet/web-forms/overview/data-access/introduction/creating-a-data-access-layer-vb (accessed on 23 September 2023).
  34. Eichler, C.M.; Bi, C.; Wang, C.; Little, J.C. A modular mechanistic framework for estimating exposure to SVOCs: Next Steps for modelling emission and partitioning of plasticizers and PFAS. J. Expo. Sci. Environ. Epidemiol. 2022, 32, 356–365. [Google Scholar] [CrossRef] [PubMed]
  35. TIBCO Data Federation. TIBCO. Available online: https://www.tibco.com/reference-center/what-is-a-data-federation (accessed on 23 September 2022).
  36. Choi, J.S.; Chun, S.J.; Lee, S. Hierarchical Distributed Overarching Architecture of Decoupled Federation and Orchestration Frameworks for Multidomain NFV MANOs. IEEE Commun. Mag. 2022, 60, 68–74. [Google Scholar] [CrossRef]
  37. Liu, T.; Tang, T.; Wang, W.; Xu, B.; Kong, X.; Xia, F. A Survey of Scholarly Data Visualization. IEEE Access 2016, 4, 2–15. [Google Scholar] [CrossRef]
  38. Börner, K.; Bueckle, A.; Ginda, M. Data visualization literacy: Definitions, conceptual frameworks, exercises, and assessments. Proc. Natl. Acad. Sci. USA 2019, 116, 1857–1864. [Google Scholar] [CrossRef] [PubMed]
  39. Ukhalkar, P.K.; Phursule, D.R.N.; Gadekar, D.D.P.; Sable, D.N.P. Business intelligence and Analytics: Challenges and Opportunities. Int. J. Adv. Sci. Technol. 2020, 29, 2669–2676. [Google Scholar]
  40. van der Poll, J.A. A Research Agenda for Embedding 4IR Technologies in the Leadership Management of Formal Methods. In Proceedings of the International Conference on Computational Science and Computational Intelligence (CSCI ’22), Las Vegas, NV, USA, 14–16 December 2022. [Google Scholar]
Figure 1. Research methods for Business Students (8th edition) Harlow: Pearson, p. 1301. The research onion diagram is ©2022 Mark Saunders et al. and is reproduced in this article with their written permission. Source: M.N.K. Saunders, P. Lewis, and A. Thornhill [5].
Information 14 00547 g001
Figure 2. Data Layer Framework of Business Intelligence [1].
Information 14 00547 g002
Figure 3. Conceptual Three-Layer Business Intelligence Architecture [1,9].
Information 14 00547 g003
Figure 4. ETL Service Framework based on metadata [12].
Information 14 00547 g004
Figure 5. Framework of Metadata extract from CDM [1].
Information 14 00547 g005
Figure 6. BI framework for structured data [20].
Information 14 00547 g006
Figure 7. Big Data Architecture and Patterns Framework [22].
Information 14 00547 g007
Figure 8. Data Lake Architecture Framework in BI Environment [25].
Information 14 00547 g008
Figure 9. Business Intelligence Framework using an Active Database Approach [27].
Information 14 00547 g009
Figure 10. Traditional Business Intelligence Architecture [28].
Information 14 00547 g010
Figure 11. Business Logic Layer Framework in a BI Environment [32].
Information 14 00547 g011
Figure 12. Access Layer Framework in BI Environment [33].
Information 14 00547 g012
Figure 13. Data federation framework [35].
Information 14 00547 g013
Figure 14. Data Visualization Framework [37].
Information 14 00547 g014
Figure 15. Comprehensive BI Framework (Synthesizer by researchers).
Information 14 00547 g015
Table 1. Attributes of the structured data [20].
TechnicalityFocus DerivationAdministrationFunctionality
Technical (Mostly structured)FormatFiltersCapacity planning
LengthAggregates
Calculations
Space allocation
Domain databaseExpressionsIndexing
Disk utilization
Table 2. Summary of propositions.
Proposition #Description
Proposition pC1A BI framework should include the following components, as these facilitate data management through the transforming and loading of data:
An operational sources system made up of CRM, SCM, ERP, subsystems for external sources, and e-procurement (E-Proc).
A data warehouse based on one or more data marts.
Proposition pC2Owing to the said advantages, a BI framework should include a content and document management (CDM) component to address the capture, tracking, and storage of electronic documents.
Proposition pC3A BI framework should include an operational data landing zone (ODLZ) where all combined data are stored after these have been combined from different sources.
Proposition pC4A BI framework should include a metadata management component to deal with metadata management as part of general data management to:
Allow for reference data management whereby the structure used in the organization (internal department codes, internal product codes, employee organization codes, internal location codes, and so forth) is described [6].
Summarize basic information about data, work with instances of data, and make findings.
Use ontologies, taxonomies, and glossaries to categorize and classify electronic information to be stored in more than one way [1,2,17,39].
Proposition pC5A BI framework should include an integrated data source (IDS) layer:
In the IDS, all source data, including metadata extracted from content and document management systems, are combined.
The underlying ETL pipelines should adhere to the said ETL quality metrics (QoX).
Proposition pC6A BI framework dealing with both structured and unstructured data ought to include:
A notification agent, a distribution agent, and an OLAP component to assist the finance and operations sections that may be running legacy systems.
Rationalized terms and definitions components, as well as an information development management component [20,21] as follows:
Rationalized terms and definitions aim to reduce overlapping tools and data duplication and also promote BI standards.
With respect to information development management, structured and unstructured data should be transformed into useful information, which in turn may be transformed into knowledge.
Proposition pC7A BI framework dealing with data processing ought to include real-time, batch, and stream processing, to assist with the processing of data either in batches or continuously as transactions happen on the operational side of the business.
Proposition pC8A BI framework dealing with processing operational data ought to embed a unified operation layer that includes steps of ingestion, distillation, processing, which in turn utilizes various tools and business logic, and insights, all aimed at moving from raw data to business systems for reporting.
Proposition pC9A BI framework dealing with raw data should include:
Data definition management, embedding all the formal processes for defining data.
Data development management to:
Develop, collect, process, and interpret data.
Perform backup, restore, archive, and recall functions.
Cater for business restrictions and rules catered for by business logic (cf. proposition pC8).
Data operations management to integrate people, processes, and products to enable consistent, automated, and secured data in large databases (or a warehouse—refer to proposition pC1).
Proposition pC10A BI framework dealing with processing in the context of an active database ought to:
Include a master data management (MDM) component that facilitates data reconciliation, offering the benefit of maintaining data external to the organization as well as other data sources, for example, historical data (cf. Schema 2006, Schema 2007 in Figure 9).
Embed data aggregation, whereby data are gathered from multiple sources and expressed in a summary form, i.e., reporting.
Proposition pC11If not part of the standard ICT infrastructure, a BI framework ought to embed a DB controller to determine the purpose for which and how such data are processed.
Proposition pC12A BI framework ought to embed a presentation layer that is used to surface data cleanly from a data warehouse or data mart to the user.
Proposition pC13A BI framework should embed virtual database technology to act as a container, allowing the view and query of multiple databases through a single API drawing from numerous sources.
Proposition pC14A BI framework ought to cater to file storage aspects, specifically Hadoop-like big data aspects, through visualization.
Disclaimer/Publisher’s Note: The statements, opinions and data contained in all publications are solely those of the individual author(s) and contributor(s) and not of MDPI and/or the editor(s). MDPI and/or the editor(s) disclaim responsibility for any injury to people or property resulting from any ideas, methods, instructions or products referred to in the content.

