Article

About Challenges in Data Analytics and Machine Learning for Social Good

by
Riccardo Martoglia
1,2,* and
Manuela Montangero
1
1
FIM Department, University of Modena and Reggio Emilia, 41125 Modena, Italy
2
GAME Science Research Center, 55100 Lucca, Italy
*
Author to whom correspondence should be addressed.
Information 2022, 13(8), 359; https://doi.org/10.3390/info13080359
Submission received: 13 June 2022 / Revised: 15 July 2022 / Accepted: 25 July 2022 / Published: 27 July 2022

Abstract

:
The large number of new services and applications and, in general, all our everyday activities resolve in data mass production: all these data can become a golden source of information that might be used to improve our lives, wellness and working days. (Interpretable) Machine Learning approaches, the use of which is increasingly ubiquitous in various settings, are definitely one of the most effective tools for retrieving and obtaining essential information from data. However, many challenges arise in order to effectively exploit them. In this paper, we analyze key scenarios in which large amounts of data and machine learning techniques can be used for social good: social network analytics for enhancing cultural heritage dissemination; game analytics to foster Computational Thinking in education; medical analytics to improve the quality of life of the elderly and reduce health care expenses; exploration of work datafication potential in improving the management of human resources (HRM). For the first two of the previously mentioned scenarios, we present new results related to previously published research, framing these results in a more general discussion over challenges arising when adopting machine learning techniques for social good.

1. Introduction

The new millennium has seen a rapid acceleration of technological innovation and the rise of a large number of new services and applications, such as cloud storage services, the IoT and social networks, just to name a few, and these quickly catapulted us into what has been called the big data era. Everyday activities resolve in data mass production: all sorts of data is collected by sensors in all sorts of contexts (e.g., medical, cities, buildings), different types of contents (text, images, video) are shared in social media networks, records related to purchases on e-commerce sites are created, GPS signals are exchanged, activity logs record our activities in enterprise collaboration software at work, and so on.
The amount of produced/stored data was estimated at 64.2 zettabytes in 2020 (with previsions over the next few years, up to 2025, that they will grow to more than 180 zettabytes [1]). All these data have quickly become a golden source of information that might be used to improve our lives, wellness and work. Researchers have new challenges to face: there is a need for methods to properly collect and prepare data, to adequately analyze data and properly interpret analysis results.
Machine Learning (ML) approaches, the use of which is increasingly ubiquitous in various settings, are definitely one of the most effective tools for retrieving and obtaining essential information from data. More specifically, the current focus on the need for clarifications on ML systems has also resulted in an even more specialized trend in research, i.e., interpretable machine learning [2], for example in a clinical environment where clinicians wish to know what is behind ML-based predictions. Recent research has suggested and implemented new interpretable models and frameworks, which go beyond the blackbox nature or opacity of many ML techniques.
A social good is generally defined as something that benefits a large number of people in the largest possible way: clean air, clean water, Internet connection, education, and healthcare are just a few good examples of social goods. However, information technology (IT) and computer science innovations widened the meaning of the concept. Social good is now also about exploiting the potential of individuals, technology, and collaboration to create a positive societal impact. For example, social media platforms are important in the context of social good as they can be used to educate people, understand their feelings regarding public institutions or initiatives, or start fundraising for social activities.
In the new acceptation of social good, machine learning techniques and data analytics are powerful tools that can be successfully used in many different contexts. In this paper we will present some scenarios and discuss how to use such techniques for social good, highlighting the technical challenges that arise and that have to be dealt with.
It is, however, important to recall and remember that machine learning comes with some (ethical) issues [3,4,5]: even if not at the focus of this paper, these might be particularly critical when dealing with social good. Machine learning techniques are not exact algorithms but the outcome is “just” a prediction given with a certain degree of confidentiality, based on the tests performed by the designers over a data set built at this purpose. It is important to recall that not all predictions are correct and be aware of the technical challenges arising when using machine learning with the aim to make such predictions as much reliable as possible.
In this paper we present an overview and analysis of four key scenarios in which large amounts of data and machine learning techniques have been (and might further be) used for social good. The paper extends our previous conference work [6] in several aspects, expanding the analysis of all the introduced scenarios, discussing novel and unpublished results for two of the aforementioned scenarios and framing these results in a more general discussion over challenges arising when adopting machine learning techniques for social good.
In particular, we will consider the social network analytics, game analytics, medical analytics and human resource management analytics scenarios (see also Figure 1 for an overview). These correspond to some of the trendiest and most difficult use cases connected to our everyday life where data analytics and (interpretable) ML-based techniques can actually provide a large number of benefits. For each, we explain the latest findings and explore the consequences and future prospects in these contexts. The discussion is further expanded for the social network and game analytics scenarios by means of a discussion on recent unpublished results.
Moreover, we bring a specific focus to the actual challenges that are involved, discussing both the general and the specificities of each setting:
  • Challenge 1 (C1)—Dataset acquisition and preparation:
    The acquisition of datasets is always a complex matter, for instance in scenarios such as the medical one due to ethical issues, but also in others due to data confidentiality. Moreover, from a technical point of view, extracting the required data in large quantities and from multiple sources, while also preparing it (e.g., feature extraction, dataset balancing, etc.) in such a way to properly support the specific machine learning tasks, is often a challenge in itself.
  • Challenge 2 (C2)—Output interpretation:
    Designing and building the model(s), choosing the most suitable and effective ML algorithm(s), performing the tests and evaluating effectiveness results are only the first steps in these contexts. Interpretation of the results in terms of the reasons why ML models produced specific results are key to advancing knowledge and obtaining the complex goals envisioned in each scenario.
The reminder of the paper is organized as follows: in Section 2 we present the four scenarios, including a description of their scope, issues, open directions, and relevant research; Section 3 and Section 4 focus on the Social Network Analytics and the Game Analytics scenarios, deepening their specific challenges by means of a discussion on novel results, while Section 5 summarizes the challenges in the Medical and HRM fields; Section 6 complements the paper with additional related works on the four scenarios, finally conclusions are drawn in Section 7.

2. Machine Learning for Social Good

In this section we present some interesting scenarios in which machine learning and data analytics are used for social good, highlighting some limitations in the current state of the arts and some open research directions.

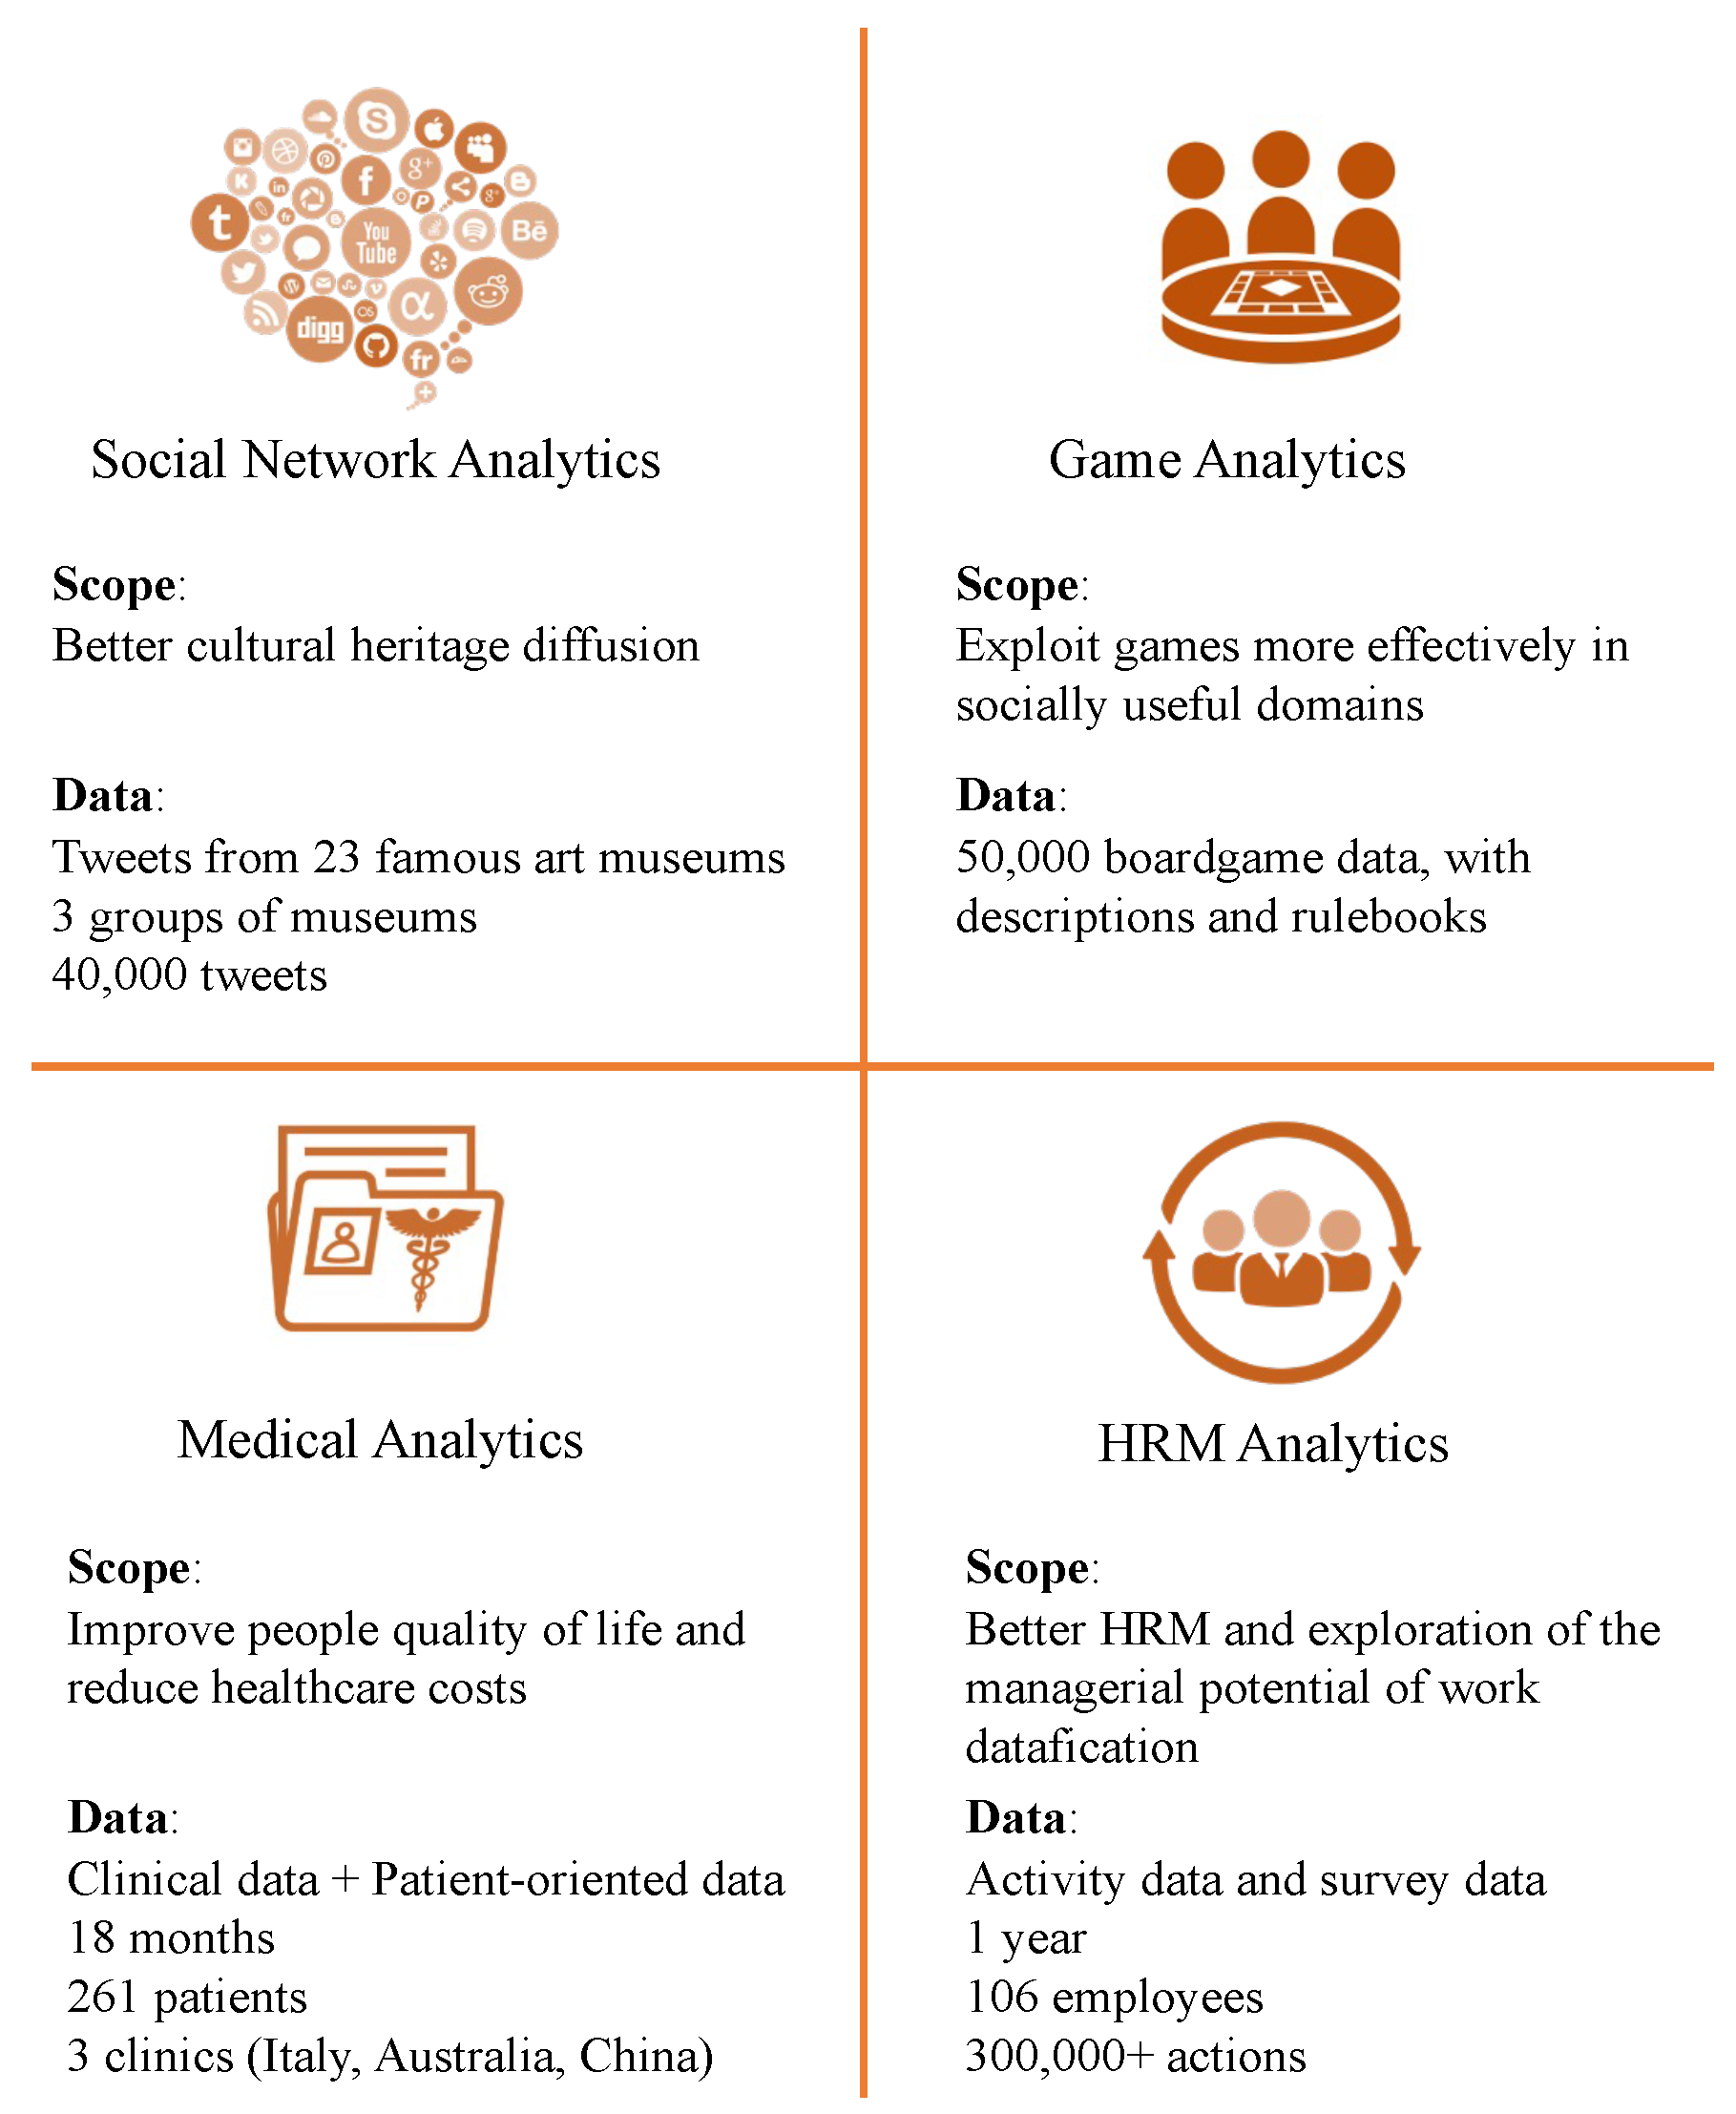
2.1. Scenario 1: Social Network Analytics

Scope: Social network analysis for better cultural heritage diffusion.
Short description. Cultural heritage institutions are increasingly adopting social media to engage and interact with citizens and visitors. It is not, however, simple to convey the cultural message and communicate effectively, since millions of messages are uploaded every day via social media and cultural posts might not be as sensational as others on different topics. For this reason, for example, ref. [7] describes how cultural organizations could exploit Twitter to reach potential visitors of exhibitions, ref. [8] aims to understand more about how museums exploit social networks by studying the types of tweets and the kinds of activities museums perform to engage their visitors, and [9] proposes a five-step strategy to make art museums influential over Twitter. The interested reader can refer to [10,11,12,13] for further relevant research.
Issues and open directions: There are some issues relative to social network analytics in general: (1) one of the challenges in retrieving a social network dataset is the fact that only Twitter allows access to data through public available APIs, and this is one of the main reasons why the majority of research on social network data concentrates on Twitter; and (2) social network posts in datasets are composed by Internet users and there is no indication or guarantee of how authoritative such users are, as well as if the content of the posts is truthful or not. As for the cultural heritage scenario in particular, whereas social media data are being used to understand user sentiments and behaviour [14,15,16,17], there appears to be a lack of techniques that exploit social media data to help proactively produce more successful posts in a cultural heritage scenario. To the best of our knowledge, a first attempt has been proposed in [10] and will be further discussed in Section 3 together with some new results.

2.2. Scenario 2: Game Analytics

Scope: Discover unknown aspects of games that might be exploited for social good.
Short description. Games are being used in an ever-increasing variety of disciplines in our daily lives, ranging from entertainment to education, creativity to technology, and game-related research has become a hot topic in computer science. For example, gamification is a technique that is often used to engage Internet users in very different activities [18], and data analytics and artificial intelligence have been used for computer-assisted game design [19] or to teach computers to play games [20]. In [21], the authors showed how to automatically determine board game categories and mechanics by means of a short textual description of the game only, and argue that this kind of analysis might be used to discover new games features and make games effective tools in a variety of socially useful domains, e.g., the promotion of Computational Thinking in schooling, or the identification of those games that are the most suited in social distancing situations.
Issues and open directions: The vast potential of games is mostly untapped, and it appears that there is much more to learn about the benefits of game-related applications, particularly in non-entertainment situations [22]. Machine learning could certainly help in this, however datasets specifically devoted to gaming information and descriptions of games are still very hard to find, and almost none of the available ones present a sufficiently large size and the rich textual features needed for the scope. Moreover, interpretable machine learning techniques have very rarely been applied in this context.

2.3. Scenario 3: Medical Analytics

Scope: Medical and biological analytics to improve people’s quality of life and reduce healthcare costs.
Short description. The use of data analytics and machine learning to monitor and achieve general “healthy“ conditions is becoming more and more popular. Indeed, these might help reduce health care expenses and improve people’s well being by introducing personalized medicine and moving from a detect-and-cure strategy to a predict-and-prevent one. For example, wearable gadgets can be used at small costs to evaluate people’s and patients’ well-being constantly, inside and outside medical facilities. Passive sensing methods have been adopted to measure mental and physical health [23] and to keep track and to forecast [24] weight loss or gain objectives. In [25], a data-driven method is exploited to forecast long-term patient wellness conditions, taking into consideration clinical, self-monitoring, and self-reporting longitudinal observations. The proposal has been applied to the My Smart Age with HIV (MySAwH) dataset, which was acquired through a novel approach from older HIV patients. The aim of this approach is, on the one hand, to eliminate the need of clinical experts in defining wellness metrics and, on the other hand, to provide these experts with machine learning predictions that are easy to understand. The interested reader can refer to [25,26,27,28] for further relevant research.
Issues and open directions: It has been recently highlighted [2,29,30] that the success of applying machine learning techniques in health care depends on a deeper understanding of machine system outputs. Indeed, output misinterpretations might lead to wrong diagnoses, treatments and therapies, that might cause serious damage to patients. Moreover, inputs to machine learning techniques are critical. Needless to say, health-related data make very sensible datasets that have to be handled not only respecting data protection regulations but also moral laws.

2.4. Scenario 4: Human Resource Management (Hrm) Analytics

Scope: Exploration of the managerial potential of work datafication for improving HRM.
Short description. Digital transformation in organizations has affected at least two aspects of organization management [31]: workplace collaboration is more powerful [32], and digital traces left by workers allow work to be “observed” [33]. For example, it is possible to search for correlations between digital working behaviours and employees’ attitudes [34], and then use these findings to define good practices to improve workplace well being. This will possibly open up further possibilities, such as the prediction of employee attitude constructs (such as organizational embeddedness [35]) from behavioural and relational patterns of digital data extracted from Enterprise Collaboration Softwares (ECSs). The interested reader can refer to [34,36,37] for further relevant research.
Issues and open directions: data are still mostly unused and there is a lack of useful tools to collect and analyze such data [38]; thus, the potential societal benefit of work datafication still remains largely unexplored [39]. Moreover, data themselves might not be easy to retrieve for academic purposes: data usually came from within private companies that might be reticent to share them with researcher outside the company, either because they do not have consensus from their employees or they do not wish the outcome to be known outside of the company.

3. Challenges in the Social Network Analytics/Cultural Heritage Scenario

In the cultural heritage scenario, we concentrate on museums communication over Twitter. Our final goal is to help museums to improve their communication and better spread their cultural messages. To this aim, we provide museum social media managers with a tool that helps them in composing successful tweets, where success is measured with the numbers of likes and retweets a tweet receives (the higher the numbers, the higher the success). We propose to exploit interpretable machine learning techniques to: (a) predict whether or not Twitter users will appreciate a tweet posted by the museum; (b) design a simple system that is able to automatically produce recommendations on how to enhance a message and increase the likelihood of its success. The general proposal has been presented in [10], and here we extend it significantly by introducing a new phase in the dataset preparation that takes into consideration the topic of tweets and by presenting new preliminary results. Task (a) is accomplished by classifying tweets as GOOD or BAD: the former will probably have a significant impact, while the latter will not generate much interest. To achieve task (b) we propose to classify tweets written by museum social media managers before publishing and to exploit the classification interpretation to understand if and how the tweet might be enhanced, so that it has better chances to be appreciated. Figure 2 shows the complete dataset acquisition, preparation, and analysis pipeline which will be described in the following.

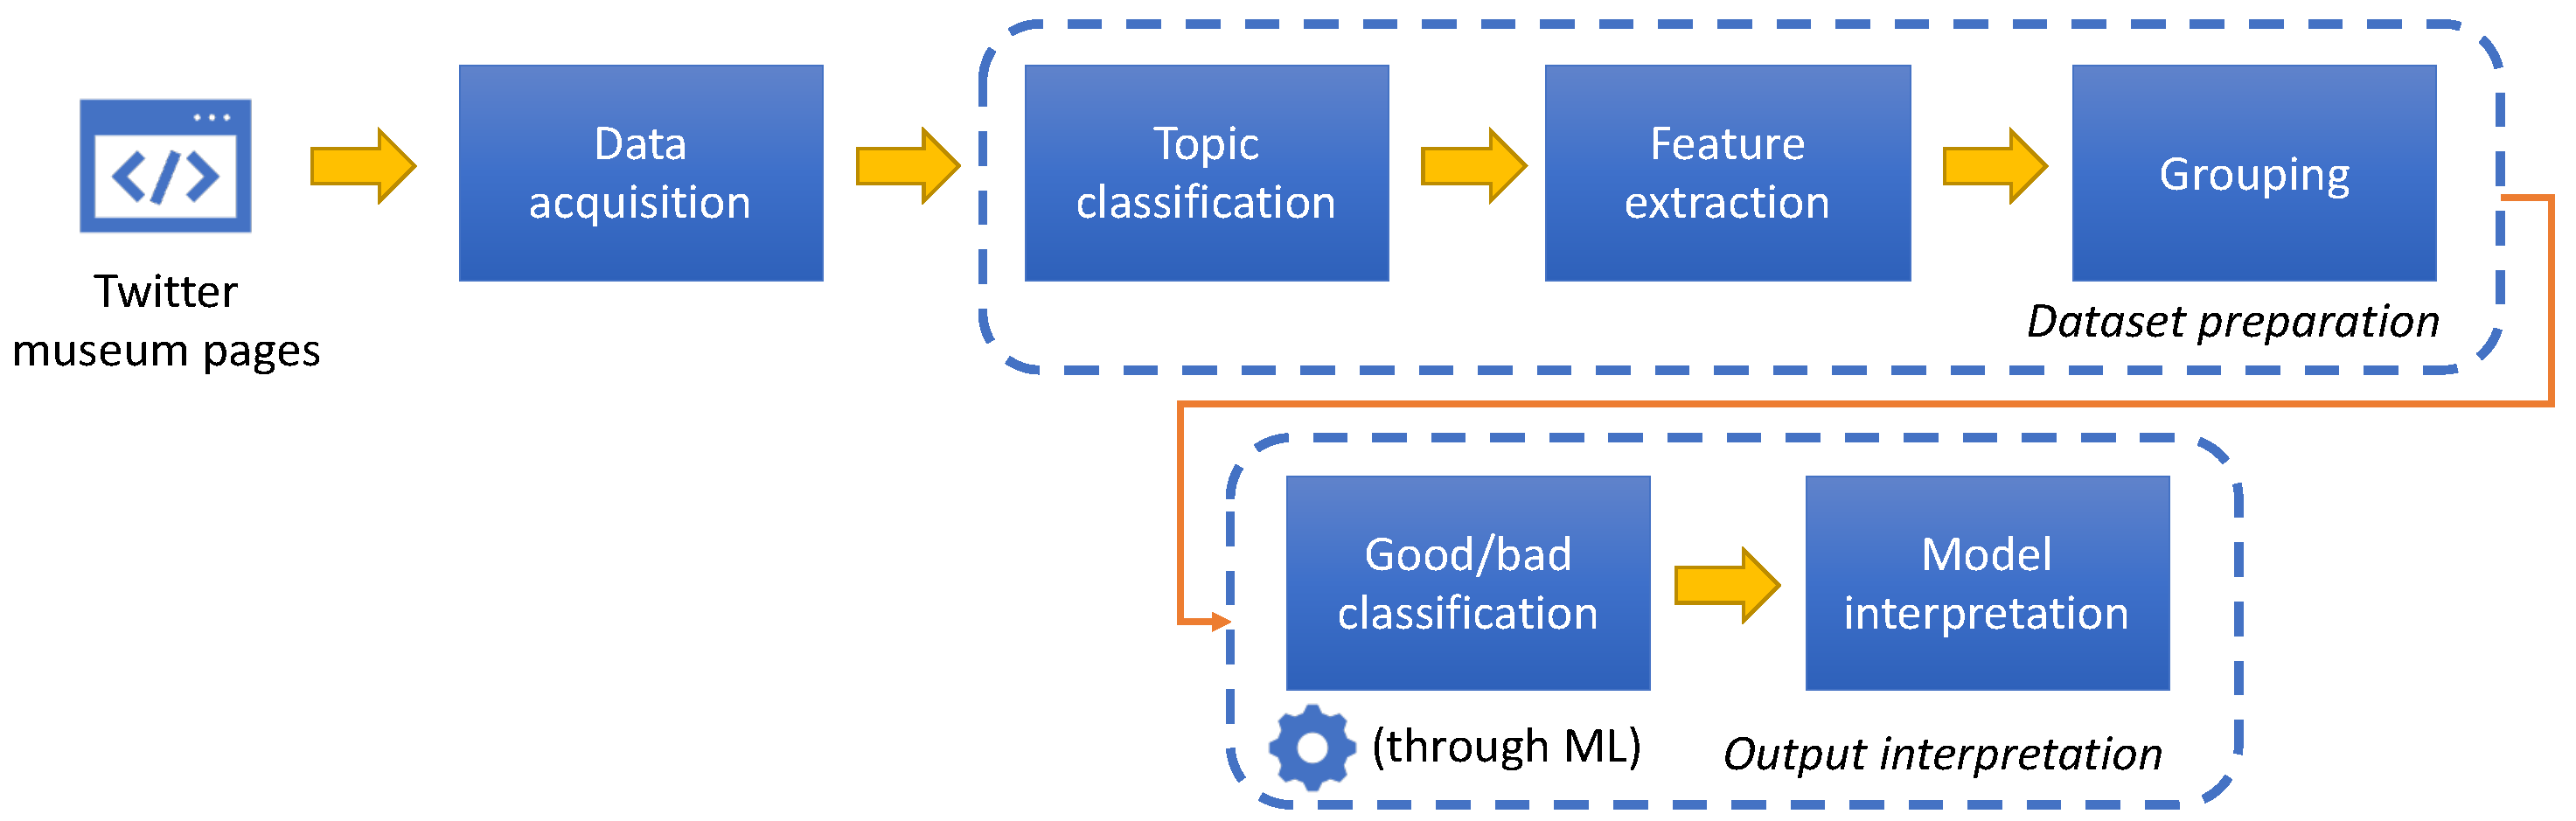
3.1. Challenge 1—Dataset Acquisition and Preparation

As we said, social network datasets might be difficult to deal with, but here we concentrate on museum tweets and therefore we confine ourselves in a situation in which the authors of posts are authoritative and we do not need to be concerned by the possibility that posts might contain false or misleading information, might be offensive or incite to violence, and so on.
Data acquisition: We concentrated on Twitter and we prepared a dataset composed of about 40 K tweets in English posted by 23 well-known art museums around the world retrieved using the Twitter APIs. We balanced the number of tweets per museum by considering approximately 1700 tweets from each museum.
Dataset Preparation:
  • Tweet topic feature: Reading some of the tweets in the dataset, we observed that museums have a limited number of different tweet topics. Therefore, we decided to take advantage of this particular situation for the GOOD/BAD classification by adding the relevance of a tweet to topic classes. This step in the dataset preparation is new with respect to the proposal presented in [10].
With the collaboration of 10 students, we manually inspected and classified 6K tweets of the dataset equally distributed among museums. This activity was double fold: (a) determine the set of topics and then define one feature for each topic; (c) for each topic make a list of the most significant. These lists will then be used to define the actual values of the topic features for the tweets. The resulting topics are the following:
-
Artwork: description/presentation of some piece of art;
-
Festivities greetings;
-
Historical celebrations or facts related to artworks;
-
Happened #OnThisDay;
-
Museum promotions;
-
Important historical people or their citations;
-
Miscellany: tweets not falling into other classes.
As for the list of words, for example, the one for Festivities contains the words “celebrate, anniversary, fun, wish, birthday”, and the one for #OnThisDay contains for example “onthisday, today, born, die, happen(s)”. These lists were completed by computing the most frequent words appearing in the tweets and adding the most significant ones.
We then associated a list of entities to each list of words. Entities are used to generalize the meaning of single words. To this aim we used the spaCy library and, for example, we found the entity “event” for Festivities as an hyperonym of “anniversary” and “birthday”, and the entity “time” for #OnThisDay as an hyperonym of “today”.
Finally, we used the two lists to associate a value to each topic feature for each tweet in the following way:
-
we counted how many words of the corresponding word list are contained in the tweet;
-
we counted how many entities of the corresponding entity list are contained in the tweet;
-
we then normalized the counts with respect to the lists lengths, and summed the resulting numbers.
  • Features extraction: We identified a set of features to be used for GOOD/BAD classification. Some of these features are content-dependent (e.g., number of mentions and URLs in the message, the length of the message, if the post contains an image or not, and so on), others are context dependent (e.g., the time of the day in which the post was published or if it is a retweet or not). The complete list of content and context features might be found in [10]. Moreover, we added one feature per topic and the feature value as explained before.
  • Grouping: As we said, we measure the success of a tweet by the numbers of likes and retweets it received. However, it is not possible to define the same thresholds to these numbers for all museums. Indeed, the best tweet posted by a small museum might have the same number of likes (or even less) of the worst post of a very large museums. Therefore, we divided the museums into three groups according to the number of followers of their Twitter accounts, grouping together museums with similar numbers. Tweets in the dataset were divided accordingly into three groups.

3.2. Challenge 2—Output Interpretation

  • Tweet Classification: We classify tweets into GOOD and BAD by considering the content and context features, and the topic class features. We evaluated different classifiers to identify the best performing one (XGboost) and obtained the promising accuracy results shown in Table 1.
Future works will be devoted to a deeper study on prediction results.
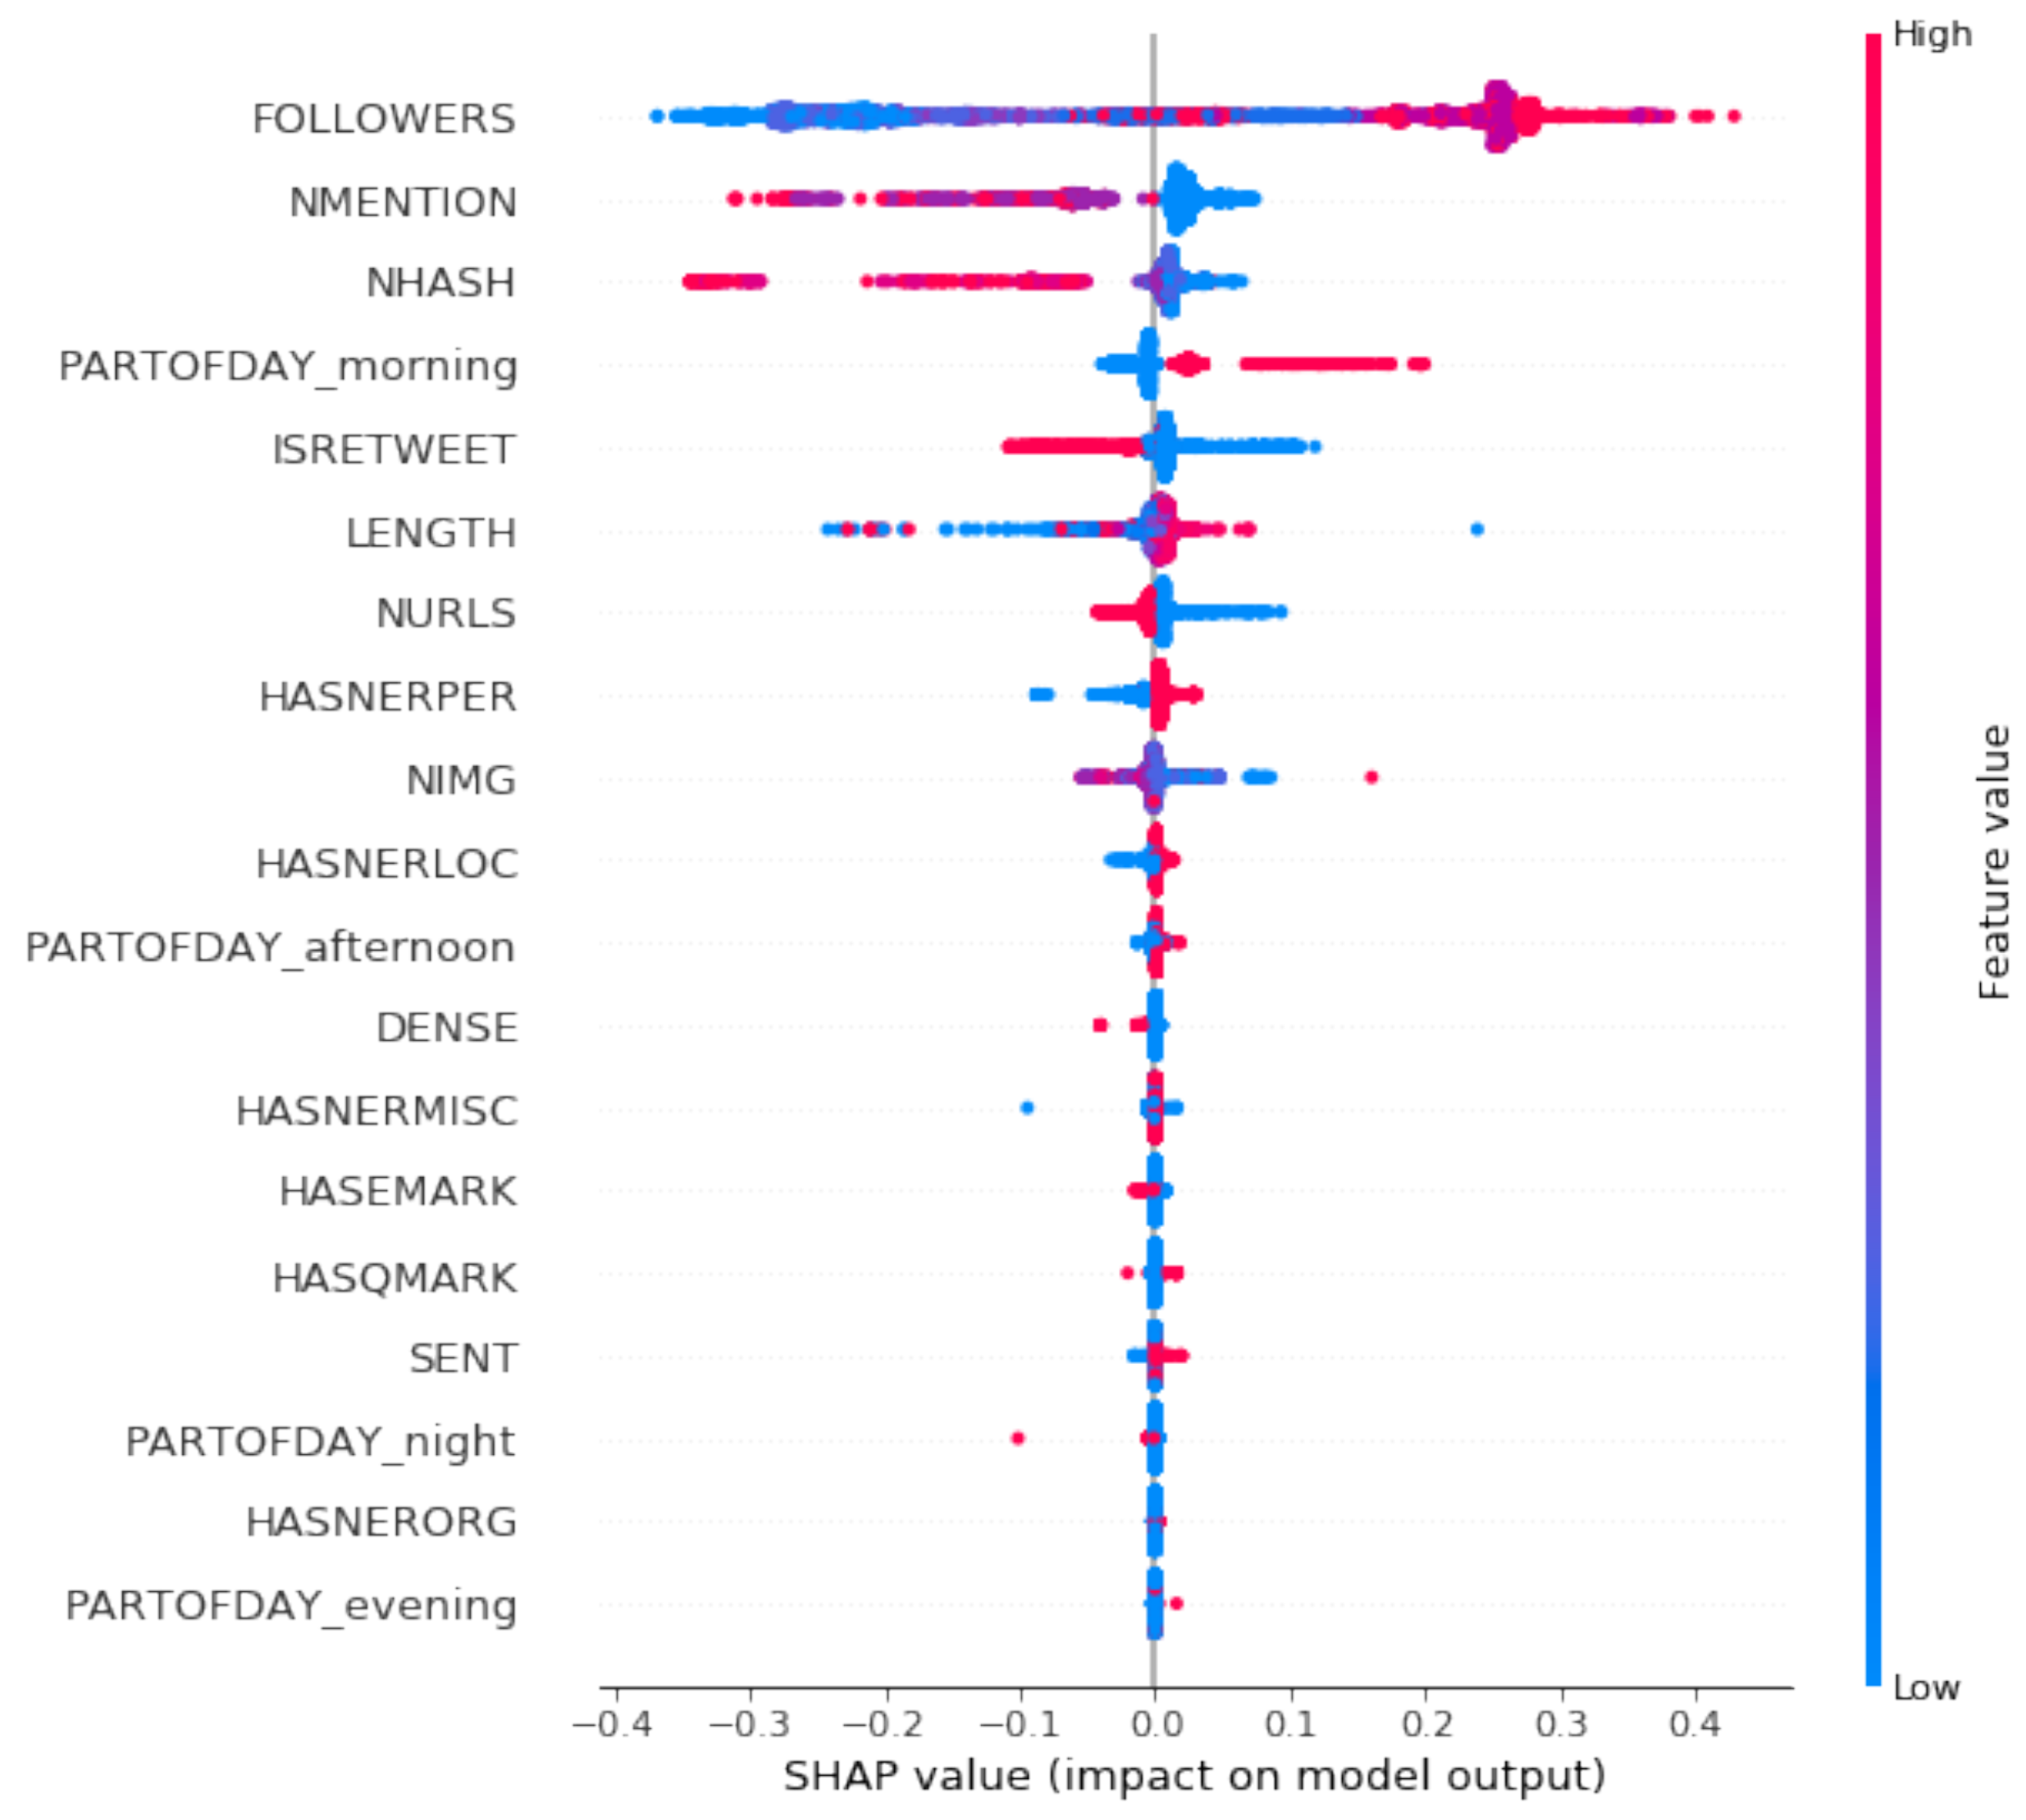
  • Model interpretation: Besides tweets classification, other information can be gathered by interpreting the machine learning algorithm output. We want to understand which feature values contributed the most to tweets being classified into BAD. Such insights are then used to suggest to the museum social media manager how the tweet can be enhanced to make communications (and cultural heritage diffusion) more effective. Suggestions are indications on how to modify features values (e.g., add a mention or remove a URL) are thus easy to give, to understand, and to implement.
For example, Figure 3 shows a graphical interpretation of the impact of the values of the features (whose name is shown on the left) on the GOOD/BAD classification one tweet posted by one museum. At the top we have the feature that most contributed to the classification, and moving down toward the bottom we have less and less determinant ones. Here, we concentrate on content and context features because these are those that can be exploited to enhance the message by giving proper suggestions to the author of the post. We can see, for example, that the four most determinant features for the classification are the number of followers of the author, the number of mentions in the tweet, the number of hashtags and the time in the day (morning) when the tweet has been posted. On the other side, less determinant are the fact that the tweet has been sent in the evening or in the night, and that it contains names of organizations.
Moreover, colors and dots distribution allow us to better understand the impact of the features in the output classification. Horizontal lines are composed of dots, each one representing a tweet (a sample of the training set). The further a dot is to the left (resp. on the right) the more negative (resp. positive) its impact on the classification is. The color of the dot is blue (resp. red) if the value of the corresponding tweet feature is small (resp. large). Therefore, we can see that a small number of mentions and hashtags are to be preferred to a larger one, as it is preferable to post in the morning. Such insights are easily transformed into suggestions for social media managers and can be used to improve the impact of their tweets.

4. Challenges in the Game Analytics Scenario

As to the considered Game Analytics scenario, we will now shortly describe some of the challenges involved in the Data Analytics/Machine Learning process for automatically identifying game category information, leveraging on some recent and still-unpublished methodologies and results going beyond the previously cited preliminary work [21]. The final aim of the scenario is to employ data analytics and machine learning techniques to better understand games and, ultimately, discover new features that can help in exploiting them more effectively in a variety of socially useful domains. In particular, in the current phase of this research, we focus on board games and on how effectively different machine learning techniques can help in automatically discovering game categories and game mechanics. The dataset is constructed by considering information taken from reference websites in this field and includes, among other data, textual descriptions of the game and additional information coming from external resources (e.g., official game rulebooks) that have not been considered in previous works. Figure 4 shows the complete dataset acquisition, preparation and analysis pipeline which will be described in the following.

4.1. Challenge 1—Dataset Acquisition and Preparation

Data acquisition and enrichment: As previously discussed, the lack of sufficiently large and detailed datasets on gaming information (in this specific case, board games) required the acquisition of a dataset that could support the objective and enable interpretable machine learning techniques. Creating the dataset of 50,000 board games posed a number of challenges:
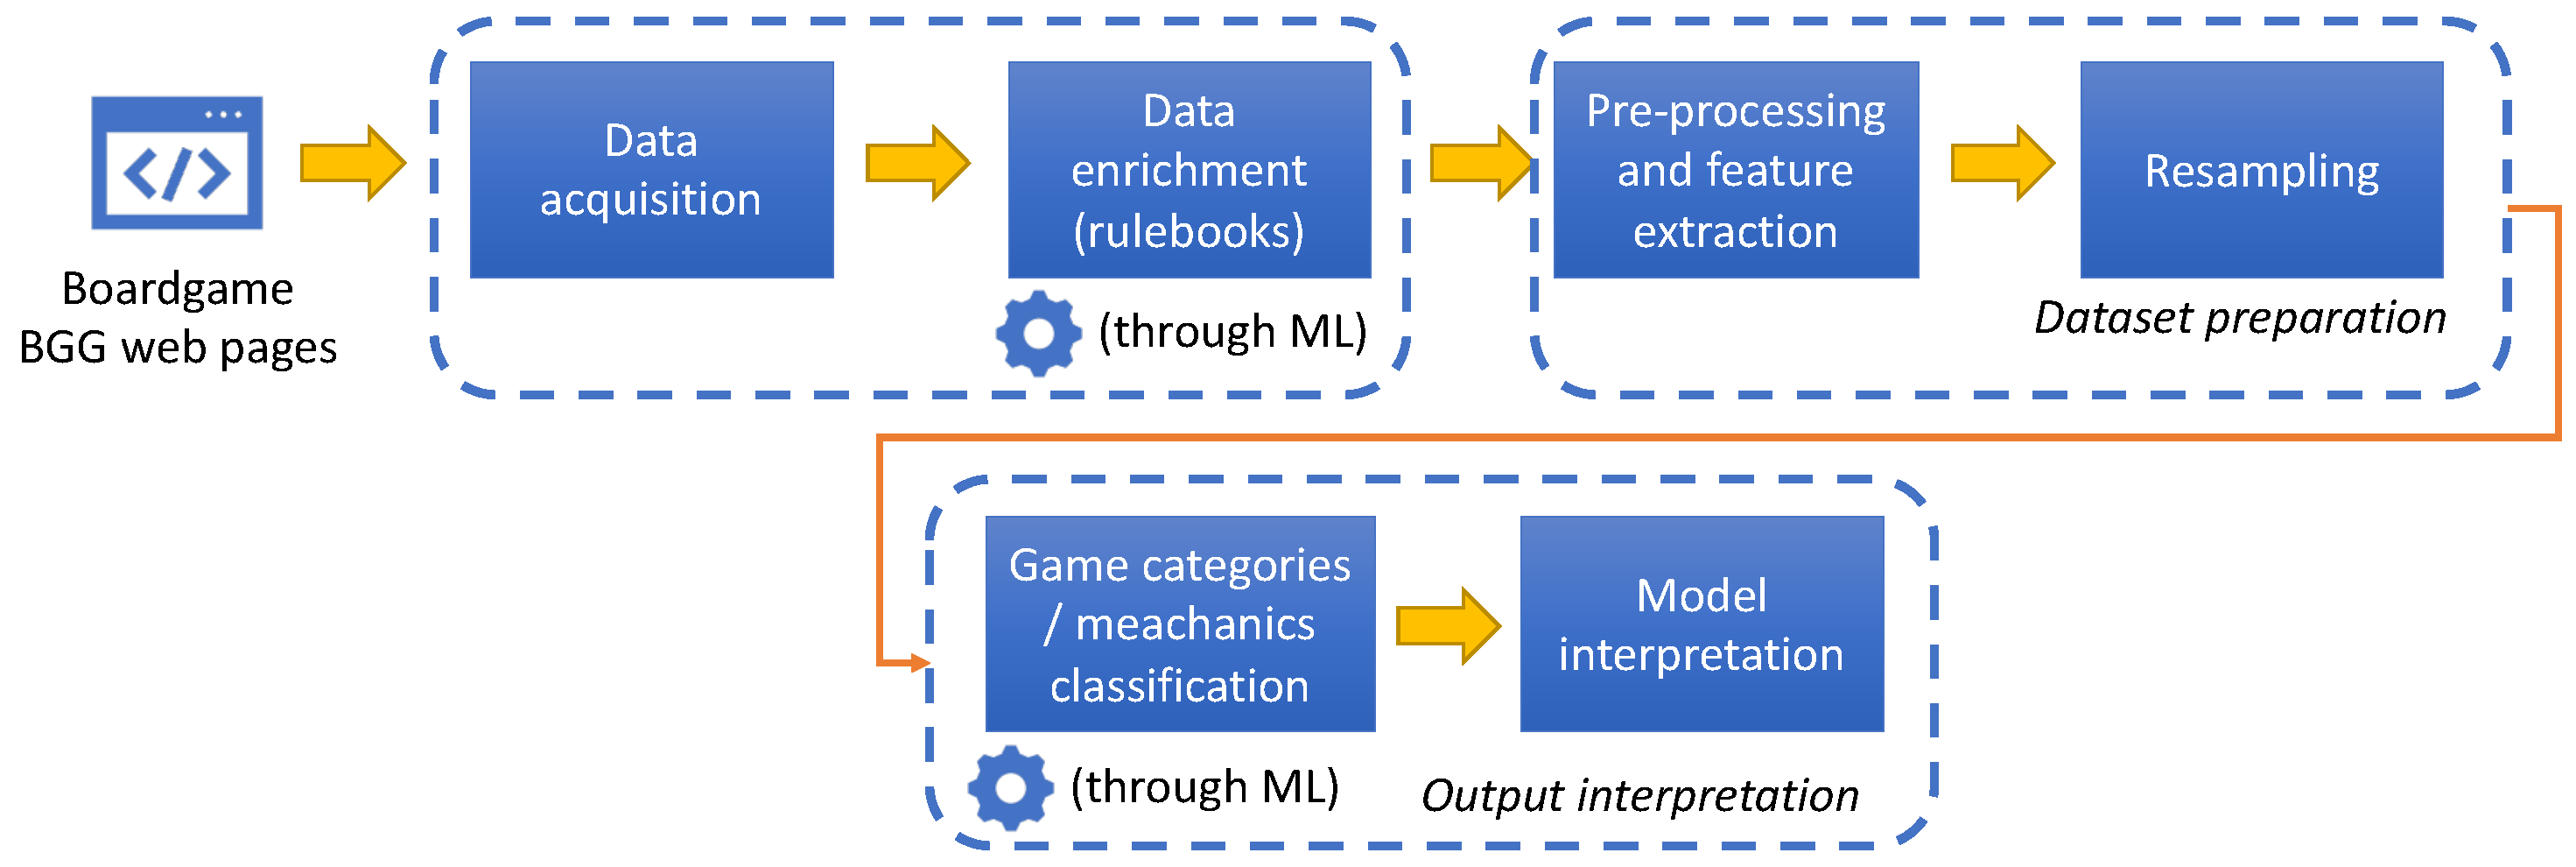
  • Data acquisition: First of all, the data had to be acquired from the BoardGameGeek—BGG (http://boardgamegeek.com/, accessed on 5 May 2022) website, the current reference for the board game community. The website is based on a very large database which, however, is not directly accessible as a download. Some information is accessible from an API, other information is available only through direct navigation on the website pages. This required the identification of the relevant information from the page of each game, construction of an ad hoc parser exploiting both direct scraping and BGG API to acquire the data from the pages and associated XML data of the first 50,000 games in the BGG ranking. Among the extracted fields, one of the most important is the textual description of the game;
  • Data enrichment: In order to possibly enhance the effectiveness of ML classification, the dataset has been enrinched with additional information coming from the rulebook associated to each game. This enrichment process was completely unfeasible to be done manually: in BGG, each game was associated to a community page containing various files, and the rulebook could be “hidden” among dozens of files (which are not categorized in any way and typically vary a lot from game to game in terms of content). In order to solve this, the process was modelled as an ML process itself: a subset of the files (some thousands) were manually identified and labeled as “rulebook” or “other”. Then, based on the file contents, an ML model was built and trained in order to automatically learn if a file was actually a rulebook: this allowed the extension of the whole dataset with a very high accuracy ratio (>95%).
Dataset preparation: Preparing the dataset with the right features (especially those coming from textual information and that need to be specifically processed) and balancing it for the specific machine learning tasks required further steps:
  • Pre-processing and feature extraction included elaborating the textual information, performing stopword removal and computing the textual features’ TF-IDF values;
  • Resampling was needed since the categories distribution of the dataset was very unbalanced: only the most frequent categories were kept, each with an equal number of samples.

4.2. Challenge 2—Output Interpretation

Machine learning results and their interpretation: Building the model, running tests on different classifiers and, most importantly, applying interpretable machine learning techniques to this context (typically unexplored from this point of view) was performed in the following ways:
  • Dataset splitting, cross validation: grid search techniques, combined with cross validation, enabled us to perform a significant number of runs and determine the best parameters for the model;
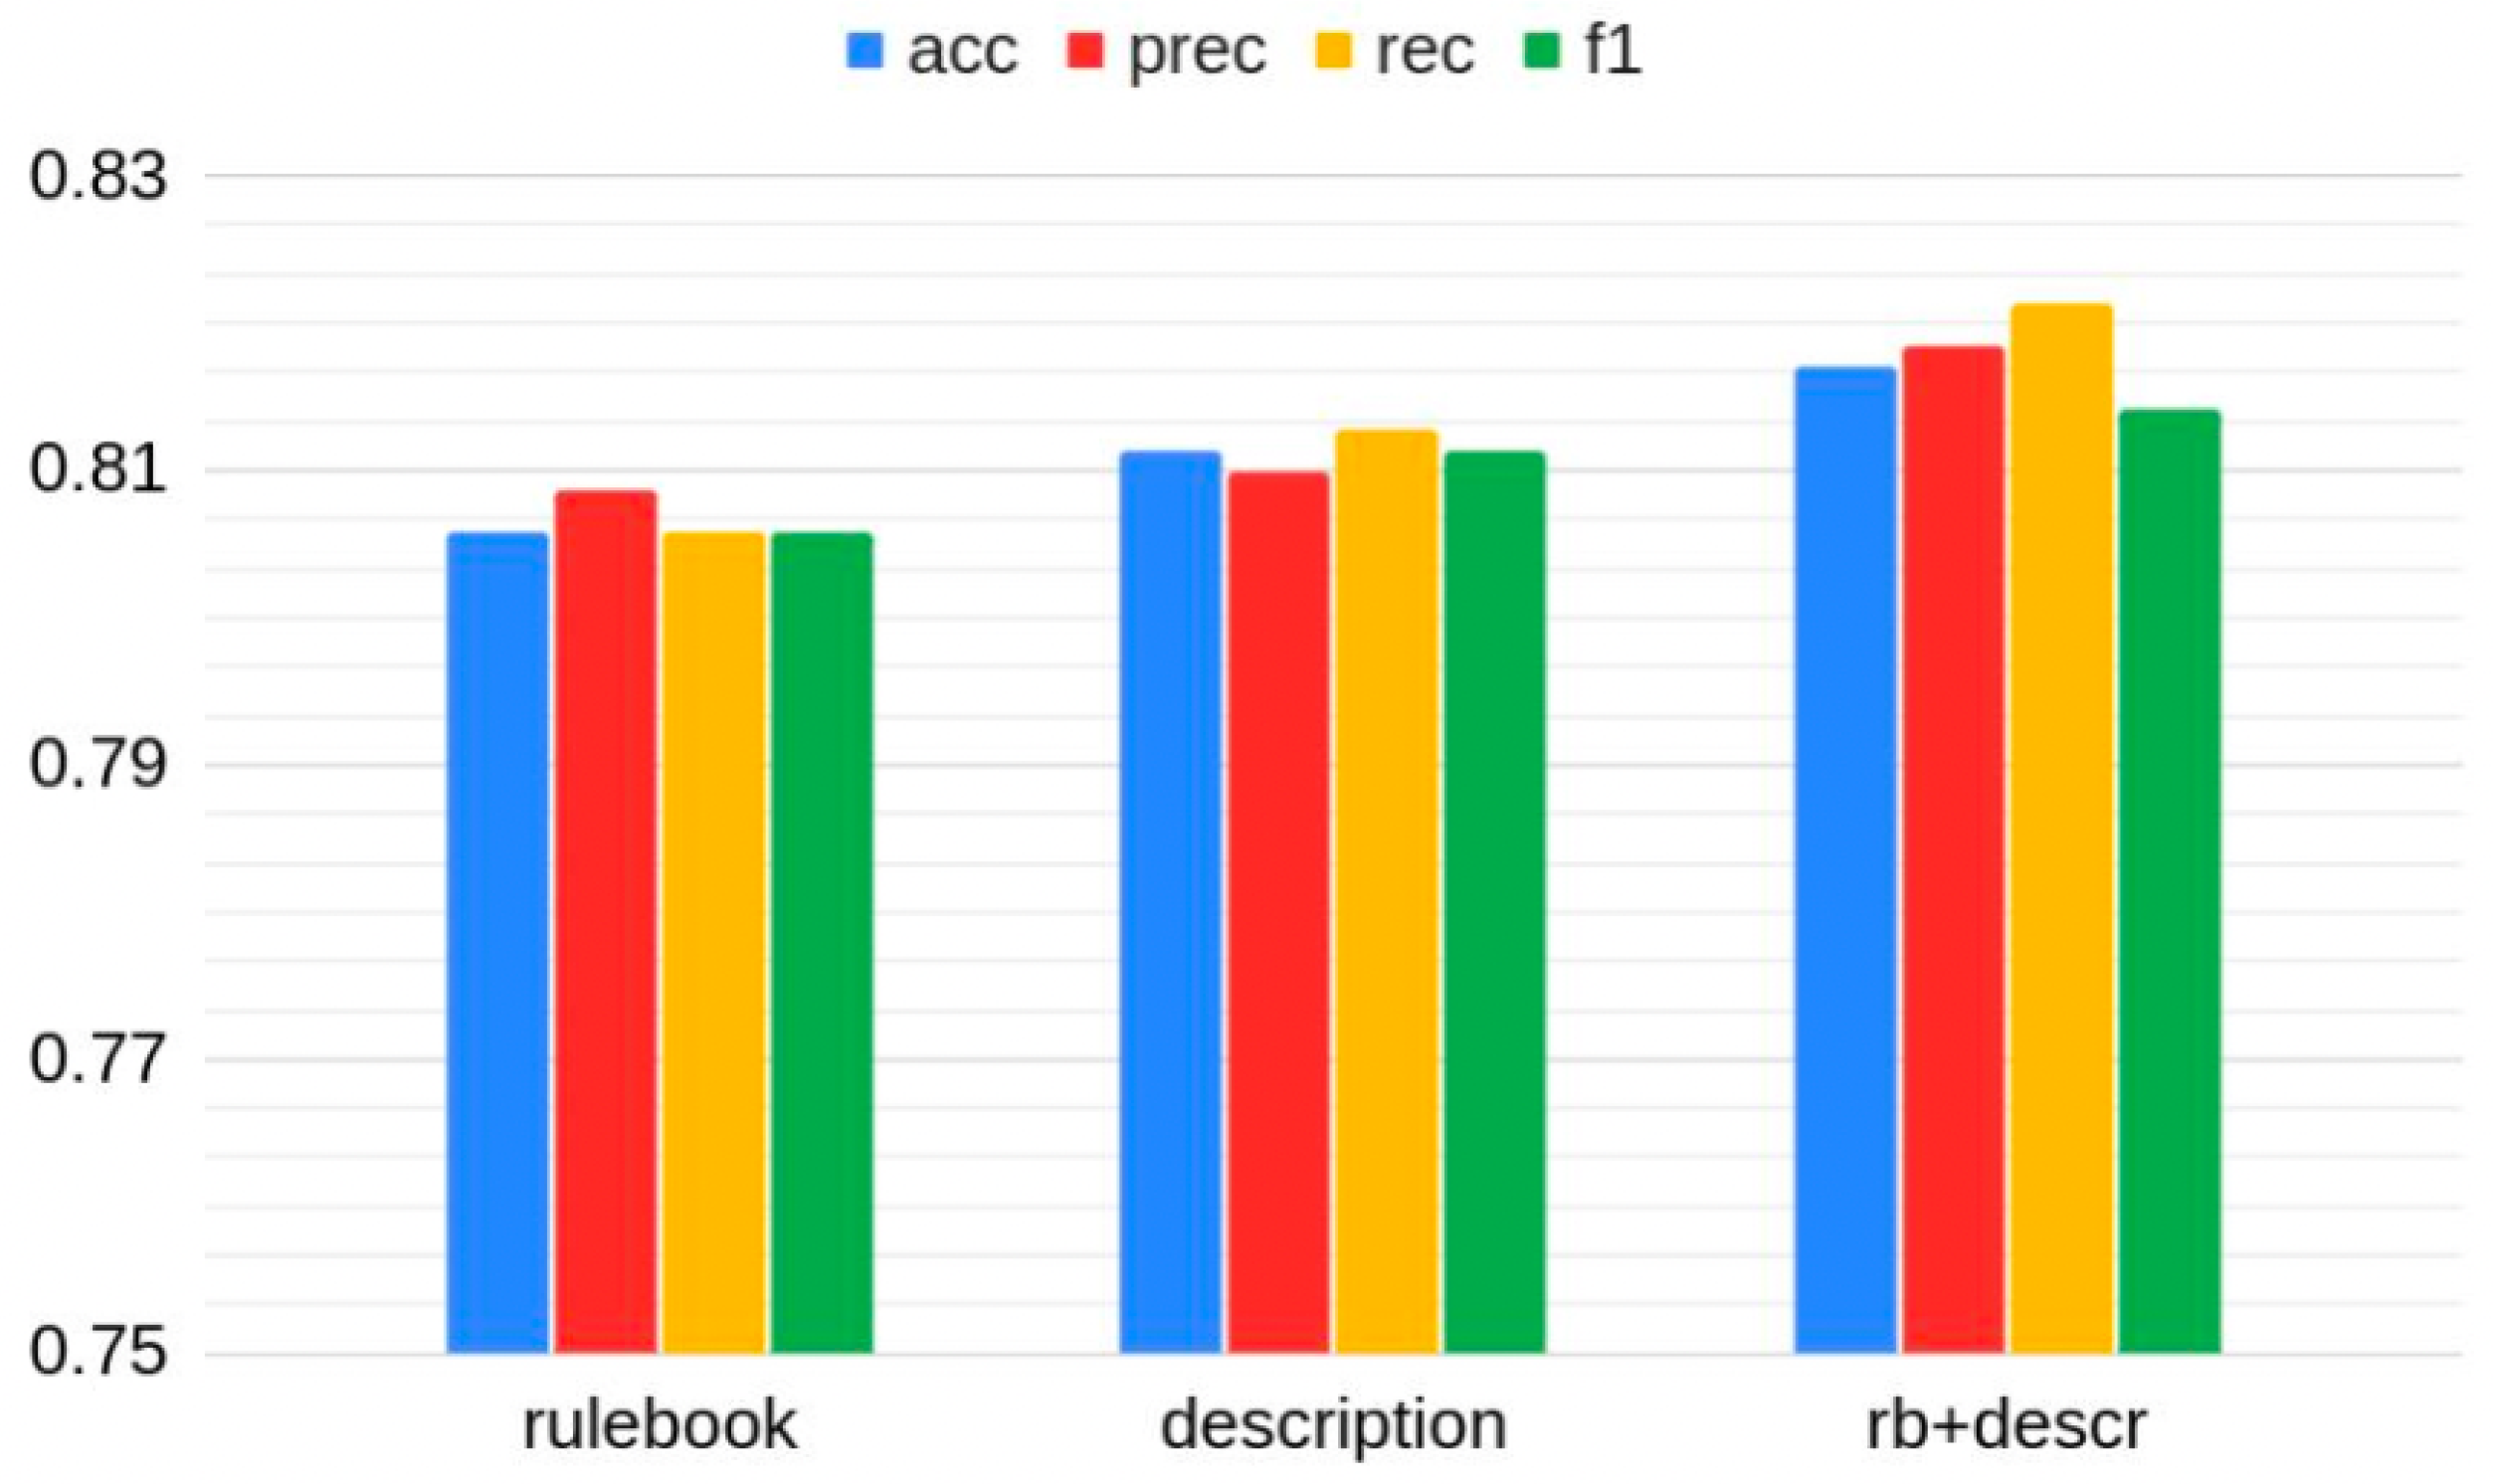
  • Different classifiers: Evaluating different classifiers was crucial to determine the best-performing ones for the specific situation; Figure 5 shows the accuracy, precision, recall and f1 levels obtained in the best performing case (Random Forest). As we can see, the accuracy obtained on the “enriched” dataset (also including rulebook information) was quite satisfying (82%);
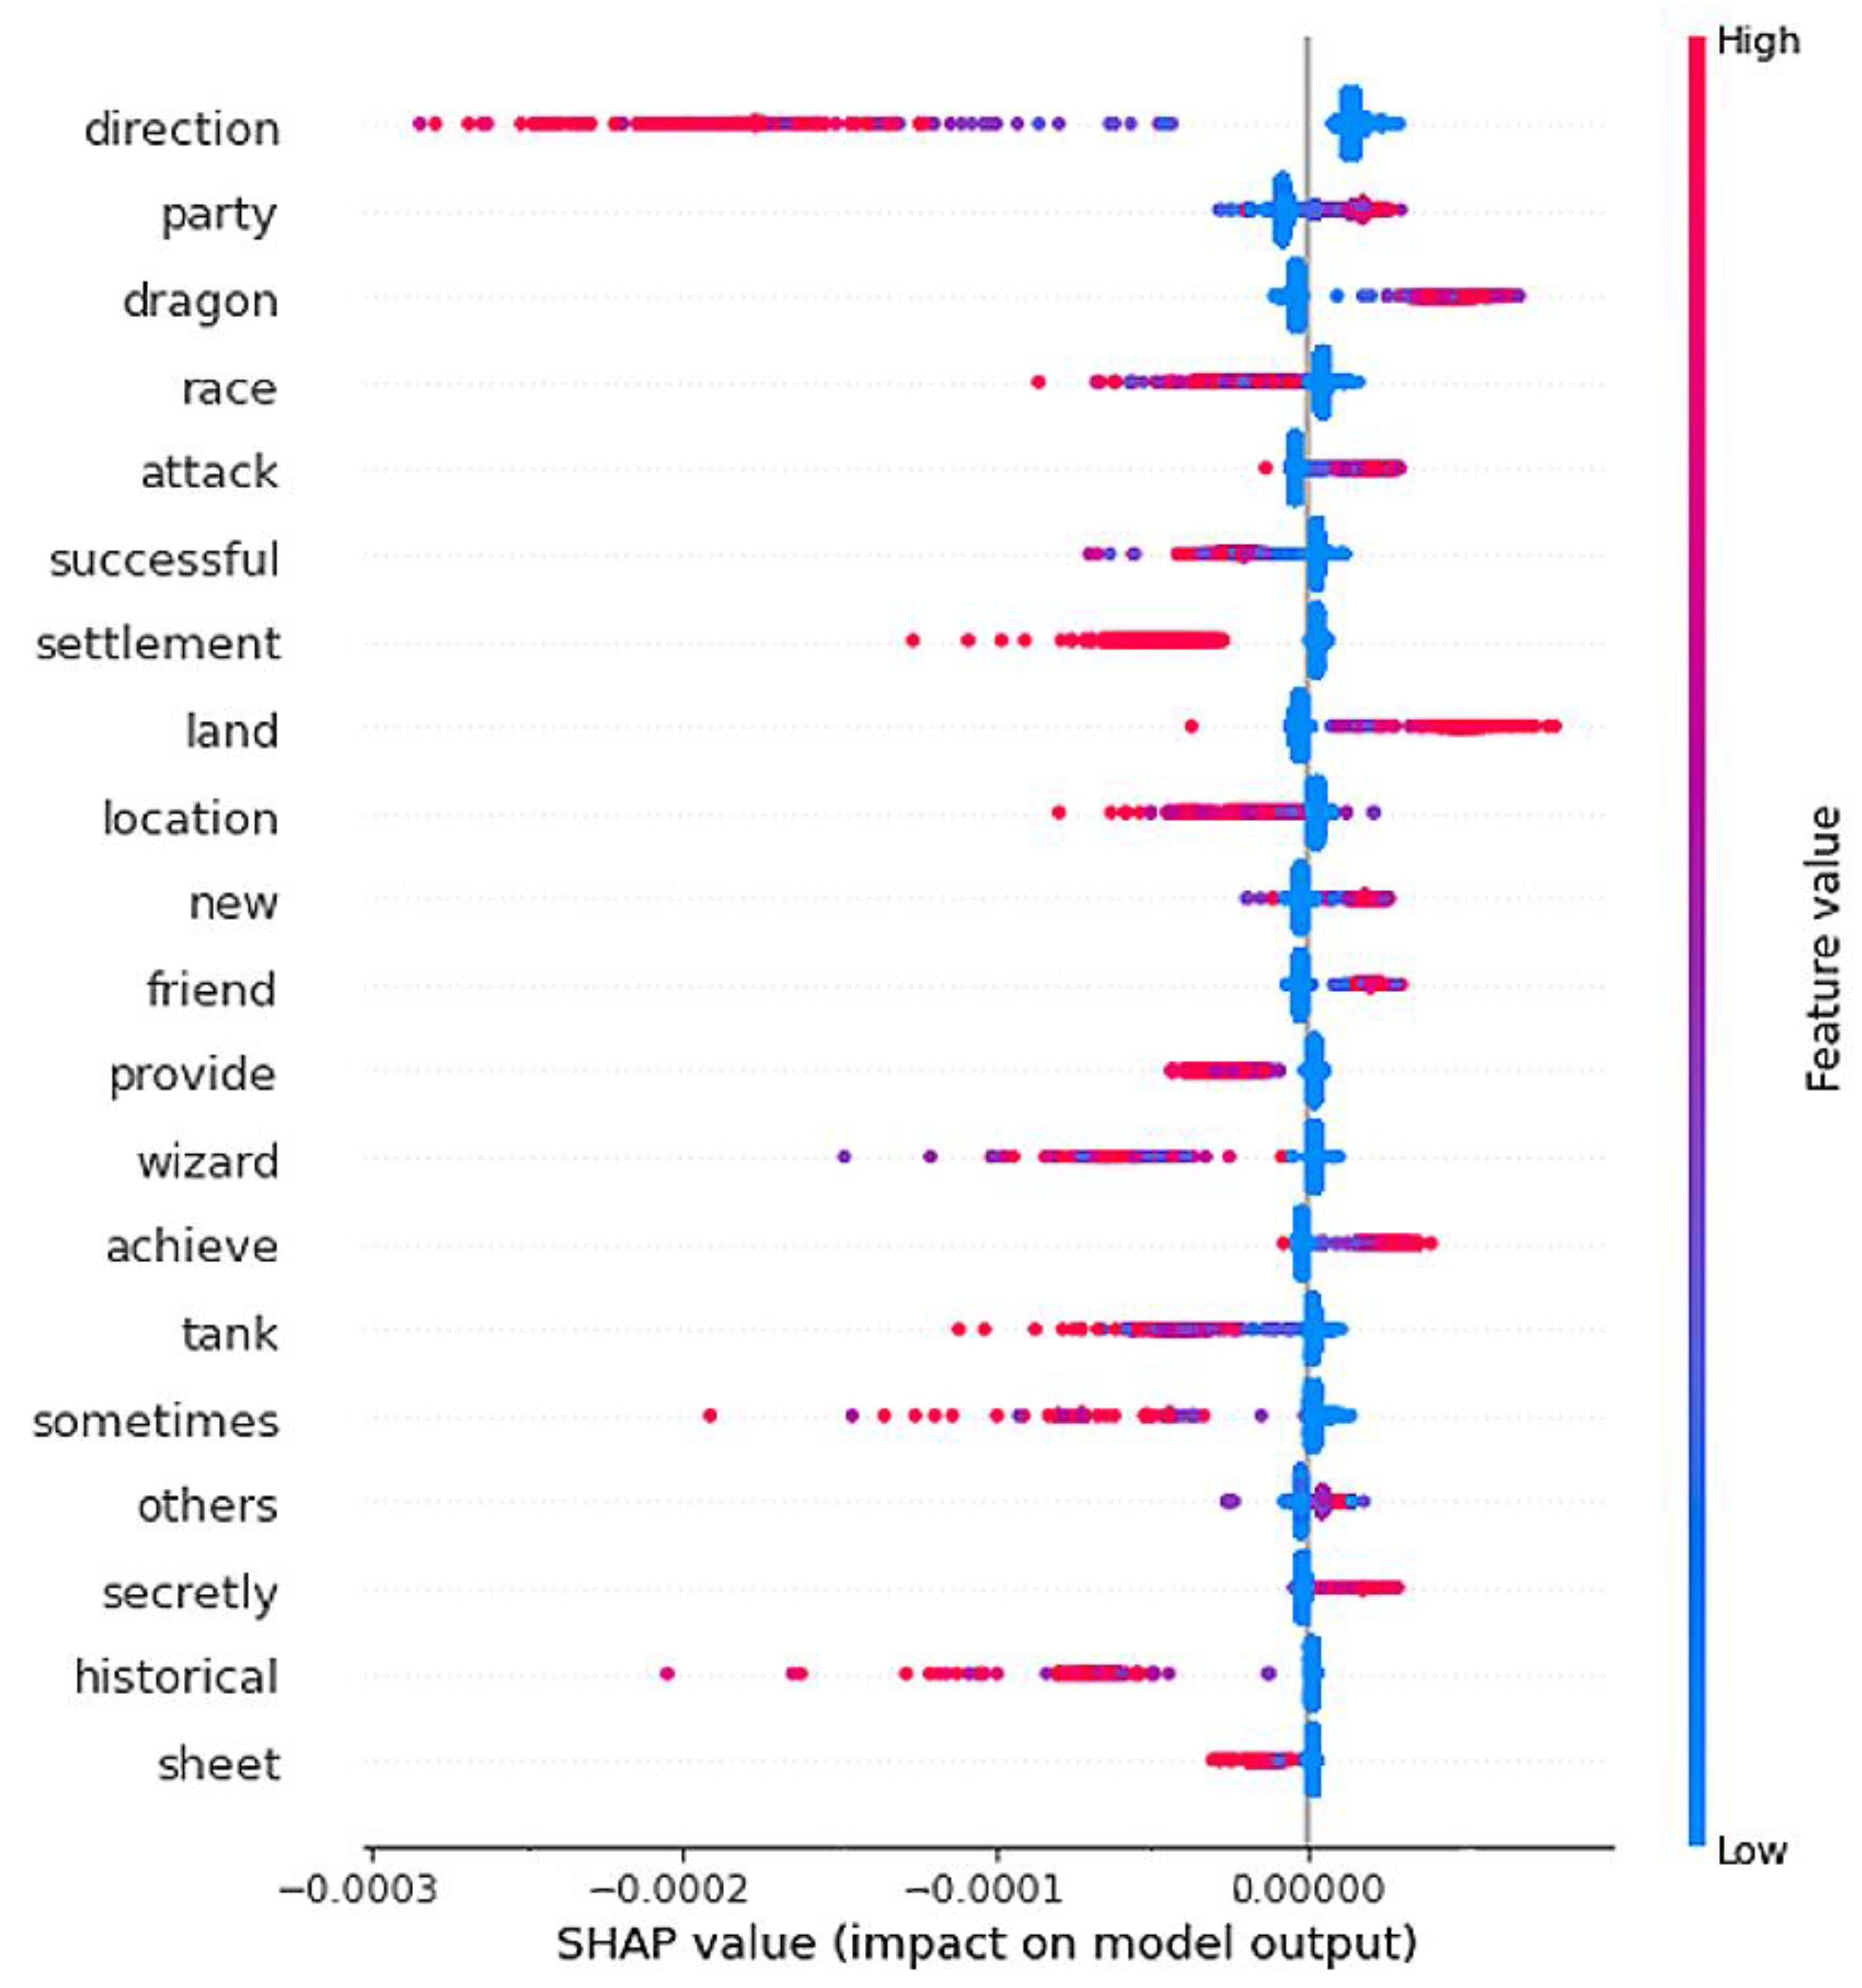
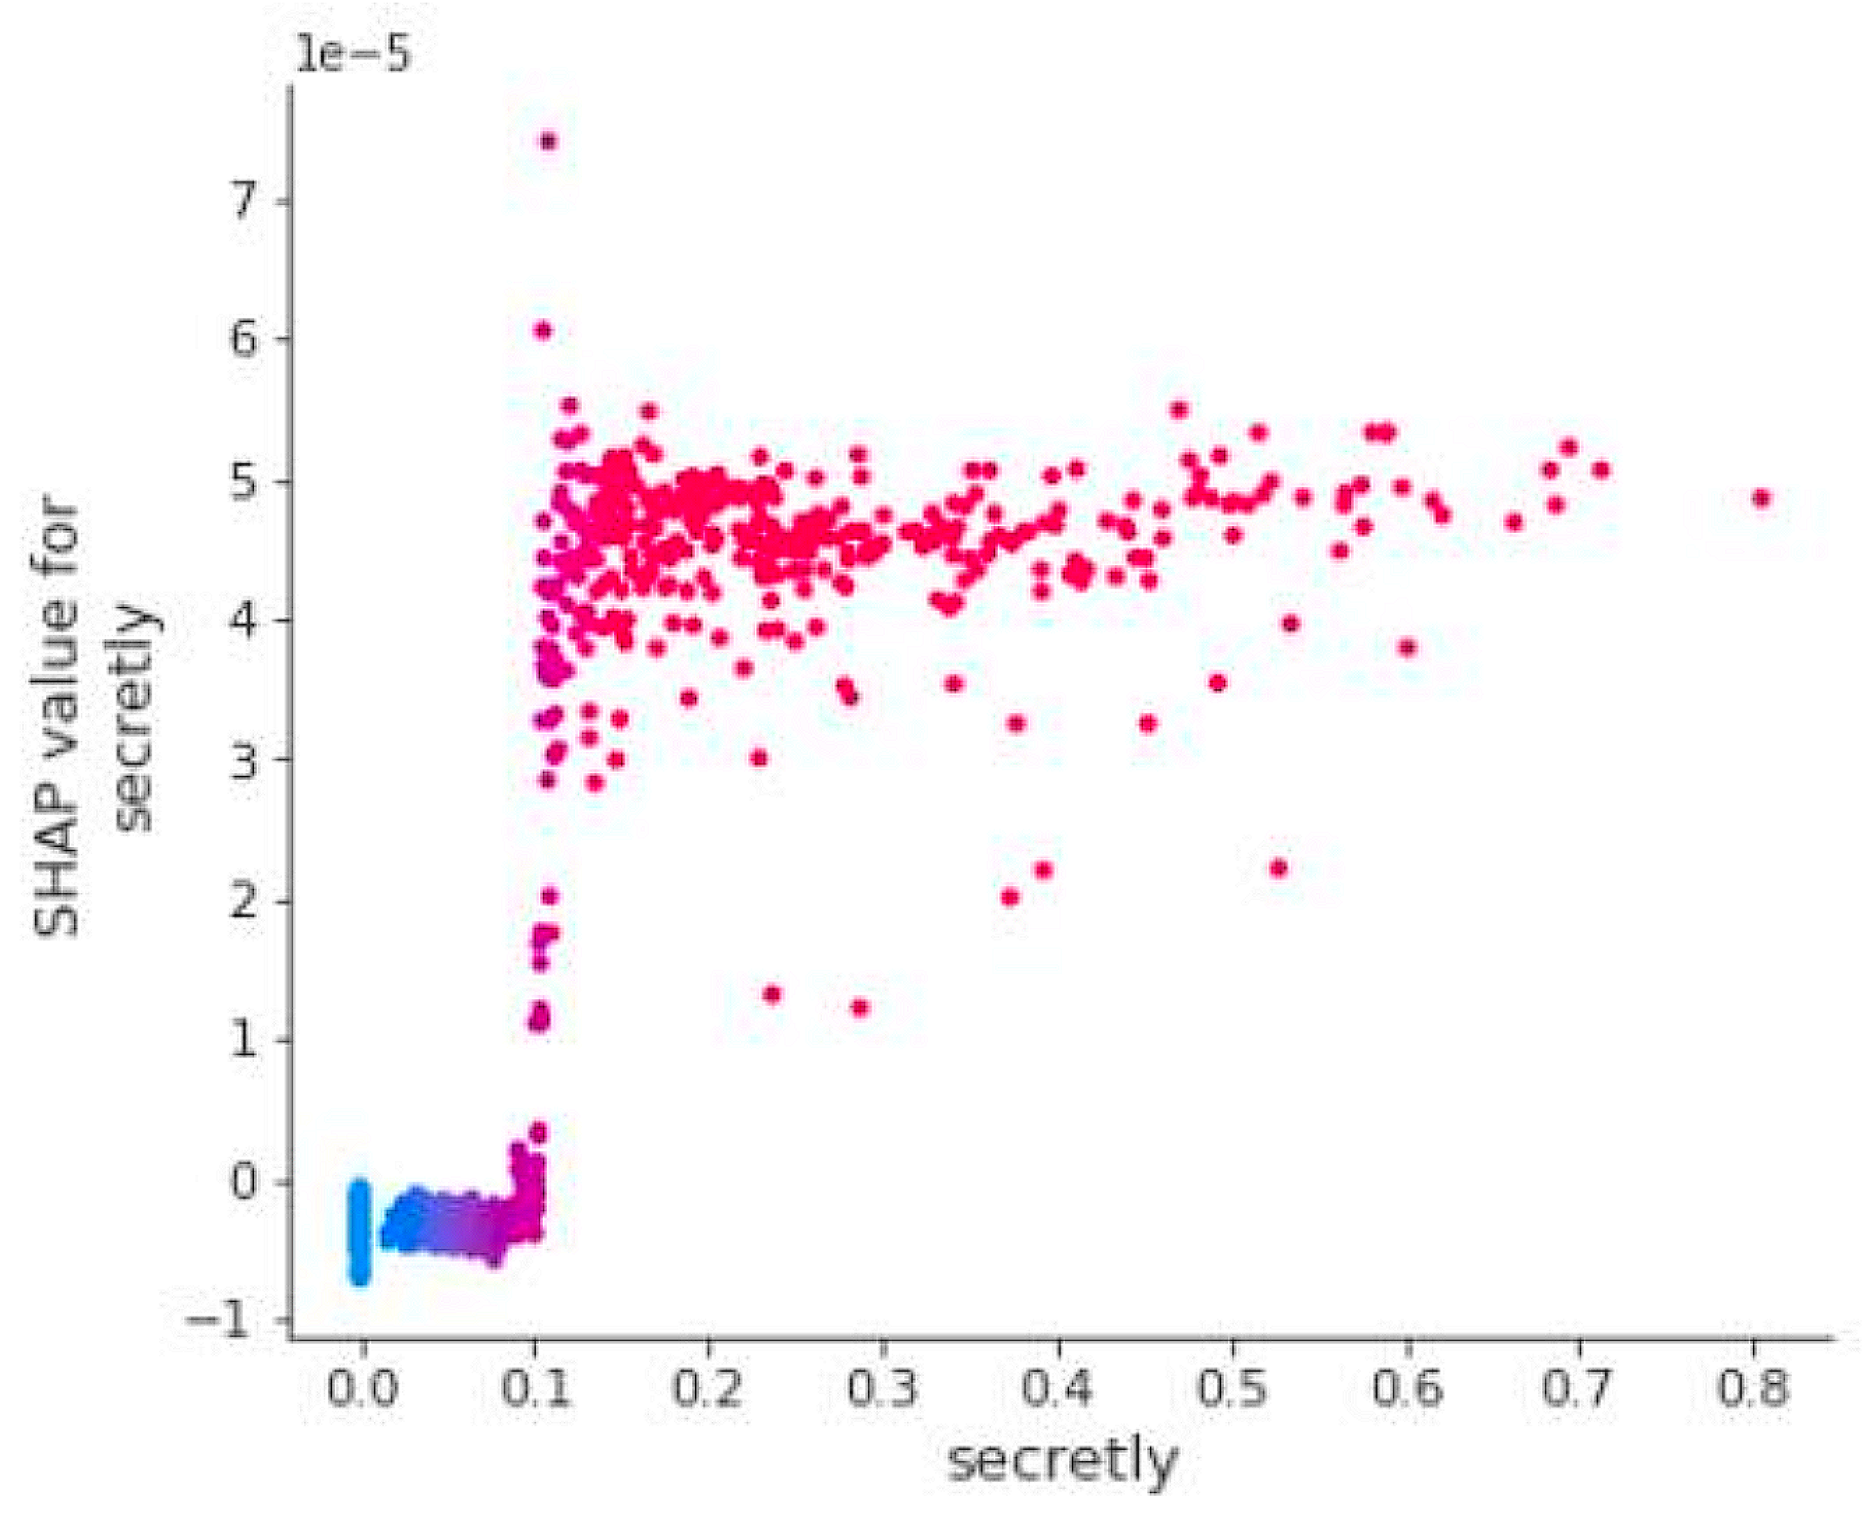
  • Model interpretation: Besides accuracy levels, interpreting the models can lead to interesting knowledge. By analyzing the Shapley values in a summary plot (Figure 6 shows the one for the Fantasy category), it is possible to acquire possibly unknown information about the games and their categories, including the most discriminant features (keywords). For instance, terms such as “dragon” and “land” positively connote the category, while others (e.g., “tank”) are typically not found in its games. More in-depth analyses can also be performed by plotting a dependency plot specific to a particular feature (Figure 7 shows an example of the “secretly” feature for the Cardgame category): since the SHAP value of each sample (vertical axis) grows for increasing TF-IDF scores (horizontal axis), we understand that the concept of “having secret information” is indeed typically found in card games but seldom in others. By exploiting insights coming from analyses such as these, the knowledge about games, game categories and game mechanics can be effectively improved.

5. A Short Overview of the Challenges in the Medical and HRM Analytics Scenarios

In this section, we will continue the discussion and briefly comment on some of the main challenges we have faced in our past (published) research in the Medical and HRM fields. Even if not explicitly presenting novel results (thus the shorter length with respect to previous sections), this will allow the reader to have a broader view on the subject of the paper. All the details on the analysis and techniques are available in the referenced works.

5.1. Medical Scenario

In the medical analytics scenario, the goal of our research is to predict wellness states for long-term patients [25] in novel data-driven ways. In a standard knowledge-driven approach, patients are monitored from the computation of standard indices deriving from variables manually selected and combined by clinical experts. Instead, in a data-driven approach, wellness states are predicted from a combination of clinical, self-monitoring, and self-reporting longitudinal observations using (interpretable) machine learning techniques. Dataset acquisition and preparation in this field is particularly complex, since a large dataset (261 patients, 18 months, 3 different world-wide clinics) is difficult to acquire but is needed in order to have significant results. Moreover, the high number of variables/features to be modeled (100+) and the heterogeneity of the dimensions that need to be considered in order to acquire a good knowledge of the patient health status (including patient-related outcomes from mobile smartphone apps and activity traces from commercial-grade activity loggers) are further challenges that need to be tackled. DD is shown to produce better predictive power than standard knowledge-driven methods [25]. As to output interpretation, one of the biggest challenges is to understand the reasons of specific health predictions: the high number of variables and the fact that the importance of each of them is typically different for each patient, could make standard “black-box” predictions especially dangerous to follow without a guide. On the other hand, intelligible explanations provide the benefit of ranking the variables with respect to a prediction, showing the important role that can be played by intelligible models towards personalising healthcare.

5.2. Human Resource Management Scenario

In the HRM analytics scenario, the goal of the research is to explore whether the employee attitudes (typically extracted from surveys) and digital work behaviors (actions performed and logged on Enterprise Collaboration Software) are correlated and, if they are, explore the possibility of predicting attitudes from behaviors [34,36]. In this case, acquiring sufficiently large and meaningful datasets from the ECSs used by enterprises, especially for data confidentiality reasons, is only the first challenge to overcome. The final dataset, spanning a year of digital actions data for 106 employees and encompassing more than 300,000 actions, needed to be effectively filtered, cleaned and modelled in graph form in order to be useful to the goal, i.e., analyzing data under the desired points of view: the individual (behavioral) perspective, according to which users performed how many actions of specific kinds; and the social (relational) perspective, making explicit the interactions between users. This enabled us to identify interesting correlations between attitudes and behaviors, and, eventutally, to design a machine learning model taking relevant behavior input and allowing the prediction of employee attitudes with satisfying precision [36]. Also in this scenario, the insights coming from these models need to be interpreted in order to be effectively exploited by companies to improve decisions about human resources, both in terms of efficiency and accuracy.

6. Related Works

6.1. Scenario 1: Social Network Analytics

Various ways of analyzing and predicting tweet influence, also known as popularity, have been proposed in the literature. Machine learning approaches are used to deal with prediction in the majority of scenarios. For example, paper [40] focuses on news agencies’ Twitter accounts and investigates the propagation of news on Twitter as the foundation of a Twitter news popularity prediction model. The stochastic model can forecast the number of retweets a news tweet will receive. The research in [41] is about a prominent Chinese microblogging service, and it tries to find content and contextual elements that influence the popularity of tweets. The width of tweet distribution and depth of deliberation on tweets, i.e., the number of comments tweets got, were used to determine the popularity of tweets. The authors of [42] wanted to find features for tweet popularity prediction that are both effective and simple to get or compute. According to the results of the experiment, a relatively small set of features, particularly temporal features, can attain comparable performance to all other features. The study [43] takes an alternative approach to the problem of forecasting the final number of reshares of a particular post. While all of these papers focused on a network-influenced idea of tweet popularity, the primary goal of our research in this field is to investigate content features in the context of art museums.

6.2. Scenario 2: Game Analytics

A vast body of work exists on the application of machine learning and data analytics approaches to game-related scenarios, a topic that has grown in popularity in recent years. The goals are diverse, ranging from computer-assisted game design [19] to AI-powered game play [20,22], with important applications in areas other than entertainment. More precisely, the analysis of board game information has been an important but under-explored subject, with several notable studies conducted in both academic and non-academic settings. When it comes to board game information, Board Game Geek is unquestionably one of the most important sources, with many data analysts and researchers working on its data for a variety of purposes. The majority of effort has gone into developing recommendation systems [44]. Other studies of board game analytics on BGG data have a variety of goals, ranging from predicting board game review ratings [45] to creating a boardgame ontology based on the MDA Framework [46], and defining archetypes of players and games and their relationships to game mechanics and genres [47]. The research we are conducting in this field is in some ways related to the above discussed ones, but with the novel aim of investigating the feasibility of applying data analytics and machine learning techniques for automatically discovering game features that can be exploited for different social uses.

6.3. Scenario 3: Medical Analytics

The recent increased emphasis on the necessity for explanations of ML systems [29,30] is a vital factor for the successful use of ML in medicine. This has sparked the new research trend of interpretable machine learning [2]. Despite the fact that recent research has presented novel models with excellent performance and interpretability, such as GA2M [48] and rule-based models [49], the utility of these models in healthcare has yet to be persuasively proved [2]. Instead, the interpretation method used in [50,51] is designed to work with existing and well-established (albeit less interpretable) machine learning methods, such as gradient boosting or deep learning, by extracting explanations post-hoc using Shapley Values [52]. This is one of the most advanced interpretation approaches, as it allows for both global (population level) and local (instance level) explanations, and this is the one that is used in our research.

6.4. Scenario 4: HRM Analytics

Enterprise Collaboration Software (ECS), also known as Enterprise Social Software (ESS), is a new type of software that has been attracting a growing number of researchers, resulting in a steady increase in publications, particularly in the field of Information Systems research. In [39], an extensive literature evaluation on this topic is presented. Nonetheless, just a few studies suggest an ECS data analytics method and none of them, as far as we know, use Social Network Analytics to meet the goal of framing employees’ attitudes. For example, ref. [38] proposes analyzing log files and content data in order to acquire a better knowledge of how ESS is actually used. The authors claim that Social Analytics may be very valuable for their purposes, but they complain about a lack of tools for this purpose and limit themselves to tabular analysis. Behrendt et al. [53] examine an empirical ESS example using a mixed-method data analytics approach that attempts to obtain insights from several data dimensions before combining them. The approach we followed in our research in this field is a mixed-method that properly tunes usage data with structural data and exploits Social Network Analysis (the survey [54] provides a comprehensive overview of most of the employed SNA solutions).

7. Conclusions

In this paper we presented four scenarios related to our everyday life where data analytics and (interpretable) ML-based techniques can actually provide several benefits. We focused on the actual challenges that are involved in general terms and in the specific context, discussing in detail novel results that have been obtained in the Social Network Analytics and Game Analytics settings.
We have shown that these techniques might be of real use for social good, and that adopting them to approach problems arising in this context is not just applying existing tools as a black box: particular care must be put in acquiring and pre-processing the dataset, as well as in understanding and interpreting the outcomes of such tools.

Author Contributions

Conceptualization, R.M. and M.M.; data curation, R.M.; methodology, R.M. and M.M.; supervision, R.M.; writing—original draft, R.M. and M.M.; writing—review and editing, R.M. and M.M. All authors have read and agreed to the published version of the manuscript.

Funding

This research received no external funding.

Institutional Review Board Statement

Not applicable.

Informed Consent Statement

Not applicable.

Data Availability Statement

The previous version of the social network analytics data (as exploited in [10]) is available at https://doi.org/10.5281/zenodo.4782984 (dataset) (accessed on 5 May 2022) and https://github.com/rmartoglia/predict-twitter-ch (accessed on 5 May 2022) (code). Ohter datasets can not be made publicly available because of non-disclosure agreements and copyright issues.

Acknowledgments

The authors would like to thank Enrico Fiorini, Luca Giovannoni and Simone Dattolo, who contributed to the Social Network Analytics and Game Analytics results during their bachelor/master degree internships.

Conflicts of Interest

The authors declare no conflict of interest.

References

  1. Volume of Data/Information Created, Captured, Copied, and Consumed Worldwide from 2010 to 2025. Available online: https://www.statista.com/statistics/871513/worldwide-data-created/ (accessed on 8 June 2022).
  2. Ahmad, M.A.; Eckert, C.; Teredesai, A.; McKelvey, G. Interpretable Machine Learning in Healthcare. IEEE Intell. Inform. Bull. 2018, 19, 1–7. [Google Scholar]
  3. Coeckelbergh, M. Artificial Intelligence: Some ethical issues and regulatory challenges. Technol. Regul. 2019, 2019, 31–34. [Google Scholar]
  4. Broussard, M. Artificial Unintelligence: How Computers Misunderstand the World; MIT Press: Cambridge, MA, USA, 2018. [Google Scholar]
  5. Yapo, A.; Weiss, J. Ethical Implications of Bias in Machine Learning. 2018. Available online: https://aisel.aisnet.org/hicss-51/os/topics_in_os/6/ (accessed on 5 May 2022).
  6. Martoglia, R. Invited speech: Data analytics and (interpretable) machine learning for social good. In Proceedings of the 2021 IEEE 23rd Int Conf on High Performance Computing and Communications; 7th Int Conf on Data Science andSystems; 19th Int Conf on Smart City; 7th Int Conf on Dependability in Sensor, Cloud and Big Data Systems and Application (HPCC/DSS/SmartCity/DependSys), Haikou, China, 20–22 December 2021; pp. 2144–2149. [Google Scholar] [CrossRef]
  7. Chianese, A.; Marulli, F.; Piccialli, F. Cultural heritage and social pulse: A semantic approach for CH sensitivity discovery in social media data. In Proceedings of the IEEE 10th International Conference on Semantic Computing (ICSC), Laguna Hills, CA, USA, 3–5 February 2016; pp. 459–464. [Google Scholar]
  8. Langa, L. Does Twitter Help Museums Engage with Visitors? Proc. iConference 2014, 484–495. [Google Scholar] [CrossRef]
  9. Furini, M.; Mandreoli, M.; Martoglia, R.; Montangero, M. 5 steps to make art museums tweet influentially. In Proceedings of the 3rd International Workshop on Social Sensing, SocialSens, Orlando, FL, USA, 17 April 2018. [Google Scholar]
  10. Furini, M.; Mandreoli, F.; Martoglia, R.; Montangero, M. A Predictive Method to Improve the Effectiveness of Twitter Communication in a Cultural Heritage Scenario. ACM J. Comput. Cult. Herit. 2022, 15, 1–18. [Google Scholar] [CrossRef]
  11. Furini, M.; Mandreoli, F.; Martoglia, R.; Montangero, M. The use of hashtags in the promotion of art exhibitions. In Proceedings of the 13th Italian Research Conference on Digital Libraries (IRCDL), Revised Selected Papers, Modena, Italy, 26–27 January 2017; pp. 187–198. [Google Scholar]
  12. Furini, M.; Mandreoli, F.; Martoglia, R.; Montangero, M. Towards tweet content suggestions for museum media managers. In Proceedings of the 4th EAI International Conference on Smart Objects and Technologies for Social Good, Bologna, Italy, 28–30 November 2018; pp. 265–270. [Google Scholar]
  13. Martoglia, R.; Montangero, M. An intelligent dashboard for assisted tweet composition in the cultural heritage area (work-in-progress). In Proceedings of the 6th EAI International Conference on Smart Objects and Technologies for Social Good, Antwerp, Belgium, 14–16 September 2020; pp. 226–229. [Google Scholar]
  14. Kase, S.E.; Bowman, E.K. Operating in the new information environment: An army vision of social sensing? In Proceedings of the 2018 International Workshop on Social Sensing (SocialSens), Orlando, FL, USA, 17 April 2018; IEEE Computer Society: Los Alamitos, CA, USA, 2018; pp. 1–11. [Google Scholar]
  15. Giachanou, A.; Crestani, F. Like It or Not: A Survey of Twitter Sentiment Analysis Methods. ACM Comput. Surv. 2016, 49, 1–41. [Google Scholar] [CrossRef]
  16. Aston, N.; Liddle, J.; Hu, W. Twitter Sentiment in Data Streams with Perceptron. J. Comput. Commun. 2014, 2, 11–16. [Google Scholar] [CrossRef]
  17. Hu, X.; Tang, J.; Gao, H.; Liu, H. Unsupervised sentiment analysis with emotional signals. In Proceedings of the 22nd International Conference on World Wide Web, Rio de Janeiro, Brazil, 13–17 May 2013. [Google Scholar]
  18. Hamari, J.; Koivisto, J.; Sarsa, H. Does gamification work?—A literature review of empirical studies on gamification. In Proceedings of the 2014 47th Hawaii International Conference on System Sciences, Waikoloa, HI, USA, 6–9 January 2014; pp. 3025–3034. [Google Scholar]
  19. Cook, M.; Colton, S.; Gow, J.; Smith, G. General analytical techniques for parameter-based procedural content generators. In Proceedings of the IEEE Conference on Games, CoG 2019, London, UK, 20–23 August 2019; pp. 1–8. [Google Scholar]
  20. Kowalski, J.; Miernik, R.; Mika, M.; Pawlik, W.; Sutowicz, J.; Szykula, M.; Tkaczyk, A. Efficient reasoning in regular boardgames. In Proceedings of the IEEE Conference on Games, CoG 2020, Osaka, Japan, 24–27 August 2020; pp. 455–462. [Google Scholar]
  21. Martoglia, R.; Pontiroli, M. Let the games speak by themselves: Towards game features discovery through data-driven analysis and explainable AI. In Proceedings of the 2021 IEEE 23rd Int Conf on High Performance Computing and Communications; 7th Int Conf on Data Science and Systems; 19th Int Conf on Smart City; 7th Int Conf on Dependability in Sensor, Cloud and Big Data Systems and Application (HPCC/DSS/SmartCity/DependSys), Haikou, China, 20–22 December 2021; pp. 2332–2337. [Google Scholar] [CrossRef]
  22. Konen, W. General board game playing for education and research in generic AI game learning. In Proceedings of the IEEE Conference on Games, CoG 2019, London, UK, 20–23 August 2019; pp. 1–8. [Google Scholar]
  23. Rabbi, M.; Ali, S.; Choudhury, T.; Berke, E. Passive and in-situ assessment of mental and physical well-being using mobile sensors. In Proceedings of the 13th International Conference on Ubiquitous Computing, Beijing, China, 17–21 September 2011; pp. 385–394. [Google Scholar]
  24. Veličković, P.; Karazija, L.; Lane, N.D.; Bhattacharya, S.; Liberis, E.; Lio, P.; Chien, A.; Bellahsen, O.; Vegreville, M. Cross-modal recurrent models for weight objective prediction from multimodal time-series data. In Proceedings of the 12th EAI International Conference on Pervasive Computing Technologies for Healthcare, New York, NY, USA, 21–24 May 2018; pp. 178–186. [Google Scholar]
  25. Ferrari, D.; Guaraldi, G.; Mandreoli, F.; Martoglia, R.; Milic, J.; Missier, P. Data-driven vs. knowledge-driven inference of health outcomes in the ageing population: A case study. In Proceedings of the 4th International Workshop on Data Analytics Solutions for Real-Life Applications, Co-Located with EDBT/ICDT 2020 Joint Conference (DARLI-AP EDBT 2020), Copenhagen, Denmark, 30 March 2020. [Google Scholar]
  26. Vischioni, C.; Bove, F.; Mandreoli, F.; Martoglia, R.; Pisi, V.; Taccioli, C. Visual Exploratory Data Analysis for Copy Number Variation Studies in Biomedical Research. Big Data Res. 2022, 27, 100298. [Google Scholar] [CrossRef]
  27. Bove, F.; Mandreoli, F.; Martoglia, R.; Pisi, V.; Taccioli, C.; Vischioni, C. VarCopy: A visual exploratory data analysis platform for copy number variation studies. In Proceedings of the 24 International Conference Information Visualisation (iV 2020), Melbourne, VIC, Australia, 7–11 September 2020. [Google Scholar]
  28. Ghidoni, G.; Martoglia, R.; Taccioli, C.; Vischioni, C. InstaCircos: A web application for fast and interactive circular visualization of large genomic data. In Proceedings of the 24 International Conference Information Visualisation (iV 2020), Melbourne, VIC, Australia, 7–11 September 2020. [Google Scholar]
  29. Guidotti, R.; Monreale, A.; Ruggieri, S.; Turini, F.; Giannotti, F.; Pedreschi, D. A survey of methods for explaining black box models. ACM Comput. Surv. 2018, 51, 1–42. [Google Scholar] [CrossRef]
  30. Gilpin, L.H.; Bau, D.; Yuan, B.Z.; Bajwa, A.; Specter, M.; Kagal, L. Explaining explanations: An overview of interpretability of machine learning. In Proceedings of the 2018 IEEE 5th International Conference on Data Science and Advanced Analytics (DSAA), Turin, Italy, 1–3 October 2018; pp. 80–89. [Google Scholar]
  31. Fabbri, T. Digital work: An organizational perspective. In Working in Digital and Smart Organizations—Legal, Economic and Organizational Perspectives on the Digitalization of Labour Relations; Senatori, I., Ales, E., Eds.; Palgrave/MacMillan: London, UK, 2018. [Google Scholar]
  32. March, J.G.; Simon, H.A. Organizations; Wiley and Sons: Hoboken, NJ, USA, 1958. [Google Scholar]
  33. McAbee, S.T.; Landis, R.S.; Burke, M.I. Inductive reasoning: The promise of big data. Hum. Resour. Manag. Rev. 2017, 27, 277–290. [Google Scholar] [CrossRef]
  34. Bertolotti, F.; Fabbri, T.; Mandreoli, F.; Martoglia, R.; Scapolan, A. Work datafication and digital work behavior analysis as a source of social good. In Proceedings of the IEEE Consumer Communications and Networking Conference (CCNC), Las Vegas, NV, USA, 10–13 January 2020. [Google Scholar]
  35. Ng, T.W.; Feldman, D.C. Organizational embeddedness and occupational embeddedness across career stages. J. Vocat. Behav. 2007, 70, 336–351. [Google Scholar] [CrossRef]
  36. Bertolotti, F.; Fabbri, T.; Mandreoli, F.; Martoglia, R.; Muzzini, F.; Scapolan, A. Modelling Employees’ Attitudes through Digital “Exhausts”: A First Experiment; University of Modena and Reggio Emilia: Modena, Italy, 2022; submitted. [Google Scholar]
  37. Fabbri, T.; Mandreoli, F.; Martoglia, R.; Scapolan, A. Employee attitudes and (digital) collaboration data: A preliminary analysis in the HRM field. In Proceedings of the International Workshop on Social Media Sensing (SMS’19 @ IEEE ICCCN), Valencia, Spain, 29 July–1 August 2019. [Google Scholar]
  38. Schwade, F.; Schubert, P. Social collaboration analytics for enterprise collaboration systems: Providing business intelligence on collaboration activities. In Proceedings of the 50th Hawaii International Conference on System Sciences (2017), Hilton, HI, USA, 4–7 January 2017. [Google Scholar]
  39. Wehner, B.; Ritter, C.; Leist, S. Enterprise social networks: A literature review and research agenda. Comput. Netw. 2017, 114, 125–142. [Google Scholar] [CrossRef]
  40. Wu, B.; Shen, H. Analyzing and Predicting News Popularity on Twitter. Int. J. Inf. Manag. 2015, 35, 702–711. [Google Scholar] [CrossRef]
  41. Zhang, L.; Peng, T.; Zhang, Y.; Wang, X.; Zhu, J.J.H. Content or context: Which matters more in information processing on microblogging sites. Comput. Hum. Behav. 2014, 31, 242–249. [Google Scholar] [CrossRef]
  42. Gao, S.; Ma, J.; Chen, Z. Effective and Effortless Features for Popularity Prediction in Microblogging Network. In Proceedings of the 23rd International Conference on World Wide Web, Seoul, Korea, 7–11 April 2014; pp. 269–270. [Google Scholar]
  43. Zhao, Q.; Erdogdu, M.A.; He, H.Y.; Rajaraman, A.; Leskovec, J. SEISMIC: A self-exciting point process model for predicting tweet popularity. In Proceedings of the 21th ACM SIGKDD International Conference on Knowledge Discovery and Data Mining, Sydney, NSW, Australia, 10–13 August 2015; pp. 1513–1522. [Google Scholar]
  44. Woodward, P.; Woodward, S. Mining the BoardGameGeek. Significance 2019, 16, 24–29. [Google Scholar] [CrossRef]
  45. Kohli, S. Predicting Board Game Reviews using KMeans Clustering & Linear Regression. 2016. Available online: https://guneetkohli.github.io/machine-learning/board-game-reviews/#.YD1oo2hKjIU (accessed on 5 May 2022).
  46. Kritz, J.; Mangeli, E.; Xexéo, G. Building an Ontology of Boardgame Mechanics based on the BoardGameGeek Database and the MDA Framework. SBGames 2017, 16, 182–191. [Google Scholar]
  47. Van Gerwen, R. Exploring the Relationship between Motivation, Mechanics and Genre for Tabletop Games. Ph.D. Thesis, Tilburg University, Tilburg, The Netherlands, 2019. [Google Scholar]
  48. Nori, H.; Jenkins, S.; Koch, P.; Caruana, R. InterpretML: A Unified Framework for Machine Learning Interpretability. arXiv 2019, arXiv:1909.09223. [Google Scholar]
  49. Ustun, B.; Rudin, C. Supersparse Linear Integer Models for Optimized Medical Scoring Systems. Mach. Learn. 2015, 102, 349–391. [Google Scholar] [CrossRef]
  50. Lundberg, S.; Nair, B.; Vavilala, M.; Horibe, M.; Eisses, M.J.; Adams, T.; Liston, D.E.; Low, D.K.-W.; Newman, S.-F.; Kim, K.; et al. Explainable machine learning predictions to help anesthesiologists prevent hypoxemia during surgery. Nat. Biomed. Eng. 2018, 2, 749–760. [Google Scholar] [CrossRef] [PubMed]
  51. Lundberg, S.; Lee, S. A unified approach to interpreting model predictions. In Advances in Neural Information Processing Systems 30; Guyon, I., Luxburg, U.V., Bengio, S., Wallach, H., Fergus, R., Vishwanathan, S., Garnett, R., Eds.; Curran Associates, Inc.: New York, NY, USA, 2017; pp. 4765–4774. [Google Scholar]
  52. Shapley, L.S. A value for n-person games. Contributions to the Theory of Games; Princeton University Press: Princeton, NJ, USA, 1953; Volume 2. [Google Scholar]
  53. Behrendt, S.; Richter, A.; Trier, M. Mixed methods analysis of enterprise social networks. Comput. Netw. 2014, 13, 9266. [Google Scholar] [CrossRef]
  54. Al-garadi, M.A.; Varathan, K.D.; Ravana, S.D.; Ahmed, E.; Shaikh, G.M.; Khan, M.U.S.; Khan, S.U. Analysis of Online Social Network Connections for Identification of Influential Users: Survey and Open Research Issues. ACM Comput. Surv. 2018, 51, 1–37. [Google Scholar] [CrossRef]
Figure 1. Overview of the four scenarios and of the main datasets used in the analyses.
Information 13 00359 g001
Figure 2. Dataset acquisition, preparation and analysis pipeline for the social networks analytics scenario.
Information 13 00359 g002
Figure 3. An example of interpretable machine learning result in the context of the Social Network Analytics scenario.
Information 13 00359 g003
Figure 4. Dataset acquisition, preparation and analysis pipeline for the game analytics scenario.
Information 13 00359 g004
Figure 5. Obtained accuracy results for game category classification.
Information 13 00359 g005
Figure 6. An example of interpretable machine learning result in the context of the Game Analytics Scenario scenario: summary plot for classification of games, Fantasy category.
Information 13 00359 g006
Figure 7. An example of interpretable machine learning result in the context of the Game Analytics Scenario scenario: dependency plot for classification of games, Cardgames category, “secretly” feature. Horizontal axis shows TF-IDF values, vertical axis SHAP values.
Information 13 00359 g007
Table 1. Accuracy results for Tweet GOOD/BAD classification for the three museum groups.
Museum GroupAccuracy
Group 187.63%
Group 292.65%
Group 381.29%
Publisher’s Note: MDPI stays neutral with regard to jurisdictional claims in published maps and institutional affiliations.

