Article

Construction of a Low-Cost Layered Interactive Dashboard with Capacitive Sensing

by
Agapi Tsironi Lamari
1,
Spyros Panagiotakis
1,*,
Zacharias Kamarianakis
1,2,
George Loukas
1,
Athanasios Malamos
1 and
Evangelos Markakis
1
1
Department of Electrical & Computer Engineering, Hellenic Mediterranean University, 71410 Heraklion, Greece
2
Institute of Agri-Food and Life Sciences, University Research Centre, Hellenic Mediterranean University, 71410 Heraklion, Greece
*
Author to whom correspondence should be addressed.
Information 2022, 13(6), 304; https://doi.org/10.3390/info13060304
Submission received: 18 April 2022 / Revised: 27 May 2022 / Accepted: 13 June 2022 / Published: 17 June 2022
(This article belongs to the Special Issue Pervasive Computing in IoT)

Abstract

:
In the present work, a methodology for the low-cost crafting of an interactive layered dashboard is proposed. Our aim is that the tangible surface be constructed using domestic materials that are easily available in every household. Several tests were performed on different capacitive materials before the selection of the most suitable one for use as a capacitive touch sensor. Various calibration methods were evaluated so that the behavior of the constructed capacitive touch sensors is smooth and reliable. The layered approach is achieved by a menu of few touch buttons on the left side of the dashboard. Thus, various different layers of content can be projected over the same construction, offering extendibility and ease of use to the users. For demonstration purposes, we developed an entertaining plus an educational application of projection mapping for the pervasive and interactive projection of multimedia content to the users of the presented tangible interface. The whole design and implementation approach are thoroughly analyzed in the paper and are presented through the illustration and application of various multimedia layers over the dashboard. An evaluation of the final construction proves the feasibility of the proposed work.

1. Introduction

With the continuous development in the technological sector and especially in the Internet of Things industry in recent years, the way we think is changing drastically. The Internet of Things (IoT) is one of the top three technological developments of the next decade and is becoming an increasingly debated topic, especially as an enabler for the implementation of pervasive cyber-physical applications [1,2,3,4]. The interaction between user and computer was initially limited to the simple use of input devices such as a mouse and keyboard. In recent years, however, there has been rapid progress and new ways of communicating and interacting with computers have emerged [5]. In particular, the use of touch is an important sensory organ that provides multiple possibilities to the interaction with machines. The operation of an interactive surface with capacitive sense is based on the use of touch as a means for human-computer interaction and is a more integrated way of communication. Interactive tangible surfaces often found in public spaces having informational, advertising, educational, and entertainment purposes [6,7]. They are a very smart means of advertising and learning as they arouse intense interest and reach a large number of people who aim to know their functions and capabilities.
Although capacitive sensing is a very popular technology for electronically implementing the sense of touch [8], existing products are far too expensive for considering them as easily replaceable consuming goods. On the other hand, there are several daily uses for such dashboards that would benefit from low-cost implementations of this type. For example, schools of all levels are always asking for accessible interactive panels for use in their curricula or announcing news for their students but they cannot afford buying industrial grade solutions with the risk to be damaged by such daily use. The same states also for hospitals, public transportation stations, airports, etc. Hence, building cost-effective interactive dashboards that can, however, be reliable and robust for use in a public space can be a challenging task [9].
The main purpose of the present work is to propose a methodology for crafting an interactive tangible and mutlifunctional dashboard integrating capacitive sensing that can be easily and inexpensively implemented from electronics novices in a ‘do-it-yourself’ (DIY) manner. Such a dashboard, combined with a typical projector to display graphics on it, can find several uses from information kiosks and advertising to education and amusement. The key target of our application is the accommodation of different layers of functionality over the same construction. To this end, a menu is provided that leads to different layers of content. This means that for each layer, the touch sensors arranged in the dashboard are assigned different roles, providing us with more touch events, thus eliminating the necessity for the use of more physical sensors. In our pilot construction, the physical touch sensors in place are sixteen, but with the use of the menu thirty-nine different actions can be supported. Our intention is not to present a new way for creating capacitive sensors, but to use the existing science and methods in order to find the optimal case for our implementation using materials that can be found in every home. Different materials with capacitive behavior were tested in order to select the most suitable one for the creation of the touch sensors that control the interaction events. Along with the above, which mainly concern the hardware implementation of the approach, a filtering method were applied in a software basis, so that the signal produced from the touch sensor is stable and reliable. In order for our work to be attributed, an indicative educational use case that deploys projection mapping for the pervasive and interactive projection of multimedia content to the users of our tangible surface was selected.
The main motivation of the present work can be summarized in the following research questions:
  • Is it feasible to construct an interacive dashboard by using everyday materials?
  • Is it possible for this interactive construction to be made multifunctional so different layers of information are projected over the dashboard?
  • Is it possible for this development to operate reliably and be robust for use in a public space?
  • Is it possible this contruction to be content agnostic so several use cases can be accommodated over the same dashboard?
The present paper is divided into five sections covering the study, design, and construction of an interactive surface, as well as of the information system for the support of our use case. The first section refers to the tangible technology and the interaction between user and computer. In the second section, we discuss related work, how other researchers approach crafting and capacitive sensing in terms of technology. In section three the architecture of the proposed implementation is presented. Subsequently, section four introduces the construction and operation of our information system and finally, in section five, the conclusions that emerged as well as suggestions for future improvement of the system are discussed.

2. Related Work

Many of the implementations in the literature that we studied were a source of inspiration and a motivation for our work. Researchers at Carnegie Mellon University in collaboration with Disney Research, Disney, Pittsburgh, presented Wall ++ [10], a wall with a capacitive feel, a large-scale project with low installation costs. As they mention, walls are everywhere and often occupy more than half the area in buildings, offices, homes, museums, hospitals, and almost any interior. Nevertheless, to this day they remain static, with the sole function of separating spaces and hiding the infrastructure of buildings. Their goal was to install a surface on walls, thus giving them multiple possibilities such as body position detection, touch, and even electromagnetic waves. The basic principle of Wall ++ was based on drawing large electrodes on a wall using conductive paint. Thus, as a first step, it was necessary to develop a reliable and economically feasible way to place large electrodes on the walls. To identify the appropriate materials and procedures, the team performed a series of tests with different conductive paints, different application methods, and a number of coats. They then researched the different electrode standards suitable for the applications they wanted and optimized them for detection range and analysis.
The Dalziel and Pow [11] studio as part of the London Retail Design Expo, in February 2015, aroused special interest having implemented an interactive surface created from conductive ink. Large sheets of plywood were used for the application as canvases. Dalziel and Pow then collaborated with the K2 printing lab to print the conductive ink on the canvases, which formed the interaction surfaces. The custom design allowed the team to have multiple points of contact and create interactions around them. Starting with the content, the team compiled a list of stories and possible interactions based on “The Future of Retail.” Having the stories, they laid the foundation of the screen and were used to depict a series of 48 cartoons, the number of which then rose to 250. After printing the canvases with the base layer of conductive ink, the team applied a layer of non-conductive white ink on top so they could project the animations there. The conductive ink was then connected to a capacitive touch board called Ototo, designed specifically to convert touch to sound. With the installation of Ototo, the plywood walls became a living circuit of entrances, which would cause various sounds and visual elements with each contact. To project the various animations on each canvas, multiple projectors were used, which were mounted on the ceiling and were controlled through an existing Projection Mapping software.
An earlier implementation of Dalziel and Pow’s, which inspired the above installation, was the new Zippy [12] children’s store in Setúbal, Portugal. They designed two interactive installations and built both inside D&P for testing, before heading to Portugal to present and install the project. ’Sound Poster’ is a panel with printable characters made of conductive ink and is used to make sounds. ’Fun Receipt’ is a children’s receipt, which you print from a giant mouth on the store’s counter and includes characters for painting, mazes, and other toys.
Sam Jacoby and Leah Buenchley looked at conductive ink as a means of expressing storytelling and interaction design with children and presented StoryClip [13], a toolbox that incorporates functional everyday materials, calculations, and drawings. It consists of conductive ink, ordinary painting inks, and a hardware-software tool, allowing a child’s drawing to function as an interface for recording and playing audio. Taking advantage of the artistic nature of children to motivate them in technological exploration, turning a conventional display into a multimedia interface that promotes multilevel interaction with children.
The Living Wall [14] project explores the construction and implementation of interactive wallpaper. Using conductive, durable, and magnetic colors, they created a wallpaper that allows the creation of dynamic, remodelable, and programmable spaces. The wallpaper consists of circuits that are painted on a sheet of paper and a set of electrodes are attached to it with the help of magnets. Wallpaper can be used for a variety of functional and stunning applications that can include lighting, environment detection, device control, and environmental information display. Additionally, they contain a set of detachable electronic modules for processing, detection, and wireless communication.
Jie Qi and Leah Buechley developed an interactive pop-up book called Electronic Popables [15] to explore paper-based computing. Their book incorporates traditional emerging mechanisms with thin, flexible paper-based electronics and the result looks and works such as a regular emerging book except that interaction elements have been added. They first made individual pop-up interactive cards and then assembled them into a book. They used three basic materials, self-adhesive copper tape, conductive fabric, and conductive paint, to create the circuits on the paper.
Researchers from the MIT Media Lab presented the implementation of Sticking Together [16]. They built sticky sensors and actuators that children can use to create handmade personalized remote communication interfaces. By attaching I/O stickers to special wireless cards, children can invent ways to communicate with their loved ones over long distances. A special interactive way of communication for children while learning new technologies in a fun and creative way.
Pen-on-Paper Flexible Electronics [17] offers a unique approach to making flexible devices using a configuration instrument that is as ubiquitous and portable as paper. Rollerball pens are commercially available and are specially designed for precision writing on paper. Using a rollerball pen filled with conductive silver ink, it is possible to write and draw conductive text, diode interfaces, electronic circuits, LED arrays, and 3D antennas on paper.

3. Materials and Methods

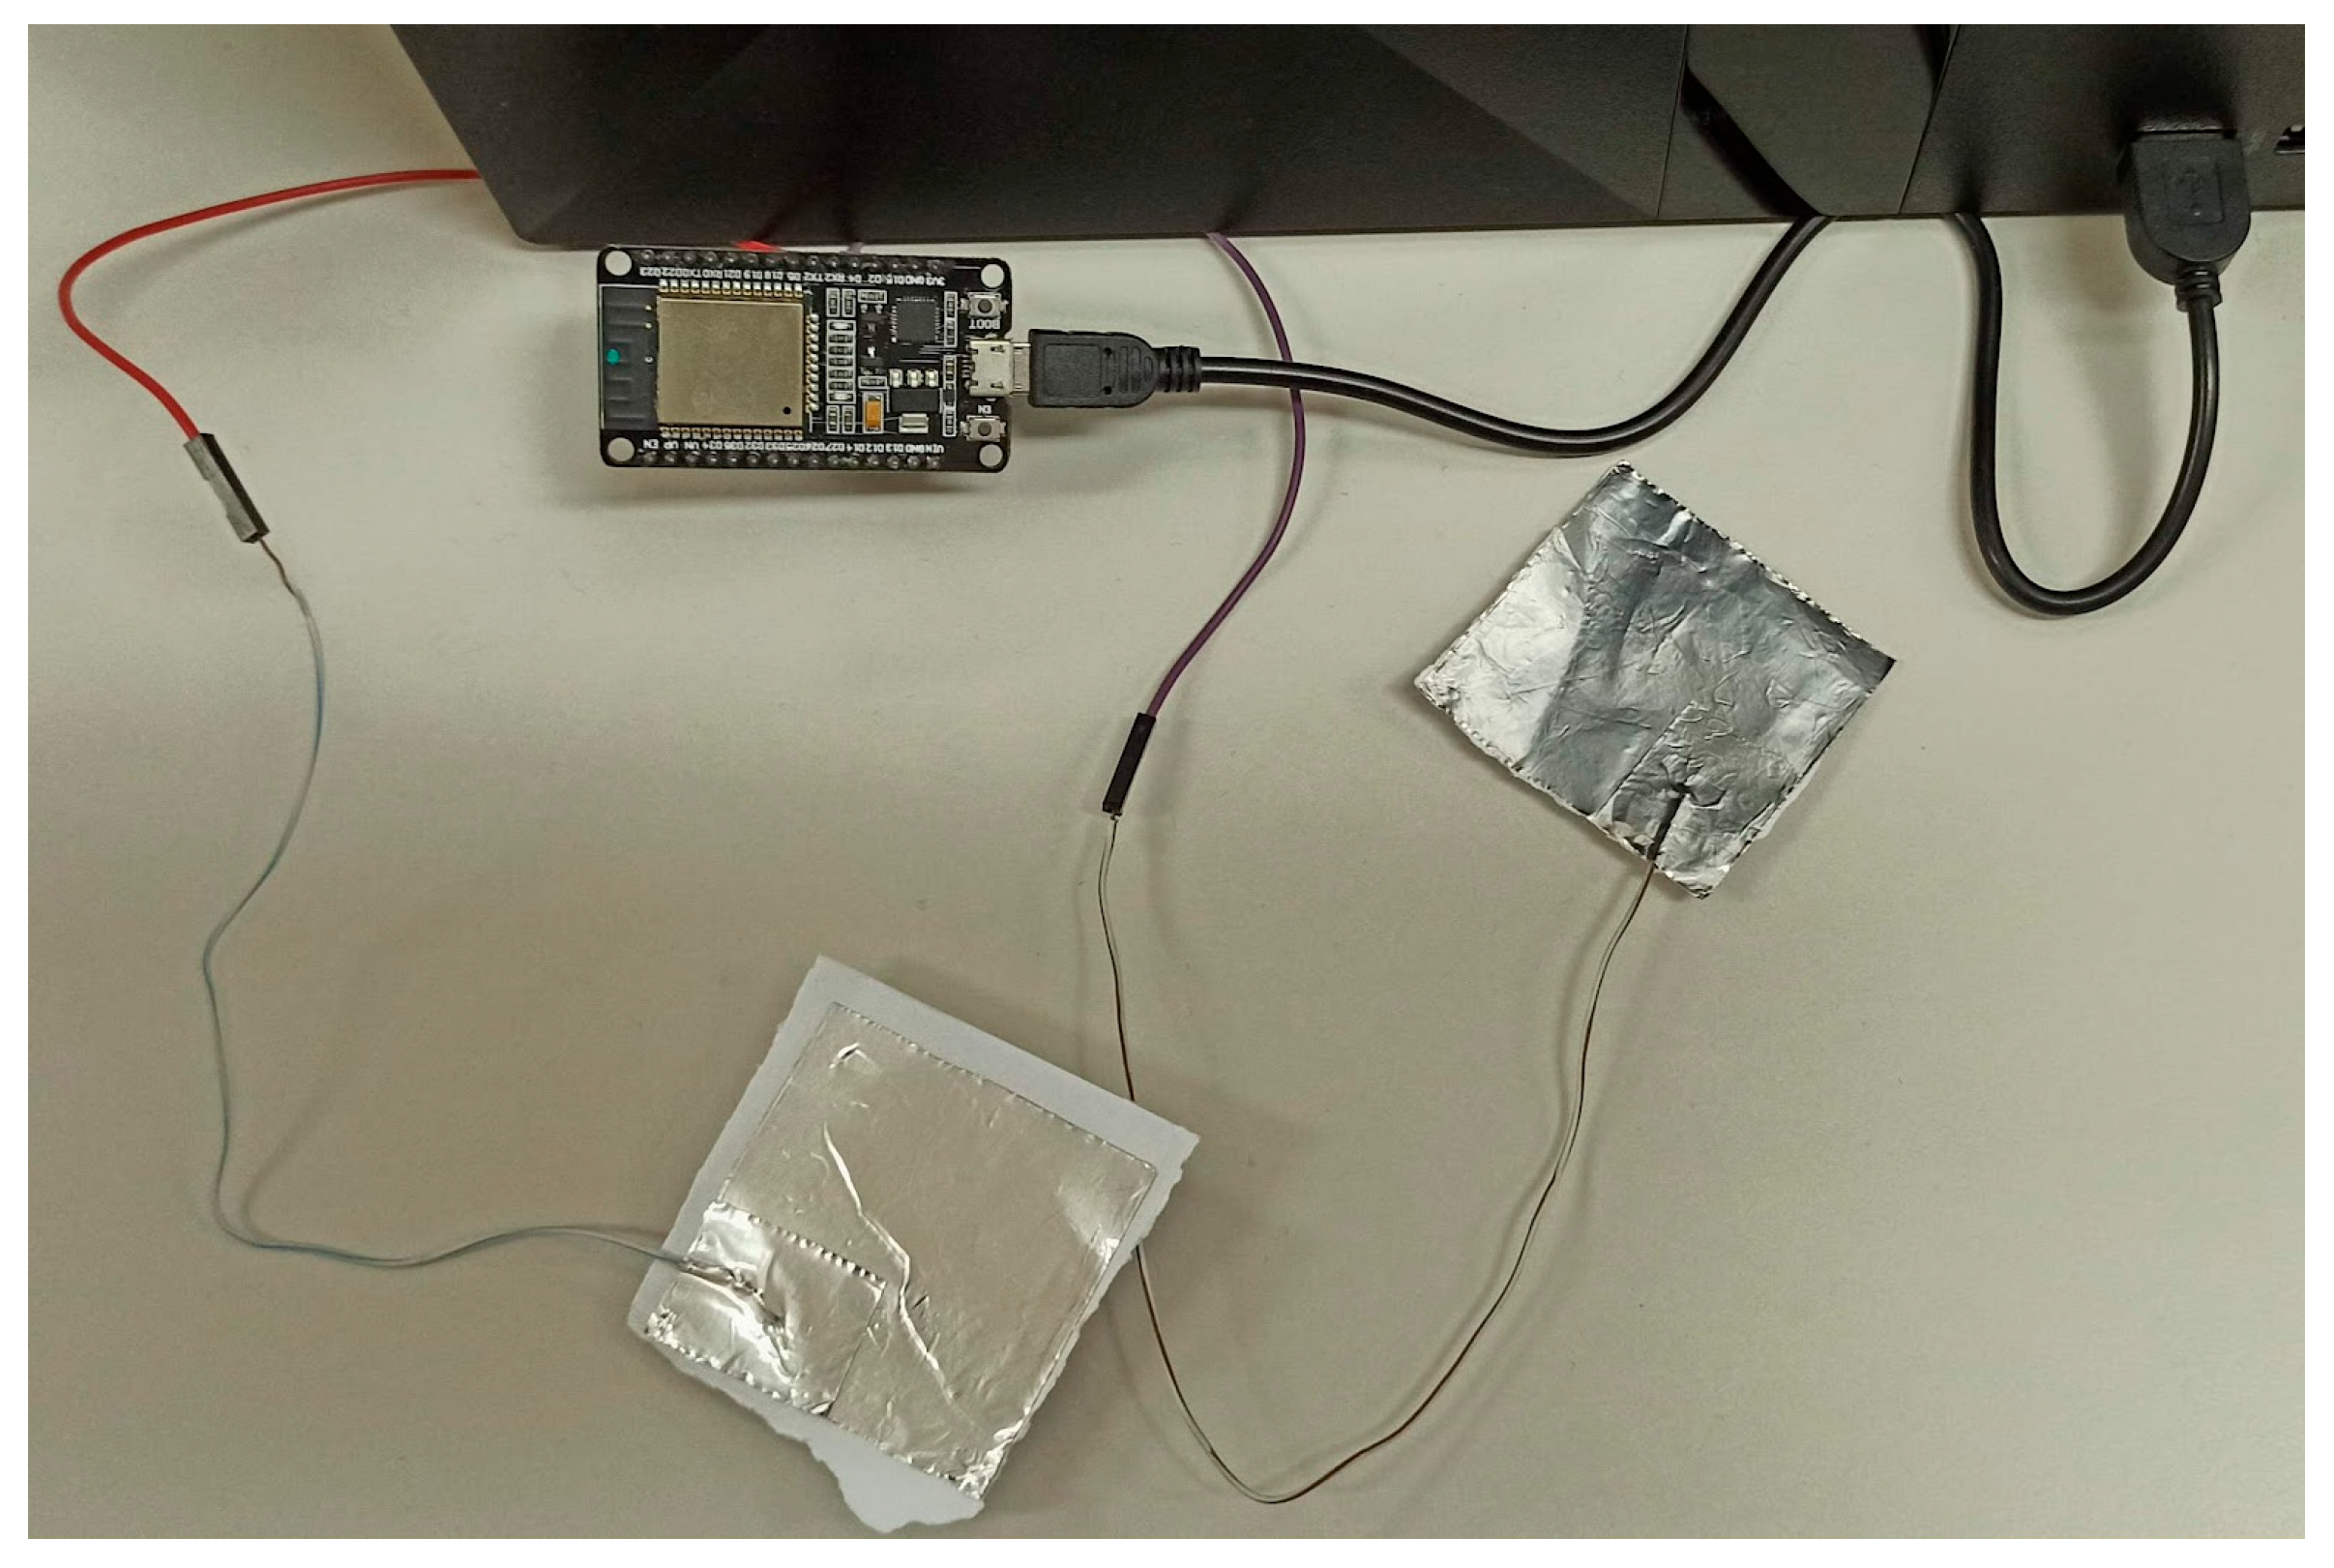
3.1. Low-Cost DIY Capacitive Sensors

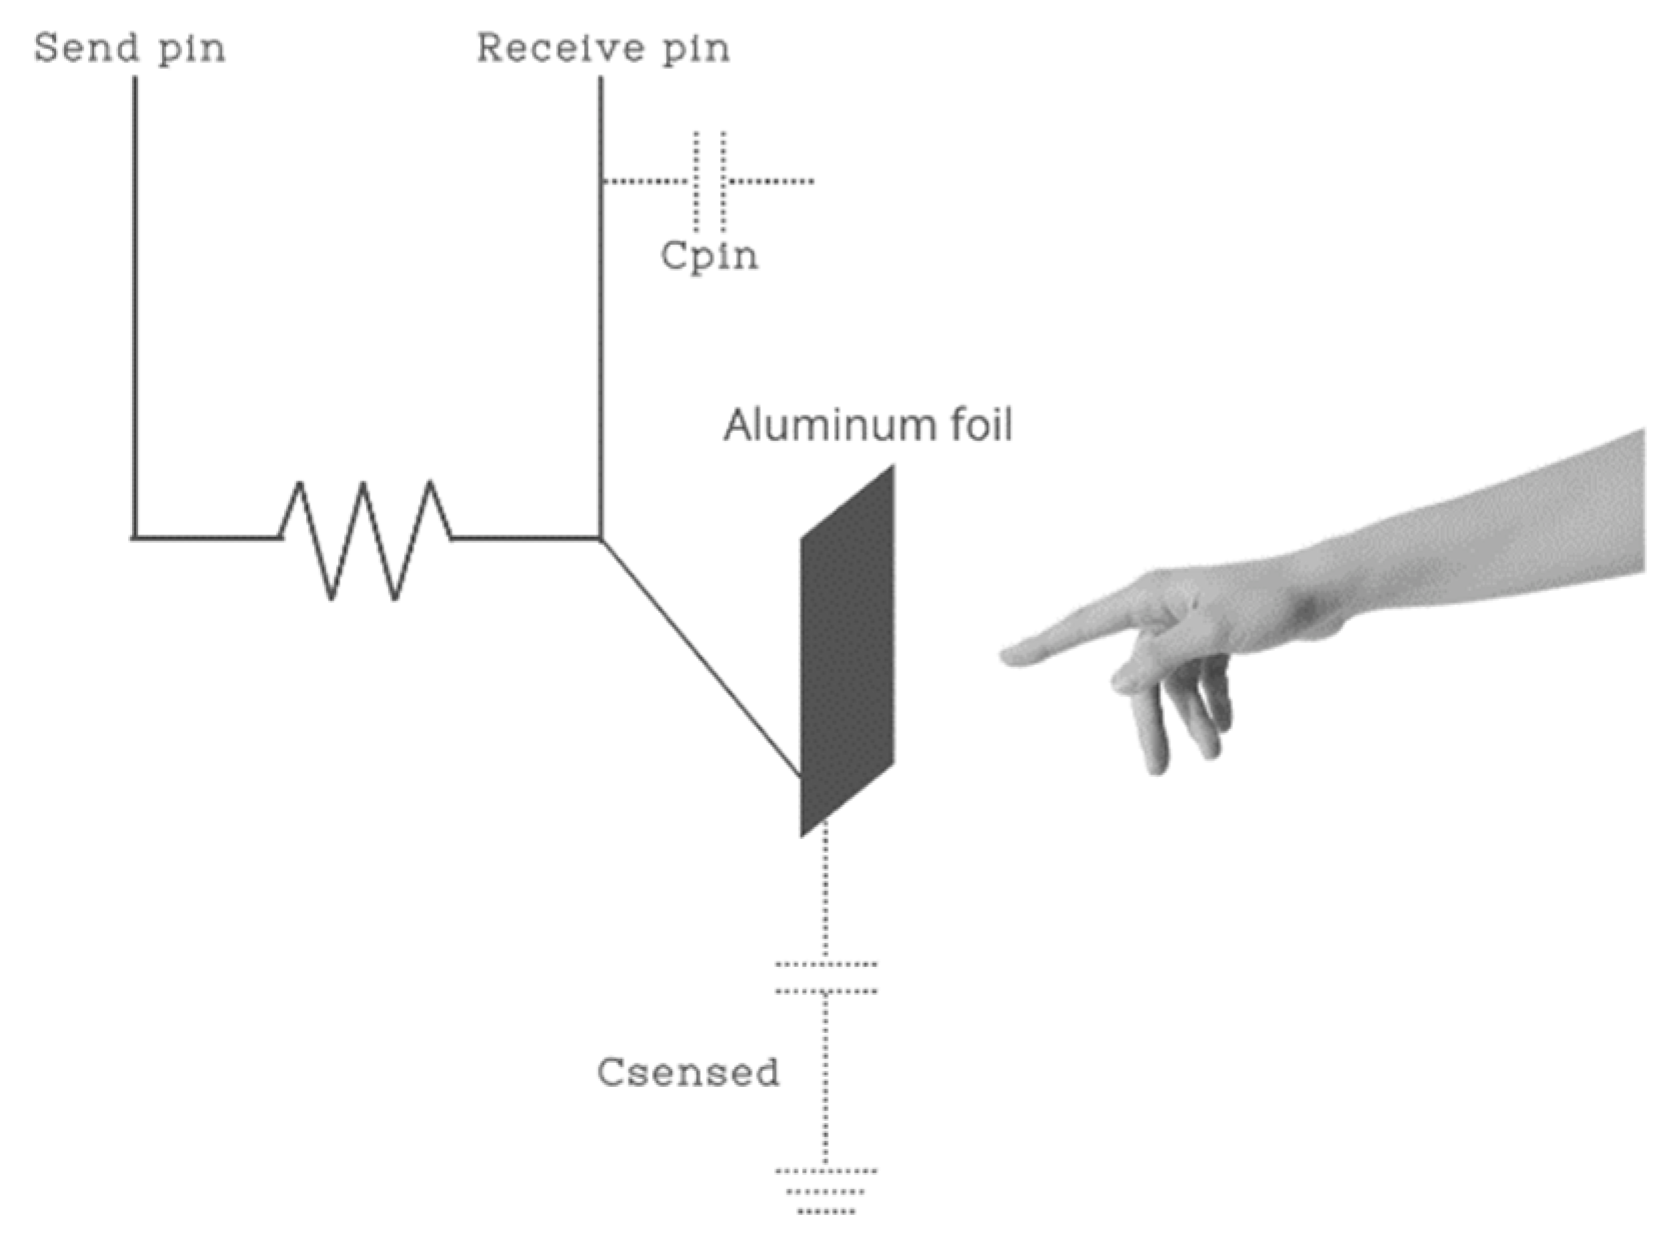
3.1.1. Introduction to Capacitive Sensing

In electrical engineering, capacitive sensing is a technology based on the capacitive coupling that can detect and measure anything that is conductive or has a dielectric different from that of air, such as the human body or hand. This is achieved by the effect of each object on the electric field created around the active face of a capacitive sensor. A capacitive sensor works like an open capacitor. An electric field is formed between the measuring electrode and the ground electrode. If a material with a dielectric constant greater than air enters the electric field, the field capacitance increases according to the dielectric constant of that material. The electrodes measure the increase in capacitance and generate an output signal that corresponds to the trigger. Figure 1 illustrates the operating principle behind capacitive sensing. Such metering is based on the RC circuits’ time constant. The time constant of an RC circuit is defined as the time required for the capacitor’s voltage to reach 63.2% of its maximum value when the capacitor is fully charged [18,19].

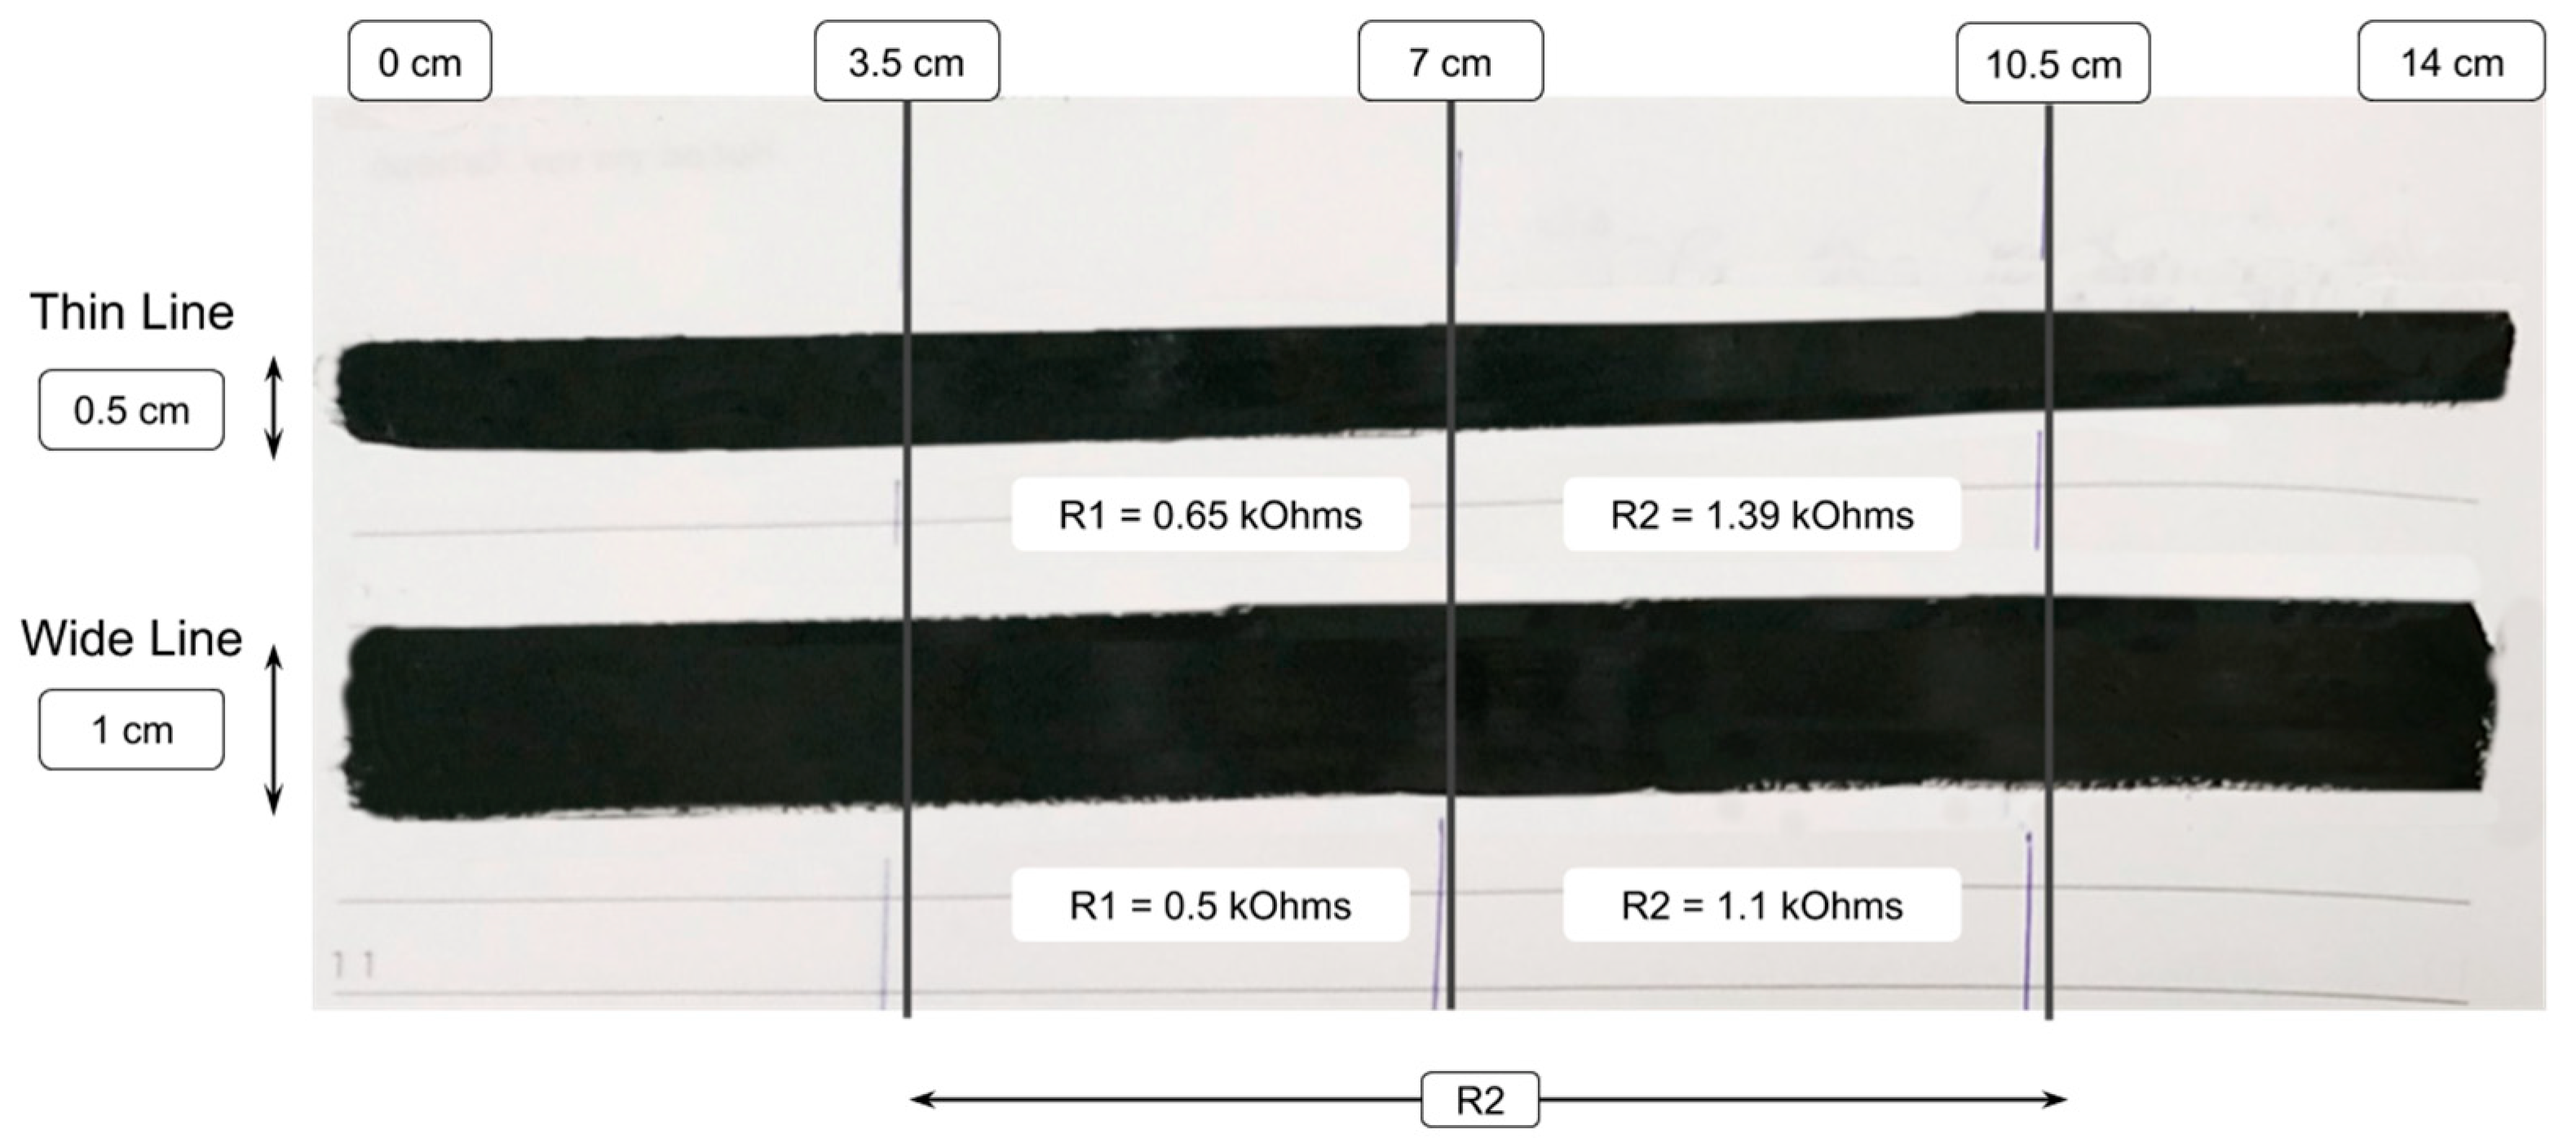
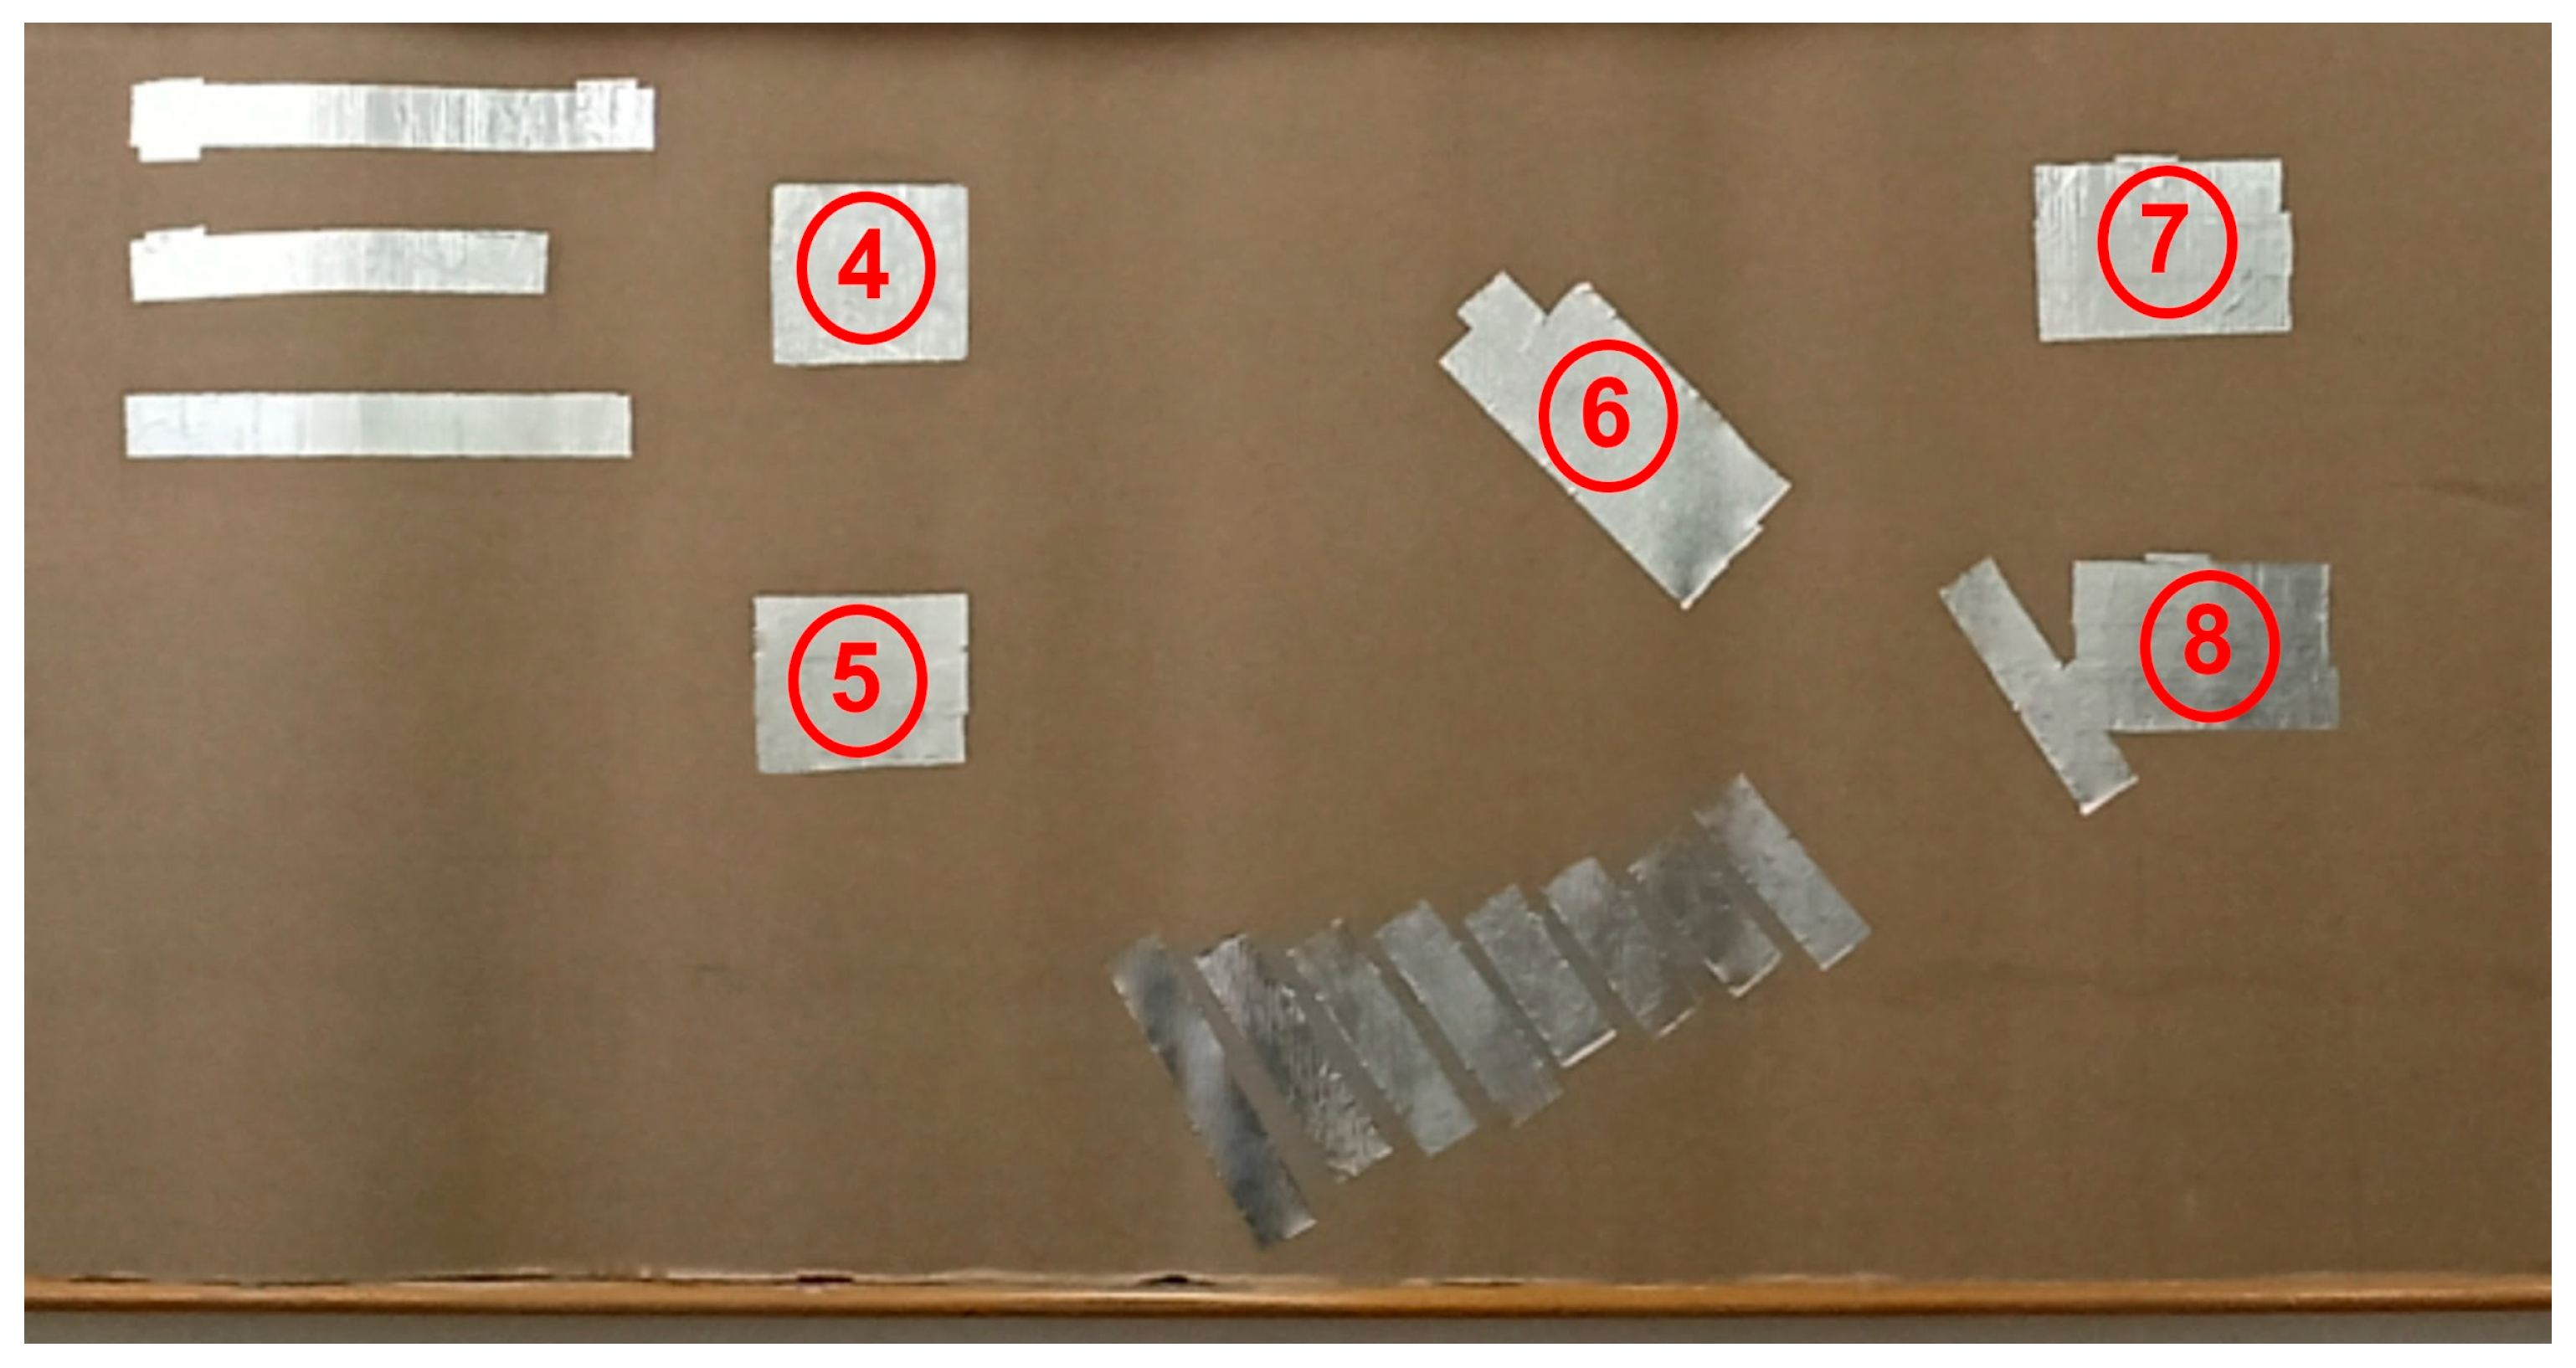
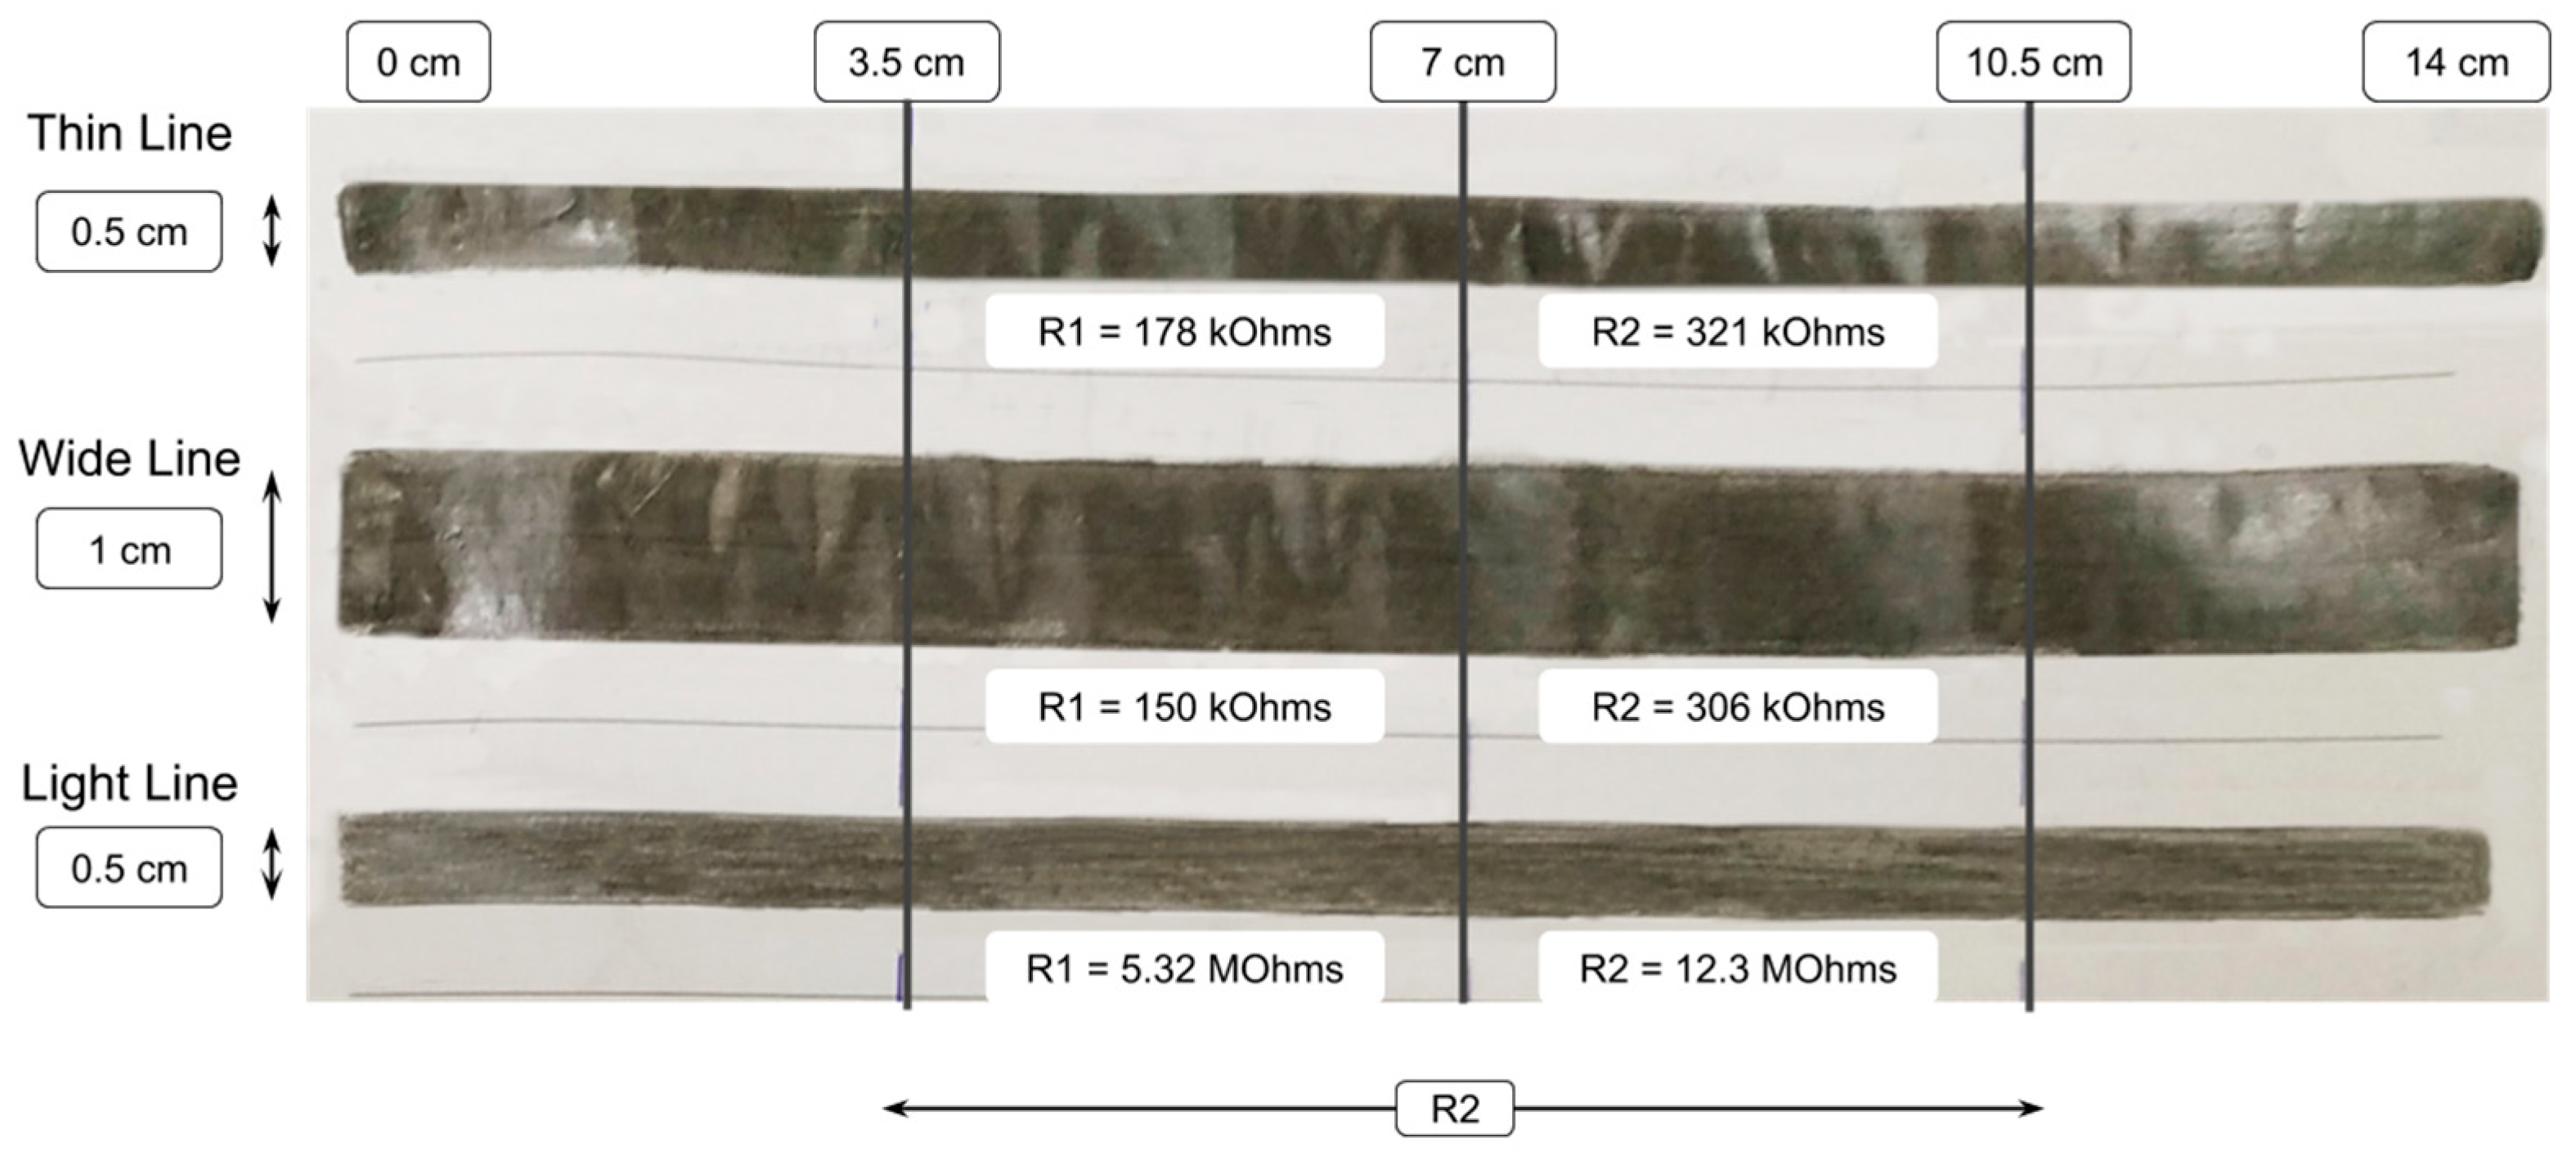
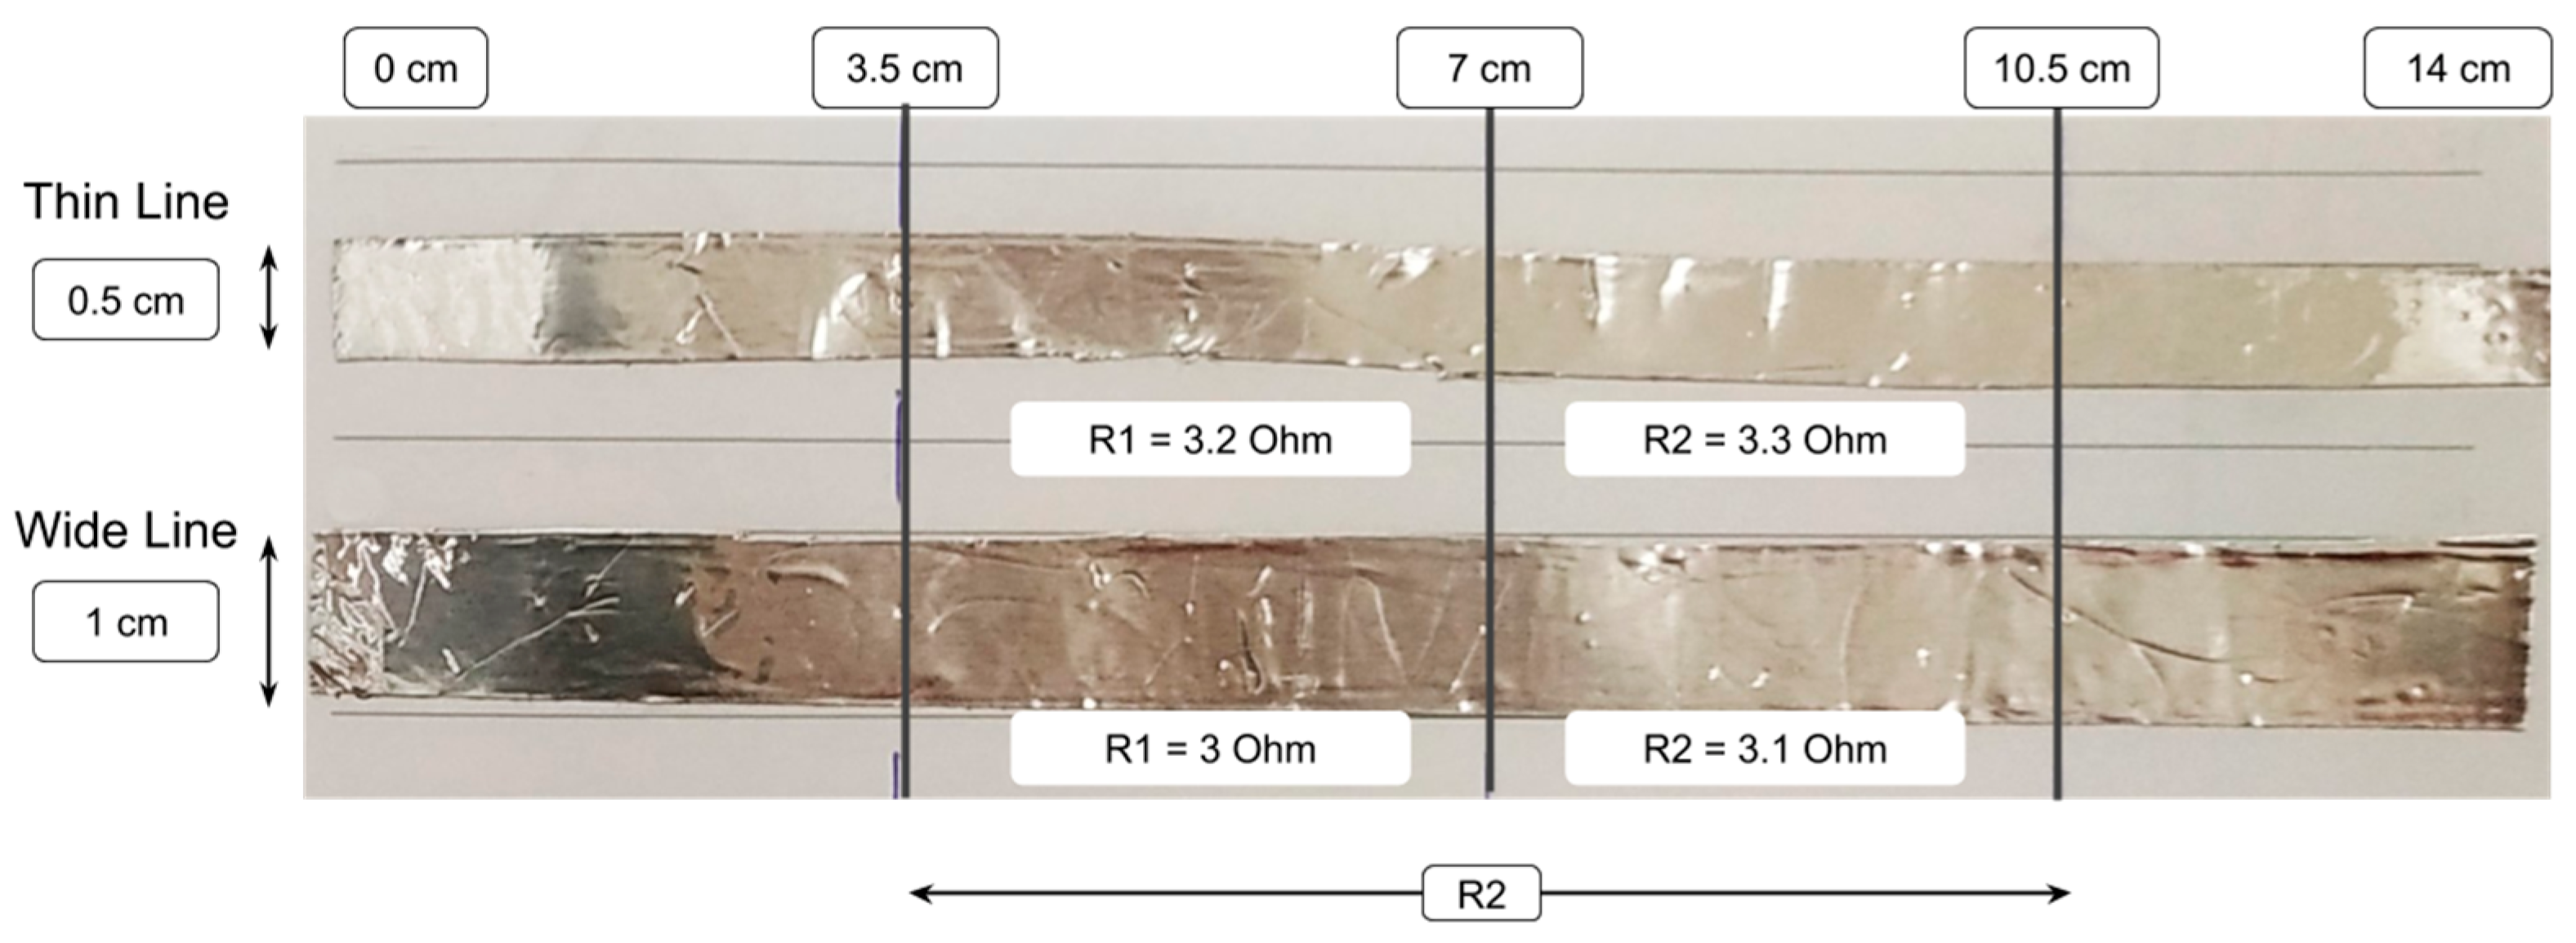
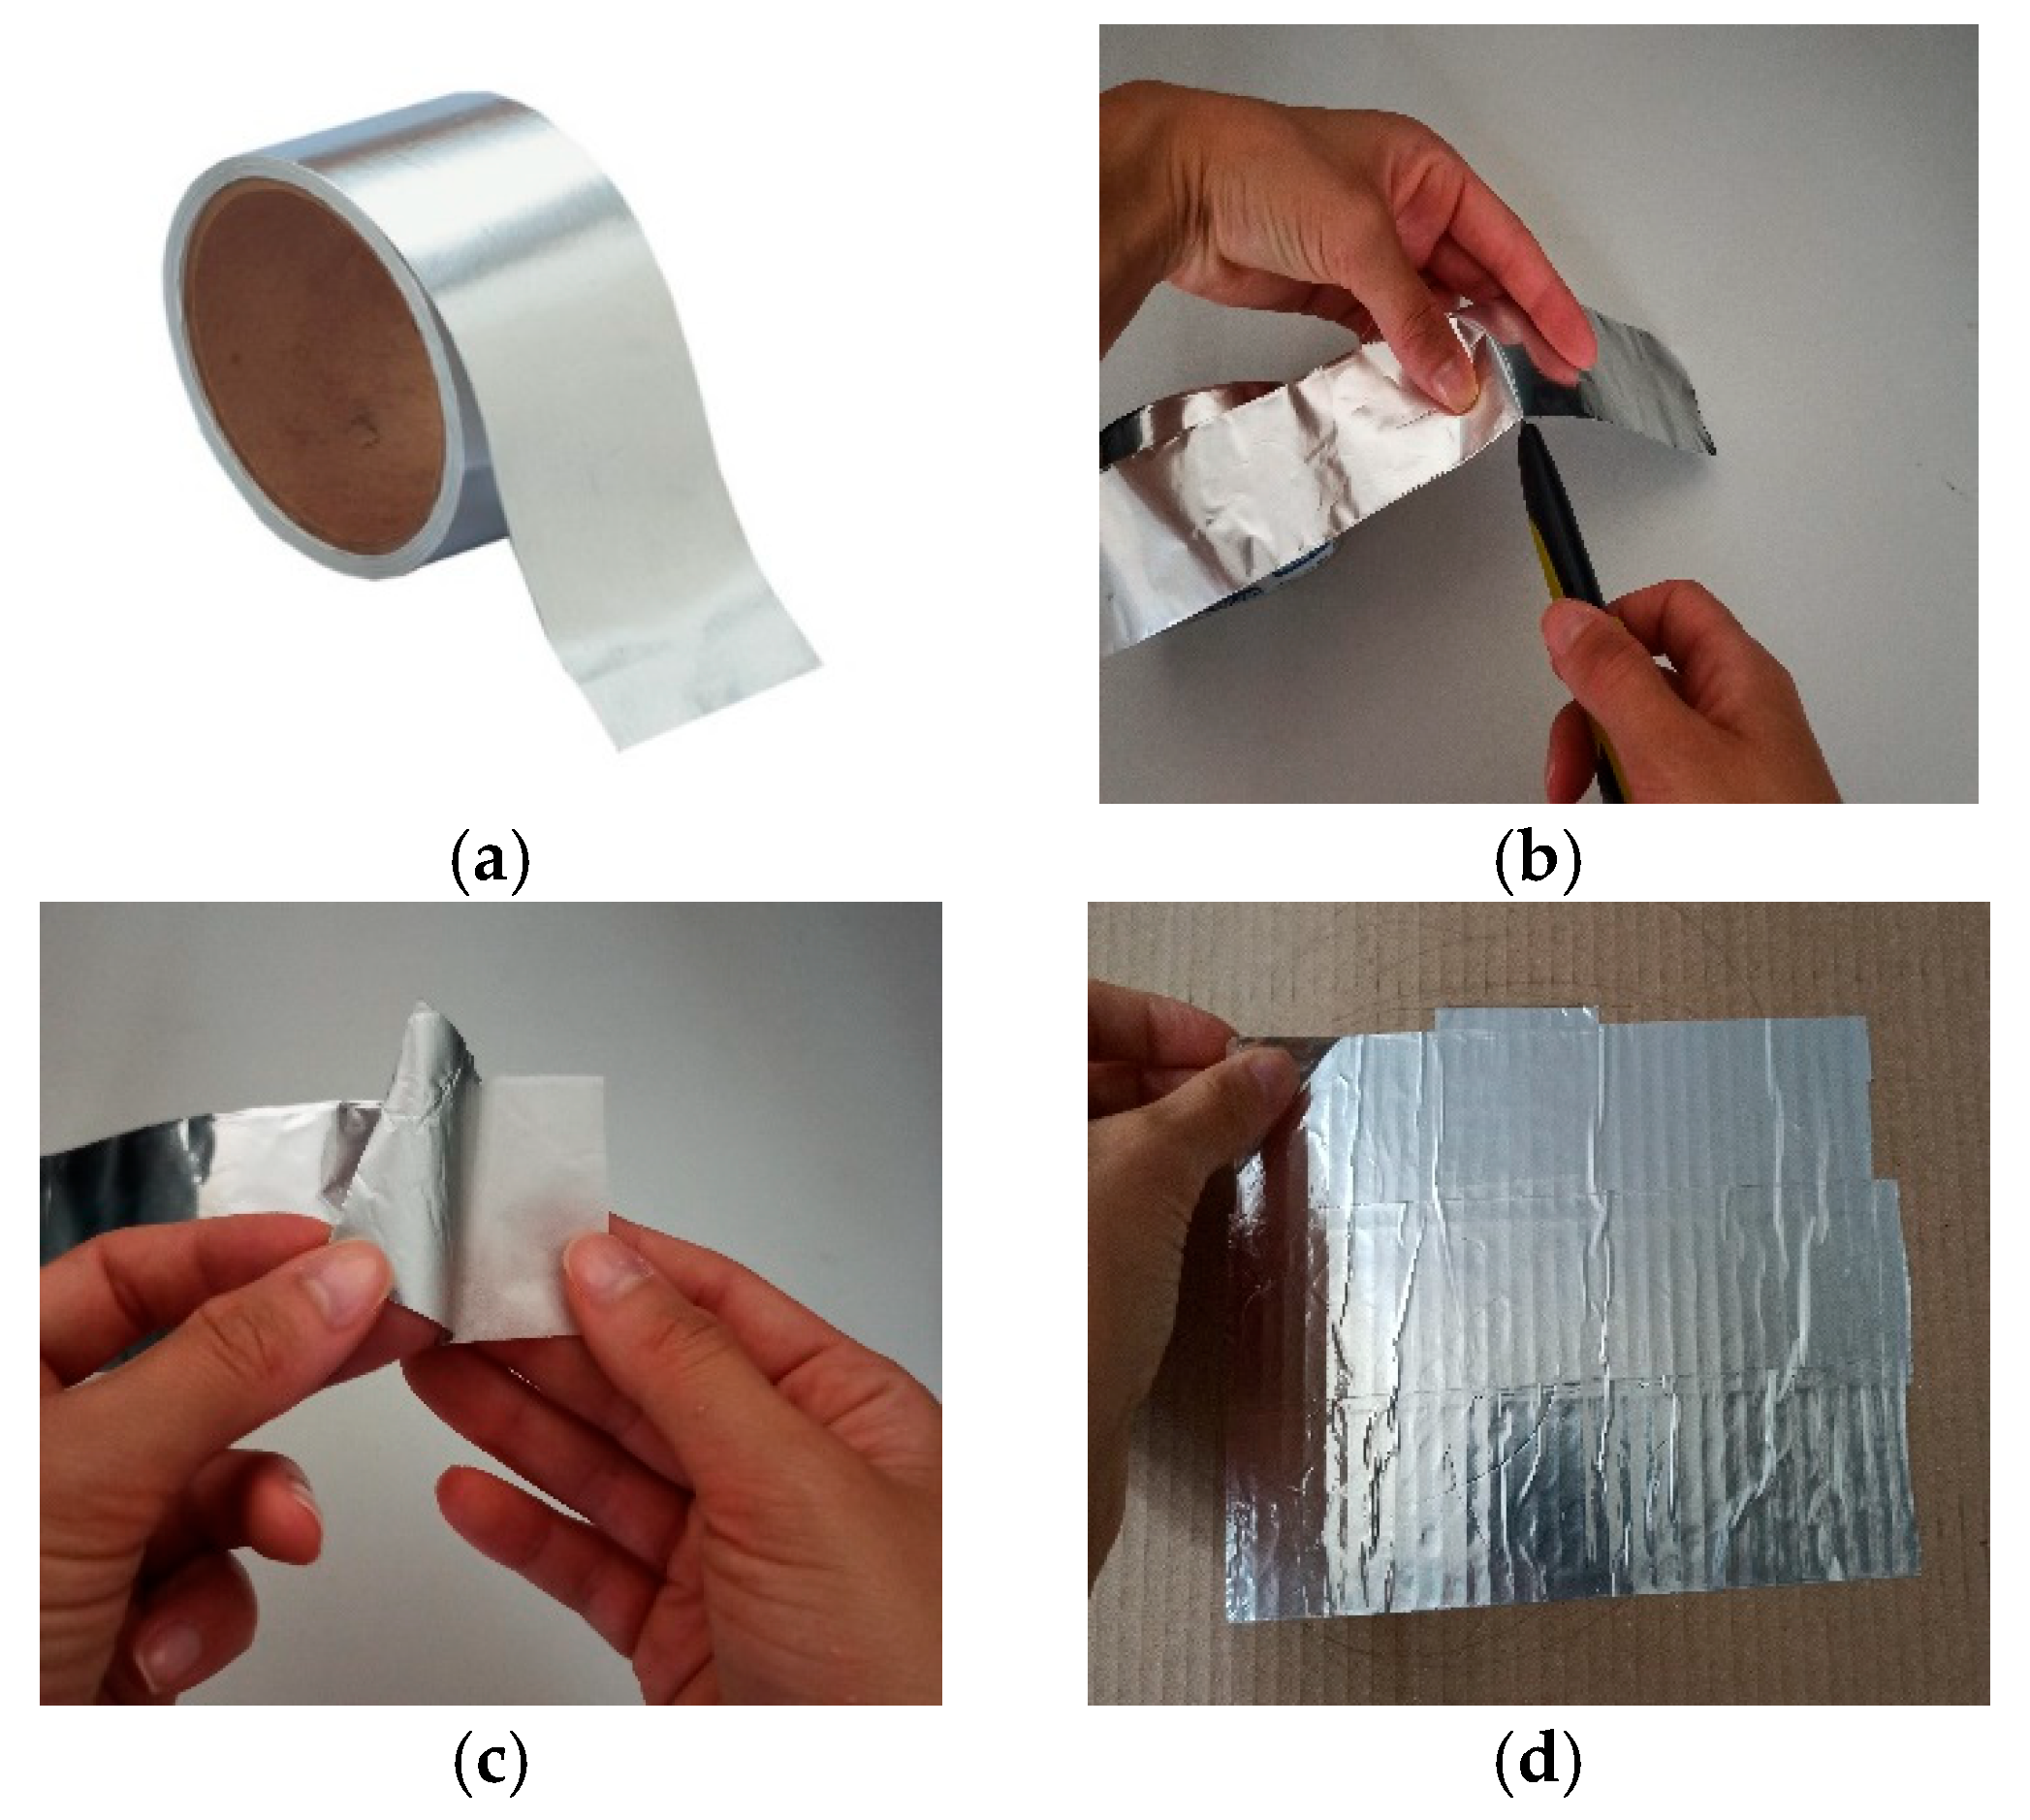
3.1.2. Selection of Conductive Materials

To carry out the present work, three conductive materials, easily accessible and economically affordable, were evaluated. These are: conductive paint, self-adhesive aluminum tape, and pencil graphite. In order to highlight the material with the best properties, some experiments were performed. The experiments were conducted over a piece of paper on top of which the materials under test were applied. Each material was placed on the paper with two different widths, 0.5 cm and 1 cm. The aim was to find the material with the lowest ohmic sheet resistance, making it the best conductor. Measurements were made for each material to find the ohmic resistance using a multimeter. In the first test, the terminals of the multimeter were 3.5 cm apart, while in the second they were twice as far, in 7 cm. Starting with the graphite (Figure 2), the ohmic sheet resistance of the Thin Line (0.5 cm), consisting of a set of two hundred pencil strokes, was first measured. The result was quite high as in the first distance (3.5 cm) the ohmic resistance was measured at 178 kOhms, while at twice the distance (7 cm) the result was 321 kOhms. In the Wide Line (1 cm), sheet ohmic resistances of 150 kOhms and 306 kOhms were obtained for the short and the long distance correspondingly. Finally, in the third and last line, the strokes were less, and the resistance measured was 5.32 MOhms (3.5 cm) and 12.3 MOhms (7 cm).
A noticeable difference was observed during the ohmic sheet resistance measurement of the aluminum tape’s strips (Figure 3), in which the result for the Thin Line (0.5 cm) was 3.2 Ohms (3.5 cm) and 3.3 Ohms (7 cm), respectively. In the Wide Line (1 cm), the measurements did not show large variations from those of the Thin Line and as a result, we obtained 3 Ohms and 3.1 Ohms (7 cm), respectively. As a result, we can notice that the amount of material in the given case has minimal effect on the change of its conductivity.
To measure the sheet ohmic resistance of conductive paint (Figure 4), two coats of paint were applied. The measurement results correspond to 0.65 kOhms (3.5 cm) and 1.39 kOhms (7 cm) for the Thin Line. For the Wide Line, 0.5 kOhms (3.5 cm) and 1.1 KOhms (7 cm) were measured respectively.
Examining the above measurements, we can notice that our results confirm what is known theoretically: (a) The longer a material, the larger its resistance, and hence lower its conductivity. (b) The wider a material, the lower its resistance, and hence higher its conductivity. After the successful completion of the experiments for the materials, it was obvious that the aluminum tape had the lowest sheet ohmic resistance and consequently the best conductivity (Table 1). Therefore, the aluminum tape was selected for the construction of the DIY capacitive sensors in this work.

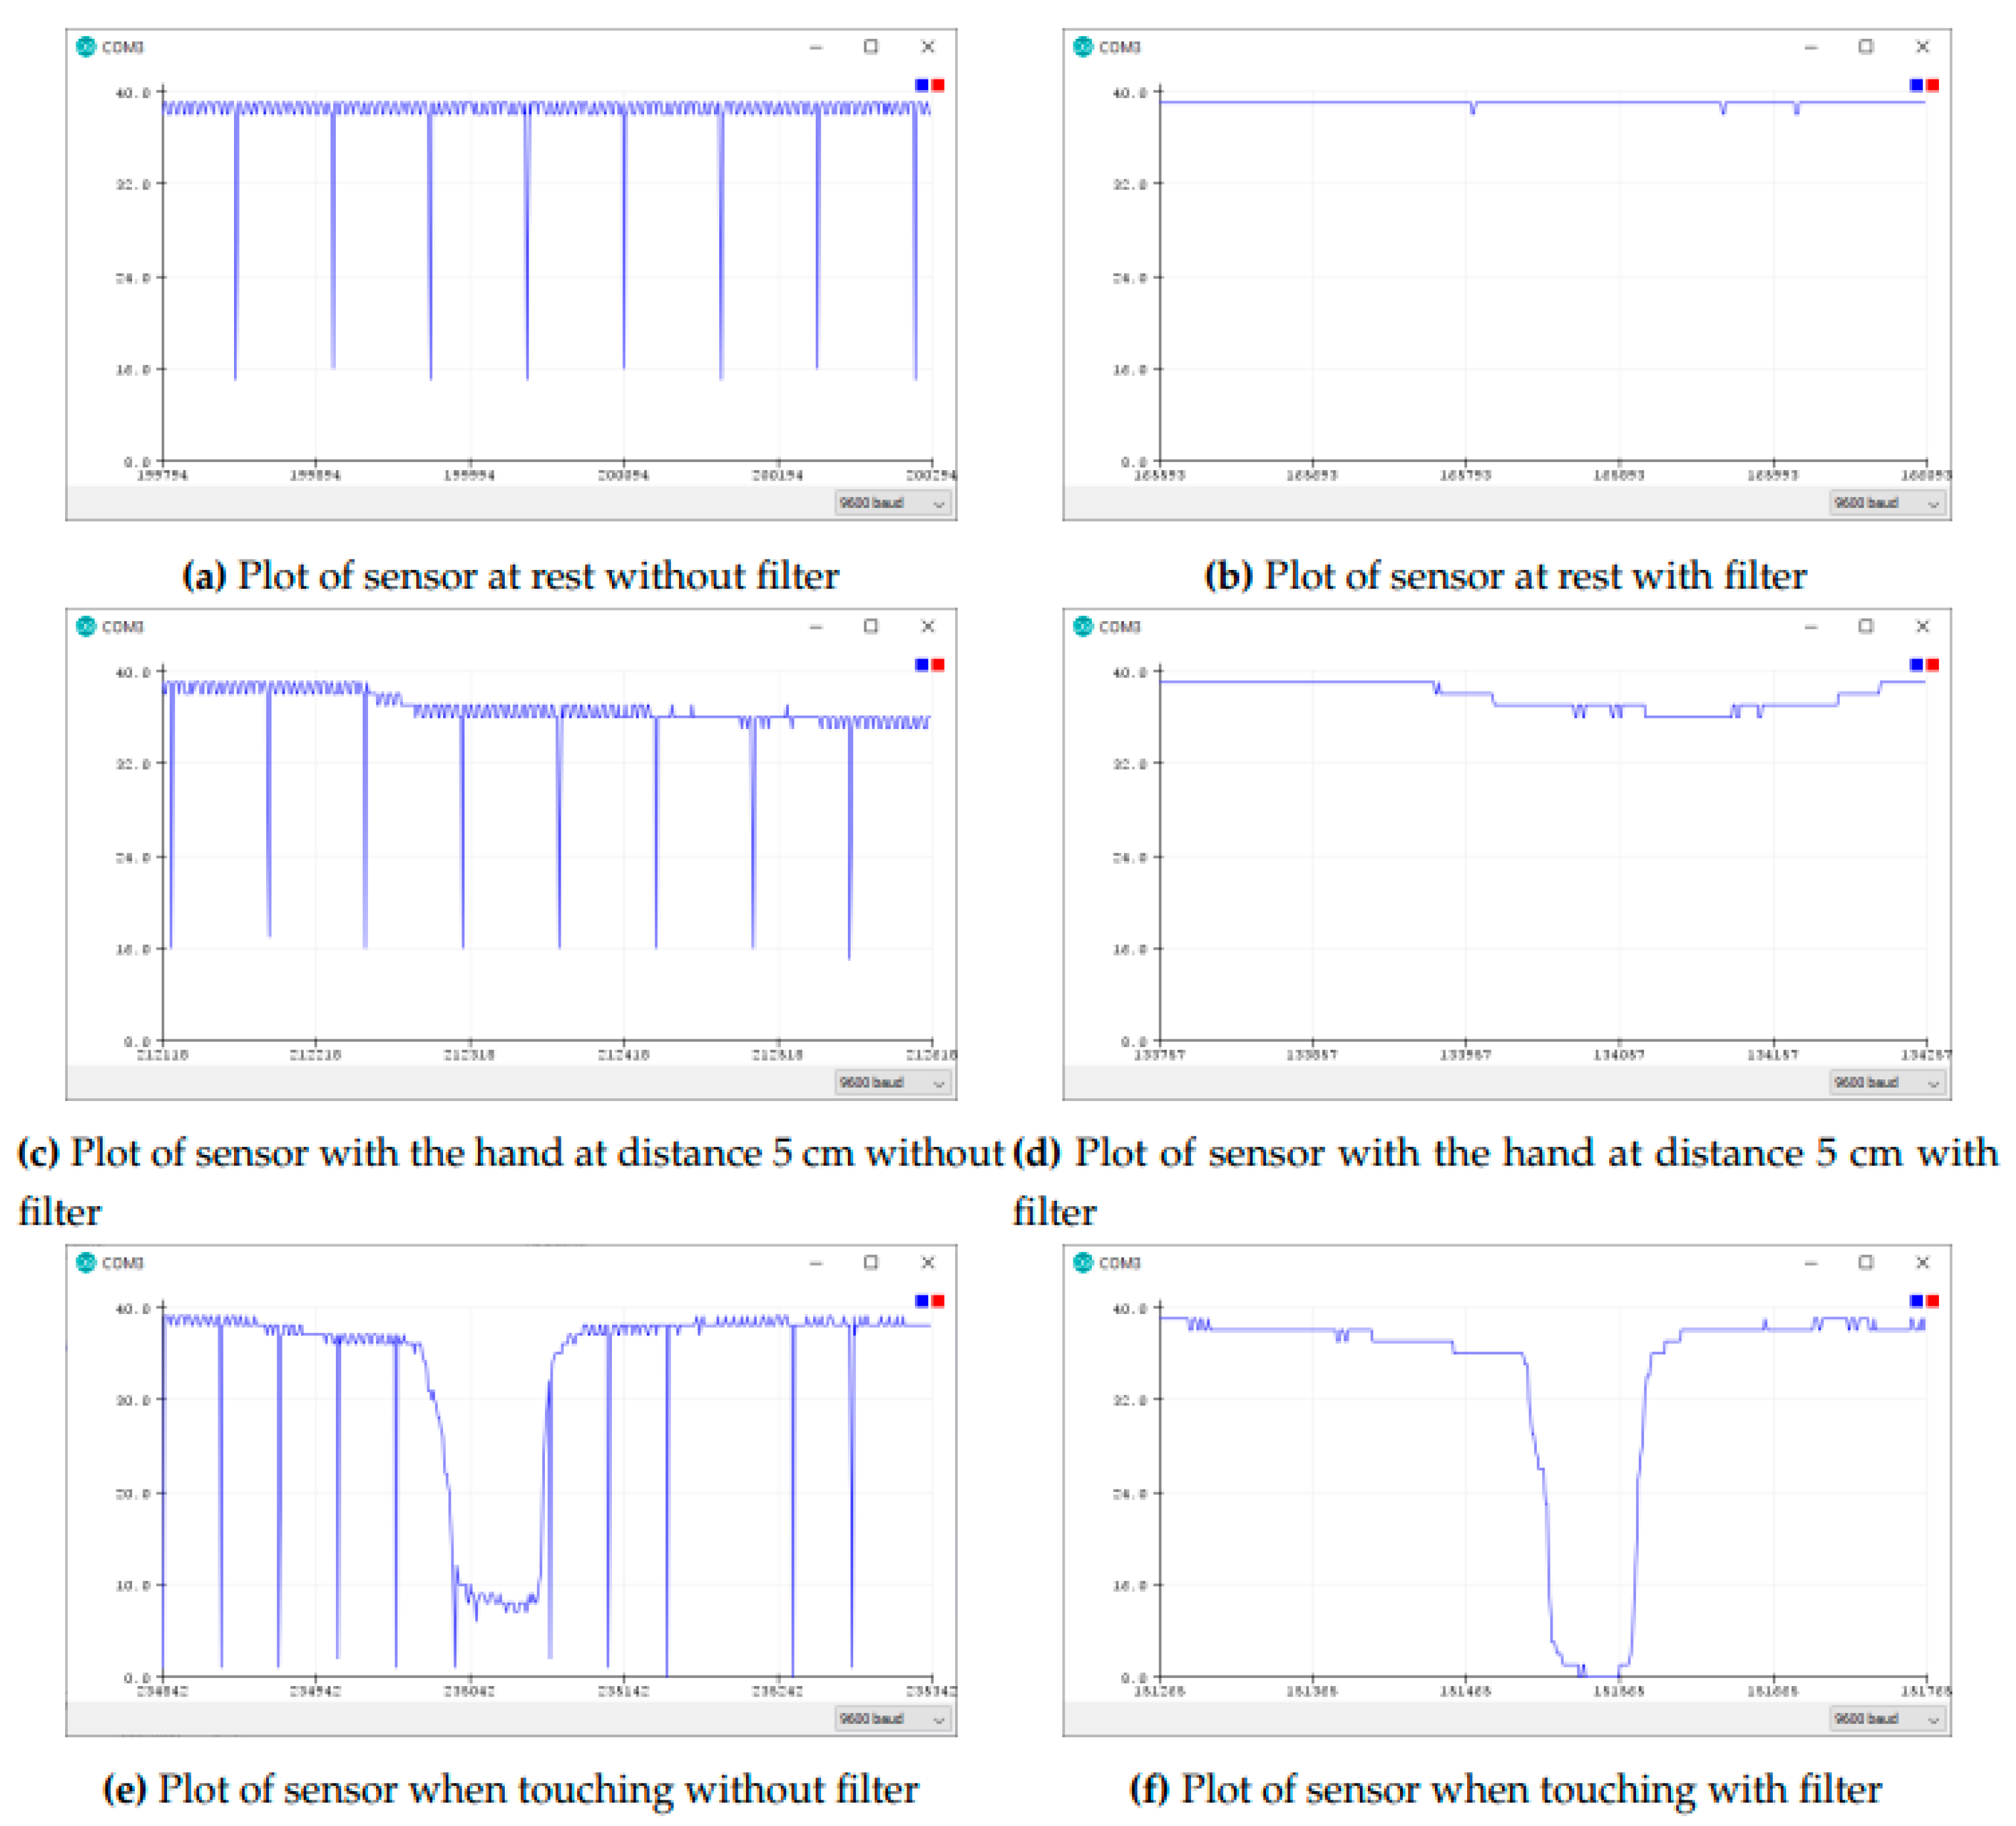
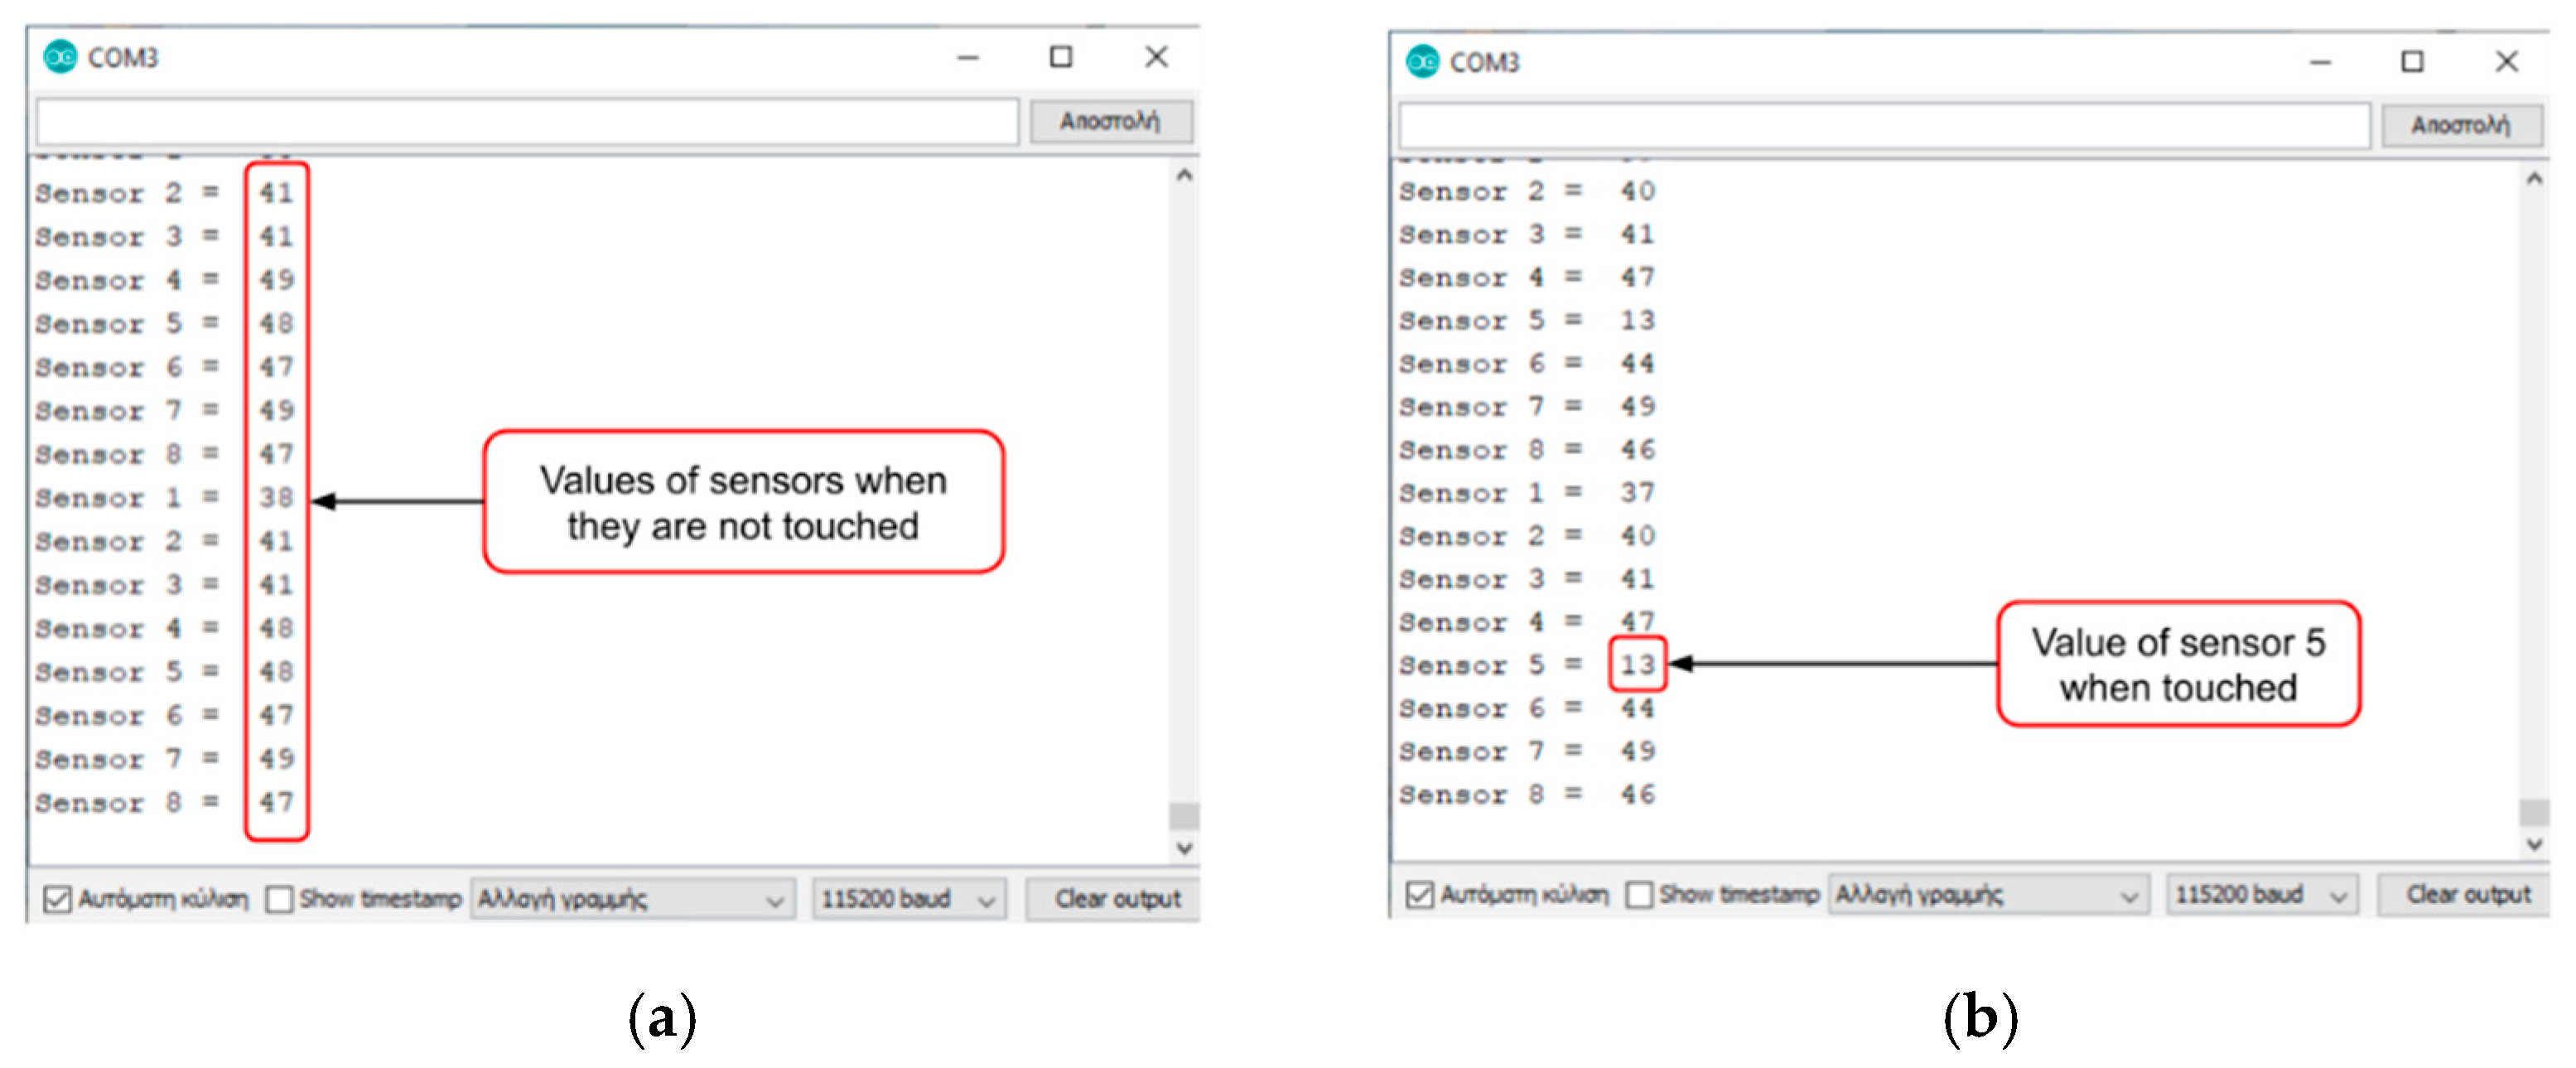
3.1.3. Calibration of the Sensors

Figure 5 illustrates the connection of our DIY capacitive sensors with the touch pins of an Espressif ESP32 development board [20]. The integrated touch pins of the EPS32 microcontroller were found to be a great advantage as it was not necessary to use two different pins as shown in Figure 1 in order to create an equivalent RC circuit for reading the capacitance change, nor a capacitive sensing library. This process (e.g., reading) is automatically completed inside the ESP32′s firmware thus the touch pins are easily and reliably processed just using the touchRead() function, as is depicted in the following quote from our code. This also saves pins on the microcontroller for future use.
// reading input values
touch_sensor_value = touchRead(touch_pin);
// process value with Median Filter Library
test.in(touch_sensor_value);
touch_sensor_value = test.out();
Quote 1. Reading the Capacitive Sensors
As it is depicted in Quote 1, the Median Filter Library [21] is used as a means for smoothing sensor readings and outliers’ cancellation. In Figure 6a,c,e the noise that occurs during the continuous reading of the sensor is noticeable counter to Figure 6b,d,f, that show the application of the Median Filter over the input signals. The values read by the touch pins are displayed on the vertical axis and the time is displayed on the horizontal axis. To achieve the best possible filtering, sample windows of different sizes were tested (10, 20, 30 number of samples). Regarding the smallest sample window (10 samples), a faster response of all three was observed but with a slight instability. Then, for the sample window of 20 samples, it was observed that its responsiveness was slightly slower but with improved stability and finally, for the value window of 30 samples the responsiveness was slower but with better stability in random disturbances compared to the other three. Taking into consideration that the application domains of our sensors require relatively fast response from the sensors, we concluded that the best choice for our case was a value window of 20 samples. Hence, this is the size of the Median filter window used hereafter. Figure 6 illustrates the behavior of the proposed capacitive sensor without filtering and when applying filtering with the Median filter window of 20 samples. It is obvious that the behavior of the sensor after such filtering is quite stable, and the readings acquired very reliable.

3.2. Development of the Interactive Dashboard with Capabilities for Projection Mapping

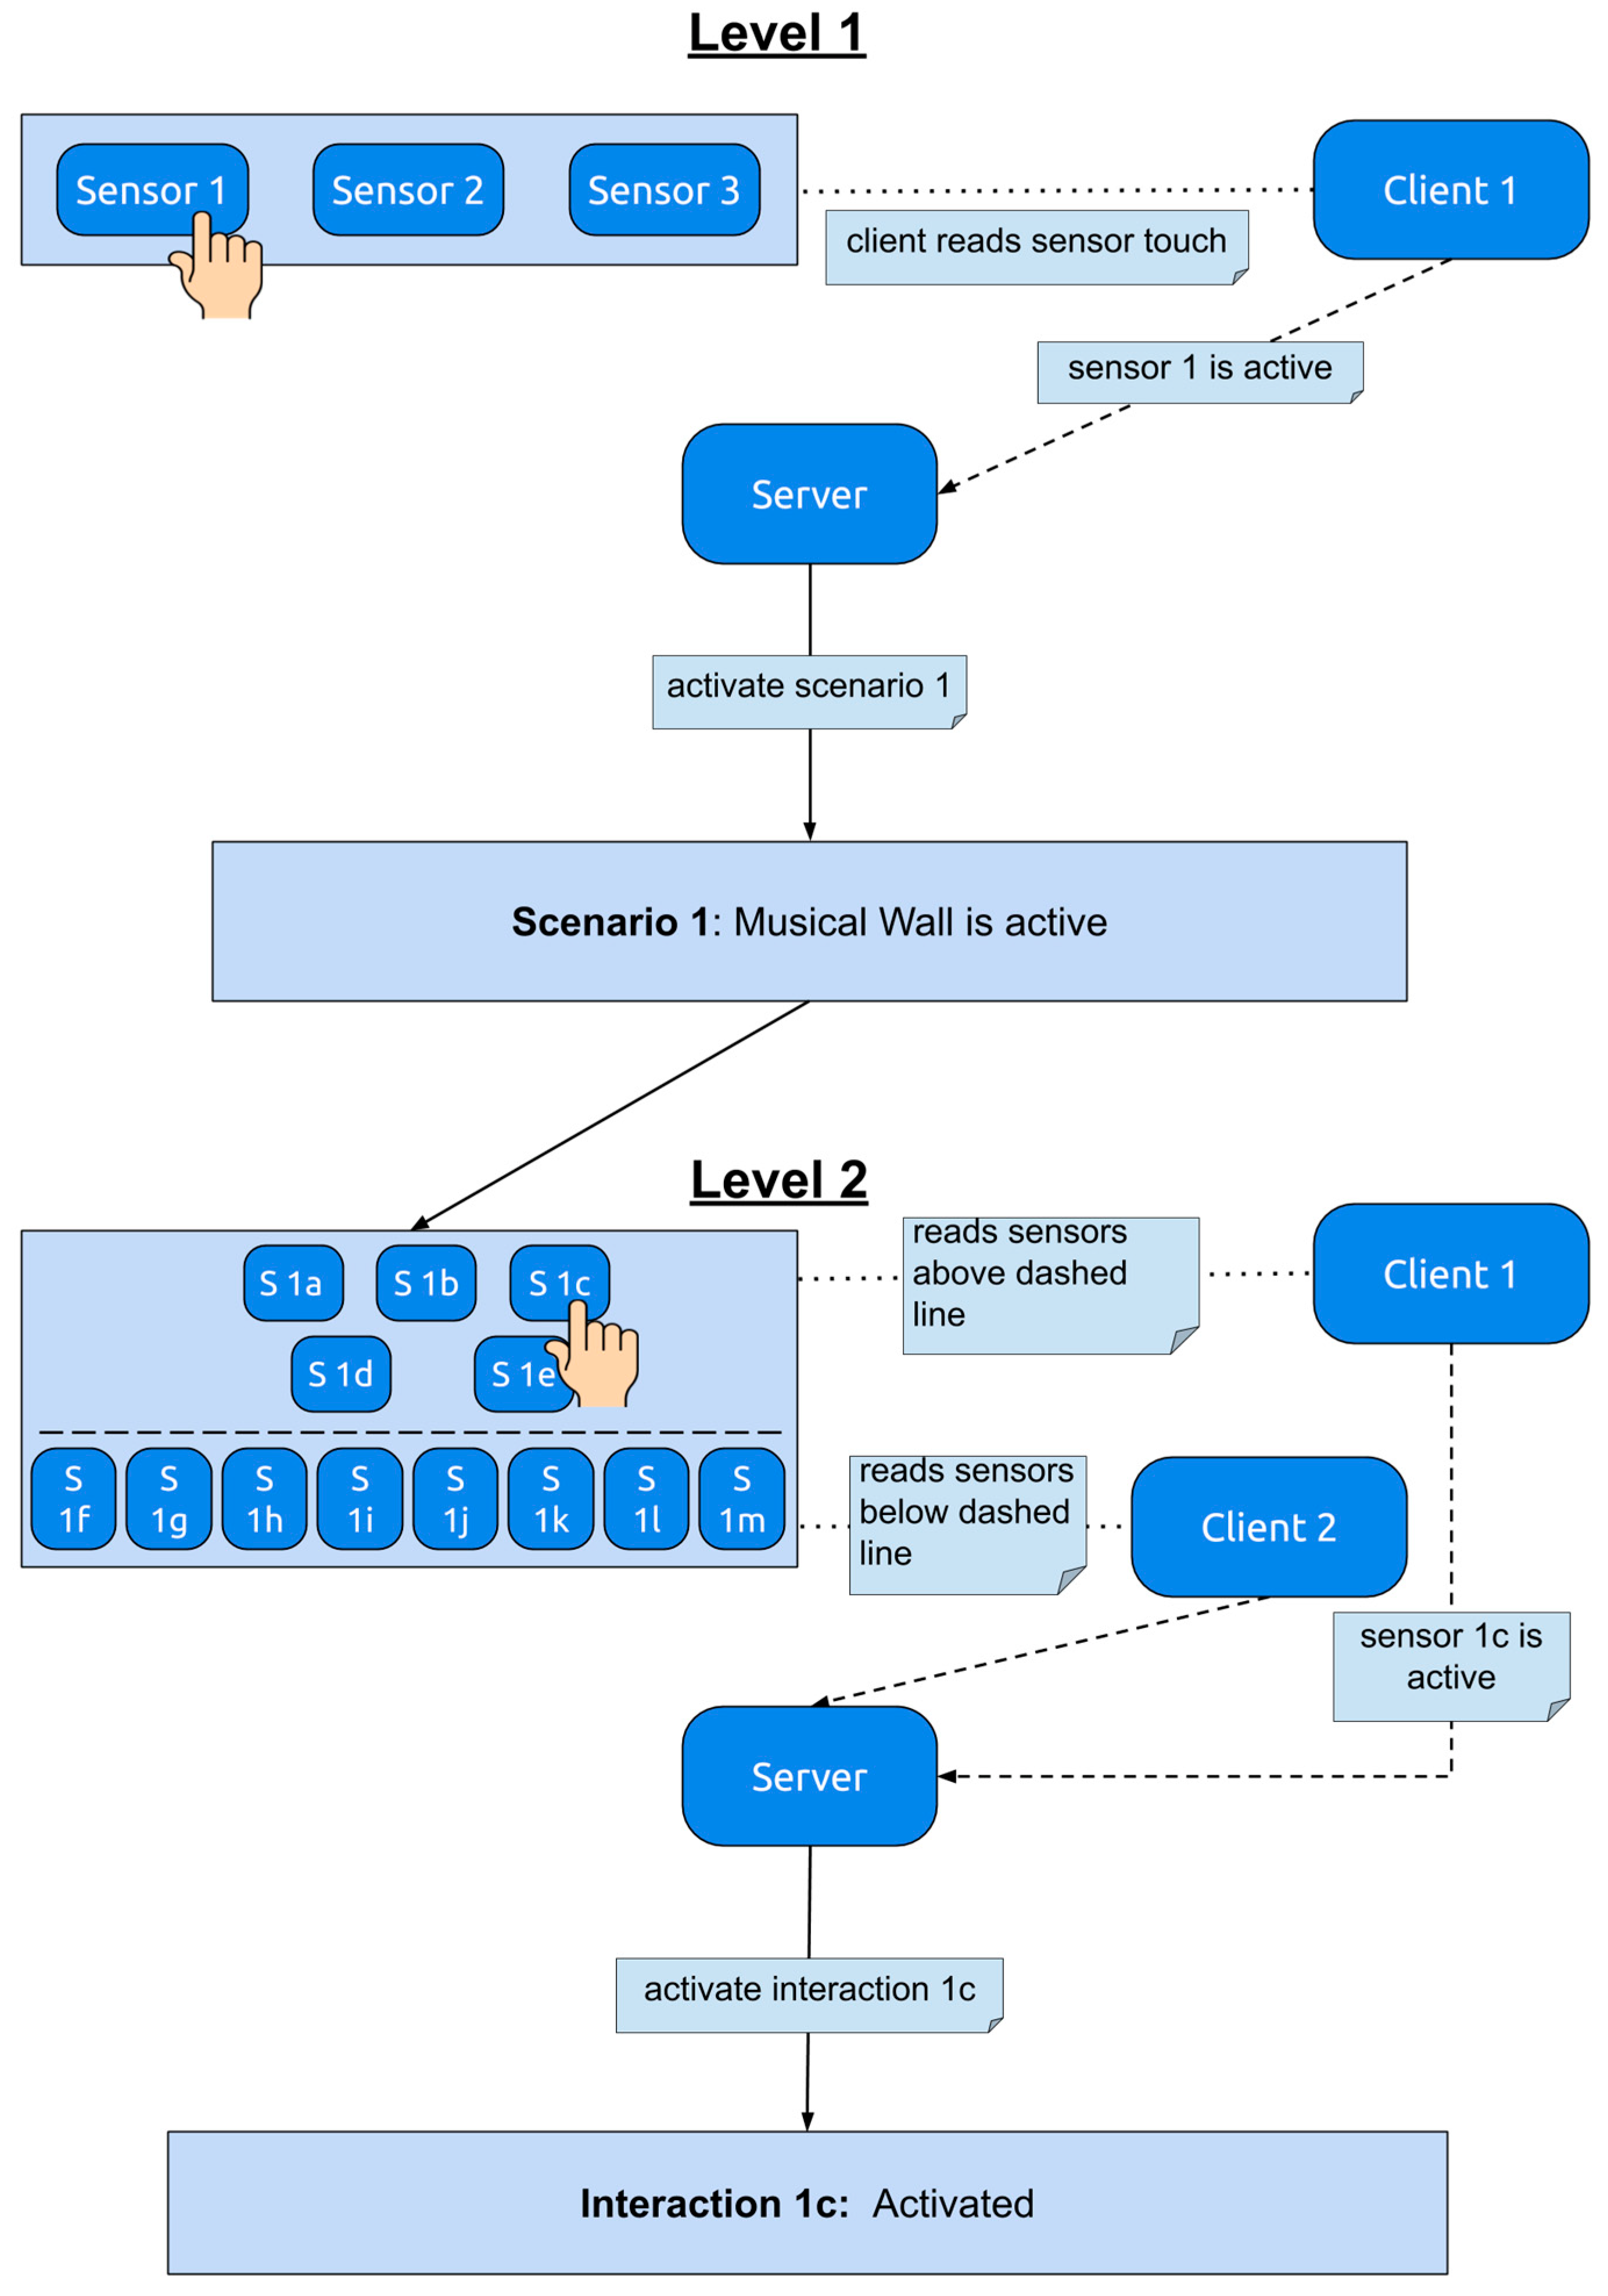
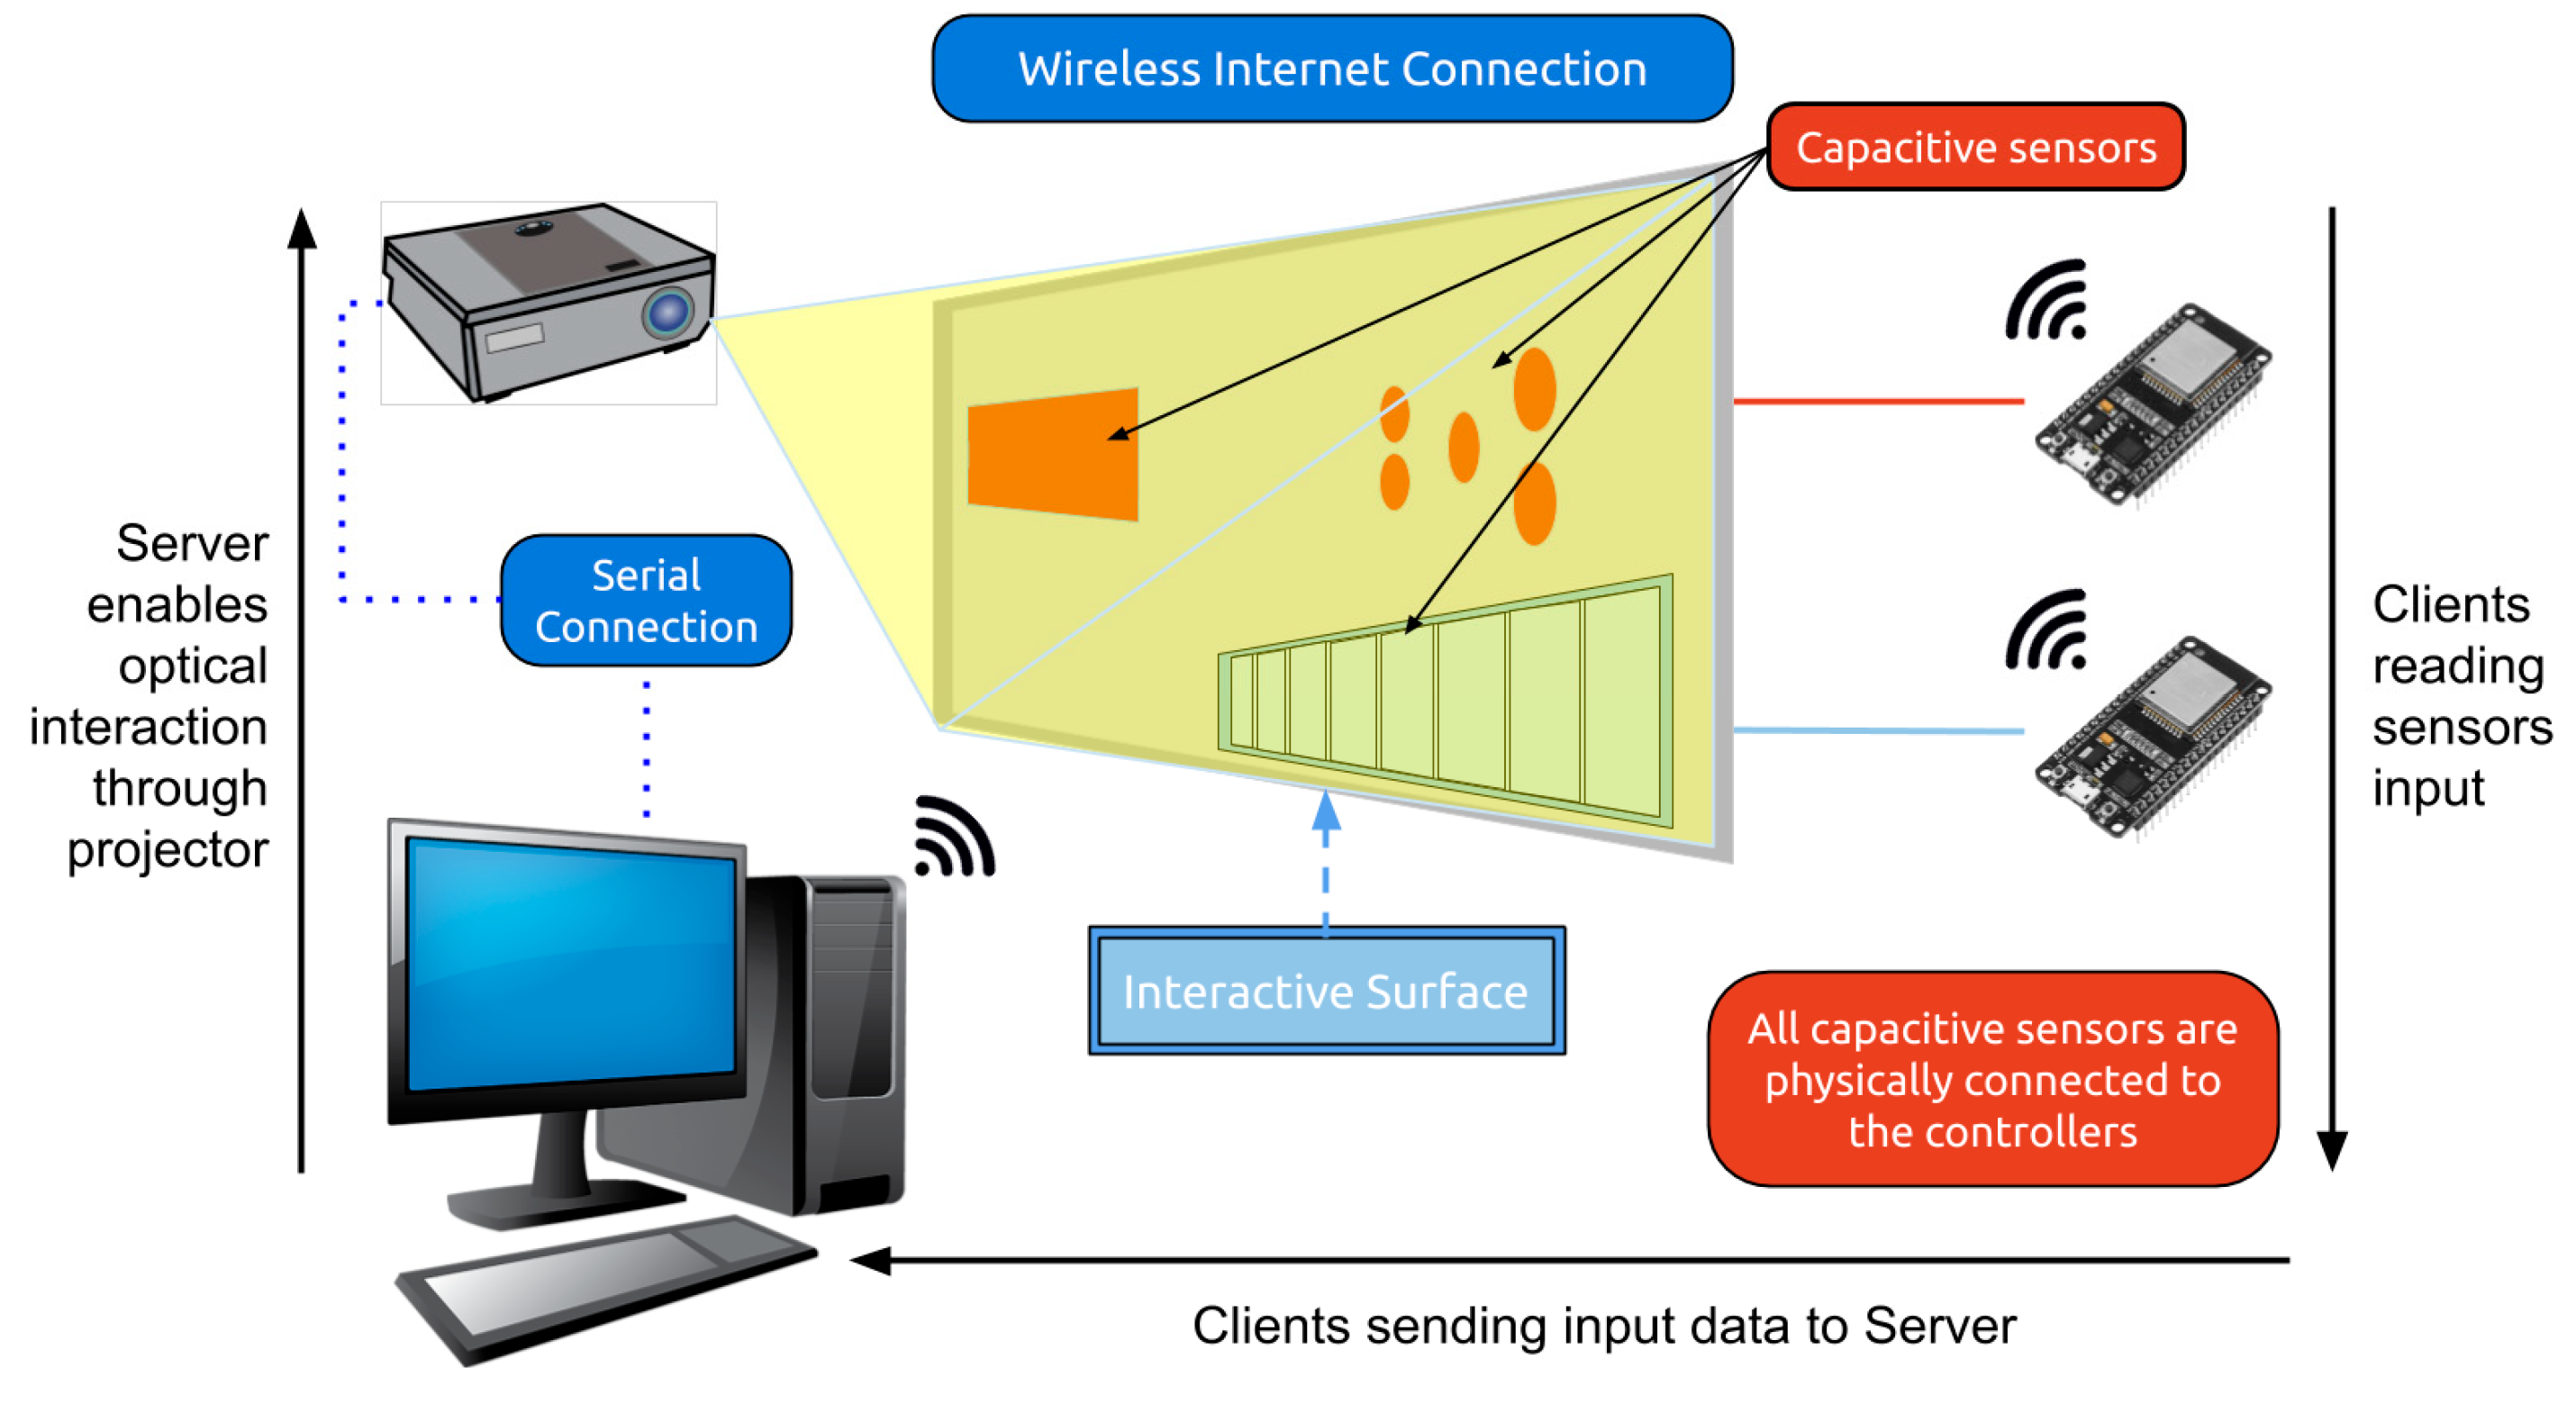
3.2.1. High-Level Architecture and Requirement Analysis

As it was mentioned in the Introduction, the present work focuses on the craft of an interactive tangible and layered dashboard integrating capacitive sensing that can be easily and inexpensively implemented from electronics novices, in a DIY way. Our aim is this dashboard, along with a typical projector displaying graphics on it, to be used as an interactive surface oriented mainly to educational, advertising, or entertaining purposes. The projection of graphics over the surface will take place by applying the Projection Mapping technique, so an impressive result is achieved for the users [22,23]. The purpose is capacitive sensing in combination with the Projection Mapping technique to compose a fully functional and interactive system. Figure 7 illustrates the high-level architecture of our system. For demonstration purposes, an educational scenario was selected, that is oriented mainly to children.
For the proper development of the project, it was necessary to design it having in mind the requirements towards the final application. A step-by-step analysis was logically followed. The first step involved the creation and evaluation of our tangible surface. To this end, as was shown in Figure 5, a smaller-scale simulation was created at first, where the performance of sensors to each press by the users were tested. As it was mentioned previously, the ESP32 was selected to be the “heart” of our implementation. A basic requirement for the final system was the microcontroller to have built-in Wi-Fi support, which the ESP32 microcontroller meets. Also, it is powerful enough to meet soft real time requirements, since the final system is expected to operate with several users in parallel, hence, simultaneous touches are expected to take place. Finally, an open-source software implementation was considered that would be able to undertake the Projection Mapping functionality and the rendering of graphics. Processing [24] is a very powerful programmable software, with many enriched libraries and features, that could help us complete the project.
Definitely, the communication between the individual parts of the system determines the proper operation of the final application. According to the adopted architecture, the communication of the microcontrollers behind the tangible surface with our server running Processing is based on TCP/IP socket communication following the Client-Server paradigm and takes place on top of a WLAN network. The role of the Server is undertaken by a Processing-based Internet application and the role of the Clients by two ESP32 microcontrollers situated behind the surface. Each microcontroller running the client application is responsible for: (a) detecting the change in capacity of various aluminum touch sensors spread over the surface; (b) receiving the status of the sensors, and then (c) sending the status to the Processing application only when the capacity change meets the desired conditions (less than a predefined threshold). Once the data are received, the Processing application manages each interaction independently and orchestrates the projection of the respective audio and multimedia content over the surface. The projector used to play back the media content over the interactive surface is serially connected to the computer hosting the server application.

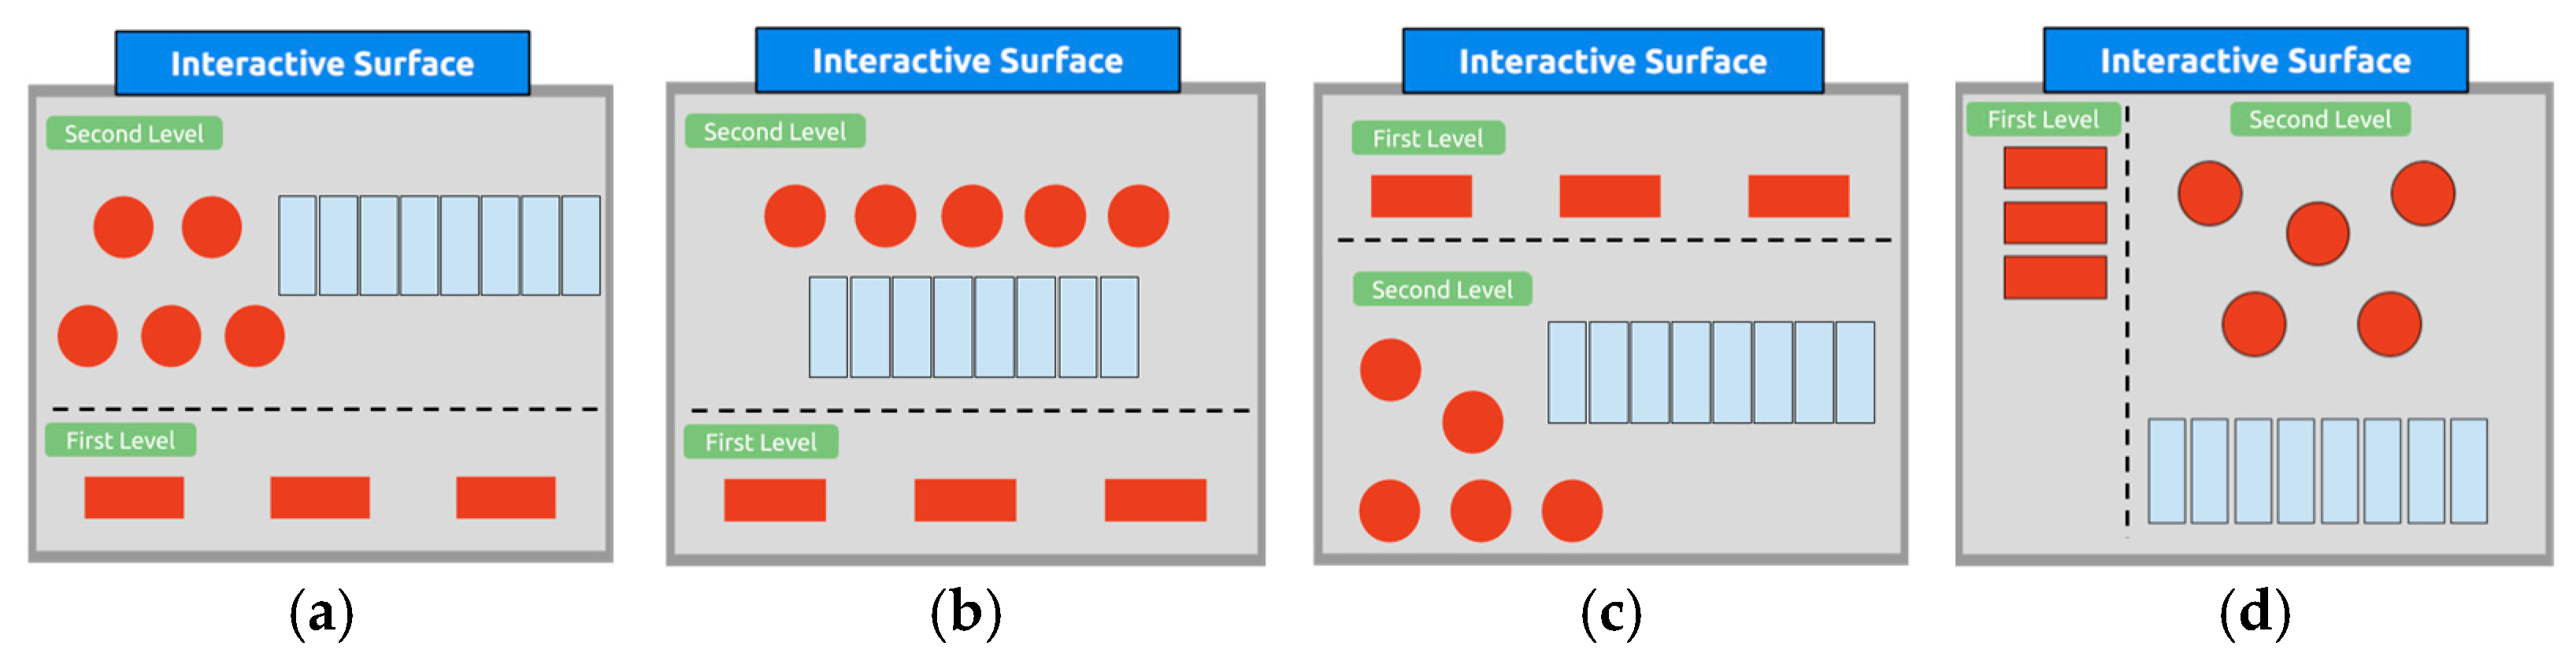
3.2.2. Layout and Layered Design of the Tangible Surface

Having decided on the high-level architecture of our system, the next step was to assure that the dashboard could be multi-functional and able to accommodate several different scenarios. Layers are the appropriate solution to this end. To enable them, two different levels of operation on our surface were developed. In the first level, which is called the Menu Area, the user is given the opportunity via buttons to choose the scenario/layer she/he wants to interact with on the second level. The Menu is permanently exposed to the user so the navigation between scenarios/layers can be performed at will. When the user selects the scenario/layer she/he wishes to (e.g., by pressing one of the available touch sensors in the Menu Area), this leads her/him to the second level where the basic interactions of the selected scenario/layer has been enabled. Hence, the second level is the Working Area of the surface. With this visual separation of the surface at two levels, emphasis is given on the sensors of each scenario/layer that implement its functionality. This enhances the usability of the dashboard and the convenience for the users. Figure 8 illustrates the leveled architecture of the surface.
Then, the optimal layout for the placement of the sensors on the surface had to be found. To this end, four different layouts were considered, which are shown in Figure 8. Among them, the first two (Figure 8a,b) expose the second level of the surface, higher than the menu level. These seem to be ideal for users with medium height, since they prohibit shorter persons from reaching the sensors on the second level, while forcing taller persons to stoop. Exactly the opposite takes place with the third layout (Figure 8c), where the first level is situated higher than the second one. The fourth layout (Figure 8d) exposes both levels of operation at the same height, so it seems to be more convenient for domestic use. Taking into consideration that the target group of the proposed construction is mostly children, we decided to go with the fourth layout (Figure 8d).

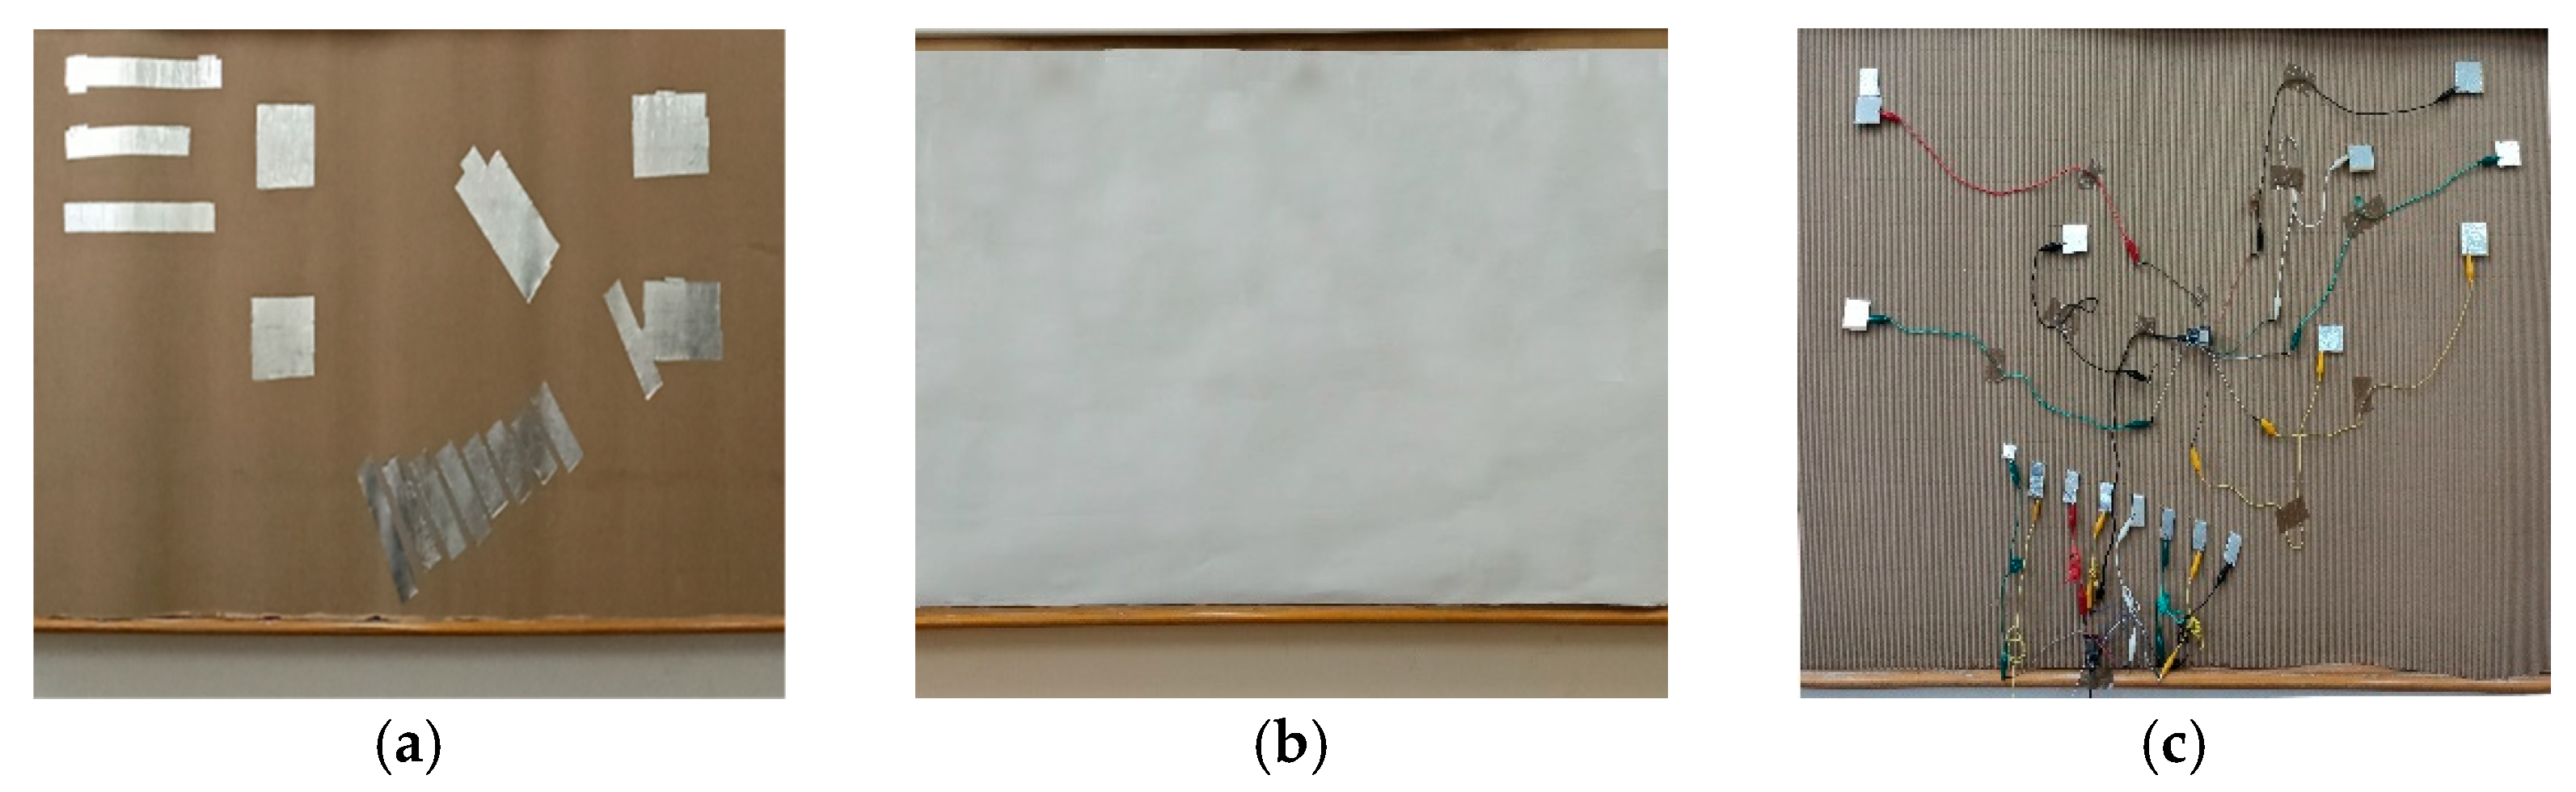
3.2.3. Crafting of the Tangible Surface

As a basis for the construction of our dashboard, a piece of thick brown cardboard about 70 cm × 150 cm in size, was selected. This is a very affordable solution, trivial to find, and at the same time easy to manage. Moreover, its easy portability is a plus, considering the final implementation. The cardboard offers this as it can be wrapped even in a roll without affecting the sensors. For the latter, pieces of adhesive aluminum tape were placed on the front side of the cardboard, which were thereafter the touch sensors (Figure 9). To keep the front side as simple and flat as possible, slits were made in the cardboard, so the self-adhesive aluminum tape passes through to the backside of the surface. With this technique continuity was achieved between the front and the backside of the construction. All the wiring between sensors and microcontrollers, as well as the microcontrollers themselves, were placed at the backside, thus keeping the front-side of the surface tidy. Figure 10 illustrates the front and the back side of the surface. The front-side was finally covered with white paper for hiding the sensors from users and demonstrating a uniform layout ready for projection.

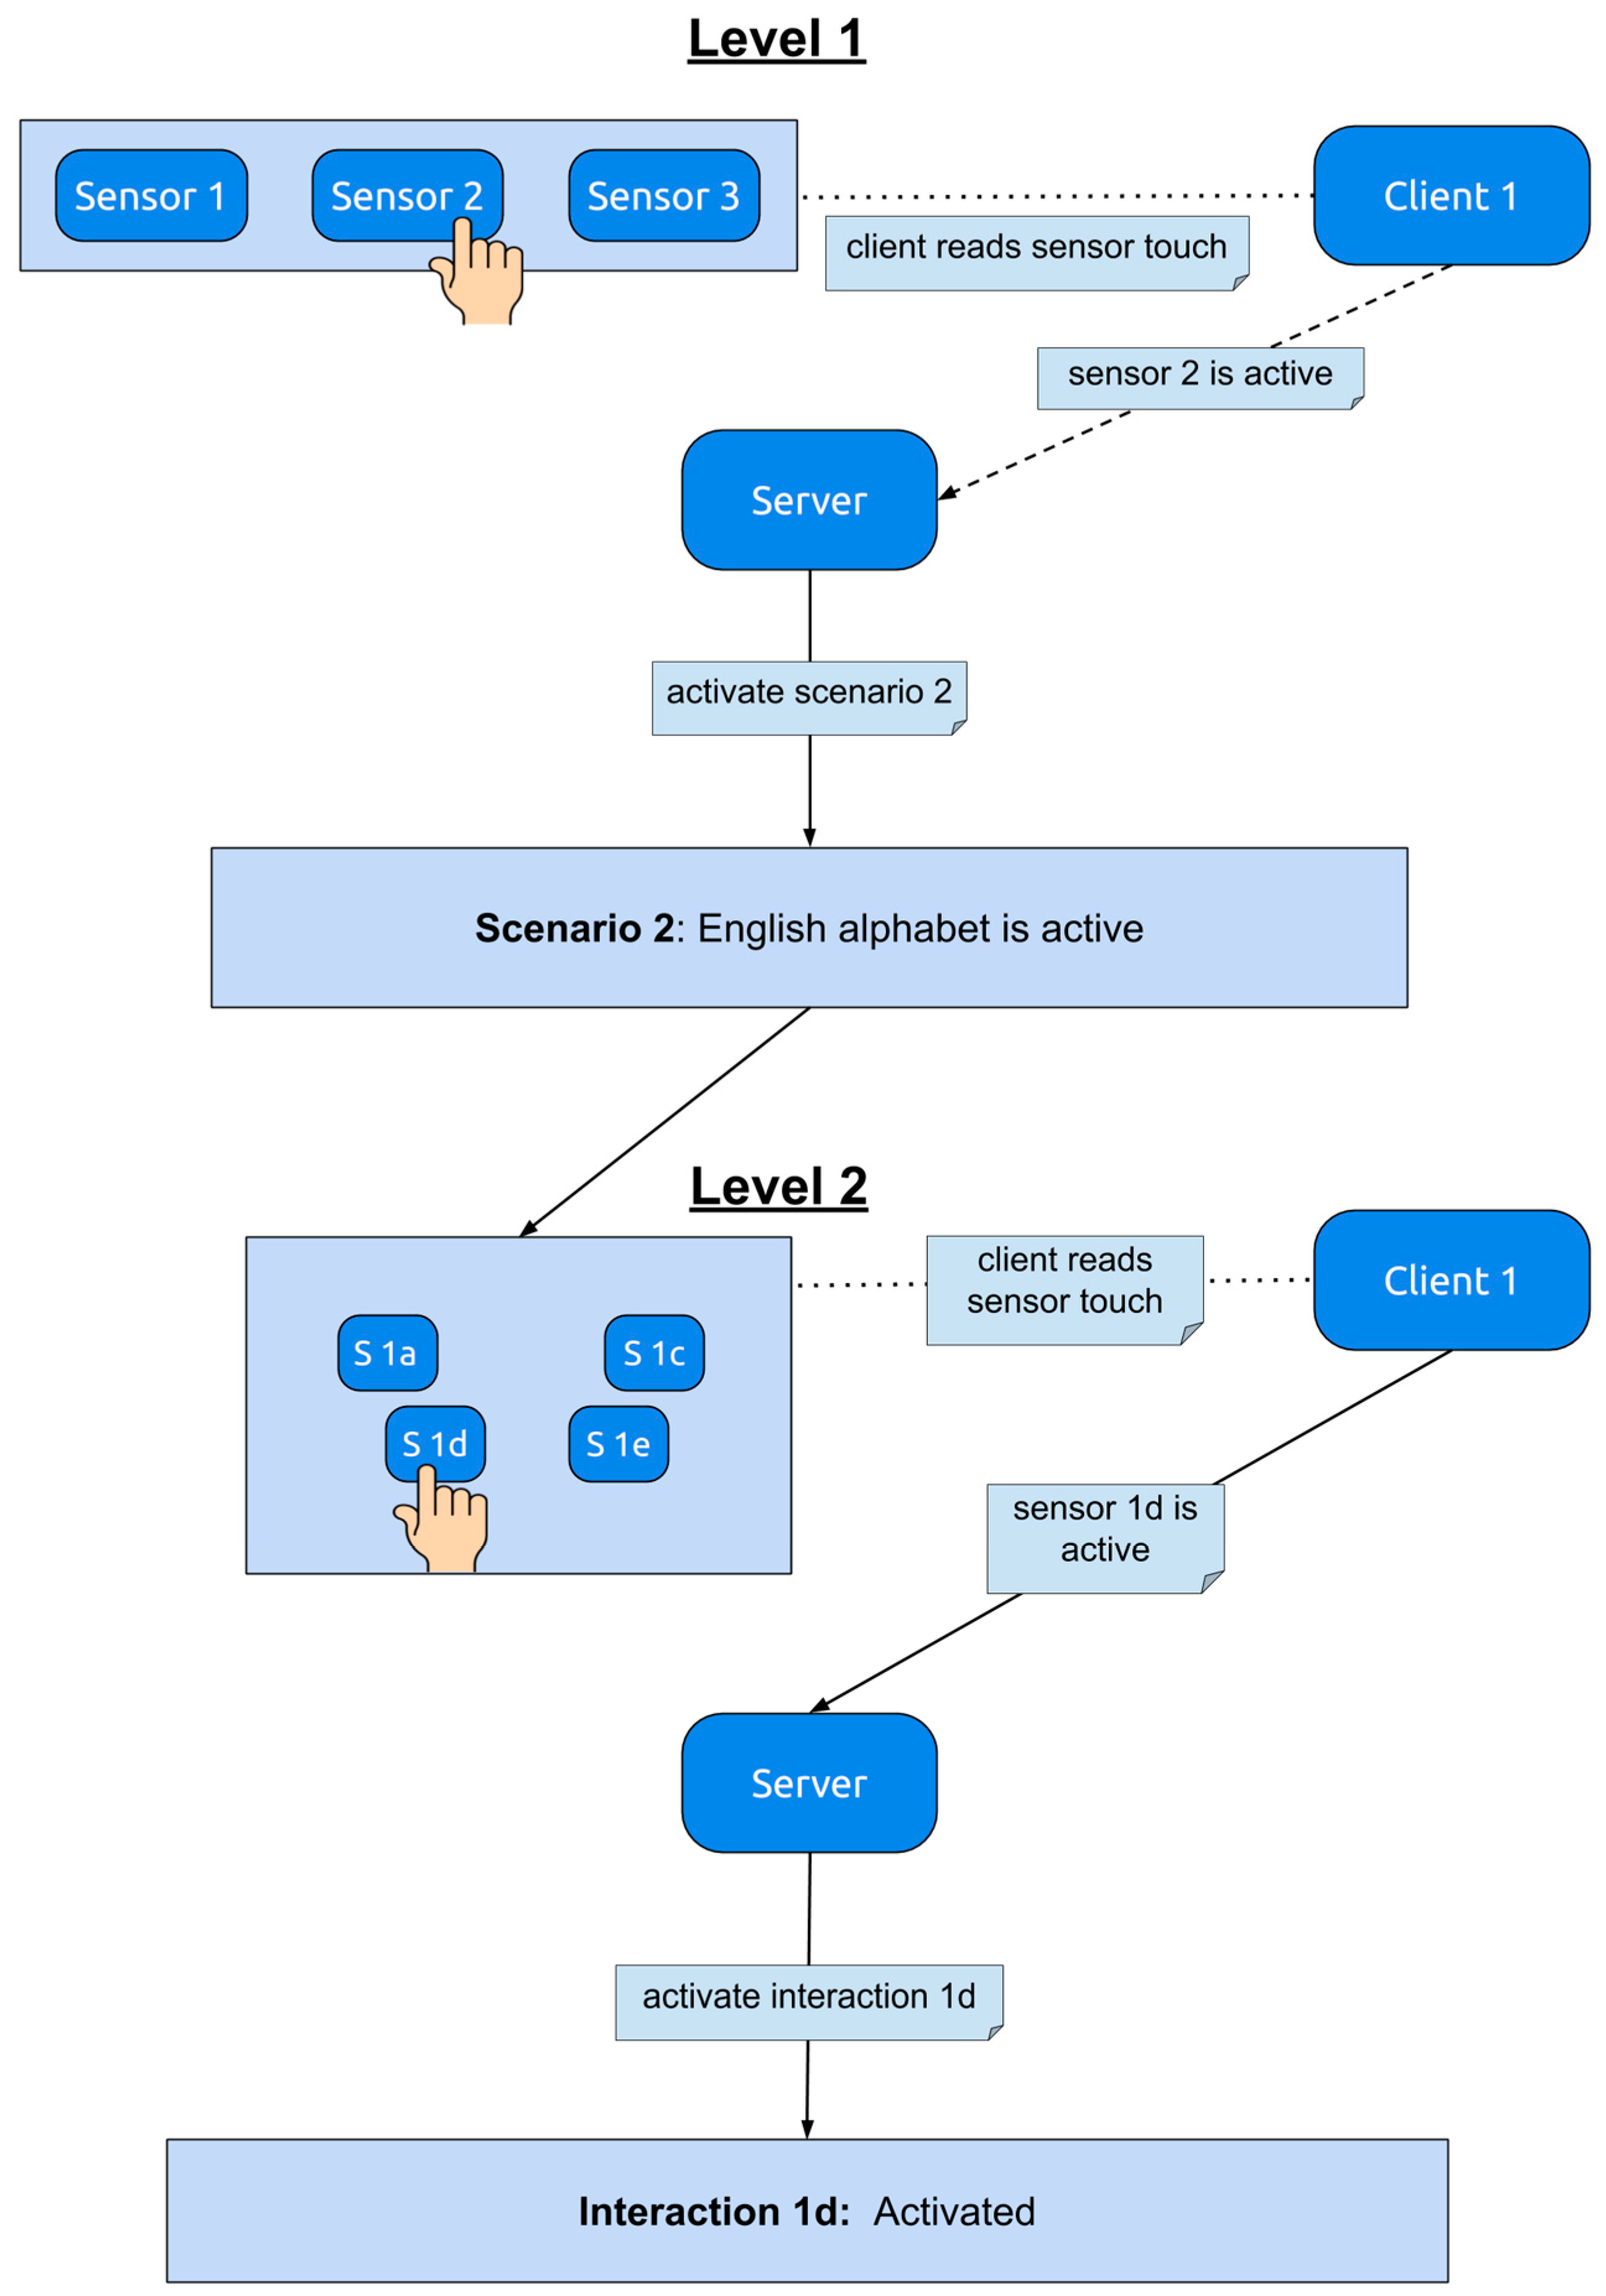
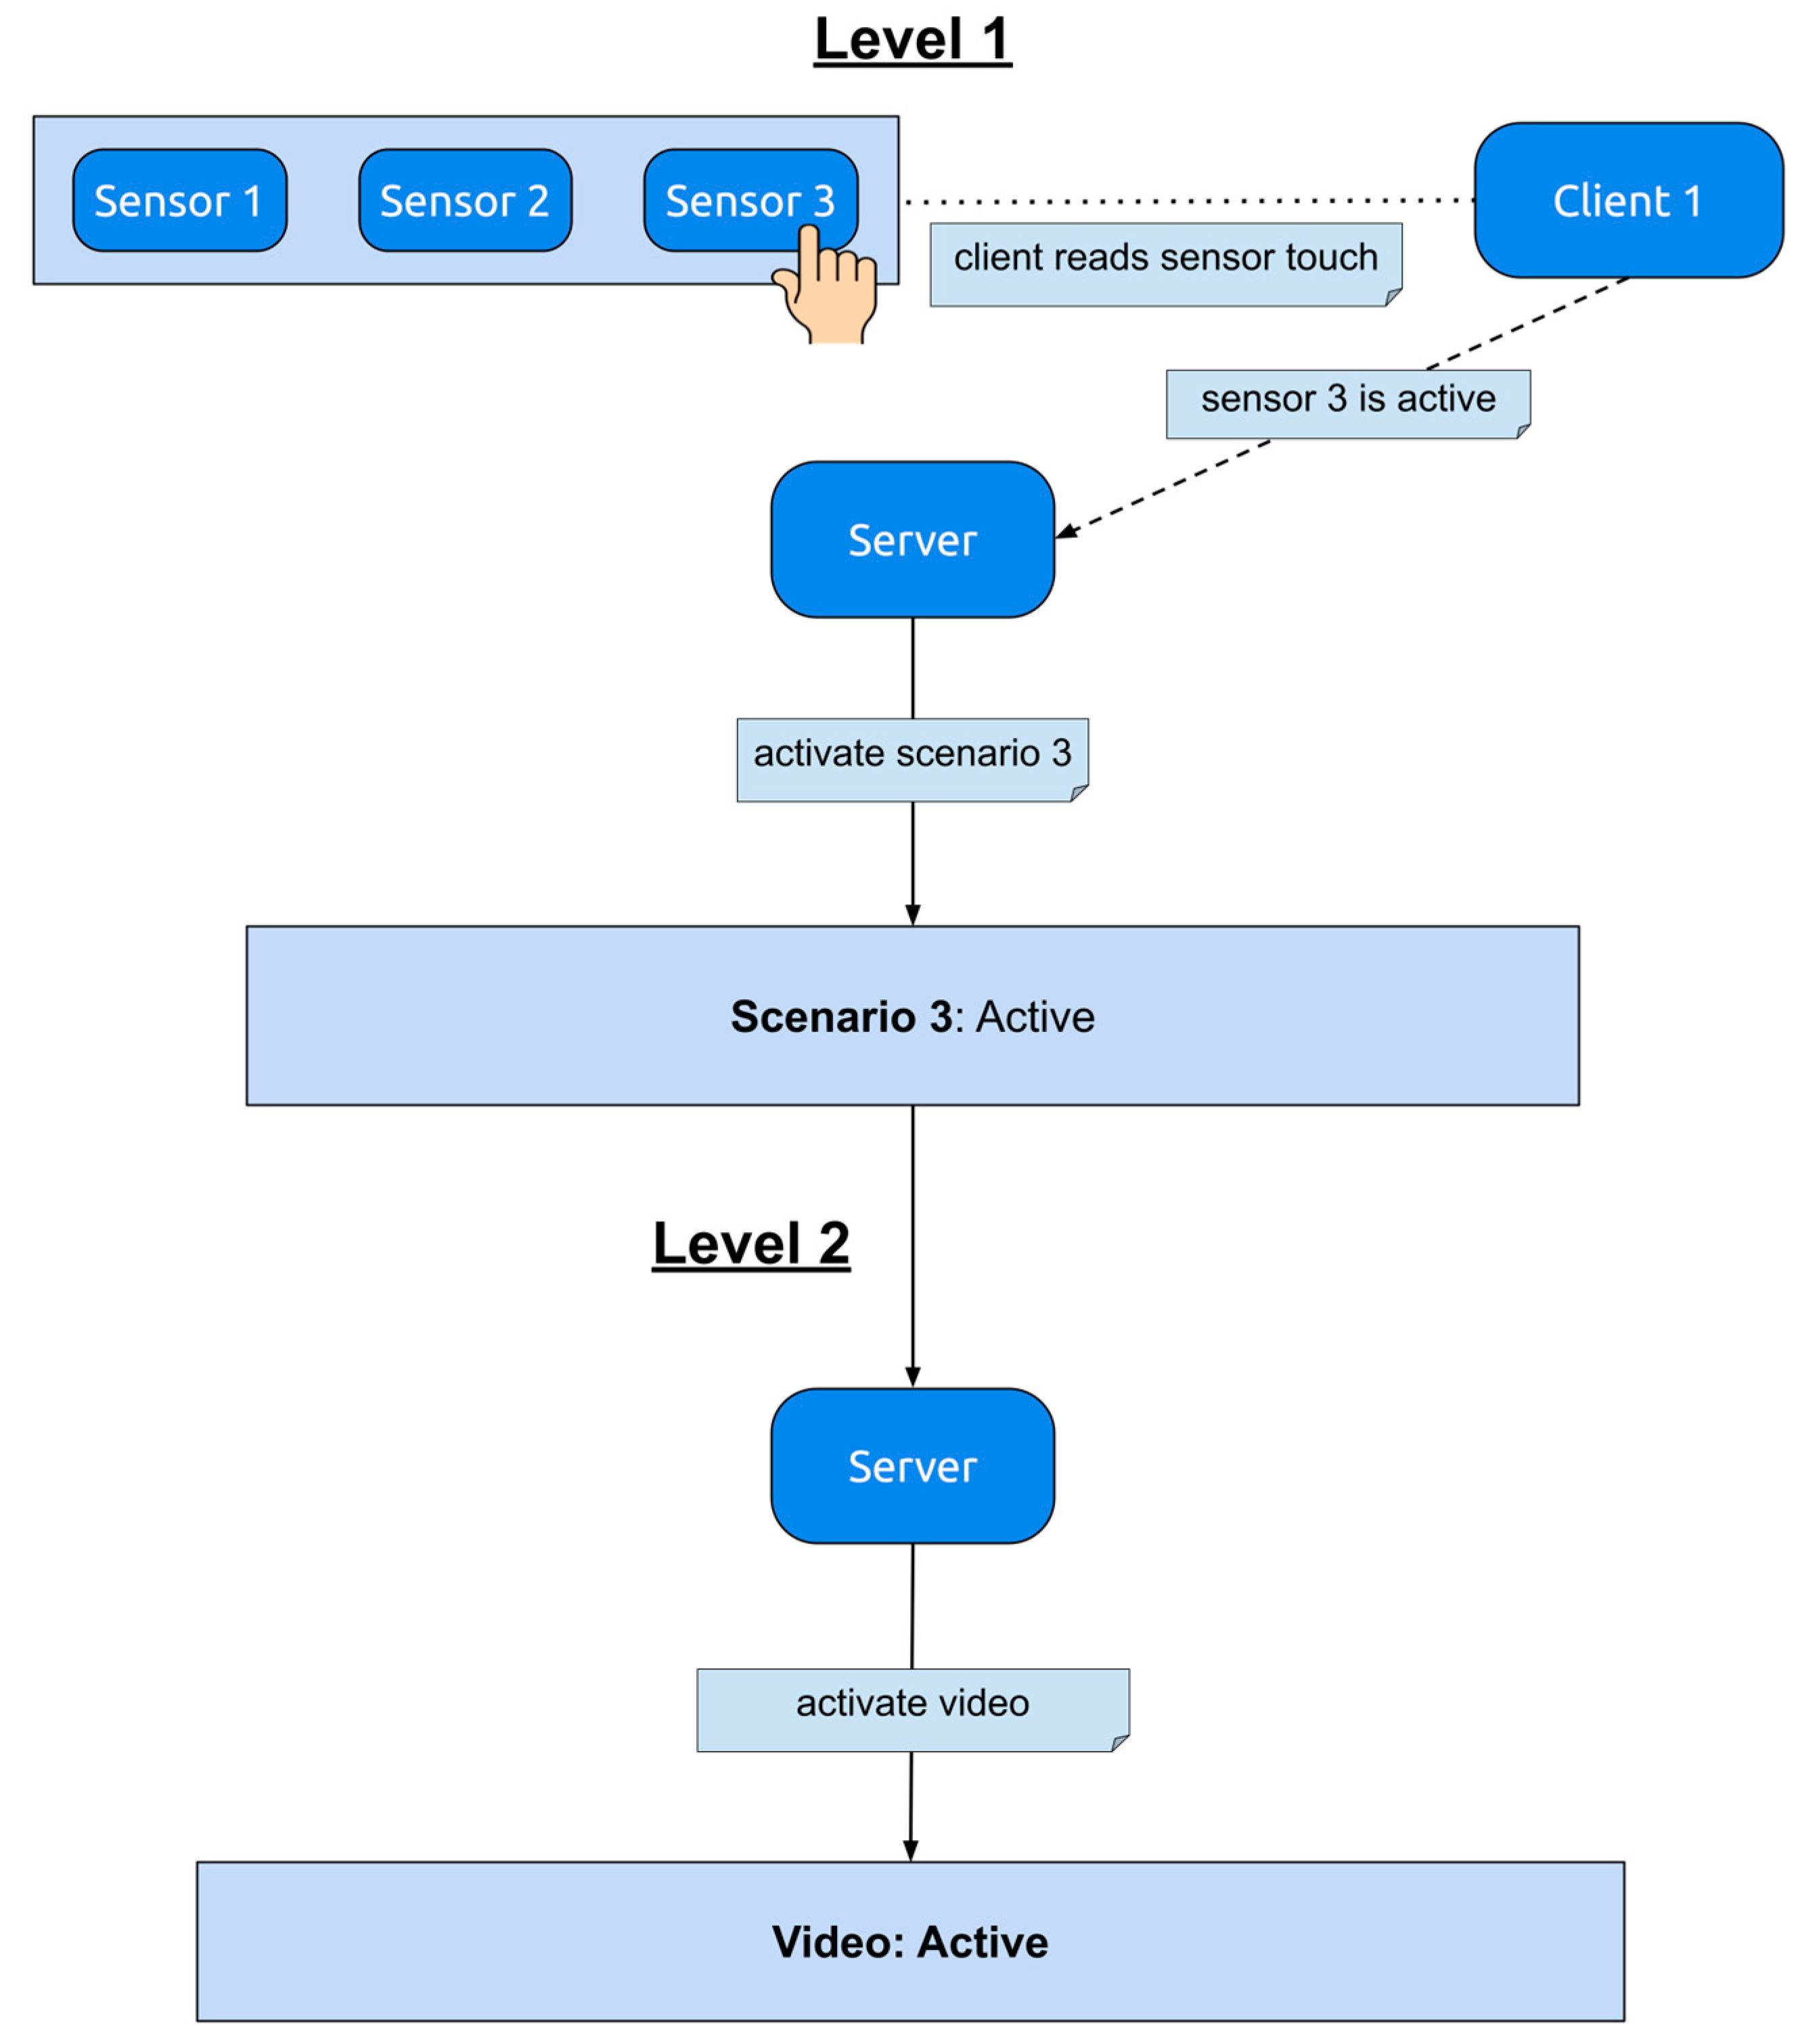
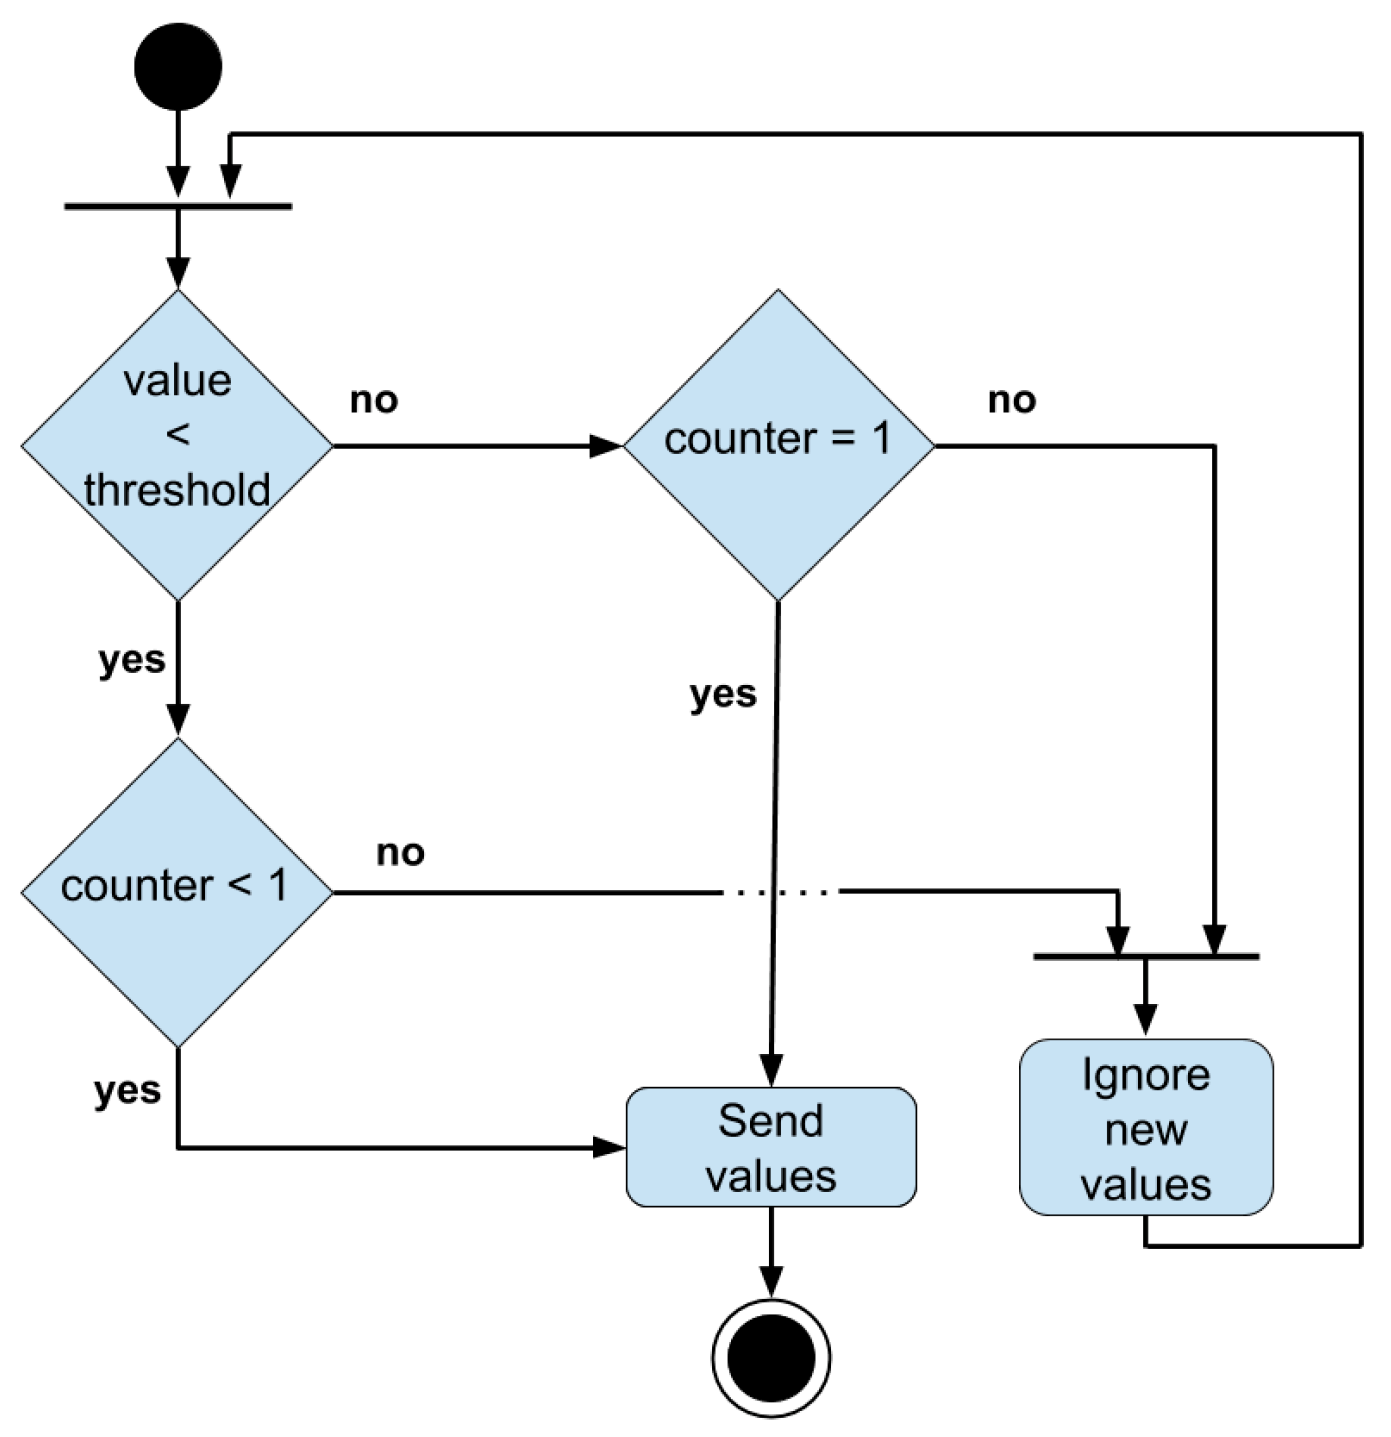
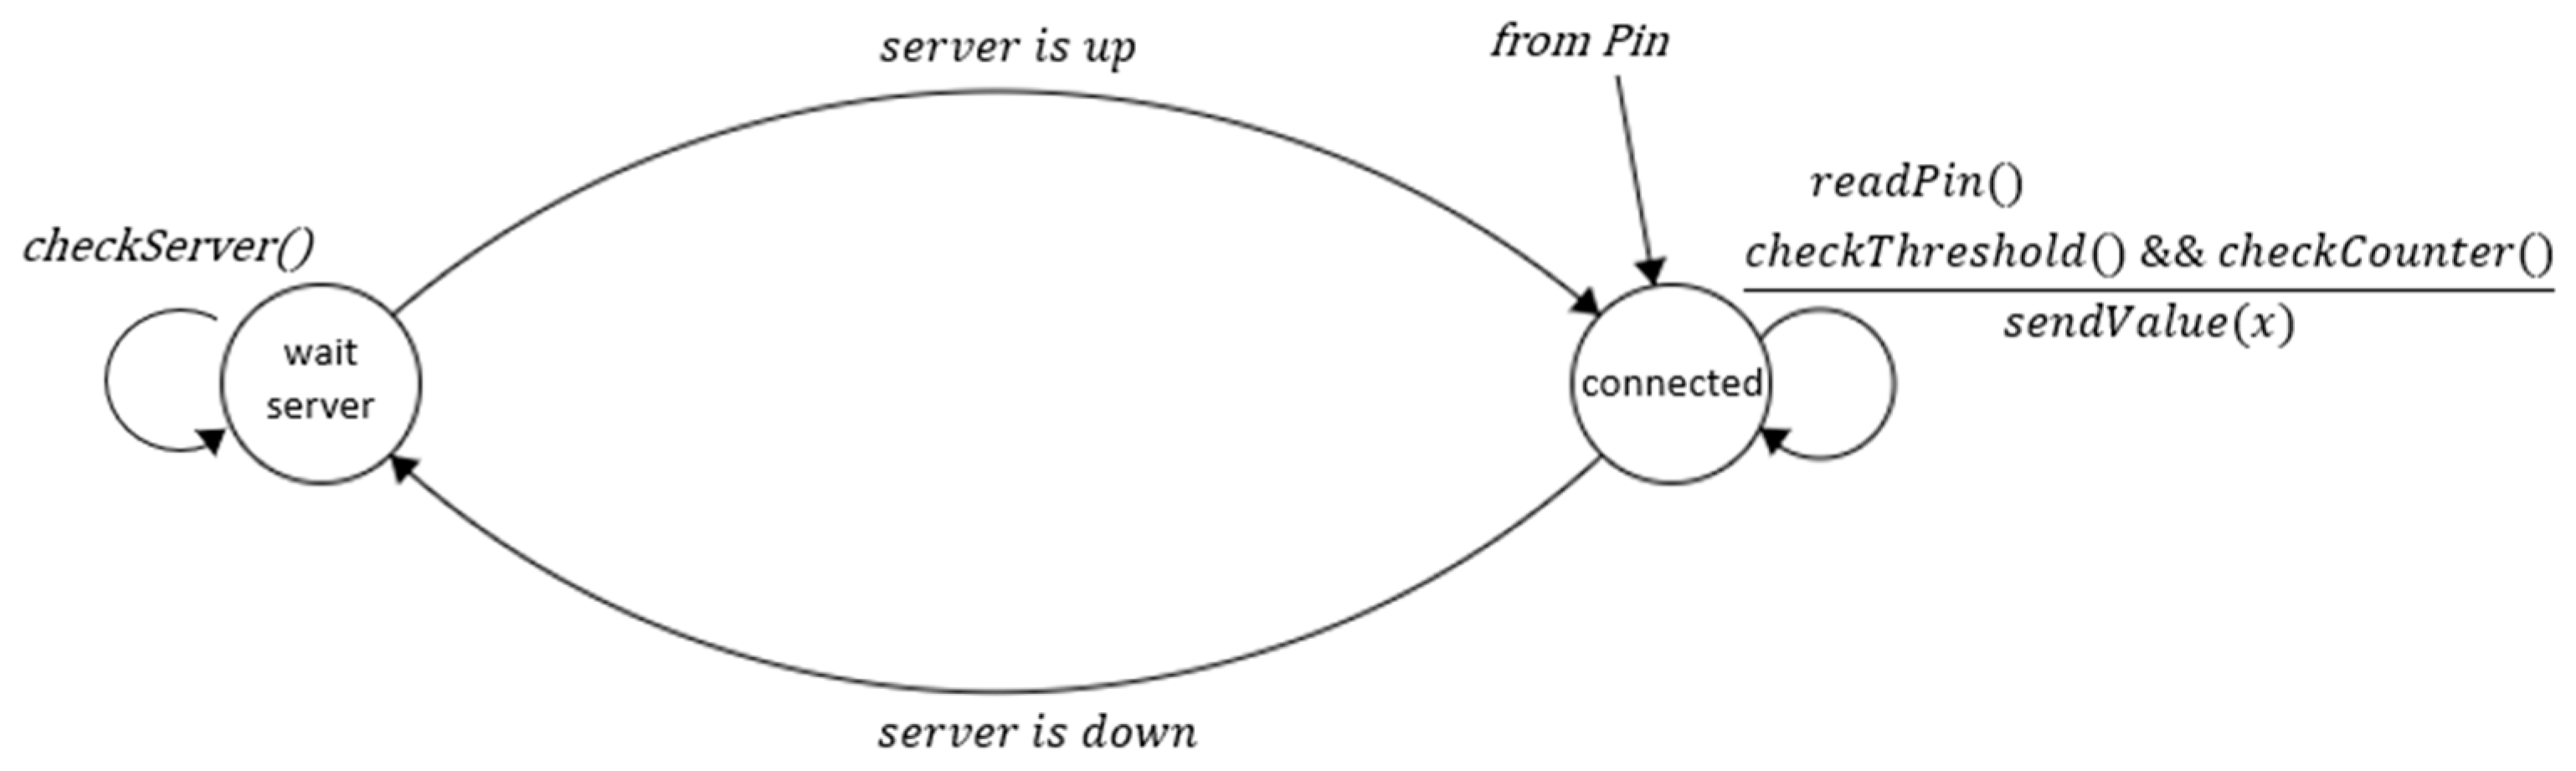
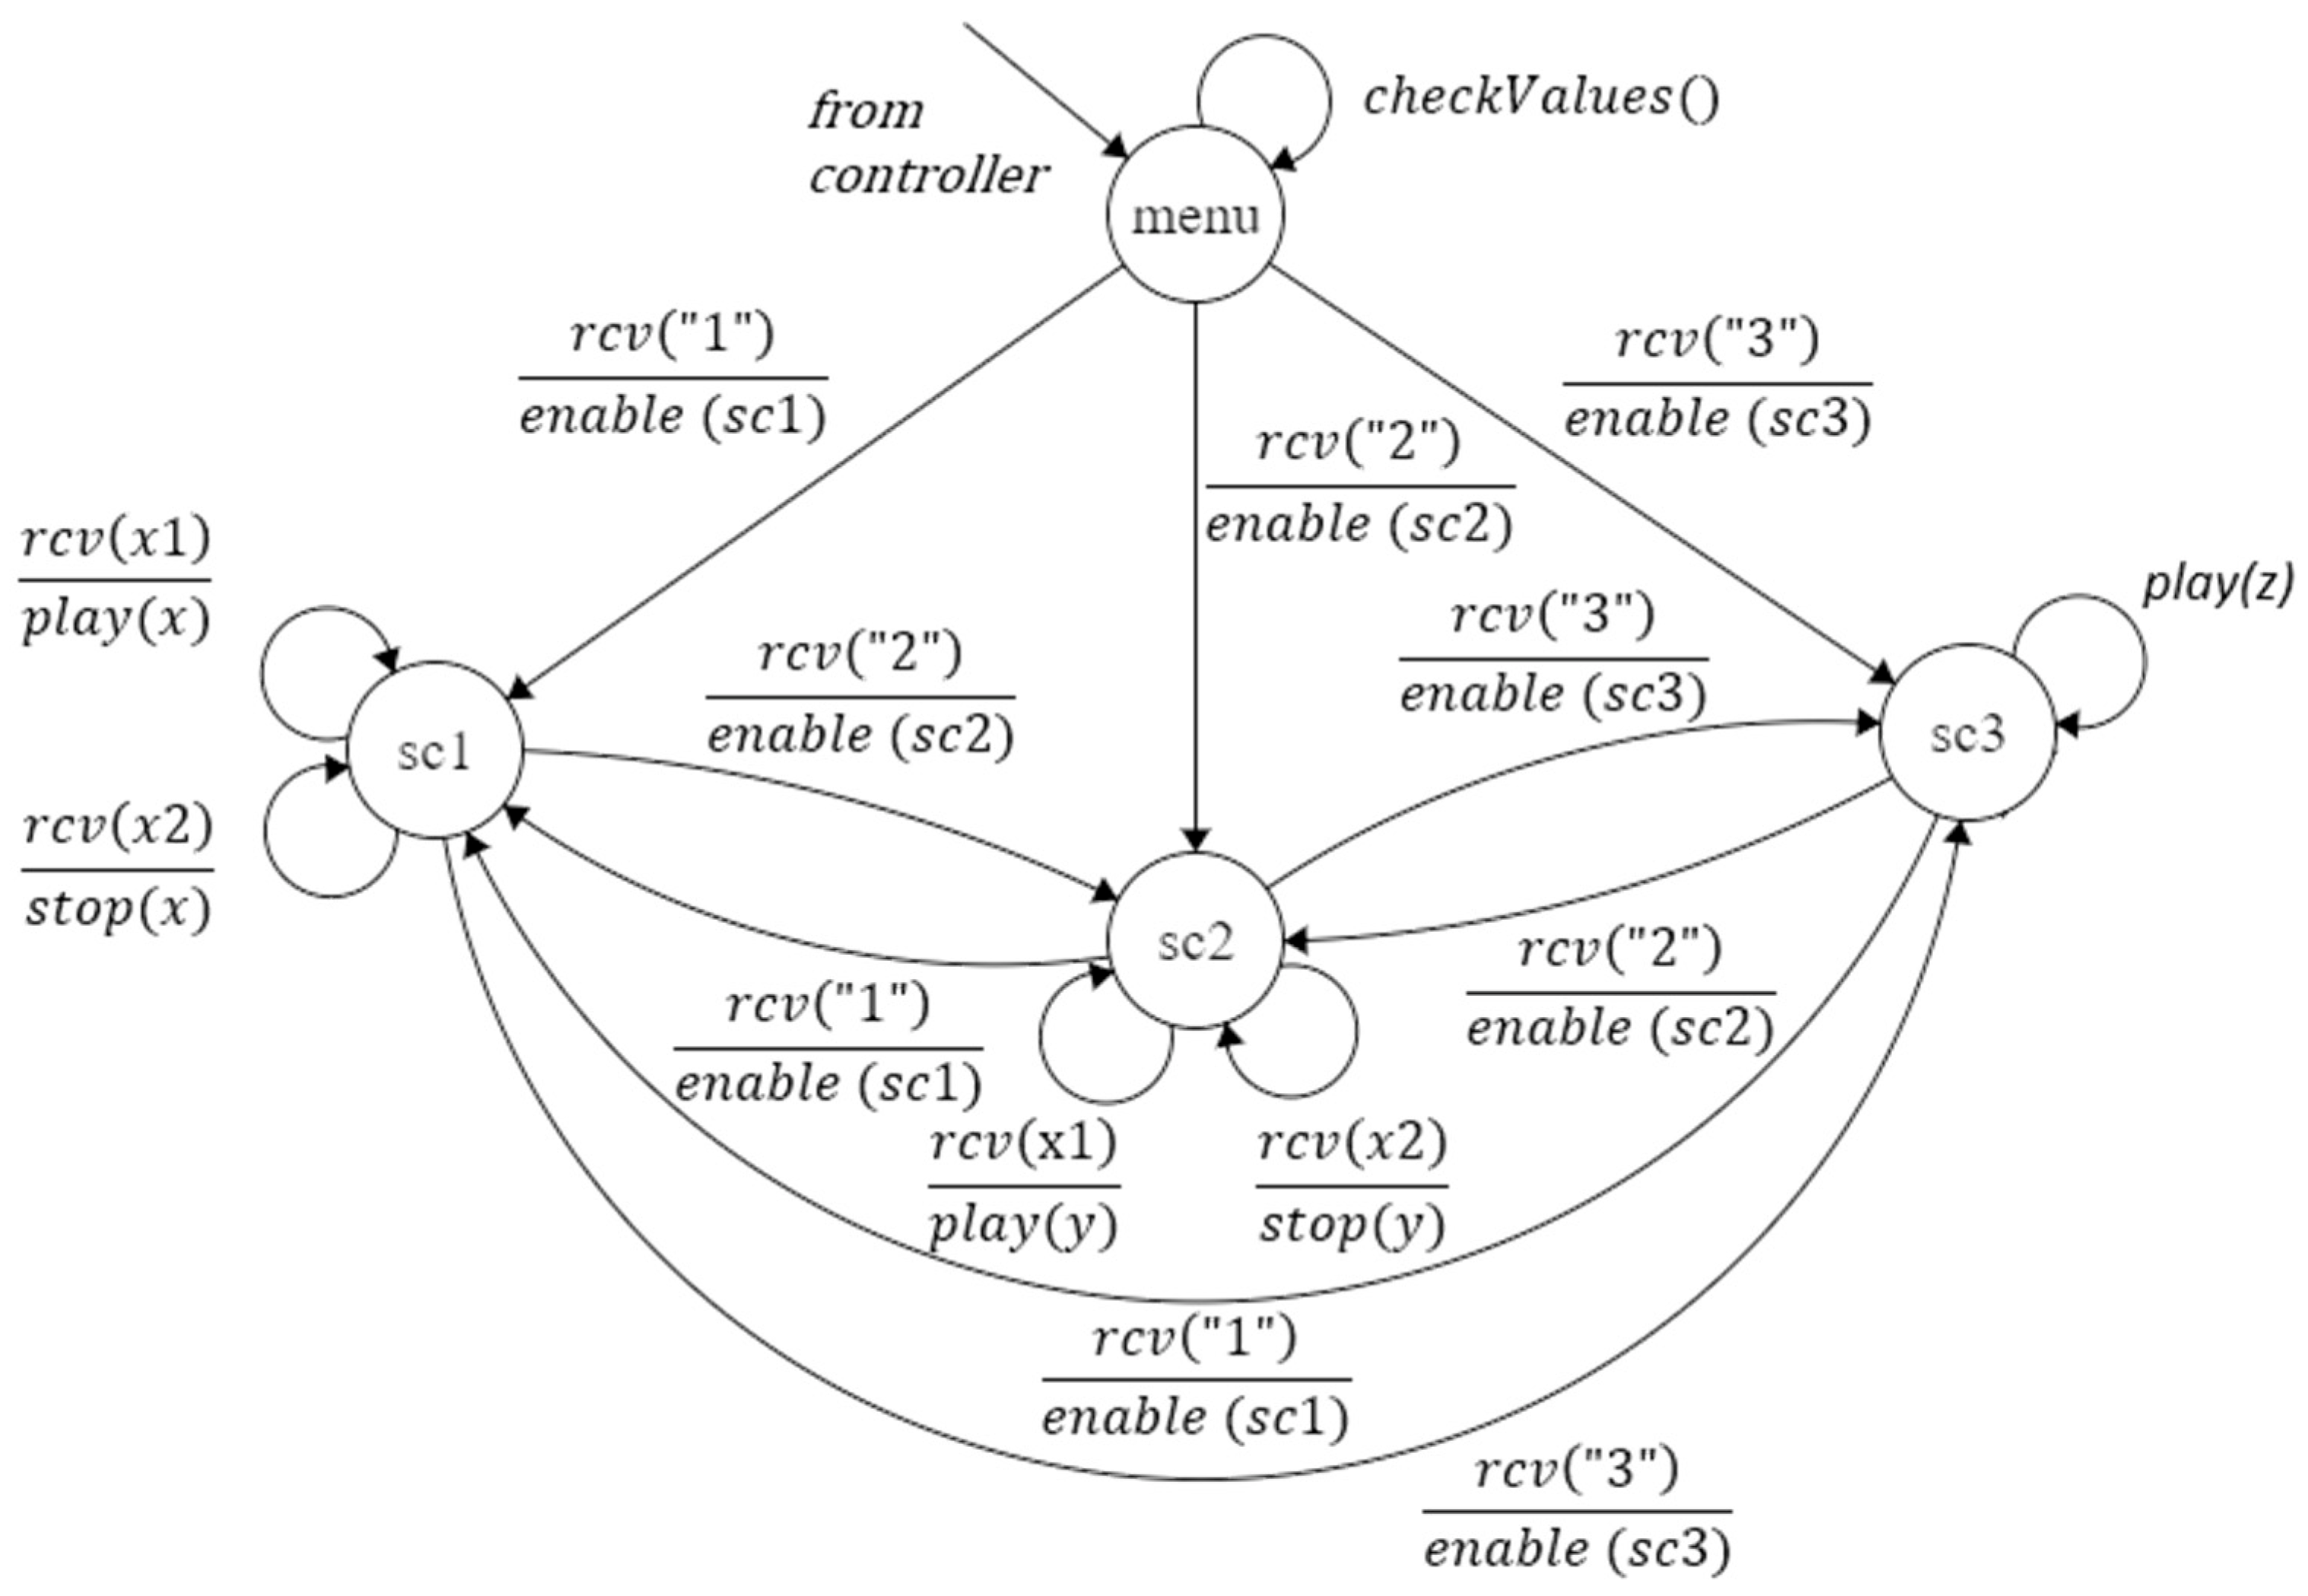
3.3. Programming of the System

Having decided on the high-level architecture of the system, the next step was to define the size, shape, and position on the surface of each sensor to cover with aluminum tape the necessary area. This required the design of each sensor individually based on the scenarios that had to be implemented. Knowing the scenarios that make up the final application, it is possible to find how many, and on the same time of what type, interactions each sensor should recognize. The scenarios considered for construction are as follows:
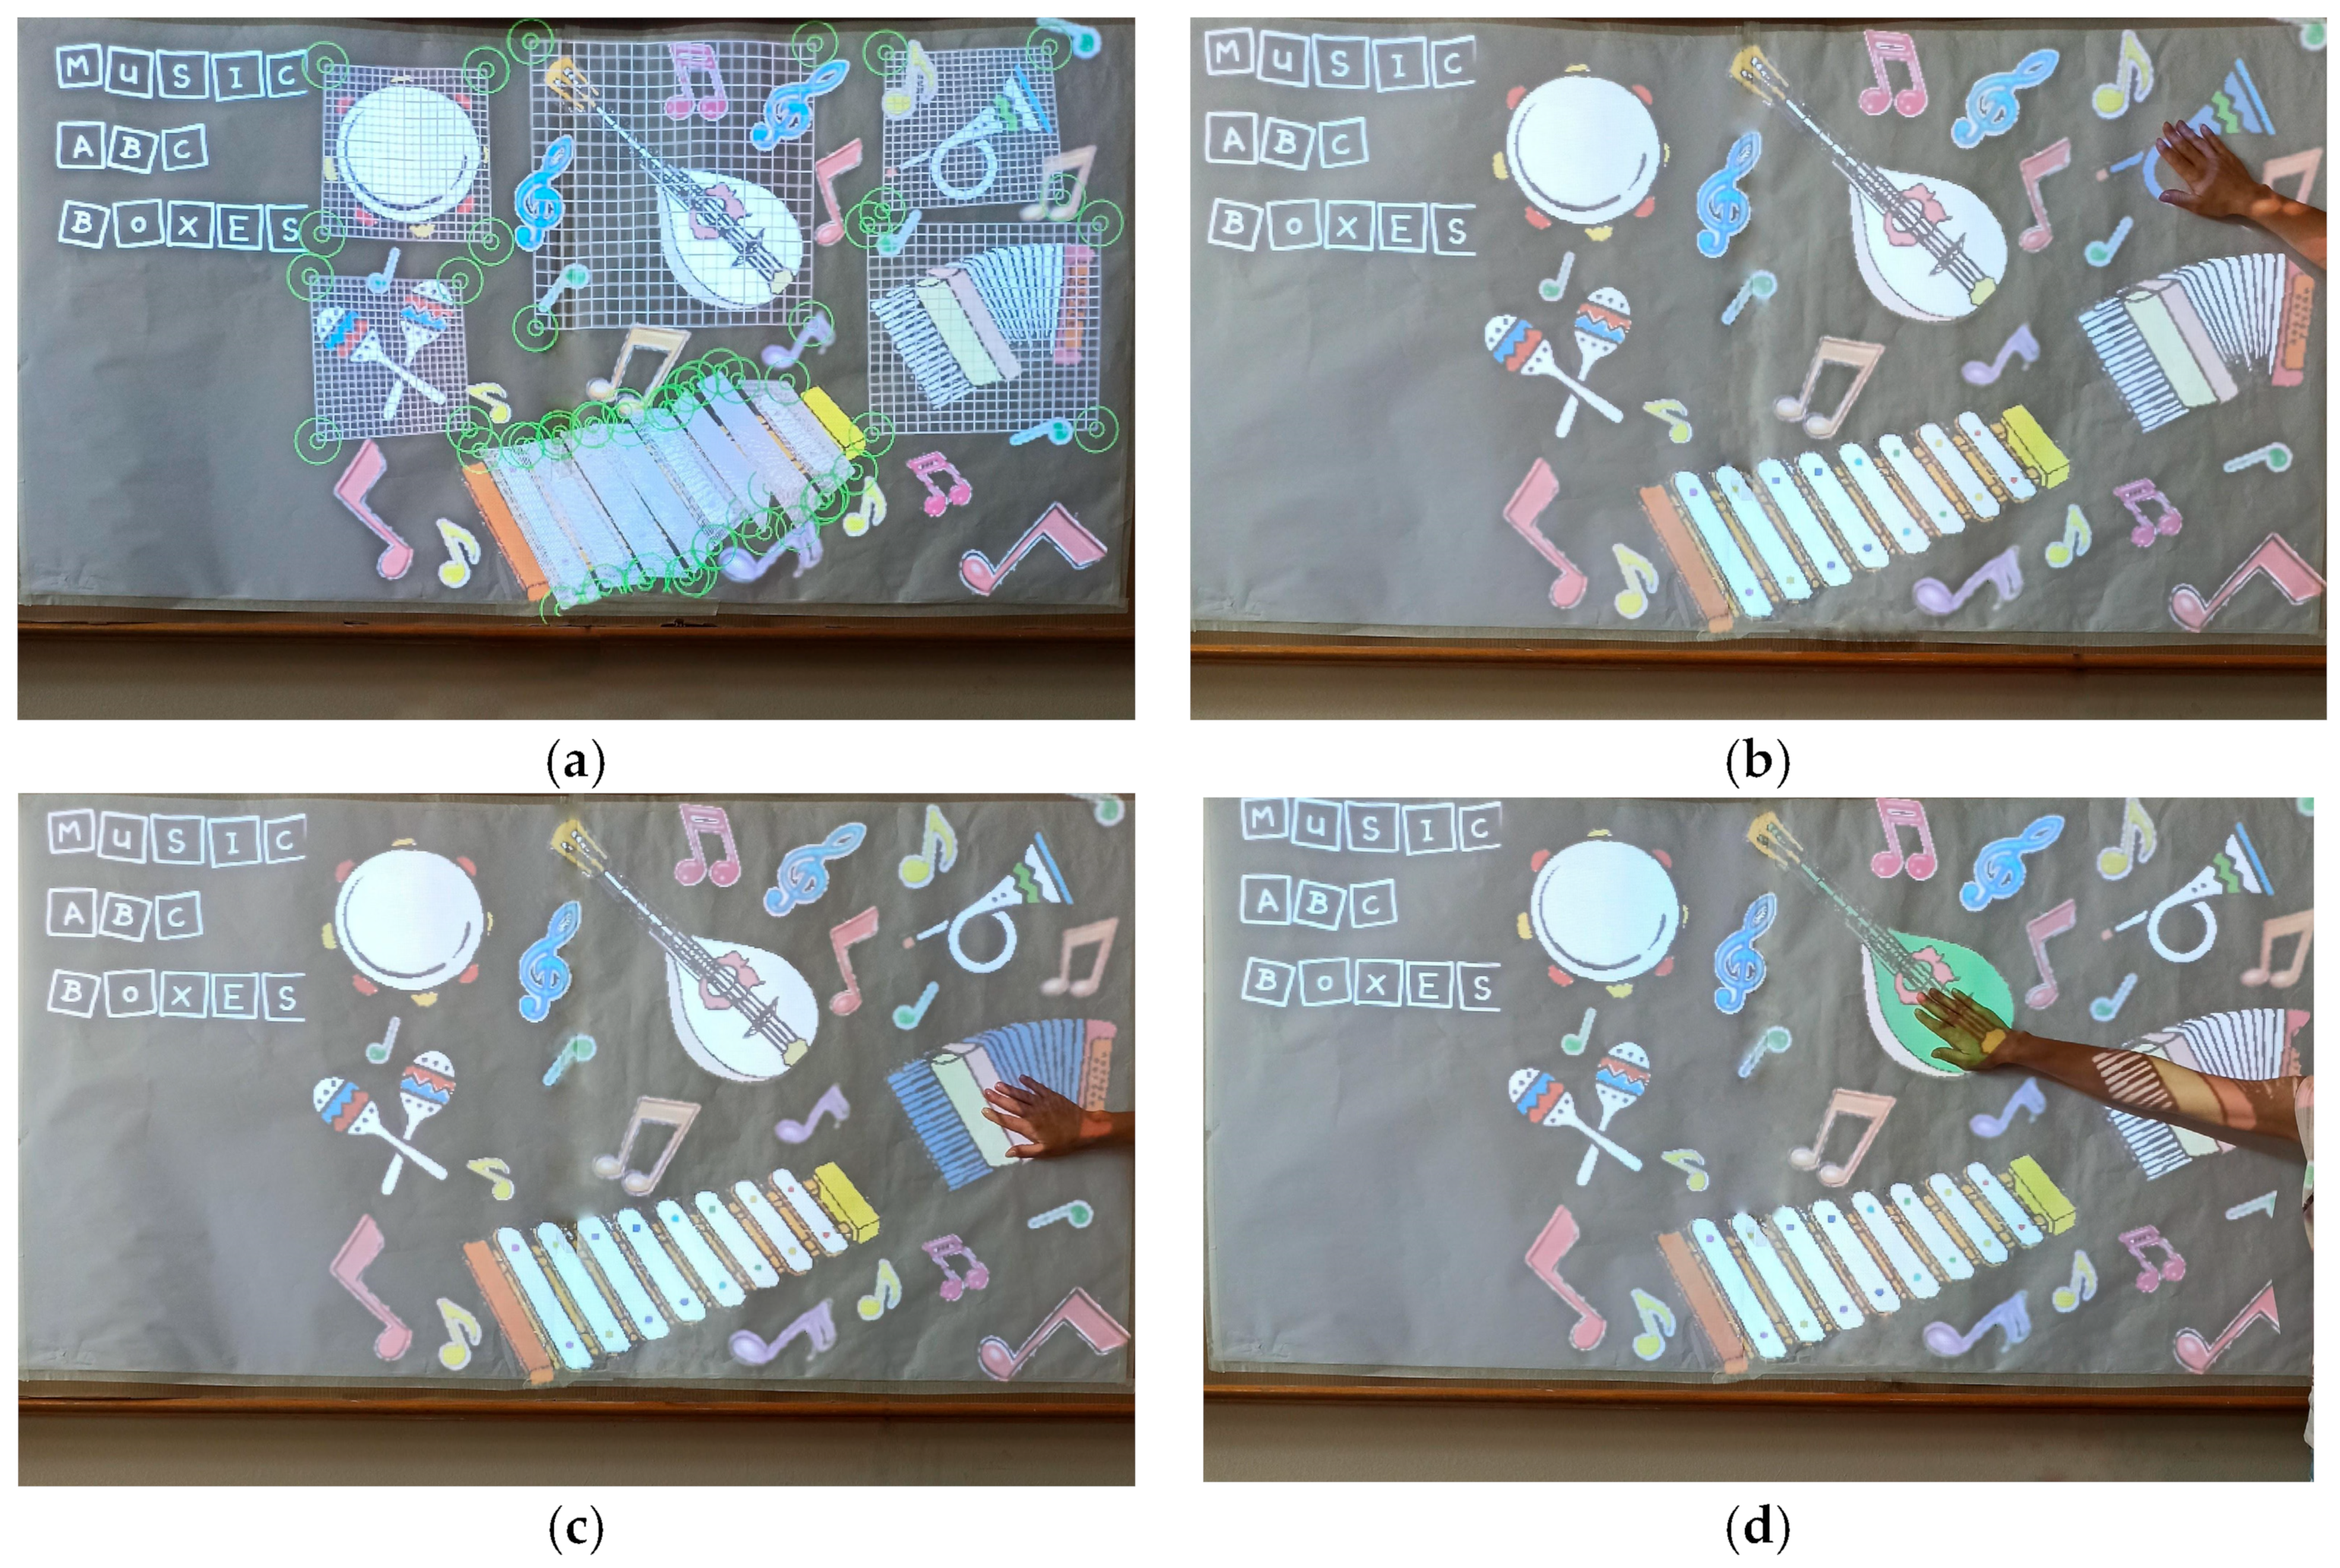
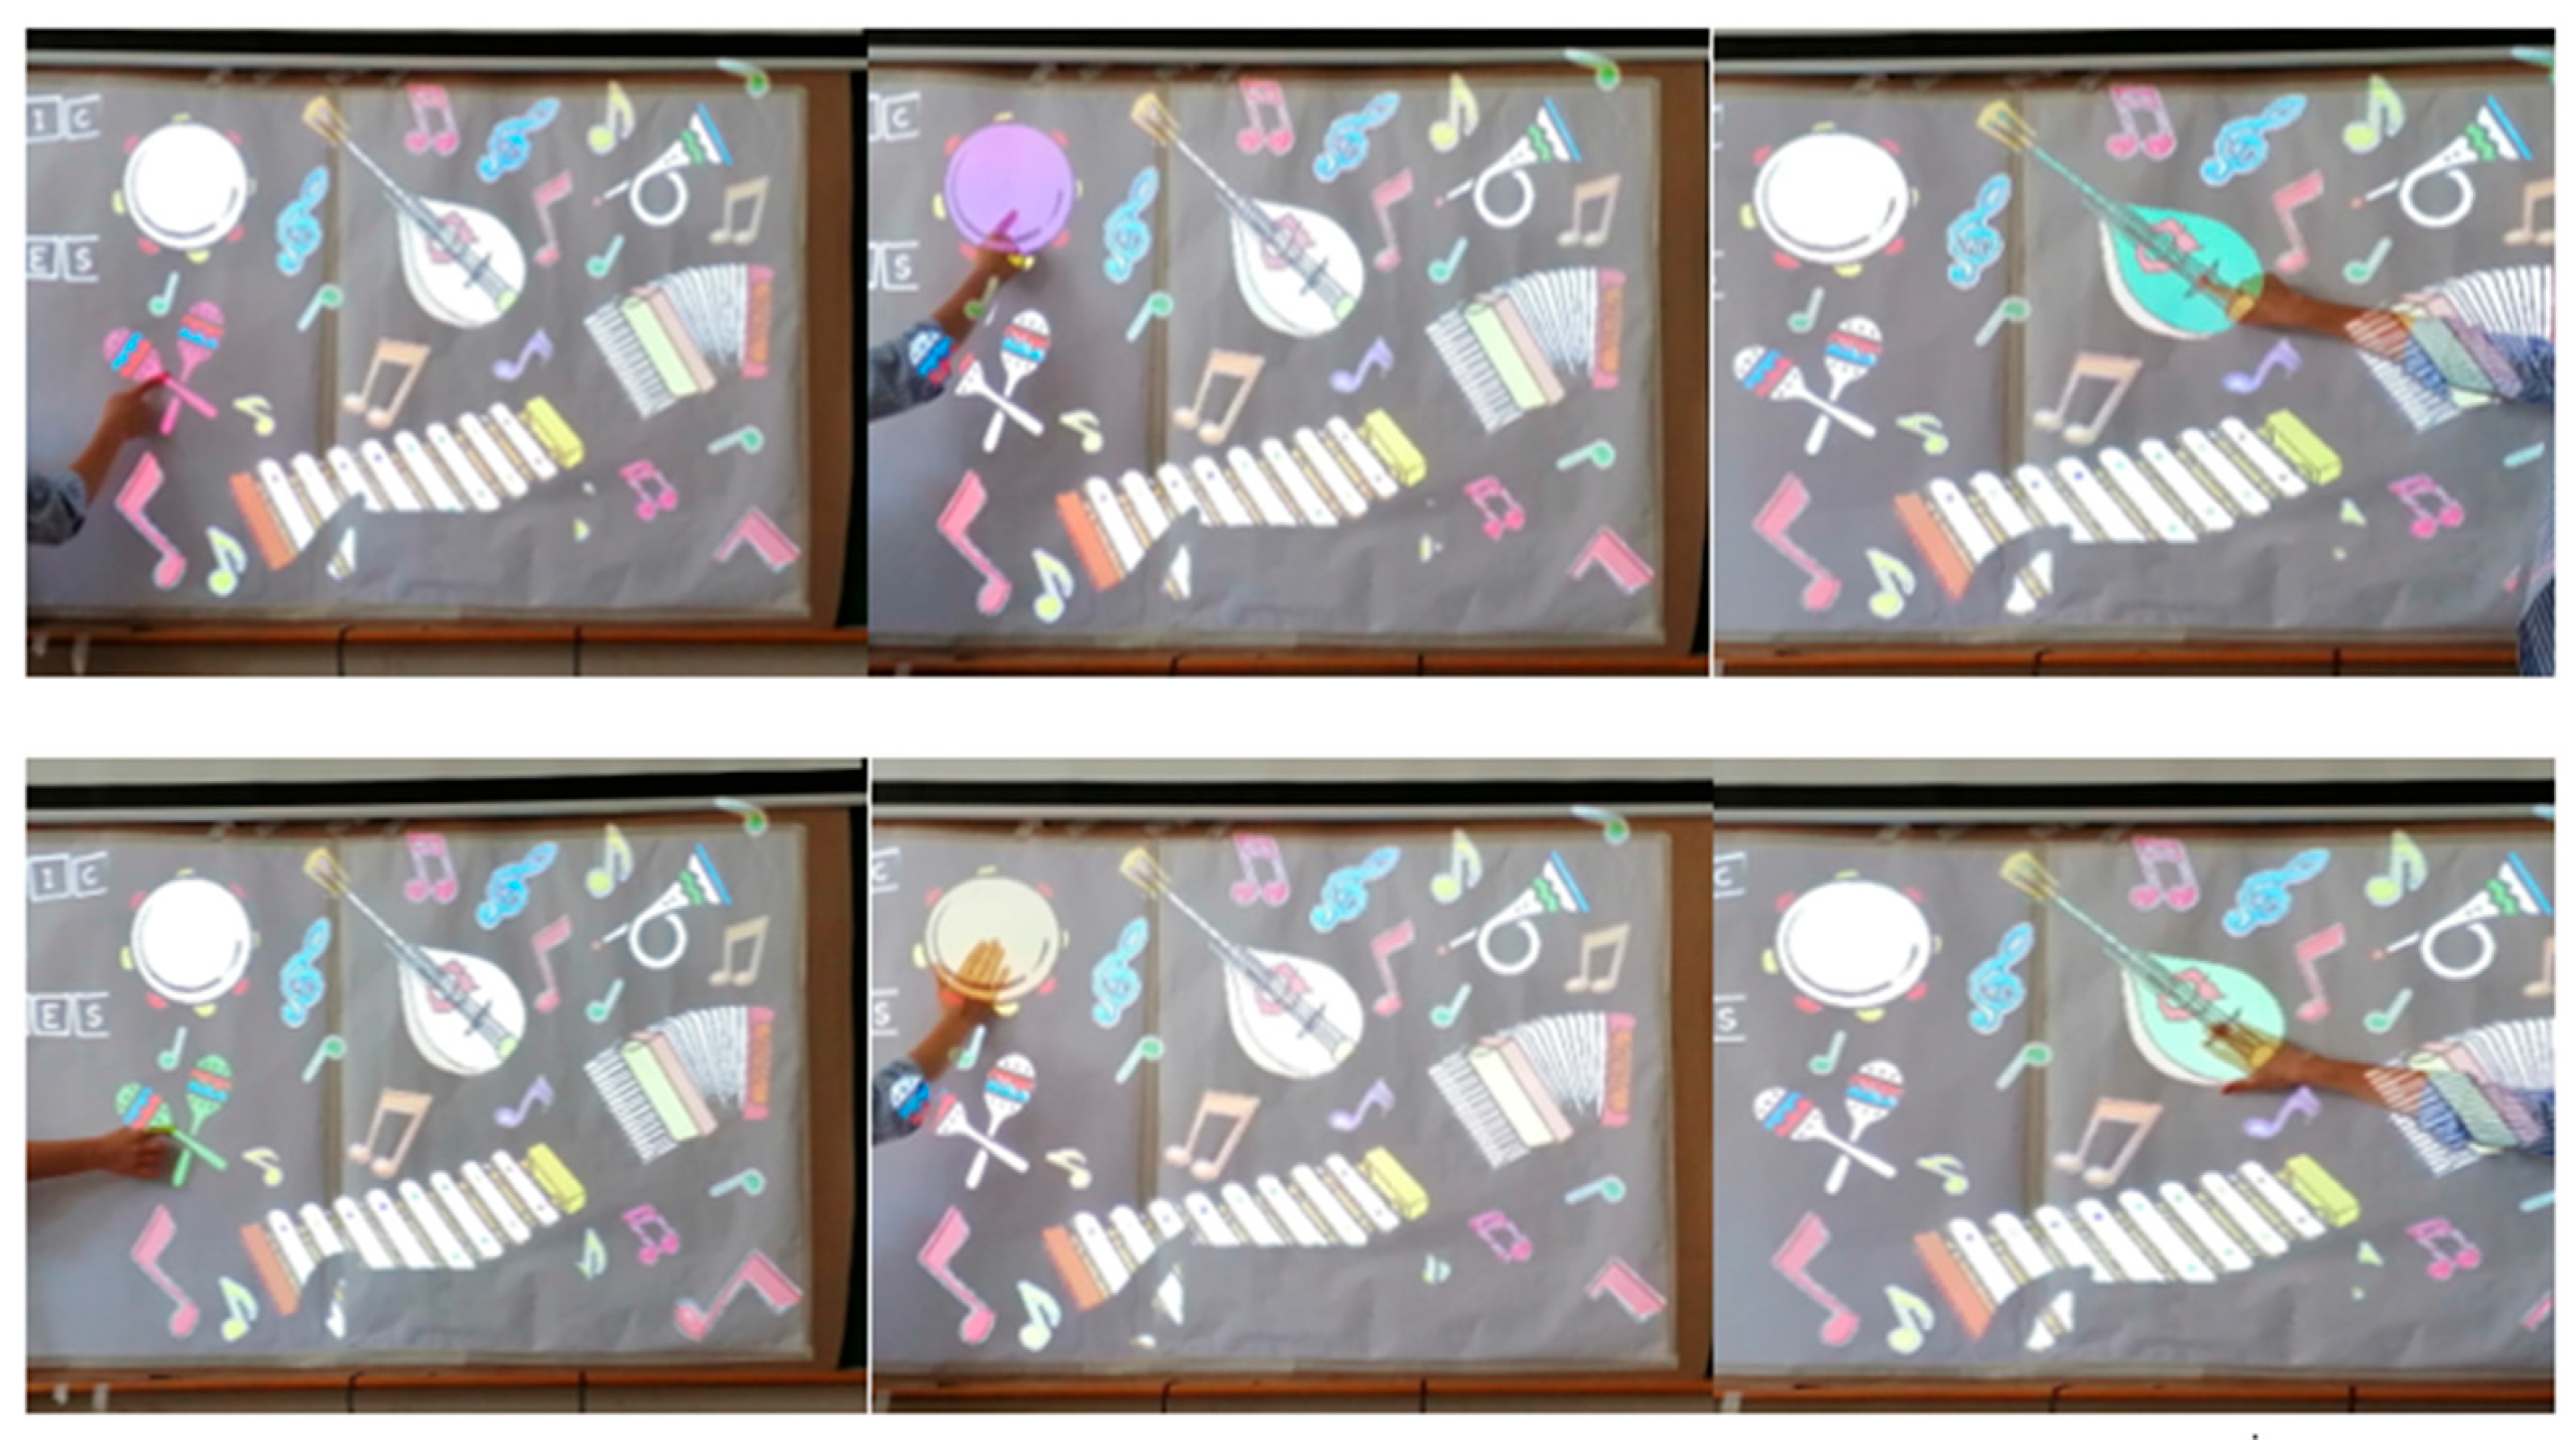
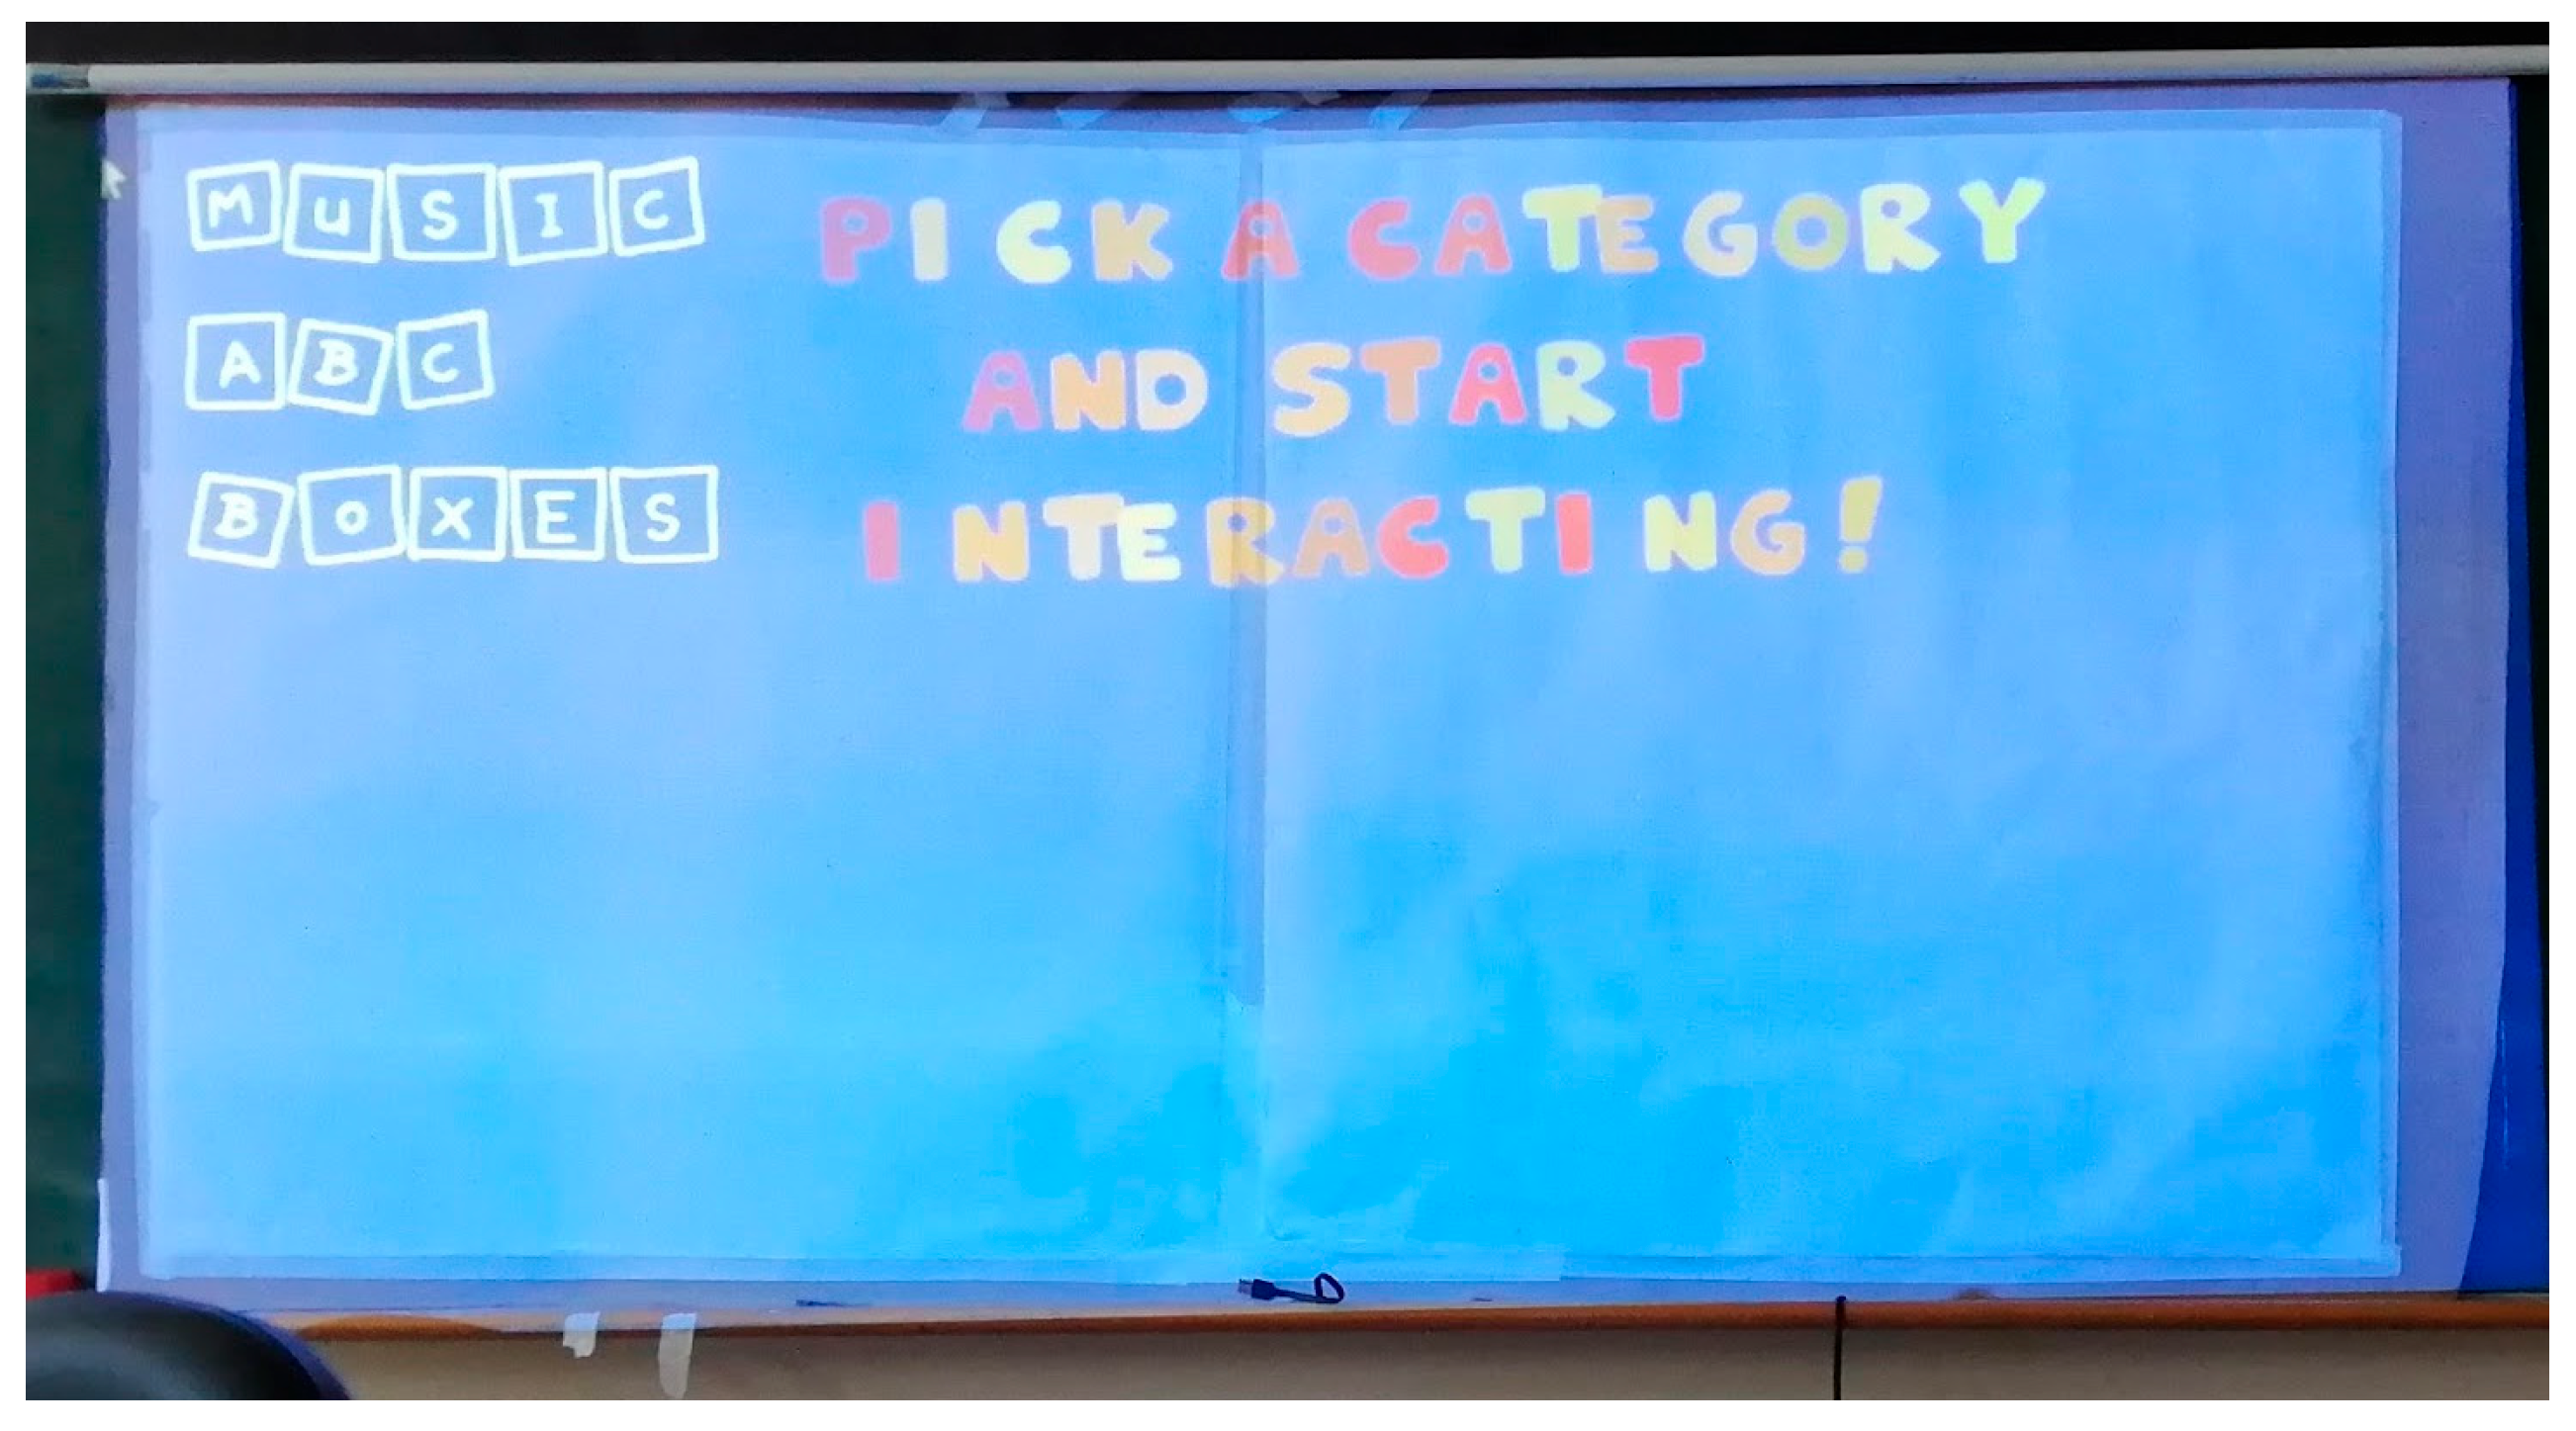
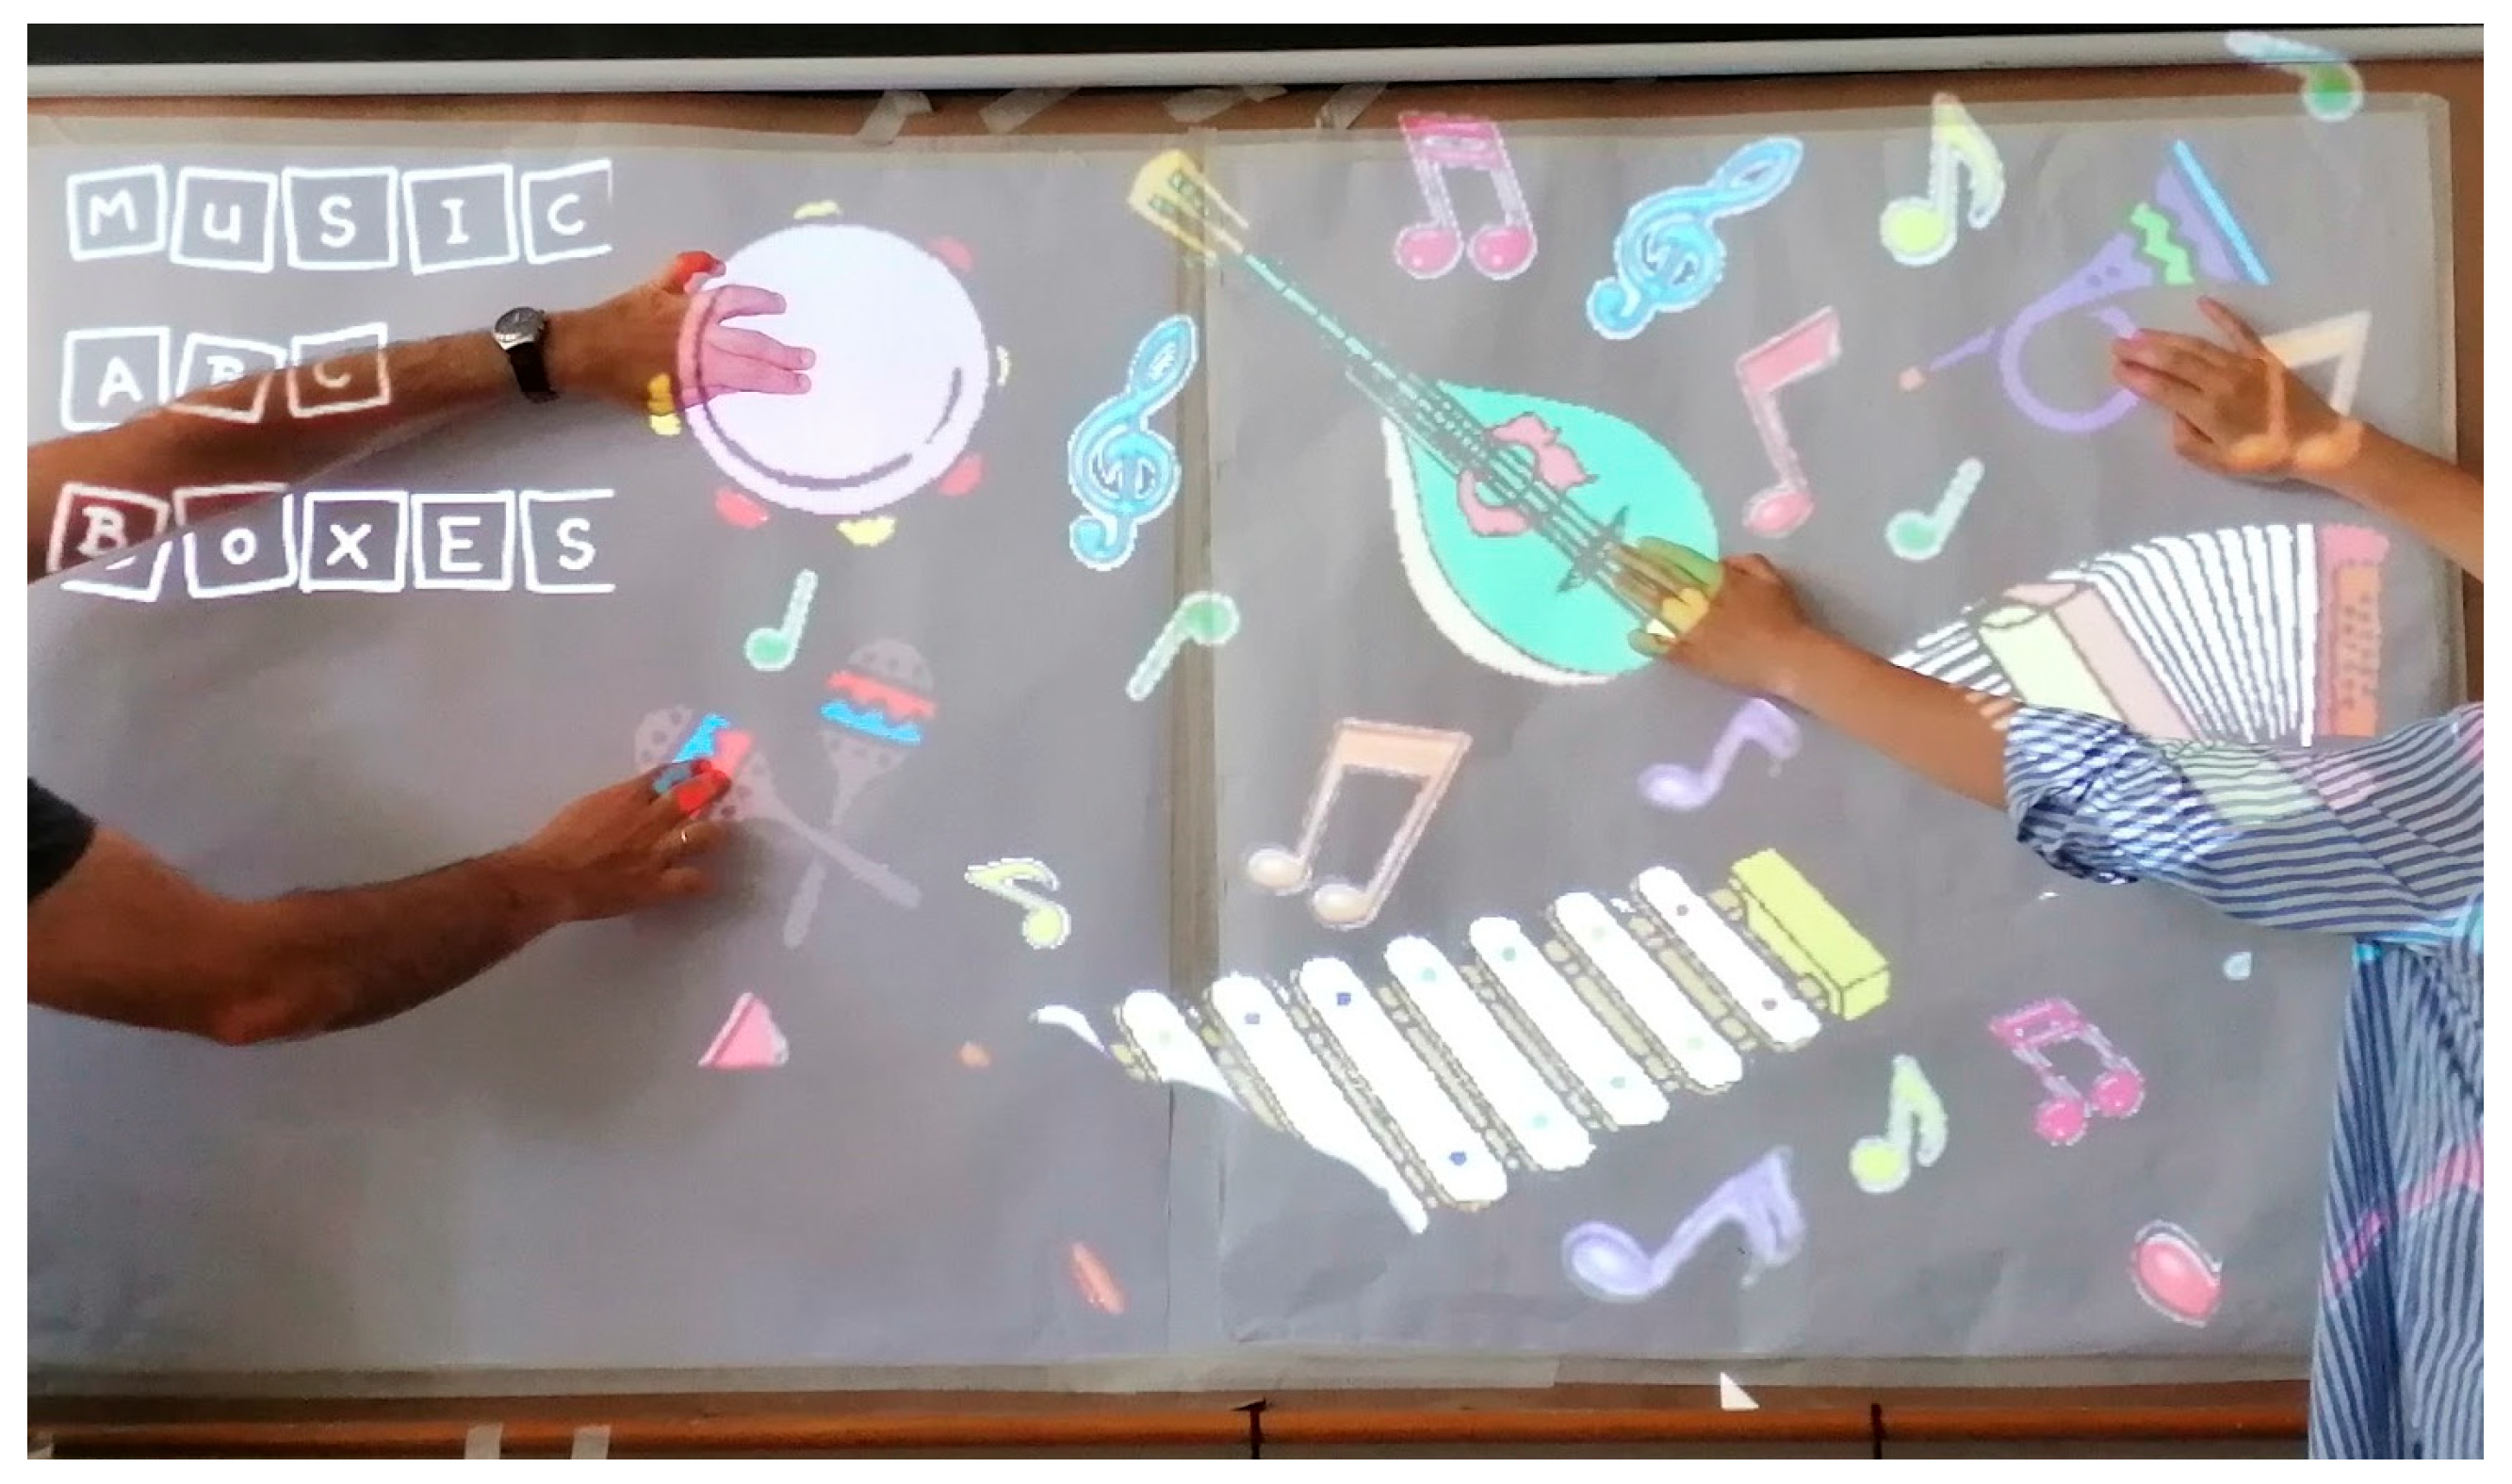
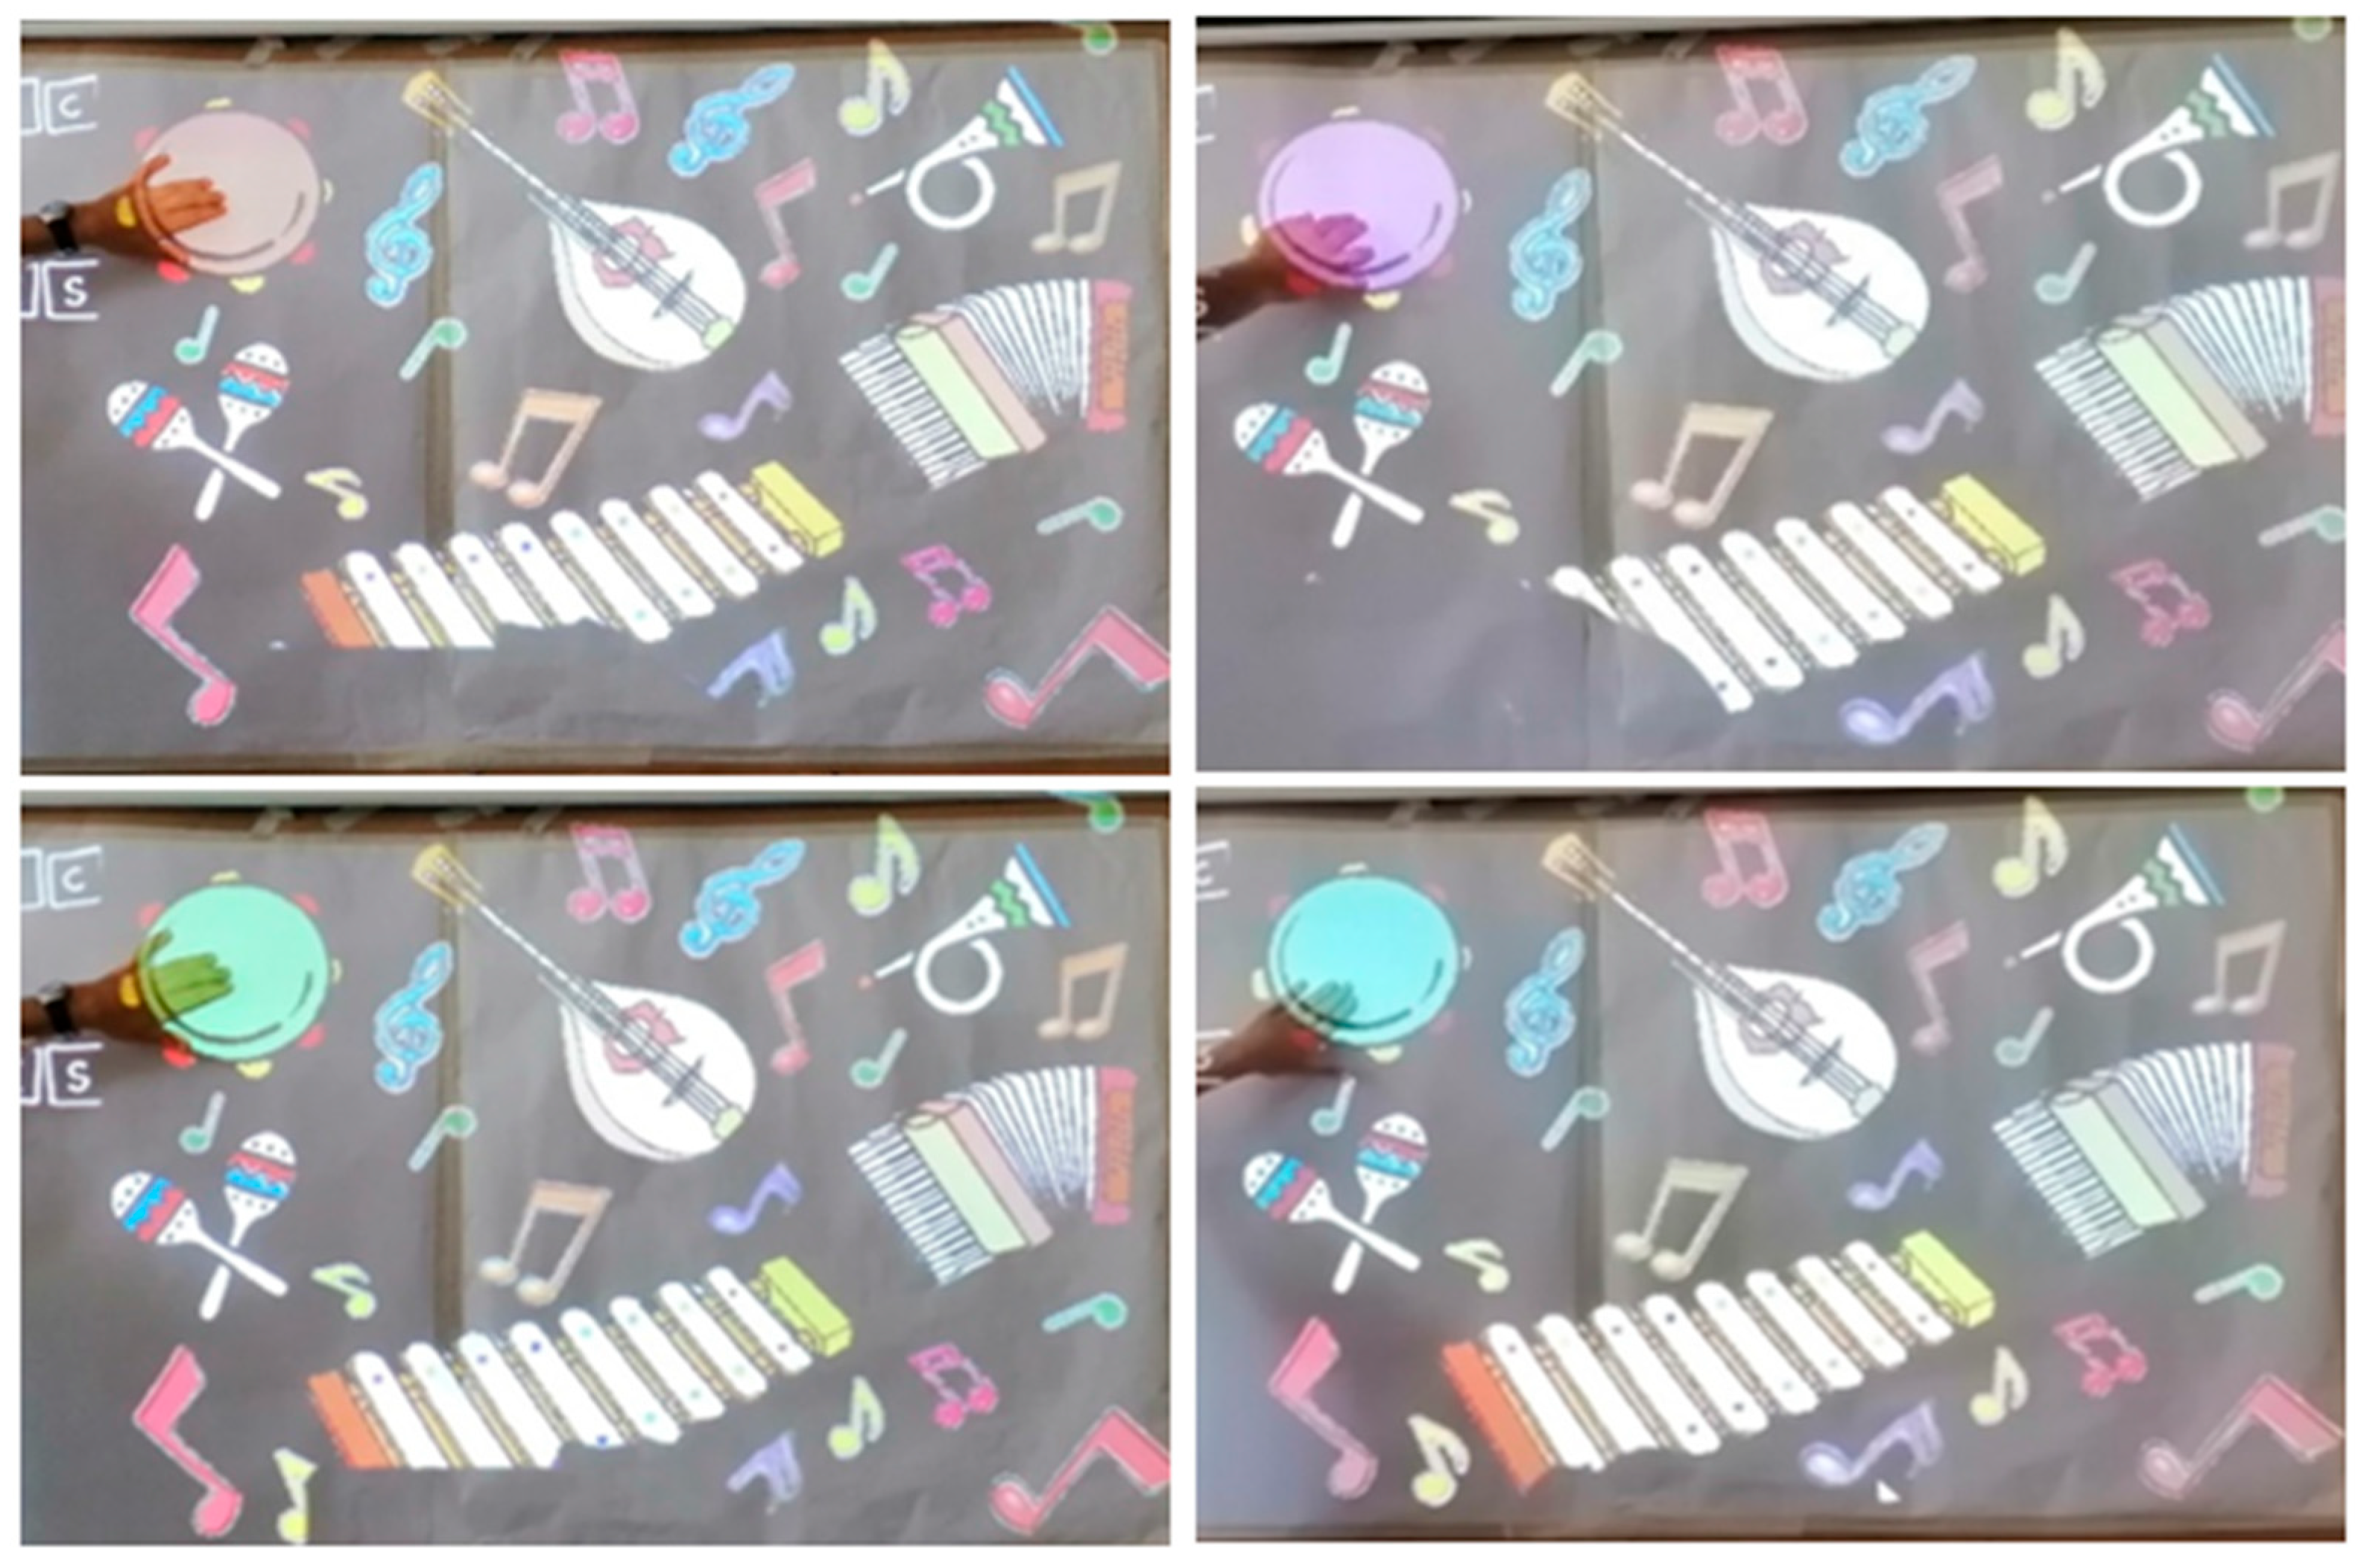
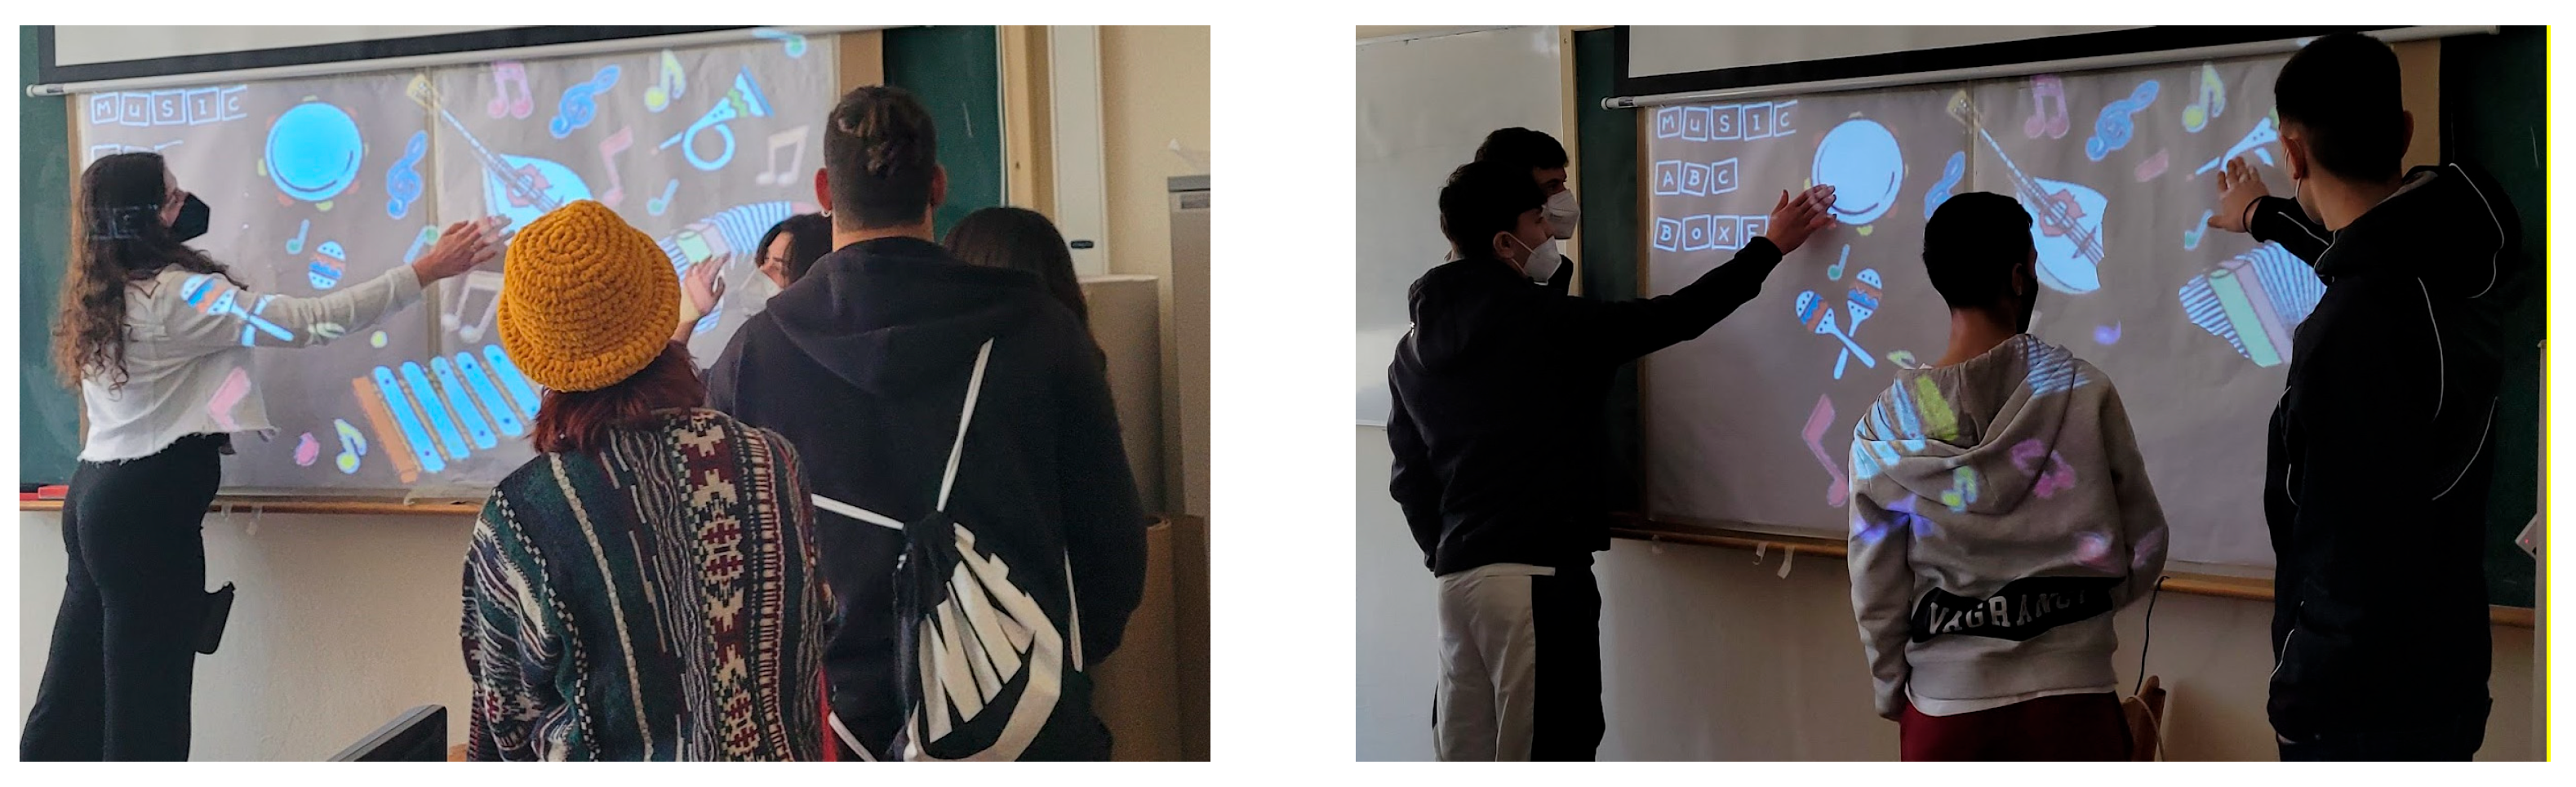
  • Scenario 1: Music Wall with six different music instruments
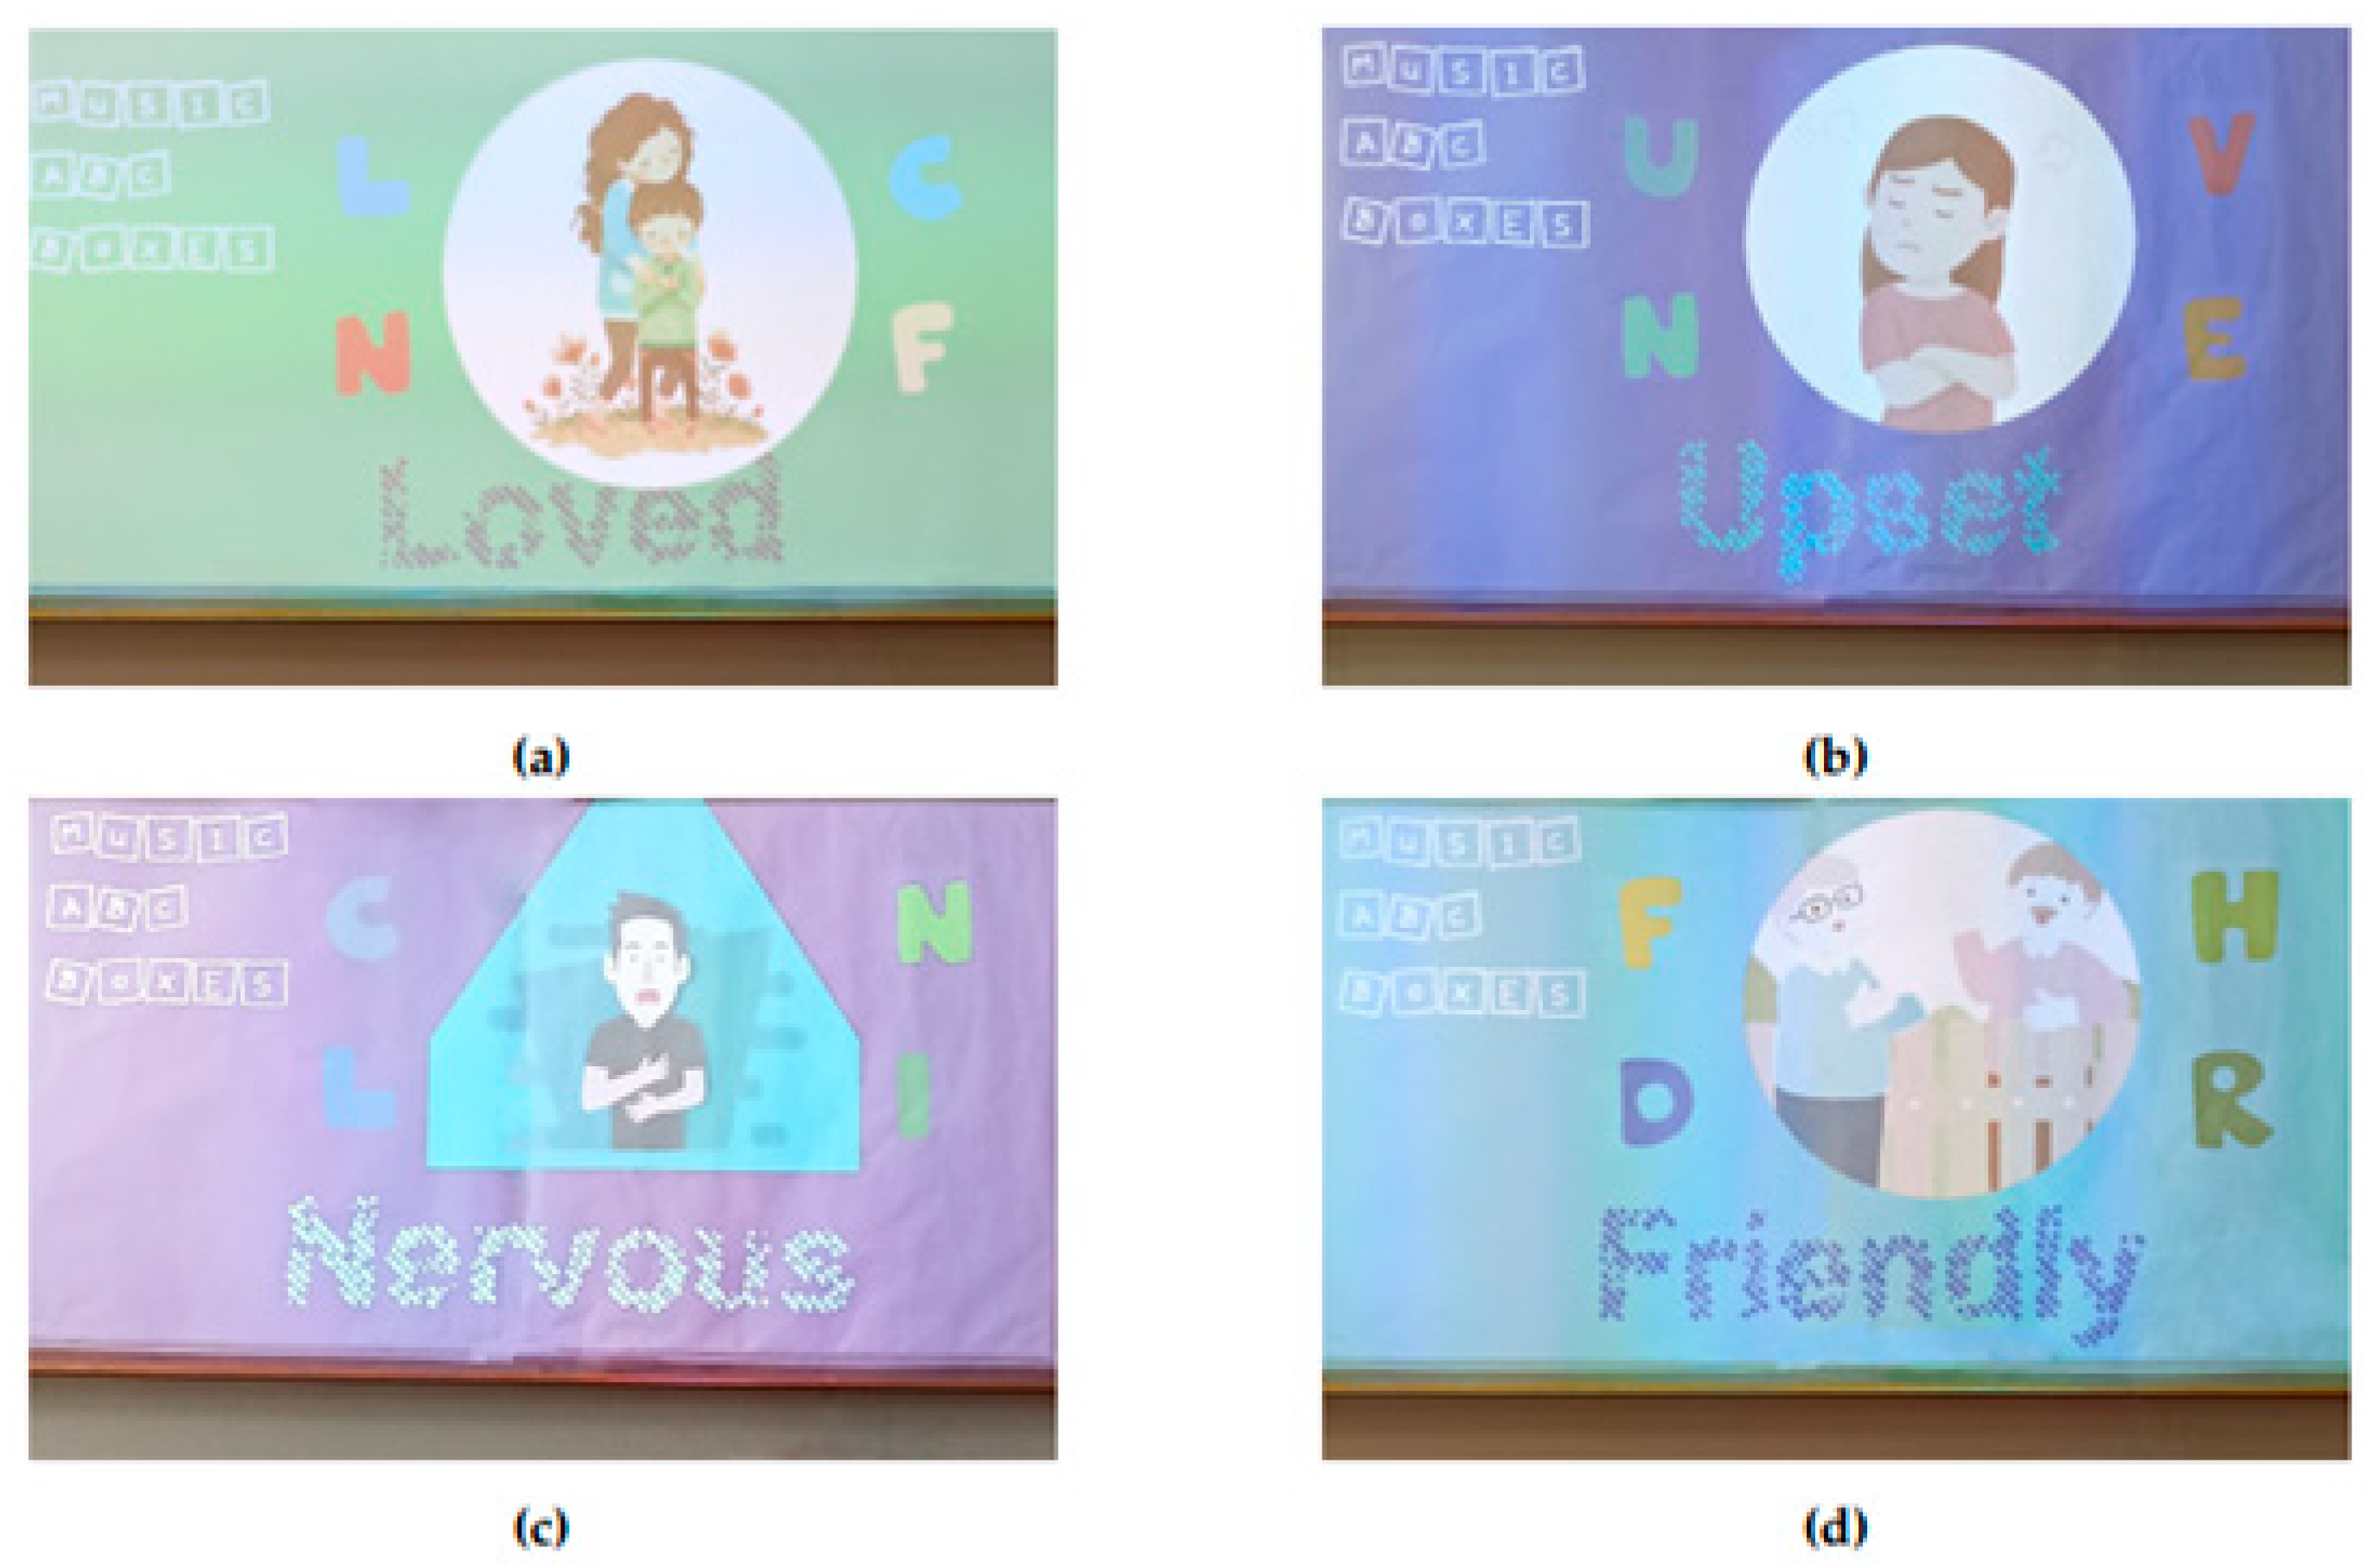
  • Scenario 2: English Alphabet Wall
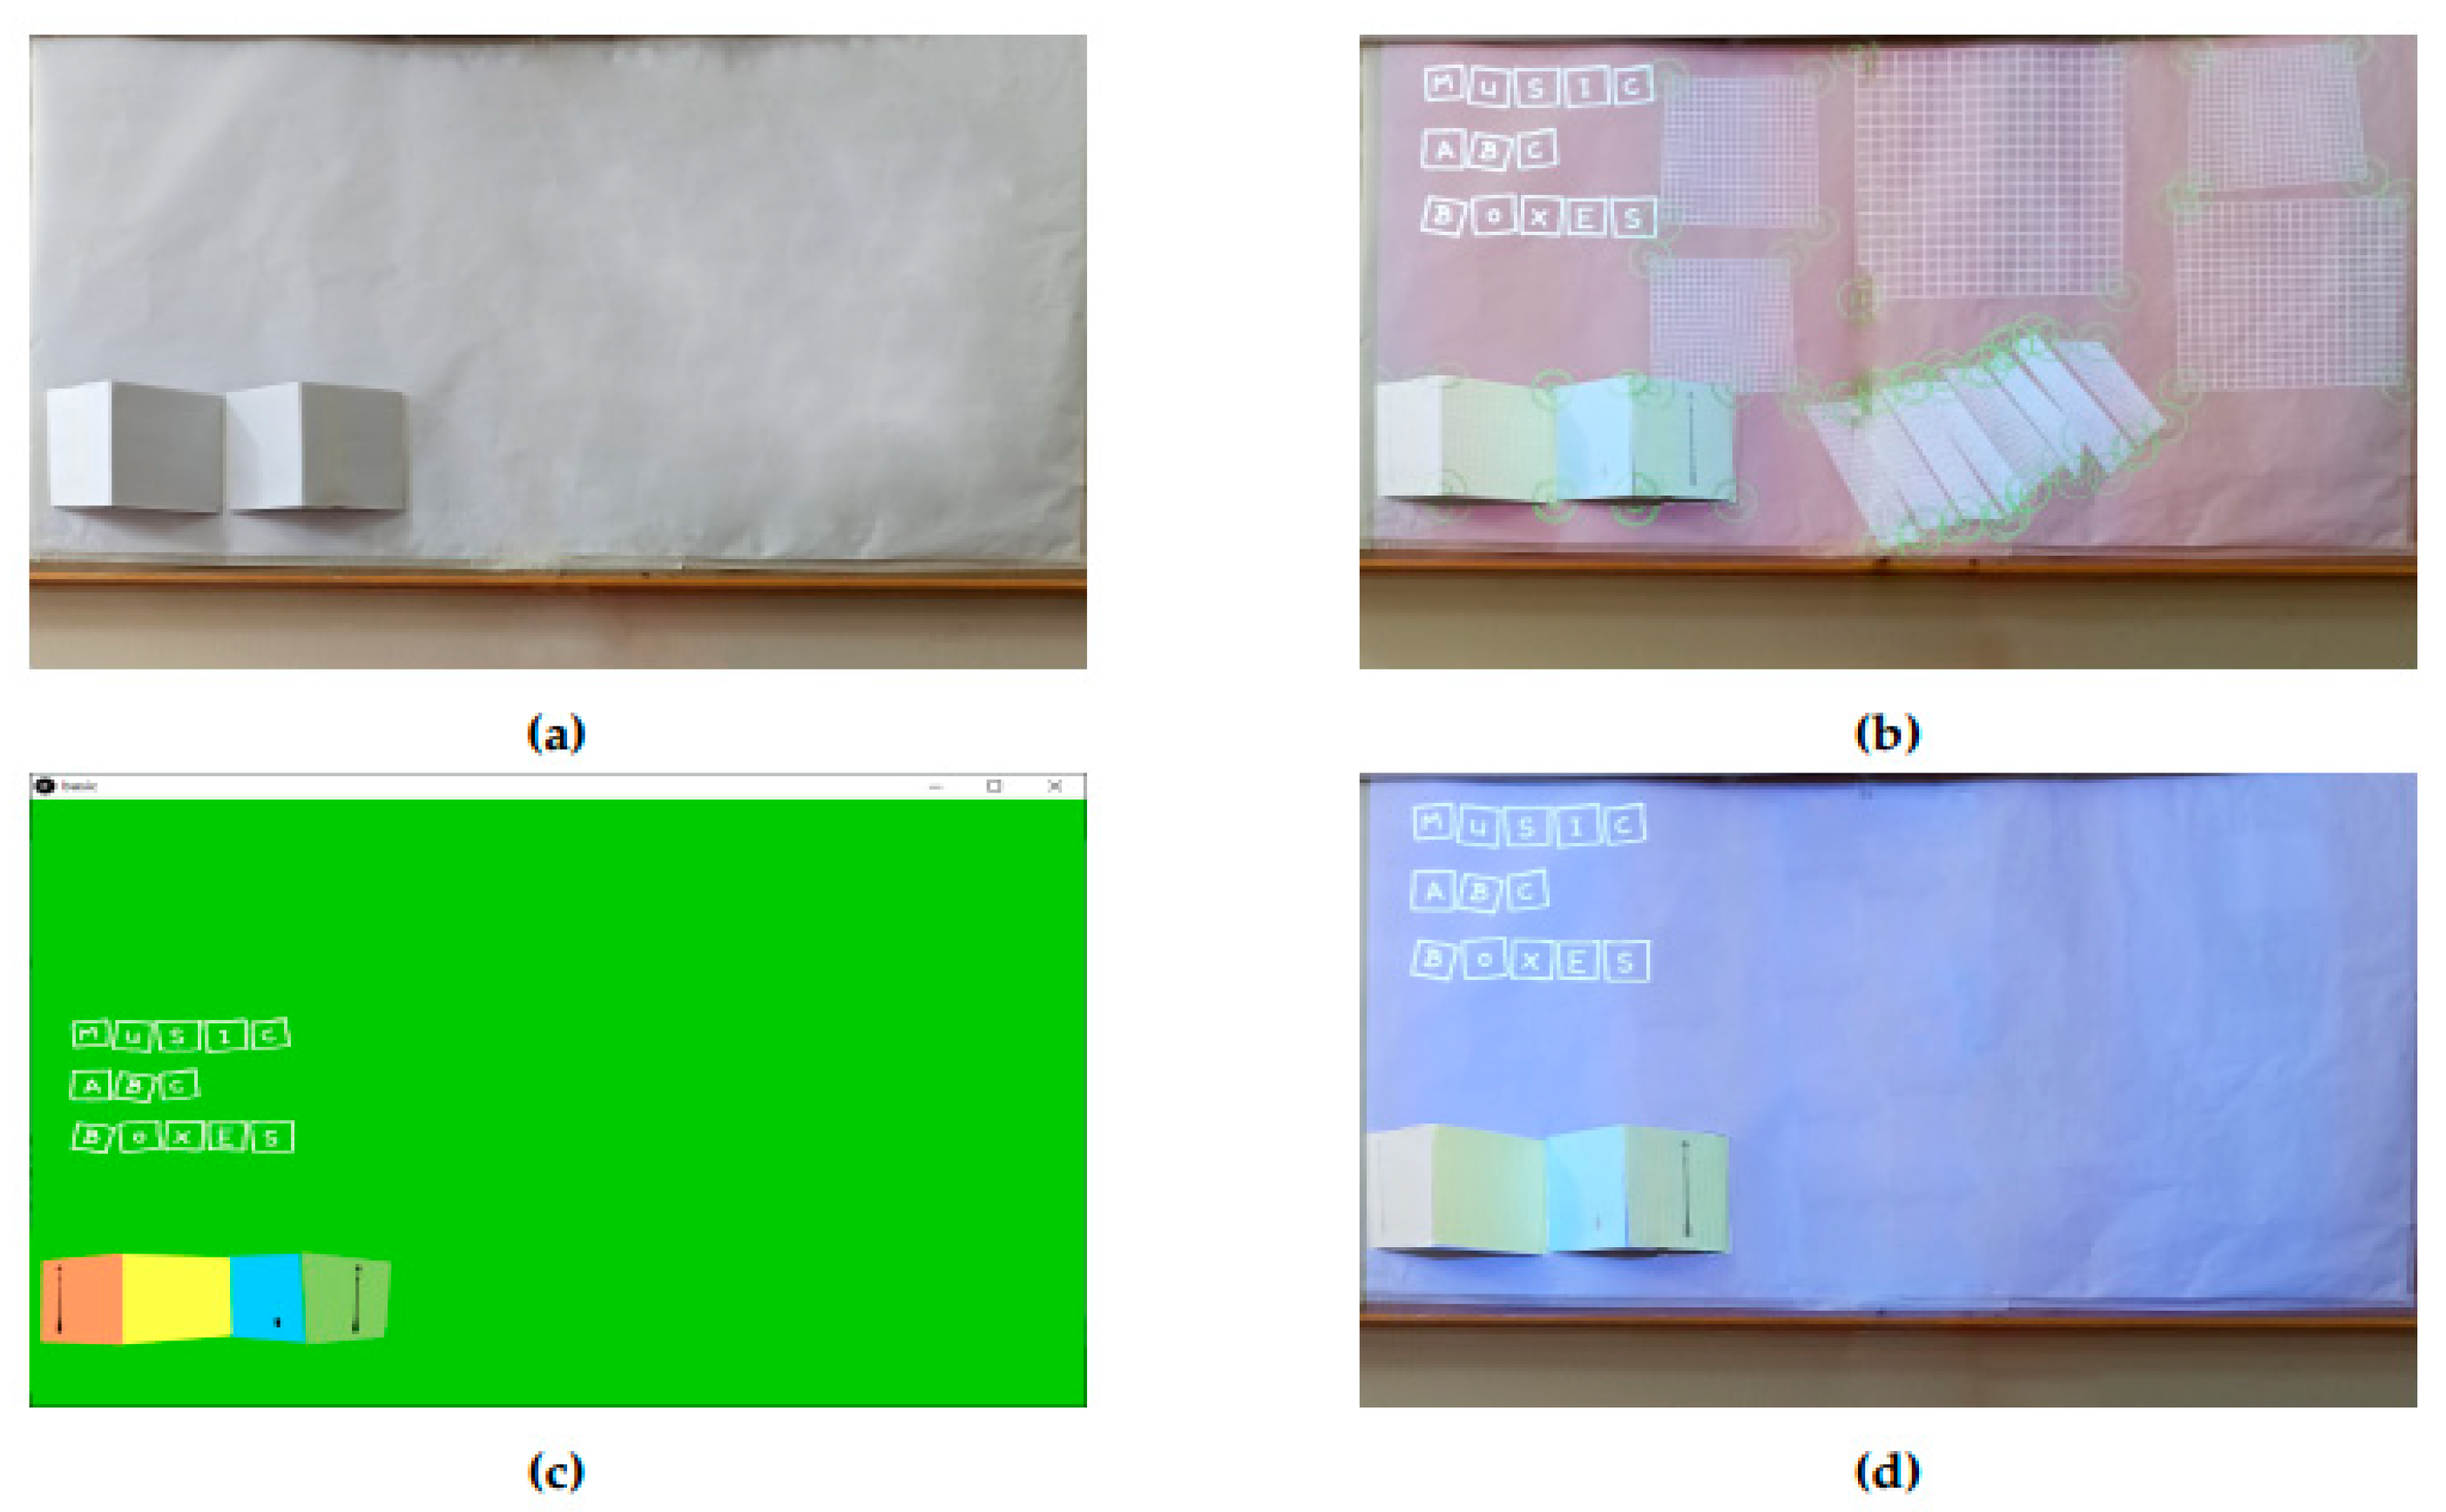
  • Scenario 3: Non-Interactive animation based on projection mapping
In our case, the total number of sensors on the tangible surface are sixteen and are grouped according to the performed scenario, each time. The scenarios are interchanged via a three-button menu at the first level of the surface; one button for each scenario. For example, when Scenario 1 is activated by pressing the associated button, thirteen different interactions are enabled at the second level of the surface. The same sensors are also available for Scenarios 2 and 3, so the total interactions that can be potentially supported over our surface are thirty-nine. However, not all of them have been enabled, since it was the authors’ choice for each scenario to demonstrate a different number of interactions to the users. So, thirteen interactions are enabled for the first scenario, four for the second and none for the third one. This layered architecture of the second level of the surface, also spares the inputs of the microcontrollers since each touch sensor does not need to correspond to just one action. The distinction between layers is achieved via software. Hence, in the current version of the proposed surface three different layers of operations are supported at present, one layer for each menu button. For each layer, as it was mentioned, up to thirteen different actions can be supported. With one more menu button, one more layer of operation with the same number of actions could be supported, etc.
As it was mentioned in Section 3.2.1, the implementation is based on the Client-Server paradigm: as Clients act two Esp32 microcontrollers and as a Server a PC running the Processing software. Initially, when the association of microcontrollers with the WLAN network is successful, a message is printed on the serial monitor with the IP addresses assigned to them by the access point. The microcontrollers use the IP address and port number assigned to the Server for communicating with it. Running the Clients and the Server in the same network, definitely simplifies the communication among them. The microcontrollers are responsible for receiving the status of each touch sensor (sensor touched, sensor released) and sending it to the server. On the other hand, when the server receives the touch events, it manages each interaction and orchestrates the projection of the respective audio and multimedia content over the second level of the surface.
Figure 11 illustrates the interactions considered for Scenario 1. The Scenario starts when the user touches the corresponding button in the Menu Area. Then, a Music Wall with various available instruments is projected in the Working Area and the thirteen designated touch interactions are enabled. Whenever each of the thirteen sensors is touched, a sound is played-back, and some colors appear on the sensor area with projection mapping. Figure 12 and Figure 13 illustrate the interactions that have developed for Scenarios 2 and 3, respectively. Scenario 2 activates four touch sensors and Scenario 3 none.
As it was discussed in Section 3.1.3, due to the ‘prone to noise’ nature of our touch sensors, all readings from the sensors are filtered via a median filter with window size of 20 samples. This eliminates the outliers in a certain degree and makes the readings very reliable. The output of this filter is stored into a variable and when its value is less than the threshold already set, the microcontroller understands that a sensor has been activated. As it is shown in Figure 14, the sensors implemented in the final construction return values close to 40 when they are not touched (Figure 14a). On the contrary, when they are touched, the values they return decrease close to 13 (Figure 14b). After several tests it was decided that the appropriate threshold for safely differentiating a sensor touch event from a sensor release, was the value of 30. A separate variable is assigned to each touch sensor, so the server can identify the sensor that its status has changed.
As the sensor values are read continuously, it was necessary in the implementation to find a way to avoid debouncing and understand the prolonged touch events on the sensors. In our implementation, a prolonged touch of a sensor is treated as a single touch and not as multiple, so every interaction with our Server remains active as long as a sensor is touched. In order to properly recognize touch events, release events and prolonged touch events, over our sensors, the two following checks are performed: (a) threshold check and (b) counter check. As it was previously discussed, the threshold differentiates a touch event from a release event. In addition, a counter is used as a flag to keep only the first reading from the sensor and ignore the rest, until the status of the sensor changes again. This way a prolonged touch of a sensor is treated as an individual one. Figure 15 depicts the algorithm that determines when a touch event or a release event is sent to the server. When the reading from the sensor is below the threshold and the counter equals zero, a touch event is sent to the Server. Then the counter increases to 1 so all next sensor readings with values below the threshold are not communicated to the Server. A release event is sent to the Server only when the reading from the sensor is above the threshold and the counter equals 1. Then the counter decreases again to zero so only one release event is sent to the Server.
Figure 16 illustrates the behavior of the system across distinct and prolonged sensor touches. In the left side plot, two distinct touches are made over a sensor and hence two curves with sensor readings less than 30 are captured, respectively. We observe the response time of the sensor to reach its minimum value, which depends on the pressure that is exercised over it and how it is exercised over time. In the right plot it can be seen that the touch is one but longer in duration. This represents a prolonged touch of the sensor.
Figure 17 illustrates the result of the counter flag in our implementation. In the left plot of Figure 17, the counter flag is not used, so a large amount of touch and release events are recognized by our system. On the right plot of Figure 17, the use of the counter flag helps our system to differentiate distinct from prolonged touches and releases, so the amount of touch and release events that are recognized are far less. As we can also see here, the first values obtained in each touch event differ from touch to touch. This is again due to the level of pressure that is exercised on the sensor with each touch. The use of this counter flag also enables our surface to accommodate several users simultaneously since it enhances the availability of the server.
Figure 18 and Figure 19 illustrate the Finite State Machines (FSM) for our Client and Server, respectively. The value sent by the Client to the Server after each touch event is unique for each sensor, so the Server is able to activate the corresponding multimedia content. In Figure 19, with x1 the sensor touch is represented and with x2 the sensor, the release events, respectively.

4. Results

4.1. Use Cases

As happens with applications that involve projection mapping, the alignment of projectors with the projection area is critical since this type of application is supported by the illusion it provides to the user. So, several tests were performed before the optimal position and orientation of both projector and tangible surface, were found. Also, the displayed content was tested in many different layouts to find the best one. Then, the content was mapped using Processing with the touch sensors of the surface, so each sensor matches to the corresponding interactive content. The tests were completed, and the position, height, and orientation of the projector were noted on the floor of the room for easy repositioning for future use. The audio playback was achieved through the speakers of the computer unit, which was quite convenient. Initially, the computer’s USB ports were used in the test application to power the microcontrollers. However, this was not possible in the final deployment as the personal computer was placed at least two meters away from the dashboard and the microcontrollers. For this reason, power was supplied to the microcontrollers with the help of power banks, which were placed at the back of the construction along with the wiring and the microcontrollers. Figure 20 illustrates the welcome page of our application which calls the users to start interacting with it using the left-sided menu.
The first scenario that is demonstrated is called Music Wall and from Figure 21 one can easily understand what she/he is going to encounter. Our Music Wall consists of six interactive musical instruments (tambourine, mandolin, trumpet, maracas, accordion, and metallophone) projected by the projector over the tangible surface. The first five correspond to one touch sensor each, as opposed to the last one which uses eight, one sensor for each note of the metallophone. Figure 21a illustrates the mapping of each instrument with the corresponding touch sensor behind the white paper. Each touch sensor activates an acoustic and a visual interaction. The musical interaction corresponds to the sound of each musical instrument, and the playback is carried out with the help of the speakers of the computer unit. Visual interaction is achieved with the help of the projector and makes each object change color with each touch (Figure 21b–d). Figure 22 reveals the simultaneous use of our interactive surface by several users as it was discussed in Section 3.3. The music wall is a very interesting interaction game for children and adults, it is fun and at the same time easy to understand.
The second scenario (Figure 23) is based on the English alphabet and aims to let the children interact with the English alphabet, so they learn English words in an interactive way. This layer consists of four touch sensors each associated with a letter of the English alphabet. The letters are projected by the projector over specific areas of the surface and each time they are randomly selected. By selecting one of the four letters, the user reveals the corresponding word. Then, the word appears on the screen along with a related image.
The third and final scenario is not interactive and is dedicated to the projection mapping technique. Its aim is to demonstrate to the users what can be carried out with projection mapping on surfaces with different positions, angles, and inclinations in relation to the projector. To this end, a simple 2D animation downloaded from the internet was projected over a 3d construction made by cardboard and placed over our surface (Figure 24). The positions of the sensors used in the previous scenarios had also to be taken into account, so the construction did not cover the sensors and did not obstruct the use of the surface when another scenario is active. A part of the animation is projected on each board, and this gives the final result.

4.2. Evaluation

To evaluate the performance of the whole construction under different circumstances of use, we set up a small benchmark in our premises, emulating realistic user behaviors over the touch sensors. Figure 25 illustrates the touch sensors that were evaluated during this benchmark. Sensor 4 is the sensor behind the tambourine, Sensor 5 is the sensor behind the maracas, Sensor 6 is the sensor behind the mandolin, Sensor 7 is the sensor behind the trumpet, and Sensor 8 is the sensor behind the accordion. Each experiment was repeated eleven times and the values that are presented here correspond to the median value that was recorded for each set of measurements.

4.2.1. Touching the Sensors with One or More Fingers

In this experiment the sensors were touched at first with just one finger and then with four. Figure 26 illustrates this experiment. The results proved that our touch sensors are not sensitive to the number of fingers pressed on them.

4.2.2. Touching the Sensors at Different Frequencies

In this experiment the behavior of our sensors was tested when they are touched frequently. This is some kind of stress test for the sensors. To perform this experiment a common music metronome was activated and the success rate for each sensor at different beats-per-minute (bpm) of the metronome was recorded. Table 2 shows the results from the evaluation of Touch Sensor 4 and Figure 27 illustrates instances from this experiment. Similar results were recorded also for the other four touch sensors. We believe that the recorded mean success rate of 95% proves that our touch sensors behave sufficiently steadily for the use under consideration.

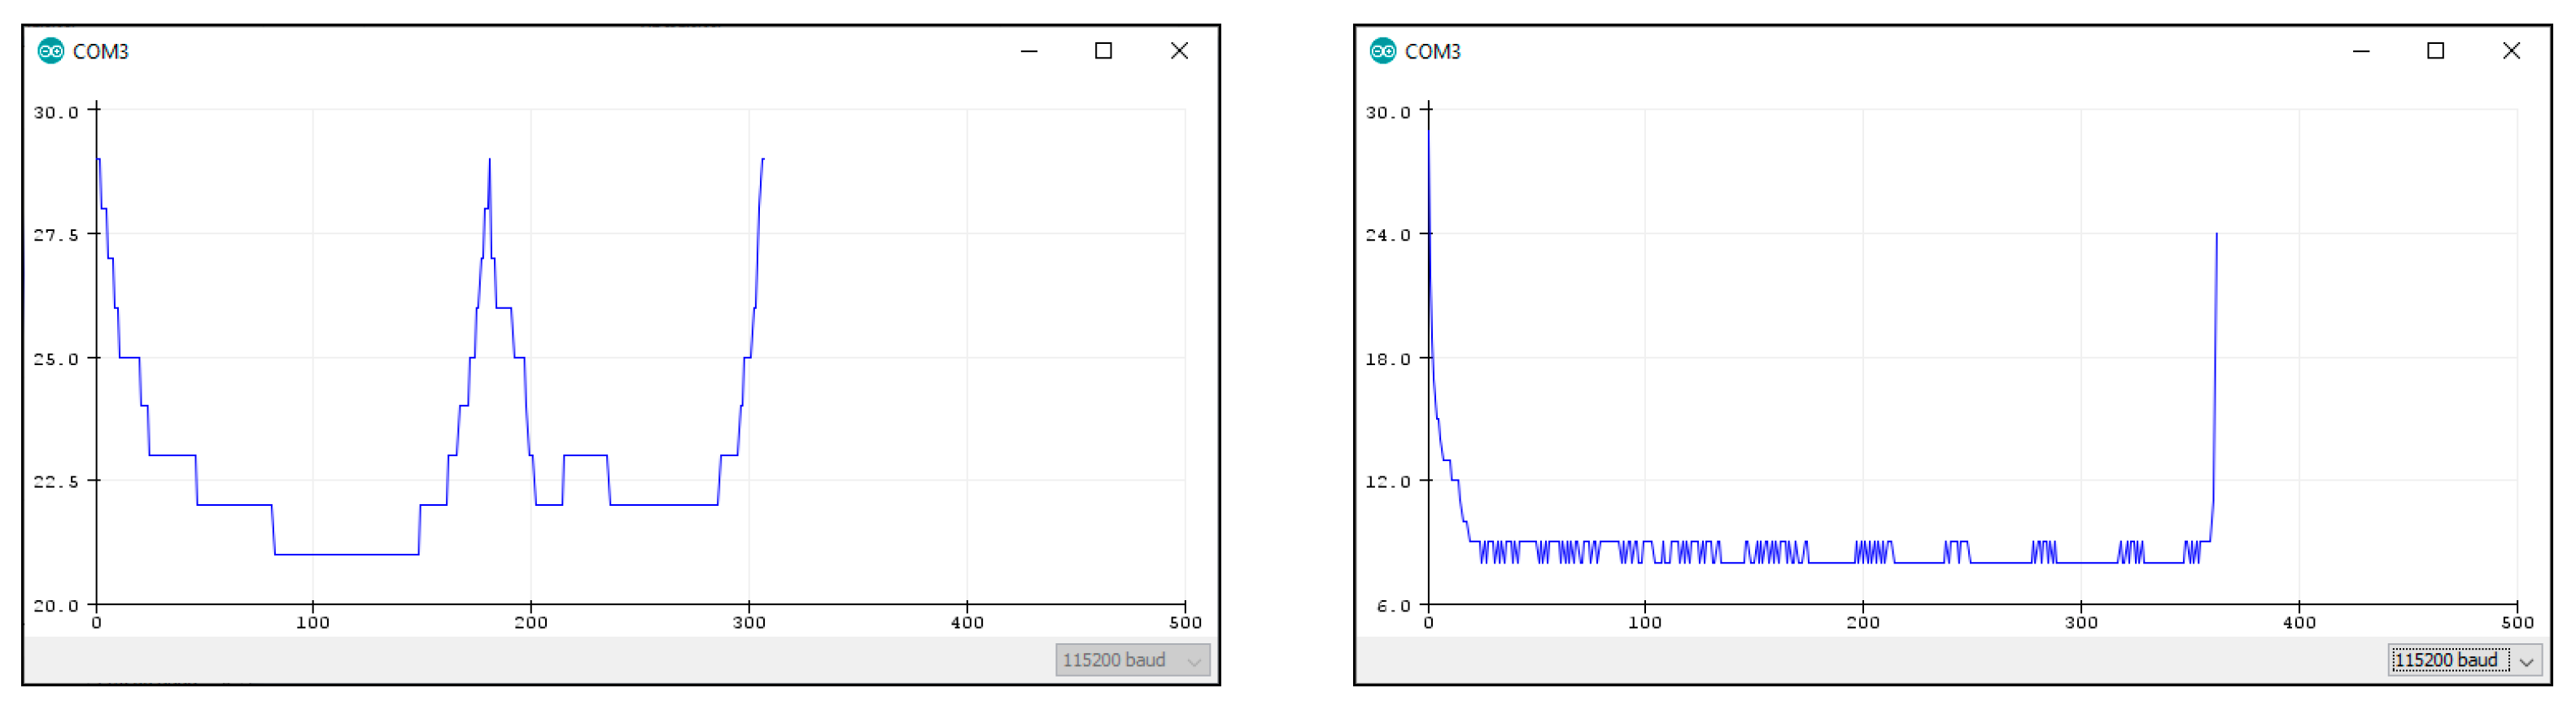
4.2.3. Touching the Sensors with Lighter Pressure

Considering that this implementation will be used by children among others, we wished to evaluate the behavior of the sensors when touched with lighter pressure. Table 3 summarizes the success rate for the five sensors under evaluation. The results show less sensitivity of the sensors when less pressure is applied over them. We still believe, however, that this performance is adequate for the intended use. The slightly different performance of Touch Sensor 8 is attributed to the fact that at this area of the construction the white paper has slightly unstuck and air has intruded between the sensor and the white paper.

4.2.4. Simultaneous Use of the Touch Sensors

The last experiment that was conducted was the evaluation of sensors when they were used simultaneously by several users. To this end, two users started touching the sensors together, so four sensors were activated in parallel. More specifically, three sensors were permanently touched when the same time the sensor under evaluation was repeatedly touched and released to measure its success rate.
Figure 28 illustrates instances from this experiment, in particular the evaluation of Sensor 6 under simultaneous use is presented. The results showed similar behavior of the sensors with their independent use (that is, a success rate of 95% for each sensor was recorded again).

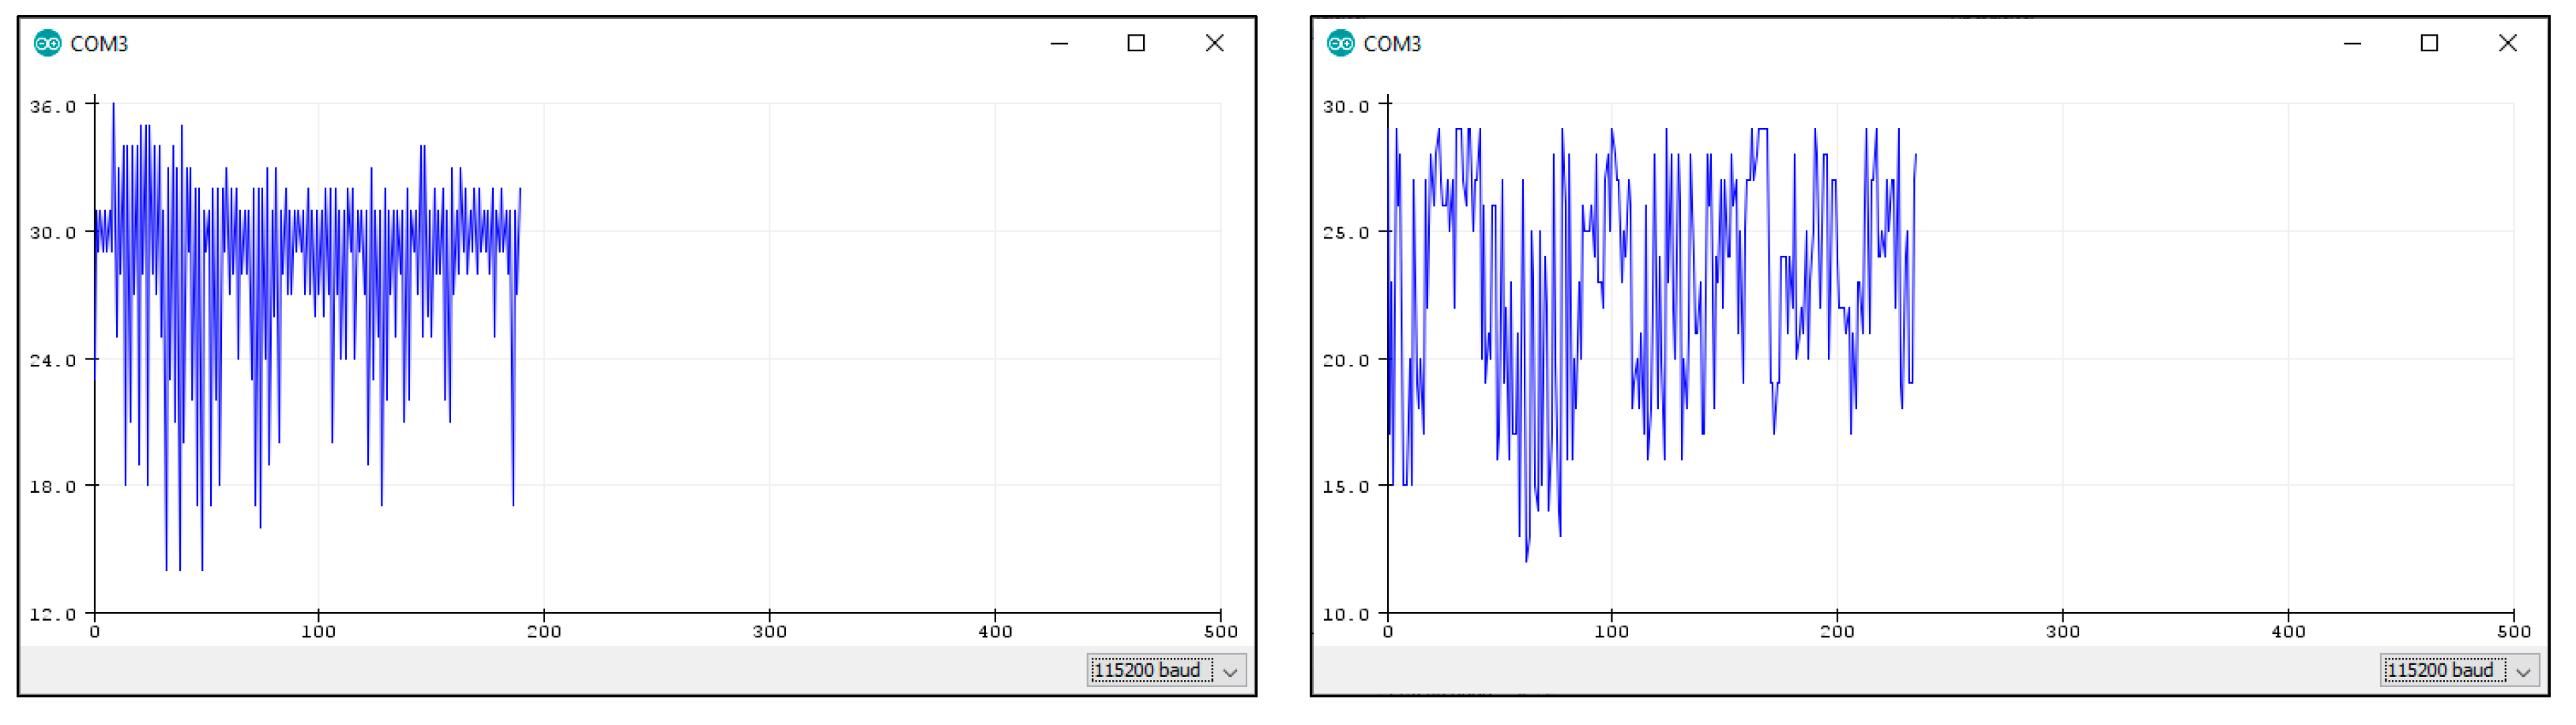
4.2.5. Comparison of Our Touch Sensors with a Commercial Touch Sensor

To compare the robustness of our touch sensors with commercial ones, we used a commercial 3.5” touch display, connected directly to our system, as touch sensor. We used a touch pen (see Figure 29) and proceeded 100 times by repeatedly pressing the touch display, while we repeated the same process for some of our sensors independently. The results recorded, showed a comparable behavior of the sensors developed and a mean success rate of 95% for each one in comparison to the commercial one touch display that had a 100% success rate. In this test, no information is used from the projected content, but it is aimed as a quick comparison of our touch sensors with a commercial one.

5. Conclusions

The present work showed that using simple low-cost materials in combination with open-source software tools, one is able to build a functional interactive surface. This surface was used as a simplified example demonstration of the research that is carried out by our Sensor Networks laboratory during the visits of various schools in our university. Figure 30 illustrates the use of our surface by the students. The comments received from them were very positive not only for the attractiveness and the simplicity of this construction but also for its performance.
Regarding the construction of the surface, the material chosen for this work was cardboard, mainly for the easy management and portability that it provides. The cardboard offered many advantages in the construction and made the connection of the front side and the backside easy. On the backside all the wiring was connected to the microcontrollers, this way the front side was not burdened with unnecessary materials and cables. However, the choice of cardboard also brings several disadvantages and some limitations to the final result. One such disadvantage is that since all the wiring is on the back of the surface, the cardboard was not always in a good contact with the wall behind the construction. As a result, in certain cases the touch sensors can be unstable. Another limitation seems to be that the way of sticking the white paper over the interactive surface, so we did not avoid air intruding in the middle. The addition of a frame where the cardboard can be placed would play an important role and would significantly improve the stability of the surface. Alternatively, a different rigid material can be used, for example plywood or plexiglass sheets. With these options, the surface will be more stable and efficient, but it will be difficult to be managed and easily moved.
As it concerns software, the design and programming of the multimedia interactions through Processing was also a challenge. For example, the playback of multiple videos at the same time caused significant delays in the system, resulting in avoiding the use of video content on the final implementation. Moreover, although processing is a very promising tool for the creative industries, its requirement for programming dexterity limits the audience it targets. Instead, a multimedia editing tool would offer more flexibility and would greatly speed up the development of such dashboards.
In our immediate future plans, now that our first proof-of-concept implementation has been positively evaluated, is to construct a revised version of this dashboard accommodating the above improvements. Such an interactive surface, made by more rigid materials than cardboard, and projecting guidance information, will be placed for use in a public place in our university campus to test its performance under non controllable conditions, as well as its acceptance by the audience. Apart from this alternative approach, our future plans also include the creation of an interactive touch grid, similar to the logic of the touch screens, using same low-cost philosophy. Such an implementation will eliminate the restriction of putting touch sensors in strict positions over the dashboard and will make our construction open to host dynamic scenarios for use in more demanding use cases.

Author Contributions

Conceptualization, S.P.; methodology, A.T.L. and S.P.; software, A.T.L.; validation, A.T.L., S.P. and Z.K.; formal analysis, A.T.L., S.P., Z.K. and G.L.; investigation, Z.K. and G.L.; resources, G.L., A.M. and E.M.; data curation, A.T.L., S.P.; writing—original draft preparation, A.T.L., S.P. and Z.K.; writing—review and editing, Z.K., G.L., A.M. and E.M.; visualization, A.T.L., S.P.; supervision, A.M. and E.M.; project administration, A.M. and E.M. All authors have read and agreed to the published version of the manuscript.

Funding

This research received no external funding.

Institutional Review Board Statement

Not applicable.

Informed Consent Statement

Not applicable.

Data Availability Statement

The data used to support this study’s findings are available from the corresponding author upon request.

Conflicts of Interest

The authors declare no conflict of interest.

References

  1. Atsali, G.; Panagiotakis, S.; Markakis, E.; Mastorakis, G.; Mavromoustakis, C.X.; Pallis, E.; Malamos, A. A mixed reality 3D system for the integration of X3DoM graphics with real-time data. Multimed. Tools Appl. 2018, 77, 4731–4752. [Google Scholar] [CrossRef]
  2. Vakintis, I.; Panagiotakis, S.; Mastorakis, G.; Mavromoustakis, C.X. Evaluation of a Web Crowd-Sensing IoT Ecosystem Providing Big Data Analysis. In Chapter Contribution in the “Resource Management for Big Data Platforms, Algorithms, Modelling, and High-Performance Computing Techniques”; Florin, P., Joanna, K., Beniamino, D., Eds.; Springer: Berlin/Heidelberg, Germany, 2016; pp. 461–488. [Google Scholar]
  3. Papadokostaki, K.; Panagiotakis, S.; Malamos, A.; Vassilakis, K. Mobile Learning in the Era of IoT: Is Ubiquitous Learning the Future of Learning? In Early Childhood Education; IGI Global: Hershey, PA, USA, 2020; pp. 252–280. [Google Scholar] [CrossRef]
  4. Pinikas, N.; Panagiotakis, S.; Athanasaki, D.; Malamos, A. A Device Independent Platform for Synchronous Internet of Things collaboration and Mobile Devices Screen Casting. Sci. Publ. Group Int. J. Inf. Commun. Sci. 2017, 2, 59–67. [Google Scholar] [CrossRef]
  5. Alexakis, G.; Panagiotakis, S.; Fragkakis, A.; Markakis, E.; Vassilakis, K. Control of Smart Home Operations Using Natural Language Processing, Voice Recognition and IoT Technologies in a Multi-Tier Architecture. Designs 2019, 3, 32. [Google Scholar] [CrossRef] [Green Version]
  6. Qian, K.; Kakarala, R.; Akhtar, H. A review of sensing technologies for small and large-scale touch panels. In Proceedings of the Fifth International Conference on Optical and Photonics Engineering, Singapore, 4–7 April 2017; p. 1044918. [Google Scholar] [CrossRef]
  7. Sathyan, A.; Manikandan, L.C. A Study and Analysis of Touch Screen Technologies. Int. J. Sci. Res. Comput. Sci. Eng. Inf. Technol. 2020, 6, 737–744. [Google Scholar] [CrossRef]
  8. Grosse-Puppendahl, T.; Holz, C.; Cohn, G.; Wimmer, R.; Bechtold, O.; Hodges, S.; Reynolds, M.S.; Smith, J.R. Finding Common Ground: A Survey of Capacitive Sensing in Human-Computer Interaction. In Proceedings of the 2017 CHI Conference on Human Factors in Computing Systems, Montreal, QC, Canada, 21–26 April 2018. [Google Scholar]
  9. Pourjafarian, N.; Withana, A.; Paradiso, J.A.; Steimle, J. Multi-Touch Kit: A Do-It-Yourself Technique for Capacitive Multi-Touch Sensing Using a Commodity Microcontroller. In Proceedings of the 32nd Annual ACM Symposium on User Interface Software and Technology (UIST’19), New Orleans, LA, USA, 20–23 October 2019; Association for Computing Machinery: New York, NY, USA, 2019; pp. 1071–1083. [Google Scholar] [CrossRef] [Green Version]
  10. Zhang, Y.; Yang, C.; Hudson, S.E.; Harrison, C.; Sample, A. Wall++: Room-Scale Interactive and Context-Aware Sensing. In Proceedings of the 2018 CHI Conference on Human Factors in Computing Systems, Montreal, QC, Canada, 21–26 April 2018; Volume 273, pp. 1–15. [Google Scholar] [CrossRef]
  11. Interactive Touch Wall. Available online: https://www.core77.com/posts/35697/How-Dalziel-and-Pow-Realized-This-Awesome-Interactive-Touch-Wall (accessed on 10 April 2022).
  12. Zippy. Available online: https://www.dalziel-pow.com/news/zippy-digital-installations-making (accessed on 10 April 2022).
  13. Jacoby, S.; Buechley, L. Drawing the Electric: Storytelling with Conductive Ink. In Proceedings of the 12th International Conference on Interaction Design and Children, New York, NY, USA, 24–27 June 2013; pp. 265–268. [Google Scholar] [CrossRef]
  14. Buechley, L.; Mellis, D.; Perner-Wilson, H.; Lovell, E.; Kaufmann, B. Living Wall: Programmable Wallpaper for Interactive Spaces. In Proceedings of the 18th ACM International Conference on Multimedia, Firenze, Italy, 25–29 October 2010. [Google Scholar]
  15. Qi, J.; Buechley, L. Electronic Popables: Exploring Paper-Based Computing through an Interactive Pop-Up Book. In Proceedings of the Fourth International Conference on Tangible, Embedded, and Embodied Interaction, Cambridge, MA, USA, 25–27 January 2010. [Google Scholar]
  16. Freed, N.; Qi, J.; Setapen, A.; Breazeal, C.; Buechley, L.; Raffle, H. Sticking Together: Handcrafting Personalized Communication Interfaces. In Proceedings of the 10th International Conference on Interaction Design and Children, Ann Arbor, MI, USA, 20–23 June 2011. [Google Scholar]
  17. Russo, A.; Ahn, B.Y.; Adams, J.J.; Duoss, E.B.; Bernhard, J.T.; Lewis, J.A. Pen-on-Paper Flexible Electronics. Adv. Mater. 2011, 23, 3426–3430. [Google Scholar] [CrossRef] [PubMed]
  18. How to Make an Arduino Capacitance Meter. Available online: https://www.circuitbasics.com/how-to-make-an-arduino-capacitance-meter/ (accessed on 19 March 2022).
  19. How Capacitive Sensors Work and How to Use Them Effectively. Available online: https://www.sensorland.com/HowPage070.html (accessed on 2 April 2022).
  20. ESP32 Capacitive Touch Sensor Pins with Arduino IDE. Available online: https://randomnerdtutorials.com/esp32-touch-pins-arduino-ide/ (accessed on 19 March 2022).
  21. Simple Median Filter Library Designed for the Arduino Platform. Available online: https://github.com/daPhoosa/MedianFilter (accessed on 10 April 2022).
  22. Grundhöfer, A.; Iwai, D. Recent Advances in Projection Mapping Algorithms, Hardware and Applications. Comput. Graph. Forum 2018, 37, 653–675. [Google Scholar] [CrossRef]
  23. The Illustrated History of Projection Mapping. Available online: http://projection-mapping.org/the-history-of-projection-mapping/ (accessed on 8 April 2022).
  24. Welcome to Processing! Available online: https://processing.org/ (accessed on 10 April 2022).
Figure 1. Operating principle of capacitive sensing.
Information 13 00304 g001
Figure 2. Ohmic sheet resistances for Graphite.
Information 13 00304 g002
Figure 3. Ohmic sheet resistances for aluminum Tape.
Information 13 00304 g003
Figure 4. Ohmic sheet resistances for conductive paint.
Information 13 00304 g004
Figure 5. Connection of our capacitive sensors with an ESP32 microcontroller.
Information 13 00304 g005
Figure 6. Plots of our sensors with and without median filtering. In (a,b) a plot of sensor at rest without/with filter, is showing. In (c,d) similar plots but with the hand at 5cm distance and without/with filter, respectively. Finally, in (e,f) the plots of the sensor are when touching, again without/with median filter applied, respectively.
Information 13 00304 g006
Figure 7. High-level architecture of our system.
Information 13 00304 g007
Figure 8. The different layouts tested for the surface; each with a discrete Menu (first level) and Working Area (second level). In (a,b) the second level of the surface is exposed higher than the first level. In (c) the first level is situated higher than the second and in (d) both levels of operation are exposed at the same height.
Information 13 00304 g008
Figure 9. (a) Aluminum adhesive tape (b) Cutting the tape (c) Preparing for installation (d) Placement on the surface.
Information 13 00304 g009
Figure 10. (a) Final layout of sensors on the front-side of the surface (b) Front-side of the surface covered with white paper (c) Wiring at the backside of the surface.
Information 13 00304 g010
Figure 11. Interactions for Scenario 1 (Music Wall).
Information 13 00304 g011
Figure 12. Interactions for Scenario 2 (English Alphabet).
Information 13 00304 g012
Figure 13. Interactions for Scenario 3 (Non-Interactive animation).
Information 13 00304 g013
Figure 14. Sensor readings when not touched (a) and when touched (b), shown side by side.
Information 13 00304 g014
Figure 15. Touch and release events sent to the server.
Information 13 00304 g015
Figure 16. Behavior of the system across distinct and prolonged sensor touches. On the left, a plot with filter and threshold when touched is shown. On the right, plot of the sensor when touched with longer duration.
Information 13 00304 g016
Figure 17. Result of the counter flag in our implementation.
Information 13 00304 g017
Figure 18. Finite state machine of our client.
Information 13 00304 g018
Figure 19. Finite state machine of our server.
Information 13 00304 g019
Figure 20. Welcome page of our application.
Information 13 00304 g020
Figure 21. Musical wall scenario. In (a), the mapping of instruments with the corresponding touch sensor behind the white paper is shown. Visual interaction achieved with the projector making each object to change color. Touching the trumpet (b), the accordion (c) and the mandolin (d), respectively.
Information 13 00304 g021
Figure 22. Simultaneous use of our interactive surface by several users.
Information 13 00304 g022
Figure 23. English alphabet scenario. The layer consists of four touch sensors, each associated with a letter of the English alphabet. Here is an example run of the scenario with the letters “L” in (a), “U” in (b), “N” in (c) and “F” in (d), projecting the corresponding English words associated with each letter.
Information 13 00304 g023
Figure 24. Non-interactive Scenario. Demonstration of projection mapping technique on surfaces with different positions, angles, and inclinations, that appear in (bd) in relation to the projector. In (a) the 3d construction, made by cardboard and placed in the surface, is shown.
Information 13 00304 g024
Figure 25. Sensors under evaluation.
Information 13 00304 g025
Figure 26. Touching the sensors with one or more fingers.
Information 13 00304 g026
Figure 27. Touching the sensors with different frequencies.
Information 13 00304 g027
Figure 28. Simultaneous use of the touch sensors.
Information 13 00304 g028
Figure 29. Comparing our touch sensors with a commercial 3.5” touch screen.
Information 13 00304 g029
Figure 30. Use of our interactive surface by pupils during school visits in our laboratory.
Information 13 00304 g030
Table 1. Conductivity tests in the materials used in this study.
GraphiteAluminum TapeConductive Paint
Thin LineR1178 kOhms3.2 Ohms0.65 kOhms
R2321 kOhms3.3 Ohms1.39 kOhms
Wide LineR1150 kOhms3 Ohms0.5 kOhms
R2306 kOhms3.1 Ohms1.1 kOhms
Light LineR15.32 kOhms--
R212.3 kOhms--
Table 2. Success rate of touches for touch Sensor 4 under different BPM.
BPM5080100120150
Success Rate19/2020/2018/2019/2019/20
Table 3. Success rate of touches for touch sensors under lighter pressure.
Touch Sensor45678
Success Rate86%83%86%84%80%
Publisher’s Note: MDPI stays neutral with regard to jurisdictional claims in published maps and institutional affiliations.

