Abstract
Consumer adoption of electric vehicles is essentially related to product quality factors, such as safety, performance and compatibility; however, the relationship between product quality standards and consumer behavior is not clear. Based on Multi-Attribute Utility Theory (MAUT) and Prospect Theory, we distinguish claimed quality attributes, intrinsic quality attributes, measured quality attributes and perceived quality attributes and establish a conceptional model using System Dynamics (SD) simulation from the perspective of a Standard-Information-Behavior framework to explore the heterogeneous impacts of technical standards on consumers’ willingness to adopt electric vehicles. Based on the theory model and simulation, we try to explain the heterogeneous effects of three different standards: safety, performance and compatibility. We find that safety standards affect adoption through a market access mechanism, perceived performance of risk standards positively impacts customers’ perceived quality, and compatibility standards influence consumers’ perceived network value. The perceived risk, perceived quality and perceived network value influence consumer adoption willingness and behavior. The study contributes to the theory of innovation diffusion and consumer adoption behavior, and offers insights for standardizing activity, innovation diffusion and marketing product information for electric vehicles.
1. Introduction
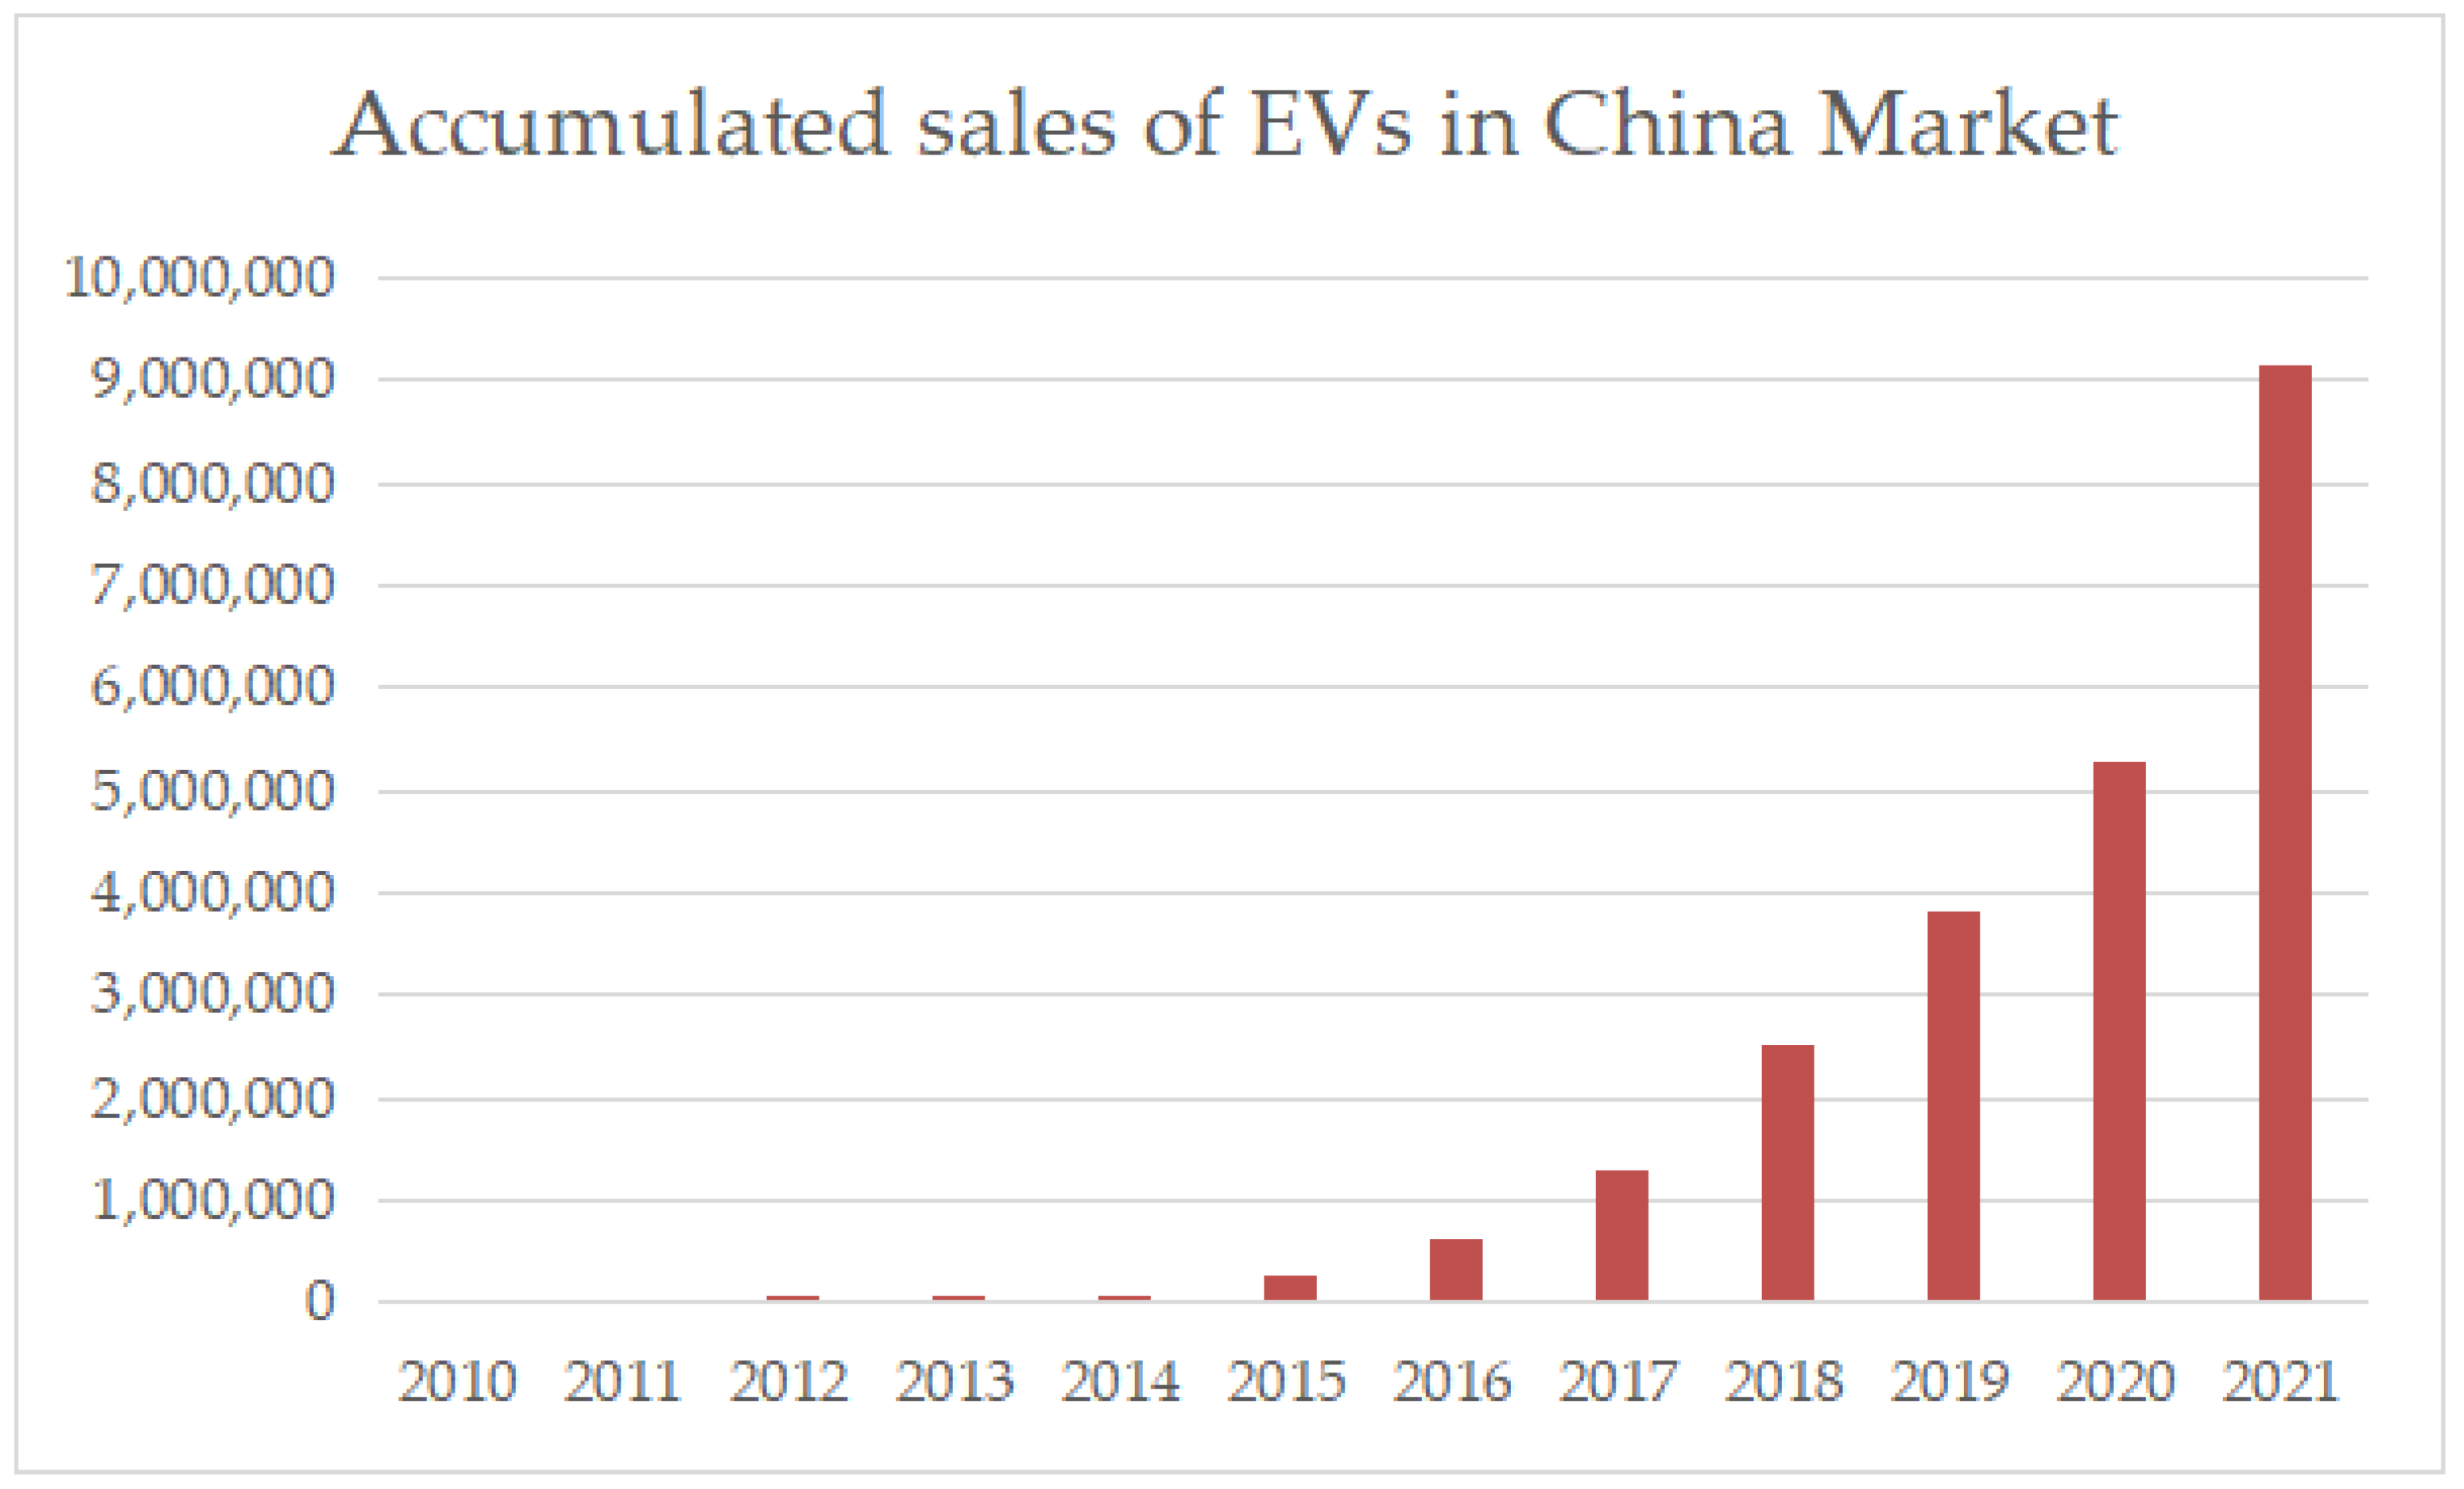
China has been the biggest electric vehicle (EV) market, followed by Europe and the United States. As shown in Figure 1, accumulated sales show a quickly increasing trend and rising market penetration since 2016. However, consumers have concerns regarding EV safety. For example, battery fires have raised trust issues related to the stringency of EV battery safety standards. Further, the performance of EVs, such as battery life, charging time and battery range, are important factors that influence consumer adoption behavior. The performance claims are according to relevant performance standards, if existent. Consumers also pay attention to whether an EV is compatible with public charging stations, which is an important factor to reduce range anxiety. The safety, performance and compatibility attributes of EVs are important factors on consumer adoption willingness and behavior [1].
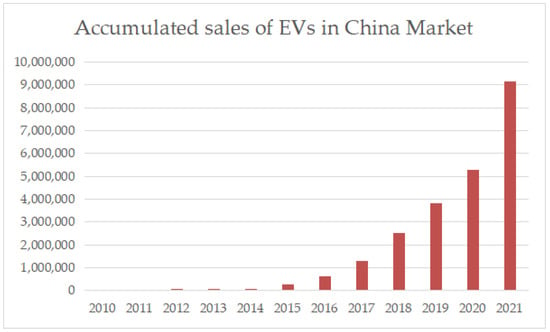
Figure 1.
Accumulated sales of EVs in China, data source: MarkLines database.
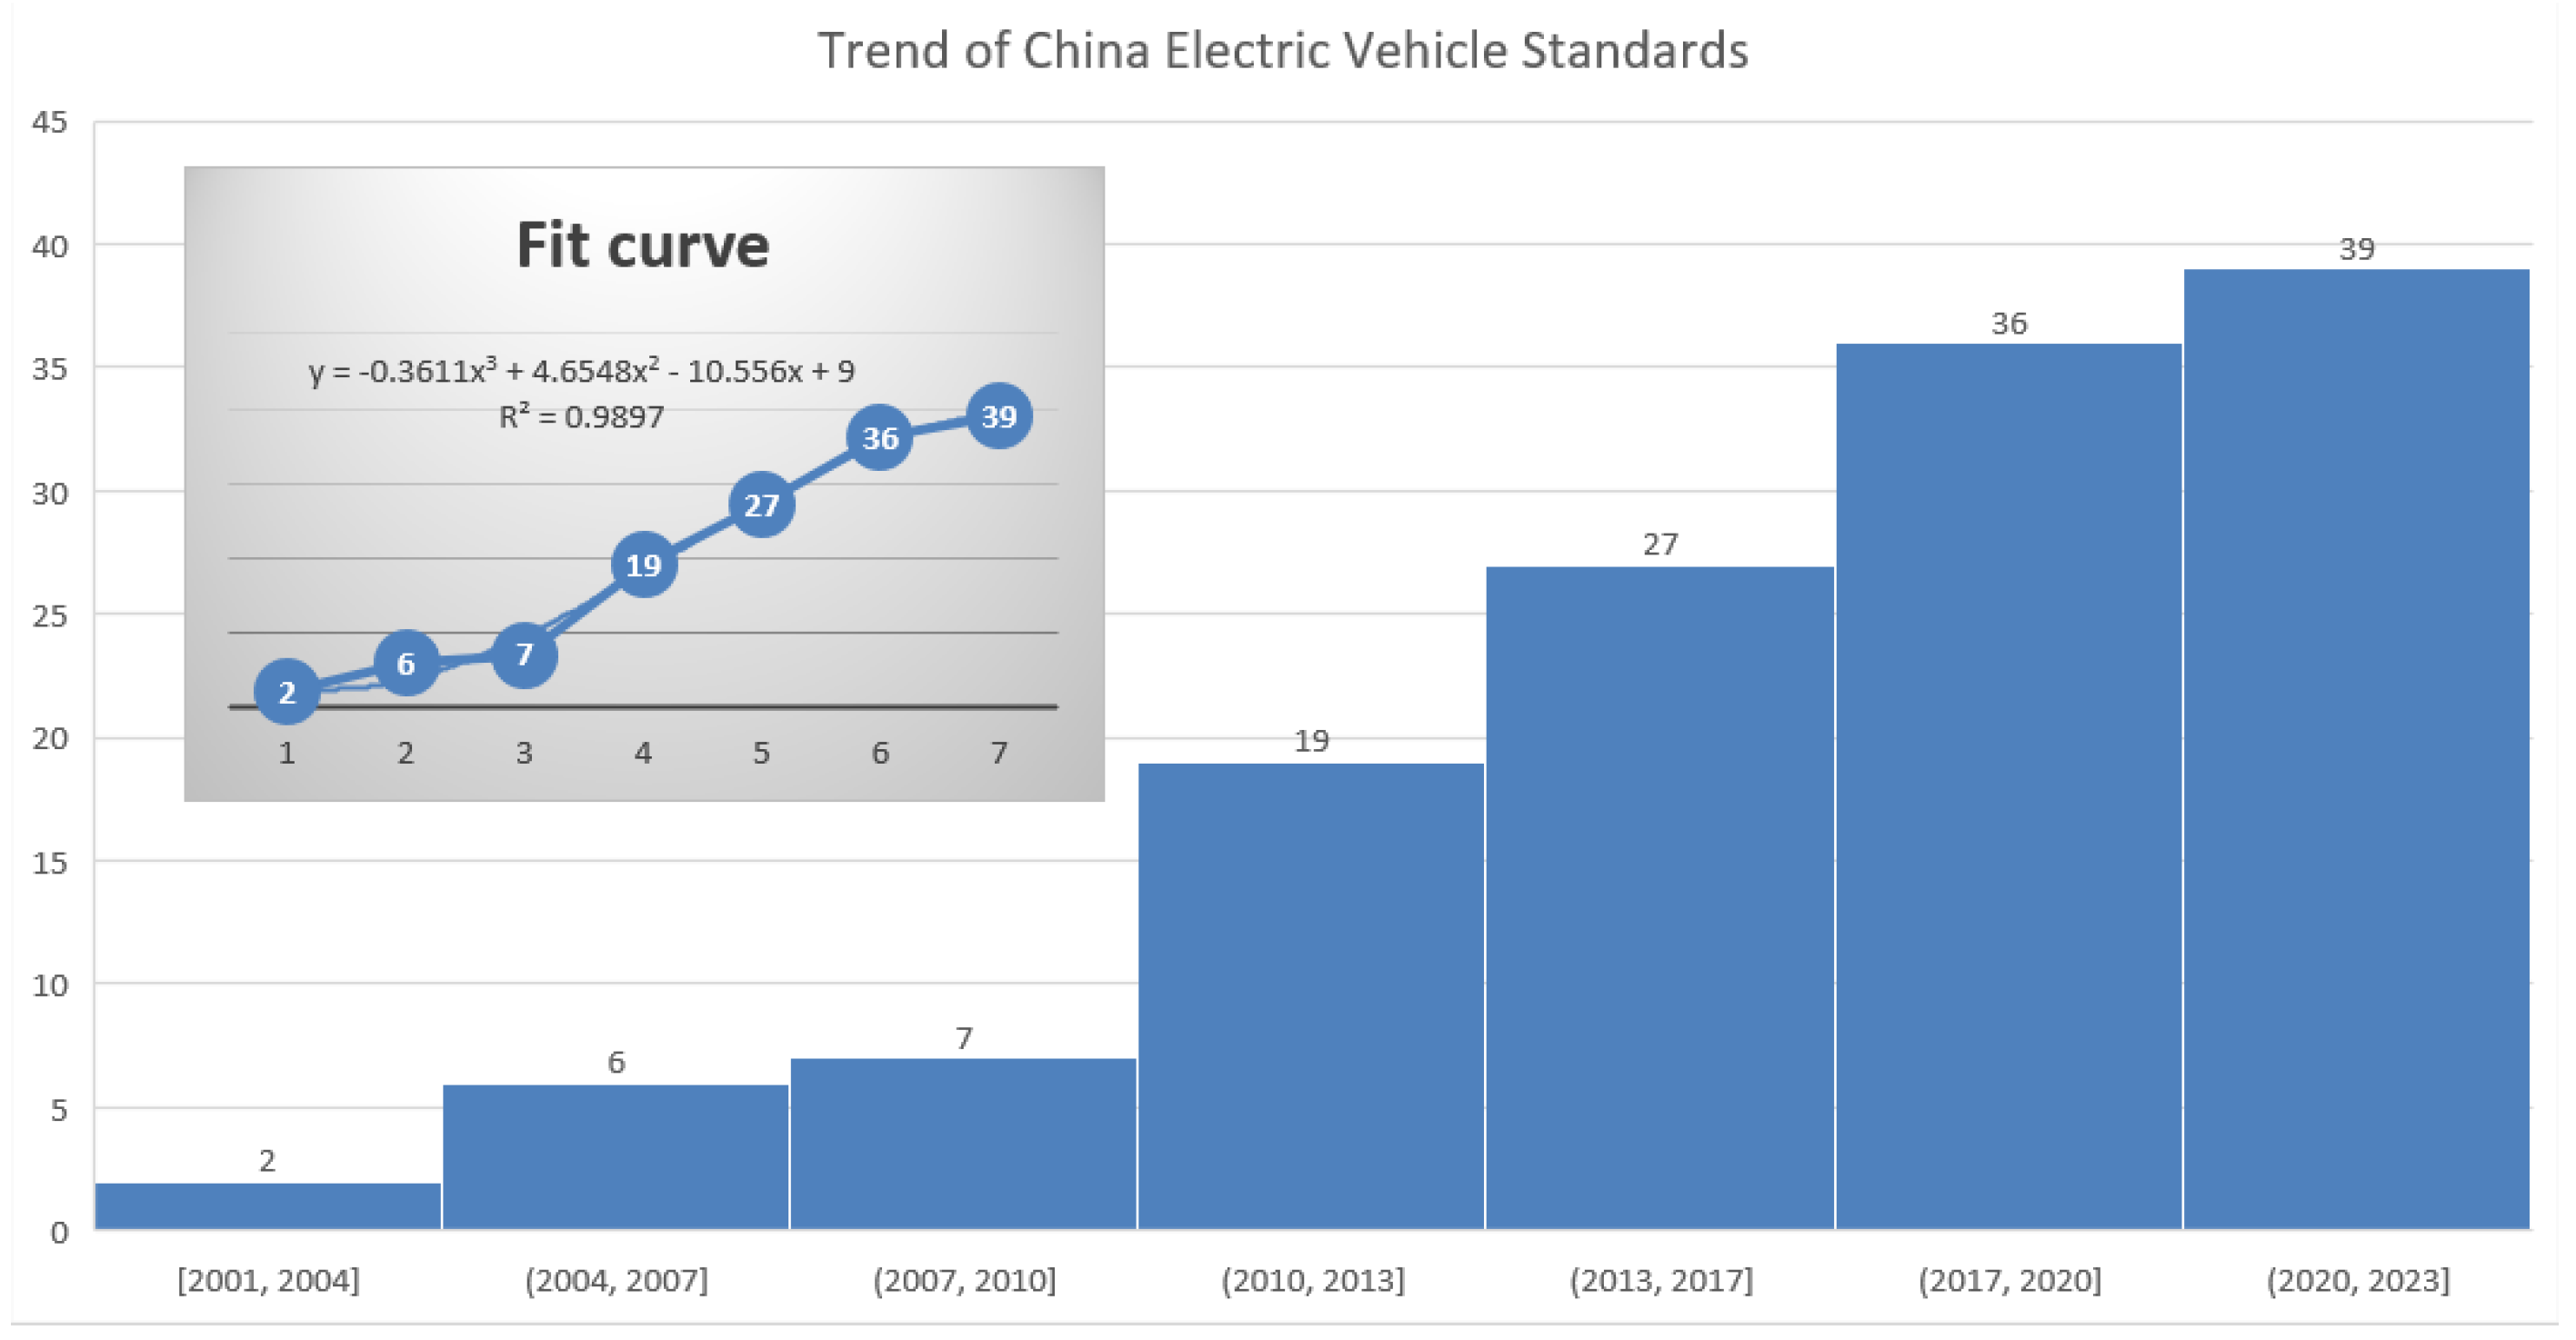
China has published technical standards to regulate the electric vehicle industry; based on data released from the China National Technical Committee of Auto Standardization, the published trend chart is shown in Figure 2. The standards detail requirements and thresholds for detailed technical attributes. The existing literature [2] summarizes the major types of technical standards influencing innovation diffusion, including safety standards and performance standards, which can reduce transaction cost, reduce product uncertainty, avoid or correct bad choices, and provide compatibility standards to improve the communication and interaction capabilities by generating network externalities. Regarding these standards, as most are GB/T standards, which are voluntary rather than mandatory, different stakeholders disagree on their stringency.
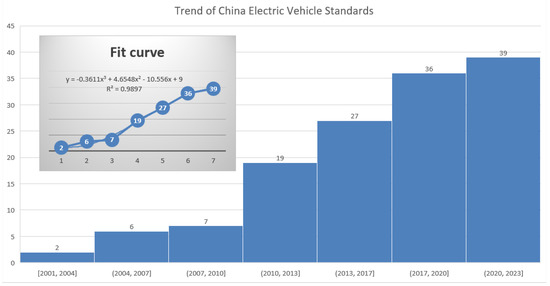
Figure 2.
The published trend of China electric vehicle standards.
To link the standards-information-behavior layers regarding EV adoption—inspired by the five-stage adoption processes of innovation diffusion theory: awareness, persuasion, decision, implementation and continuation [3]—we divide the innovation-diffusion model into two major stages, product information diffusion and product adoption. Potential adopters become aware of product information, including safety, performance and compatibility with charging stations. Product information and consumers’ perceived values are linked to a persuasion process. Then, consumers compare perceived value to their adoption thresholds at the decision stage.
Based on the conceptional relationship, we extend our analysis utilizing System Dynamics software that was initiated by Professor Forrester [4] to understand complex factors and influencing mechanisms; the simulation tried to identify the heterogeneous effects of the three types of technical standards on product information, perceived risk, perceived quality, perceived network value, adoption willingness and behavior.
Different from the existing literature, which mostly used macro-level statistical analysis, we investigate the relationship of technical standards and consumer adoption at a more micro-level. The contributions of this paper mainly include: consumer adoption is influenced indirectly by technical standards through several factors, such as consumer trust, product information, perceived risk, perceived quality, perceived network value, adoption willingness, adoption threshold and adoption behavior. Furthermore, consumer trust of product information is also introduced to reflect consumer doubts of claimed product information. Last but not least, a quantitative analysis using an SD model and simulation explores the interplay between the factors in detail and can be referenced for future study in similar areas.
From a management perspective, firstly, decision-makers can identify the three major directions to improve the quality of electric vehicles: safety, performance and compatibility; these three directions are key factors to improve consumer adoption. Secondly, marketing product information for consumers should be based on credible product information against stringent test standards. Consumer adoption and recommendation behavior are also important reflections of stringent technical standards and trust of product information.
The paper is organized as follows. Section 2 reviews background theory and literature related to our study. Section 3 describes the conceptional relationship, followed by system dynamics (SD) modeling in Section 4. In Section 5, we extend the model with sensitivity testing. Finally, in Section 6, major conclusions, managerial and policy implications are presented, with limitations and future study directions.
2. Literature Review and Theory Backgrounds
2.1. Technical Standards and Innovation Diffusion/Adoption
Technical standards have been classified and summarized in previous studies [2,5]. Technical standards can be classified as product-element standards and non-product standards. Based on function, product-element standards [6] can be further classified as information, quality/reliability, compatibility and interface, or variety reduction standards. Quality/reliability standards are also referred to as minimum quality/safety standards. To be more specific and relevant to electric vehicles, we focus on product safety, performance and compatibility standards. Safety standards are mostly adopted from national mandatory regulations and/or technical barriers to trade, such as electric vehicles’ need to comply with battery safety testing requirements (e.g., short-circuit test, overcharge test, etc.) to enter the market. Performance standards are based on quality and reliability attributes, such as battery charging time, battery range, battery life, etc. Compatibility standards aim to ensure interoperability and interface communication, such as public charging station compatibility and interchangeable battery configurations for battery replacement.The roles of standards are summarized in Table 1.

Table 1.
The roles of different functions of technical standards as related to innovation diffusion, based on the literature [2].
2.2. Consumer Adoption of Electric Vehicles
Innovation diffusion can be defined as the distribution of innovation within a social system for a certain time range through certain diffusion channels [10]. Innovation diffusion theory seeks to explain the adoption of new ideas, technologies and products. Bass introduced a model integrating internal and external channels, including mass media and word-of-mouth interaction among consumers. Consumer adoption decisions are based on awareness of product information [11]. Awareness, persuasion, decision, implementation and continuation are the five stages of consumer adoption. During the awareness and persuasion processes, product information diffusion plays a critical role, while product adoption is at the later three stages.
Among the factors influencing the adoption of electric vehicles, technical and charging devices factors, including safety, reliability, battery range, charging time and charging infrastructure, influence consumers’ perceived ease of charging [12]. The adoption rate depends on customers’ perceived value [13], perceived utility [14], perceived quality [15], consumer trust [16] and perceived risk [16]. Kirmani defined perceived quality as consumers’ judgment reference based on product information [17]. Perceived quality is the overall evaluation of the product performance and functions. Perceived risk is consumer’s concern regarding the uncertainty of the product. Goerlandt et al. reviewed the literature related to perceived risk or risk perception and found that consumer trust is fundamentally related to perceived risk [18]. Simsekoglu and Nayum assessed perceived risk, and perceived attributes impact intent to adopt electric vehicles [15]. Febransyah developed an analytic network process (ANP) model to analyze the interlinking of factors related to adoption willingness (purchase intention) and perceived attributes. The model is based on the theory of planned behavior (TPB), which is widely used to research purchase intention and consumer adoption [19]. Poyyamani Sunddararaj et al. studied how factors such as battery charging time, charging infrastructure, distance per charge, etc., affect adoption of electric vehicles and their interconnection with the power grid [20]. Other models are summarized in the literature [21], such as Theory of Reasoned Action (TRA) and Unified Theory of Acceptance and Use of Technology (UTAUT). We focused on the Technology Acceptance Model (TAM) [22], which is widely used for consumer behavior studies, with the most-relevant factors corresponding to product information and other factors, but we also extended it to independent factors such as perceived risk, perceived quality and perceived value based on the literature. The System Dynamics (SD) model of consumer adoption can be divided into two major stages: product information diffusion and product adoption, but standards are not included in the previous study. SD models can be used to simulate adoption behavior, such as in [23,24].
2.3. Multi-Attribute Utility Theory (MAUT) et al.
To tackle decisions regarding more than one quality attribute, Multi-Attribute Utility Theory (MAUT), Structural Equation Model (SEM), Multinomial Logistic Regression (MNL), Latent Class (LC) models and Structural Equation Models were implemented in the EV adoption study. Shi et al. established a Vertical × Vertical quality attributes formula to consider consumer heterogeneity [25]. Kim et al. [26] used SEM to explore the relationship between quality attributes comprised of latent factors and consumer purchase decisions. Empirical data analysis showed that battery range and charge time were equivalent. Ferguson et al. [27] used latent class choice analysis on Canadian consumers’ adoption of EVs. Quality attributes were calculated with monetary cost or benefits based on MNL.
2.4. Prospect Theory and Risk Aversion
Kahneman and Tversky [28,29] proposed prospect theory to enrich the theory of utility; major contributions included outcomes based on reference points, decision weights for attributes and risk aversion (i.e., people are more sensitive to negative results than positive ones). Hu et al. used cumulative prospect theory to study EV drivers’ charging behavior [30]. Li et al. [31] studied EV scheduling based on cumulative prospect theory. Based on prospect theory, threshold of adoption is used to simulate consumers’ adoption decision based on judgment of cost and benefits against decision criteria and the threshold. If adoption willingness is higher than the threshold, the consumer will choose to adopt electric vehicles, otherwise they will not adopt the product.
Based on literature review, we found that the existing papers had qualitatively defined and analyzed the different standards, while the interplay between technical standards, product information, information diffusion, consumers’ perceived risk, perceived quality, perceived value and consumer adoption behavior has not been integrated. Their relationship is not clear. Further, we noticed that consumers doubt the production information claimed by electric vehicle manufacturers, such as battery range, which can be significantly reduced in low temperatures, and battery ignition and explosion accidents occasionally raise concerns over whether safety standards are really stringent. Therefore, we also introduce a consumer trust factor in our study.
In this paper, we aim to answer the following questions:
- (1)
- What is the conceptional relationship between technical standards, quality attributes and consumer adoption behavior?
- (2)
- How can the multiple quality attributes be distinguished, and what are their relationships with standards and consumer adoption behavior?
- (3)
- How can the relationship between quality attributes and consumer adoption be quantitatively analyzed?
- (4)
- What are the implications for managers and policy makers for the electric vehicle industry?
In following sections, we further discuss the conceptional relationship and system dynamics model and its simulation to resolve the questions.
3. Conceptional Relationship of Technical Standards and Consumer Adoption Behavior of Electric Vehicles
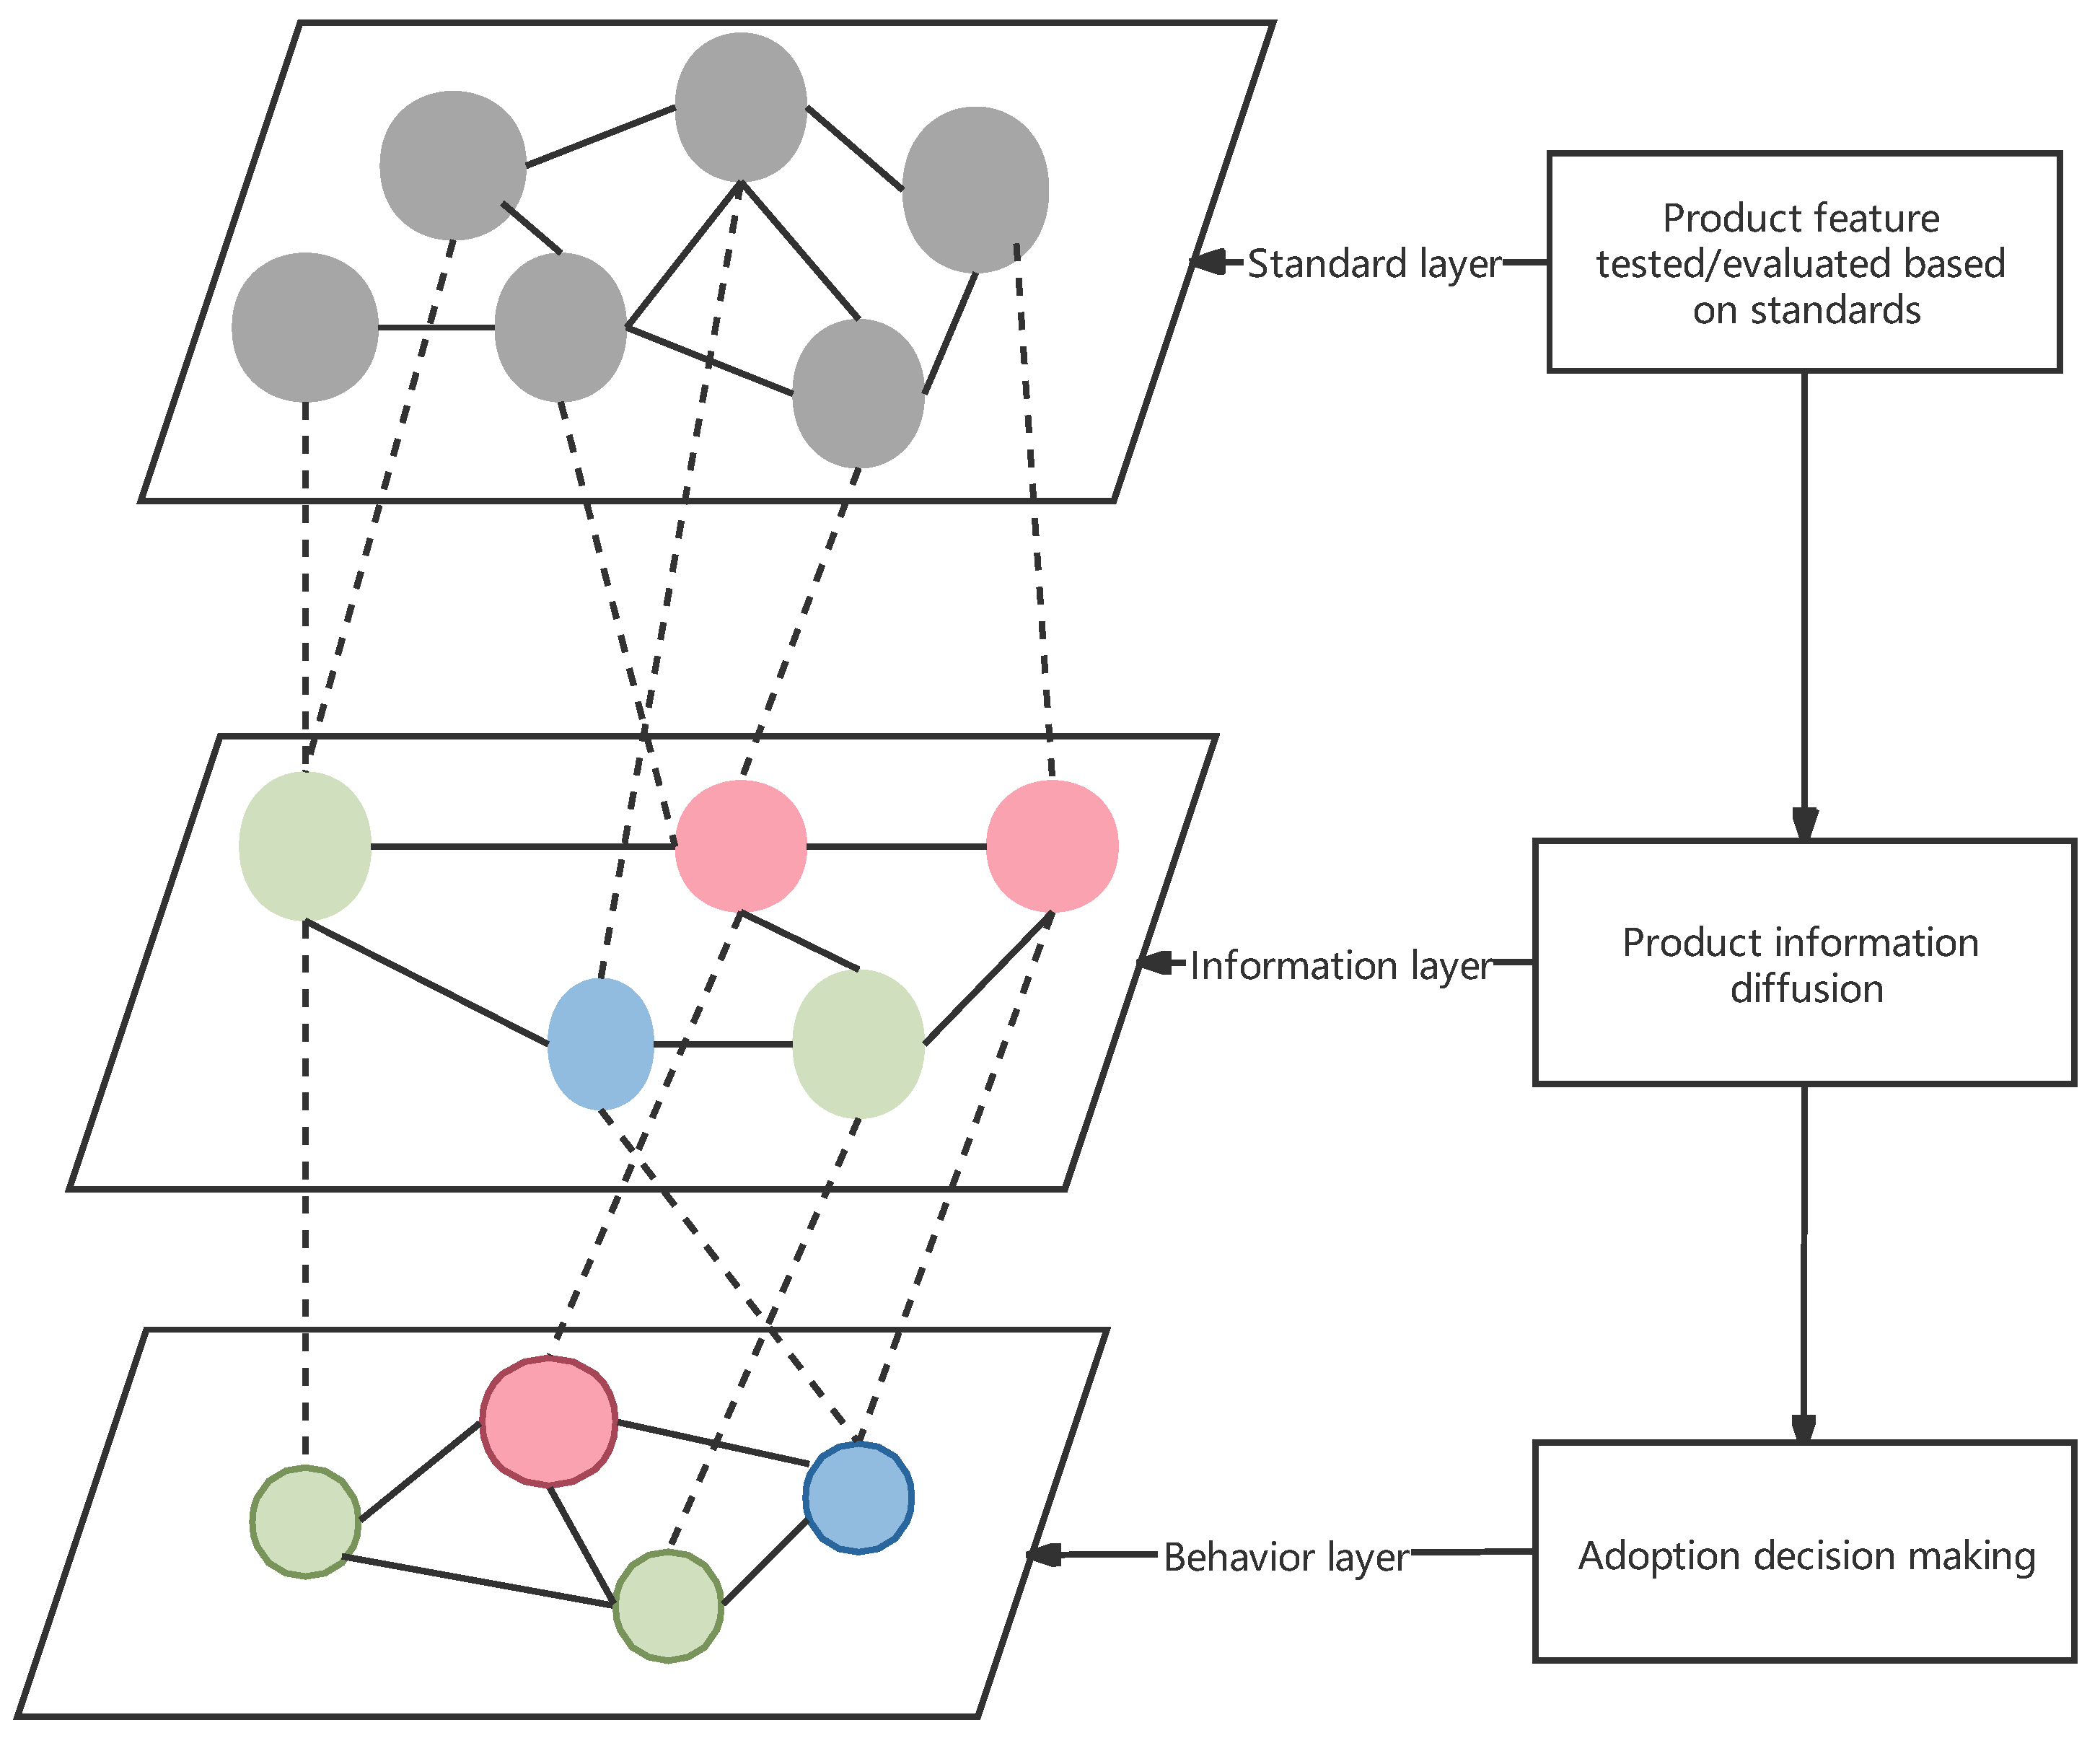
Inspired by an information-behavior framework in the literature [32], we develop the conceptional framework, as shown in Figure 3. It is a standard-information-behavior framework to extend our understanding of the relationships between standards, product information and consumer adoption behavior.
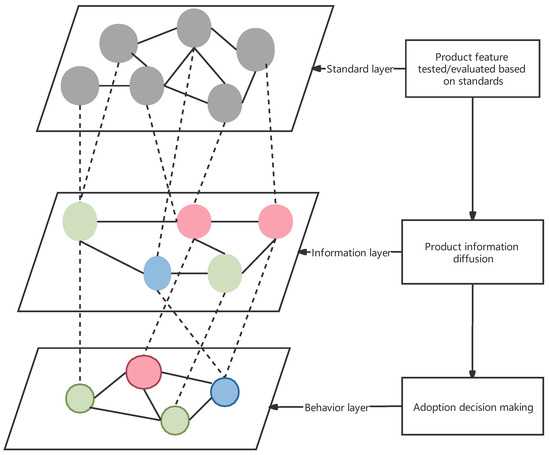
Figure 3.
Illustration of standard-information-behavior framework.
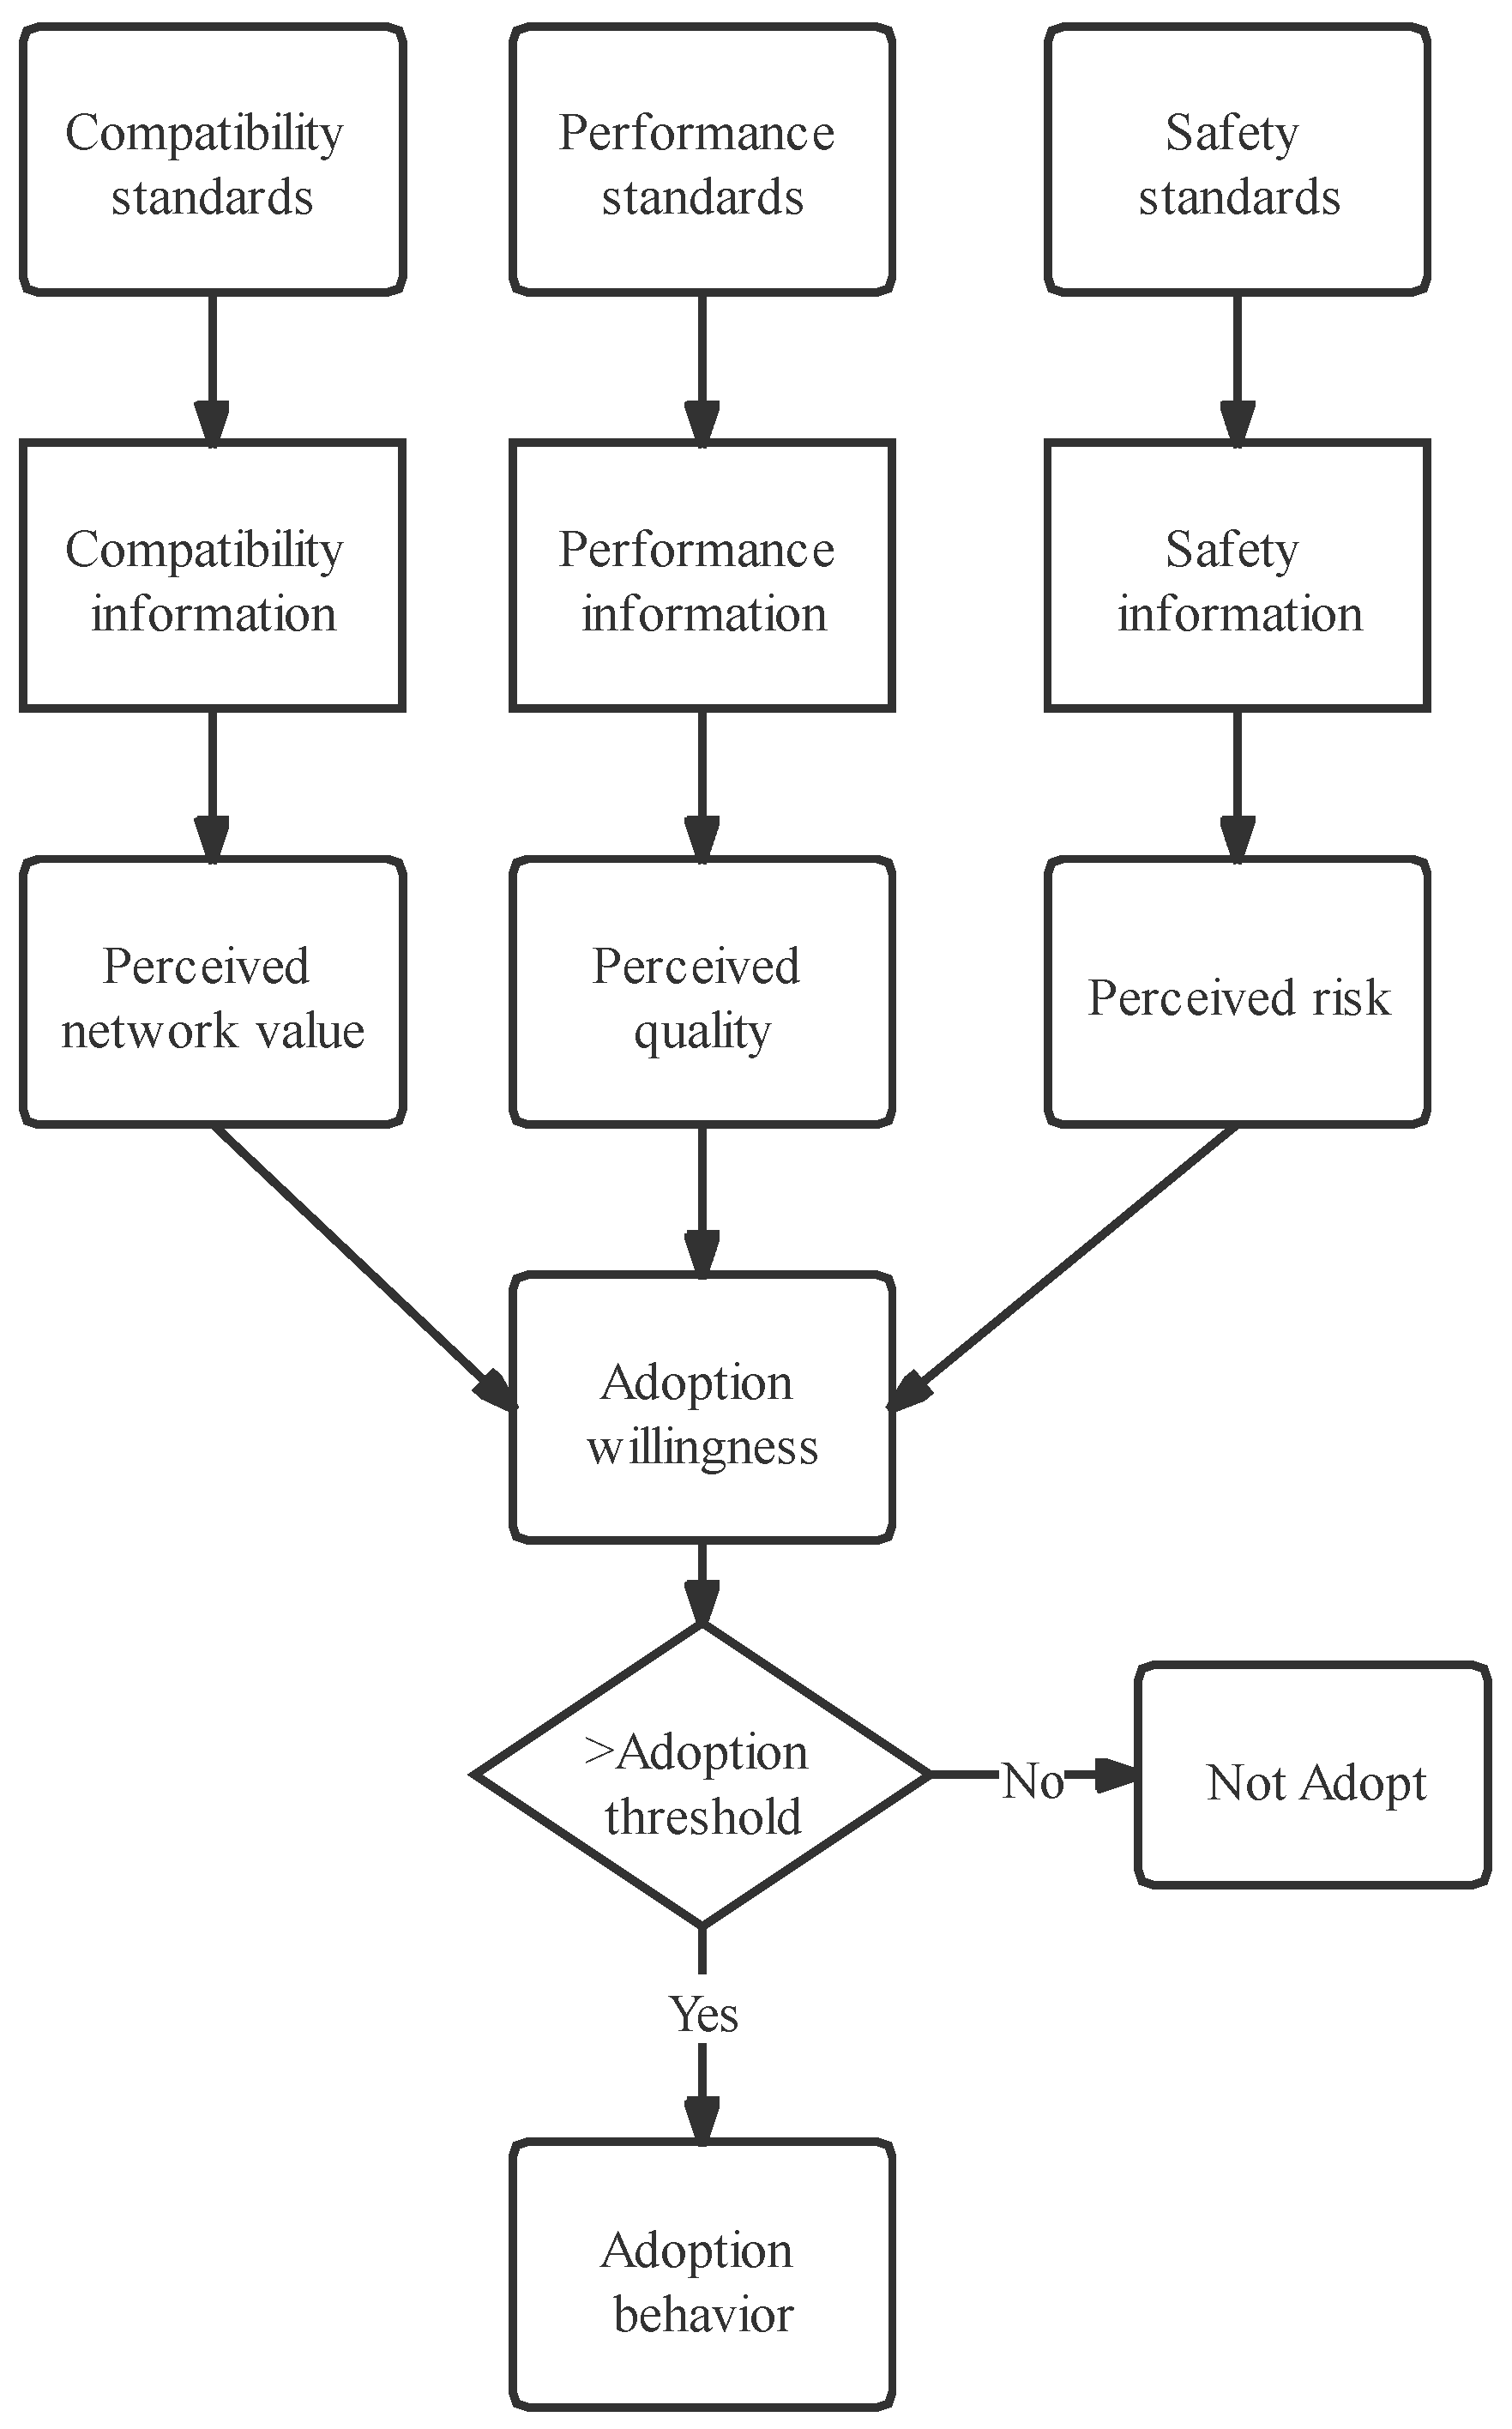
To extend the conceptional relationship framework, we elaborate on the consumer-adoption procedure based on the background theory in Section 2 and other factors such as perceived quality, perceived risk and consumer trust in Section 2.3. The relationships between the factors can be summarized as in Figure 4: Firstly, manufacturers and third-parties test the electric vehicles, then the manufacturers can claim the product information based on the test results, and consumers will be aware of the product information based on mass media such as advertisement channels; also, consumers can communicate the product information with other consumers. If the electric vehicle is safe, has satisfactory performance and has enough charging bases, then consumers are more willing to choose to adopt electric vehicles. The decision to adopt is based on the adoption willingness exceeding the adoption threshold. If consumers are highly satisfied with the product, they are more willing to recommend electric vehicles to other consumers.
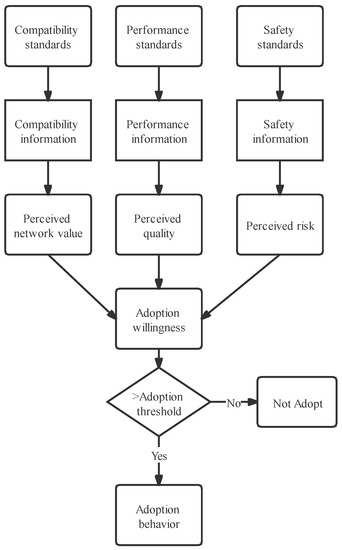
Figure 4.
Conceptional relationship diagram of consumer adoption.
If all product quality attributes meet or exceed the corresponding threshold, then utility is denoted as the sum of the weighted quality attributes; otherwise, the minimum negative gap between a quality attribute and the corresponding threshold is denoted as utility (U).
where
In the formula, wi is the weight of each quality attribute, γ is the trust coefficient for the claimed quality attribute (for example, if the manufacturer claims the battery range is 400 miles, but consumers believe the actual battery range is 329 miles, then a trust coefficient of 0.8 denotes the discount to claimed quality attributes), ai is the ith attribute, ti is the ith threshold (e.g., consumers only adopt EVs with battery range greater than 75 miles [33]). If lower value for an attribute is preferable, such as for charge time, then we can transform the attribute to its reciprocal value. If the relative quality attribute is negative, then consumer will not adopt the EV. Variable is the risk aversion coefficient, and α and β are risk preference coefficients. The threshold of adoption is used to simulate the consumer adoption decision mechanism based on judgment of cost and benefits against the decision criteria and threshold. If the adoption willingness is higher than the threshold, then the consumer will choose to adopt the electric vehicle; otherwise he/she will not adopt the product.
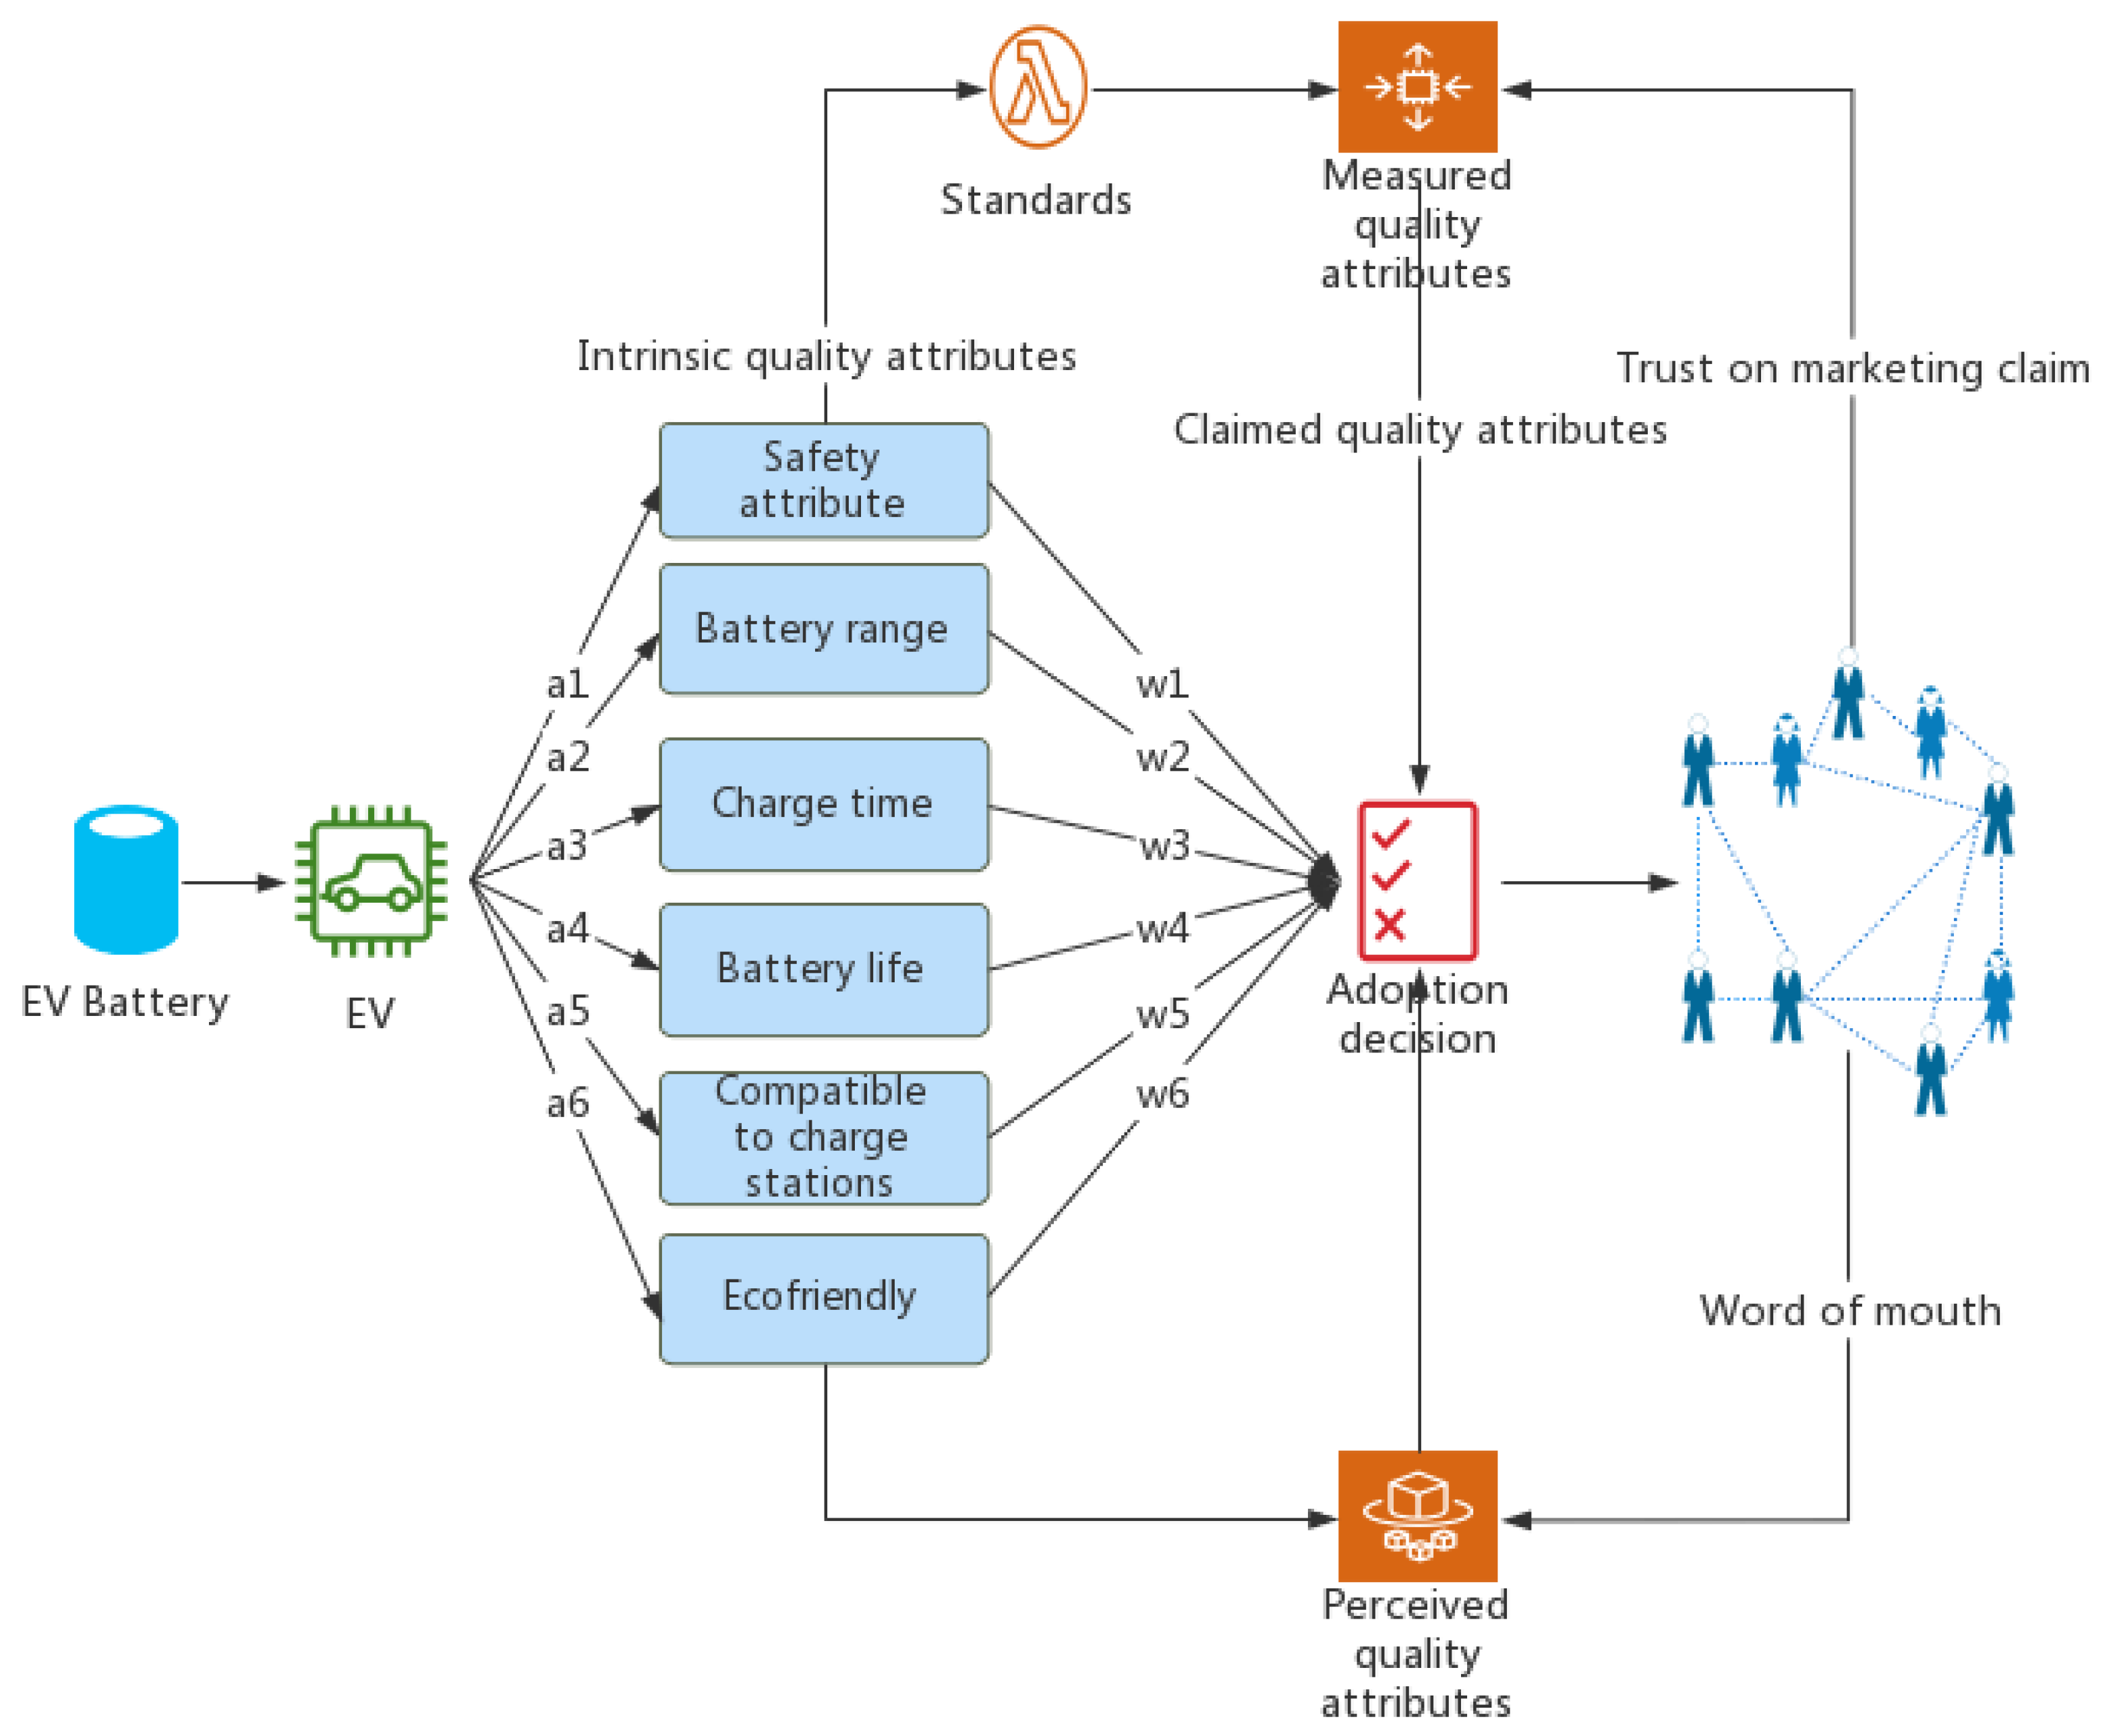
We distinguish four quality attributes types: intrinsic quality attributes are physical attributes such as real-life battery range; measured quality attributes are those tested under specific standardized conditions and, therefore, may not be the same as actual user scenarios due to differences between lab and real-world conditions; claimed quality attributes are based on manufacturers’ advertising and marketing; perceived quality attributes are what is perceived and experienced by consumers and are closest to real usage conditions. The four types of quality attributes can be relevant, but they can also have discrepancies for many reasons. The illustration is shown in Figure 5.
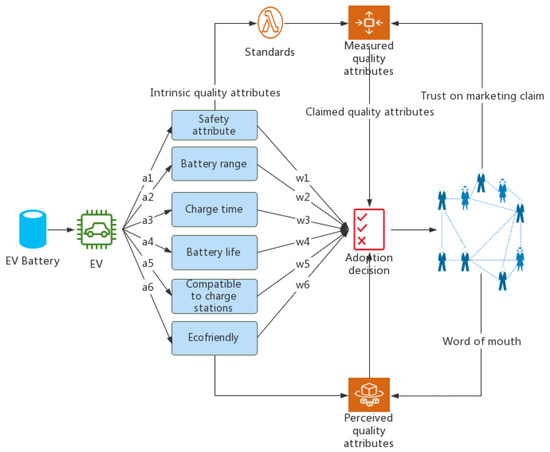
Figure 5.
Quality attributes’ effect on consumer adoption.
Furthermore, the relationships between standards and quality attributes are explained: technical standards, including safety, performance and compatibility standards, are established based on testing, criteria and other requirements for manufacturers. Based on the standards, the manufacturers can share products’ safety, performance and compatibility information with consumers. The standards are the basis to translate intrinsic attributes into measured attributes. Perceived risk is highly related to the safety features of electric vehicles, so the interlink between product safety information is established. If the EV can easily catch on fire, then the consumer will perceive the EV as a high-risk product. EVs should be tested according to relevant safety standards; thus, the safety standard becomes the base of product safety information. EV performance is based on standardized testing. Perceived quality is related to product performance information, such as battery range, charging time, battery life, etc. Other literature uses additional terms, such as perceived usefulness, quality features, etc. We define performance information based on a performance standard, which ties more closely with the terms we discuss in this paper. EV compatibility standards specify the interfaces or formats, for example, whether the EV can be charged at charging station. If consumers find that the EV is compatible with most of the existing charging stations, then they will perceive there is high charging network value, which is correlated with compatibility information and compatibility standards. Perceived risk, perceived quality and perceived network value are factors influencing adoption willingness, while consumer trust in standards and marketing claims are also factors of adoption willingness. Product information can be diffused through mass media channels and word-of-mouth channels; the latter one is also influenced by user experience.
4. System Dynamics Model
4.1. SD Model of Consumer Adoption of Electric Vehicles
A system dynamics model is established to simulate adoption system dynamics over time under the impact of different sets of factors.
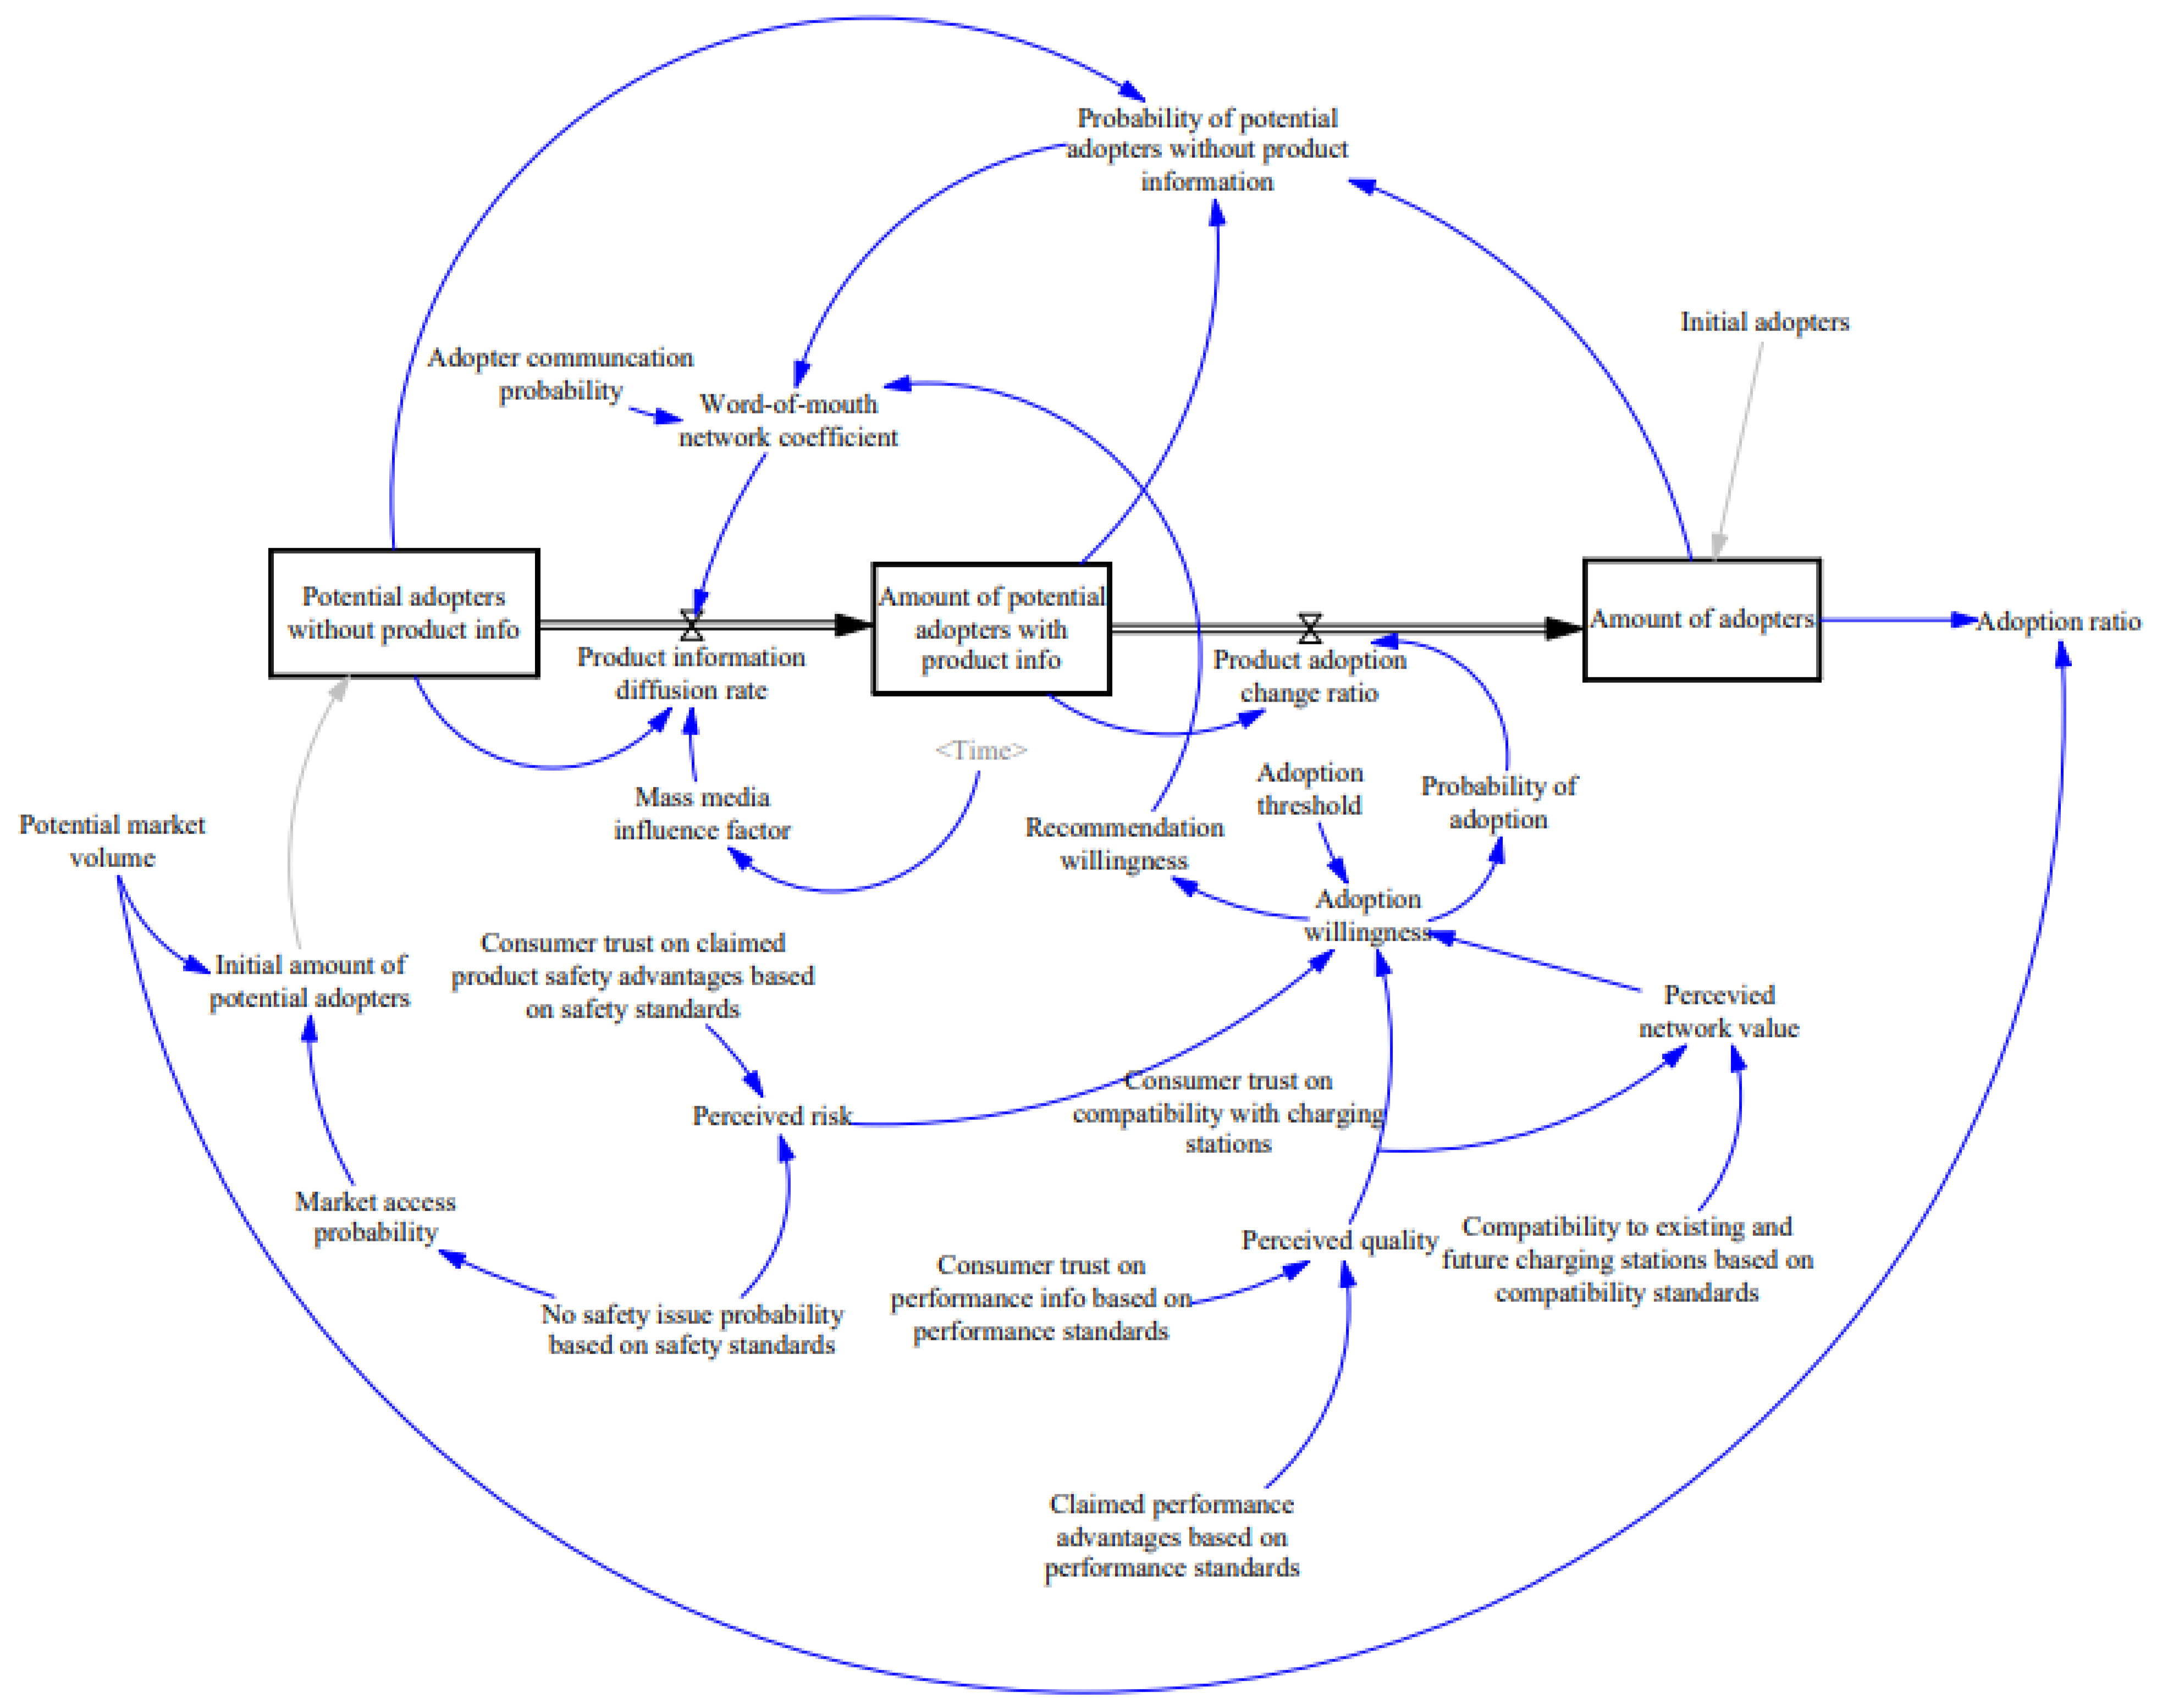
The SD flow diagram is developed as shown in Figure 6, in which endogenous variables are the key influencers; the three key variables are: the number of potential adopters without knowing the product information, the number of potential adopters who know the product information and the number of people who have adopted the product. Key auxiliary variables include adopter communication probability, word-of-mouth network coefficient, probability that potential adopters without product information meet with adopters, perceived risk, perceived quality, perceived network value, adoption willingness, product information diffusion rate, product adoption change ratio and consumer trust of claimed product information based on different standards and market access probability, etc. The key constants include the initial number of users, potential market volume, etc. Their relationships are discussed in Section 3. For more details on the equations, refer to Section 4.2. The impact factors of standards are based on comprehensive evaluation of the critical standards.
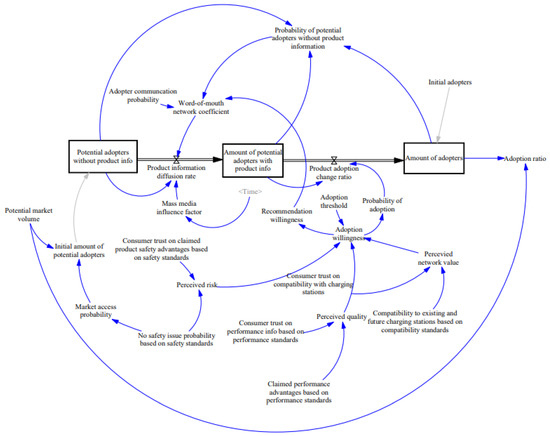
Figure 6.
System Dynamics flow diagram of consumer adoption.
Note: We are willing to share the simulation data and code with those who wish to replicate the results of this research.
4.2. The Equations of the SD System
The equations are established based on other literature, with adjustment for electric vehicle product scenarios; for details, refer to the equations below.
- (1)
- Mass media influence factor
With reference to the p value (mass media influence factor) in the Bass model, the maximum p factor of electric vehicle products is 0.009 using a genetics algorithm [23]. Considering the decreasing marginal effect, the mass media influence coefficient is set to naturally decay at a −0.05 ratio.
- (2)
- Word-of-mouth network coefficient
The influence coefficient is related to the probability of communication and interpersonal contact, whether the contact objects are adopters who have not obtained the product information and the recommendation willingness of the adopters. Based on [24], we set the word-of-mouth network factor as follows:
Word-of-mouth network coefficient = probability of potential adopters without product information × adopter communication probability × recommendation willingness.
- (3)
- Product information diffusion rate
Based on the Bass model and [24], we set the product information diffusion rate based on the following equation:
Product information diffusion rate = mass media influence factor × potential adopters without product information
- (4)
- Perceived risk
Based on [24], the perceived risk is a table function related to the safety standard and its trust factor. If the compliance to the safety standards of the product is high, and the consumer has high trust in the stringency of the safety standards, then the perceived risk will be small.
Perceived risk = WITH LOOKUP (probability of complying with safety standards × consumer trust of safety standards, ((0,0)–(10,10)), (0,0.9), (0.0.25,0.75), (0.55), (0.45,0.35), (0.6,0.25), (0.75,0.15), (0.9,0.05))
- (5)
- Perceived quality
Based on [24], perceived quality is a table function related to the performance standard and its trust coefficient. If the performance standard criteria is not stringent, consumers have less trust in the standard, which affects its perceived quality.
Perceived quality = WITH LOOKUP (probability of complying with performance standards × consumer trust of performance standards, ((0,0)–(1,1)), (0,0), (0.1,0.01), (0.3,0.4), (0.5,0.7), (0.7,0.8), (1,1)
- (6)
- Perceived network value
Based on [24], perceived network value is related to inter-operation and compatibility of the installation base and probability of complying with compatibility standards.
Perceived network value = consumer trust in compatible installation base × probability of complying with compatibility standards
- (7)
- Adoption willingness
Based on [24], this variable is the weighted sum of the perceived risk, quality and network value; it is compared with the adoption threshold.
Adoption willingness = (0.5 × perceived quality + 0.5 × perceived network value-perceived risk) − adoption threshold
- (8)
- Adoption probability
Based on [24], adoption probability is the table function, WITH LOOKUP (adoption willingness, ((0,0)–(10,10)), (0,0), (0.15,0.025), (0.3,0.05), (0.45,0.075), (0.6,0.15), (0.75,0.2), (0.9,0.35))
- (9)
- Initial number of potential adopters
The initial number of potential adopters is related to the market access probability. Here we include both safety standards and performances standards for certain markets that require compliance with such standards before entering the national market.
Initial number of potential adopters = market access probability × potential market volume = market access probability × probability of complying with safety standard × probability of complying with performance standard
- (10)
- Product adoption change rate
Product adoption change rate = probability of adoption × number of potential adopters with product info.
- (11)
- Recommendation willingness
We assume that the recommendation willingness is linearly related to adoption willingness; thus, Recommendation willingness = Adoption willingness × 0.8
- (12)
- Others
The other variables, such as integral value of level variables, are easy to understand, so the equations are not listed here.
5. Simulation of the SD Model
5.1. Parameter Initialization
Simulation is carried out using SD simulation software Vensim PLE 7.3.5, taking INITIAL TIME = 0, FINAL TIME = 200, TIME STEP = 0.03125, Units of Time: Month.
The other assigned parameters are referenced in Table 2 and are based on the information of publicly listed firms or changes in the reasonable range to reflect electric vehicle analysis. The parameters are tested to find their impact on diffusion depth and diffusion speed. The ranges of parameters are based on reasonable assumptions, such as consumer trust levels from 40% to 80% to reflect negative and positive trust levels. The probabilities of complying with standards are based on EV accident reports, EV recall data and case studies, which are comprehensively evaluated indexes.

Table 2.
The initial parameters of the SD model.
The sensitivity test is carried out on several variables, including probability of no safety issues based on safety standards, claimed performance advantages based on performance standards, and compatibility with existing and future charging stations based on compatibility standards.
5.2. Sensitivity Analysis of Probability of No Safety Issues Based on Safety Standards
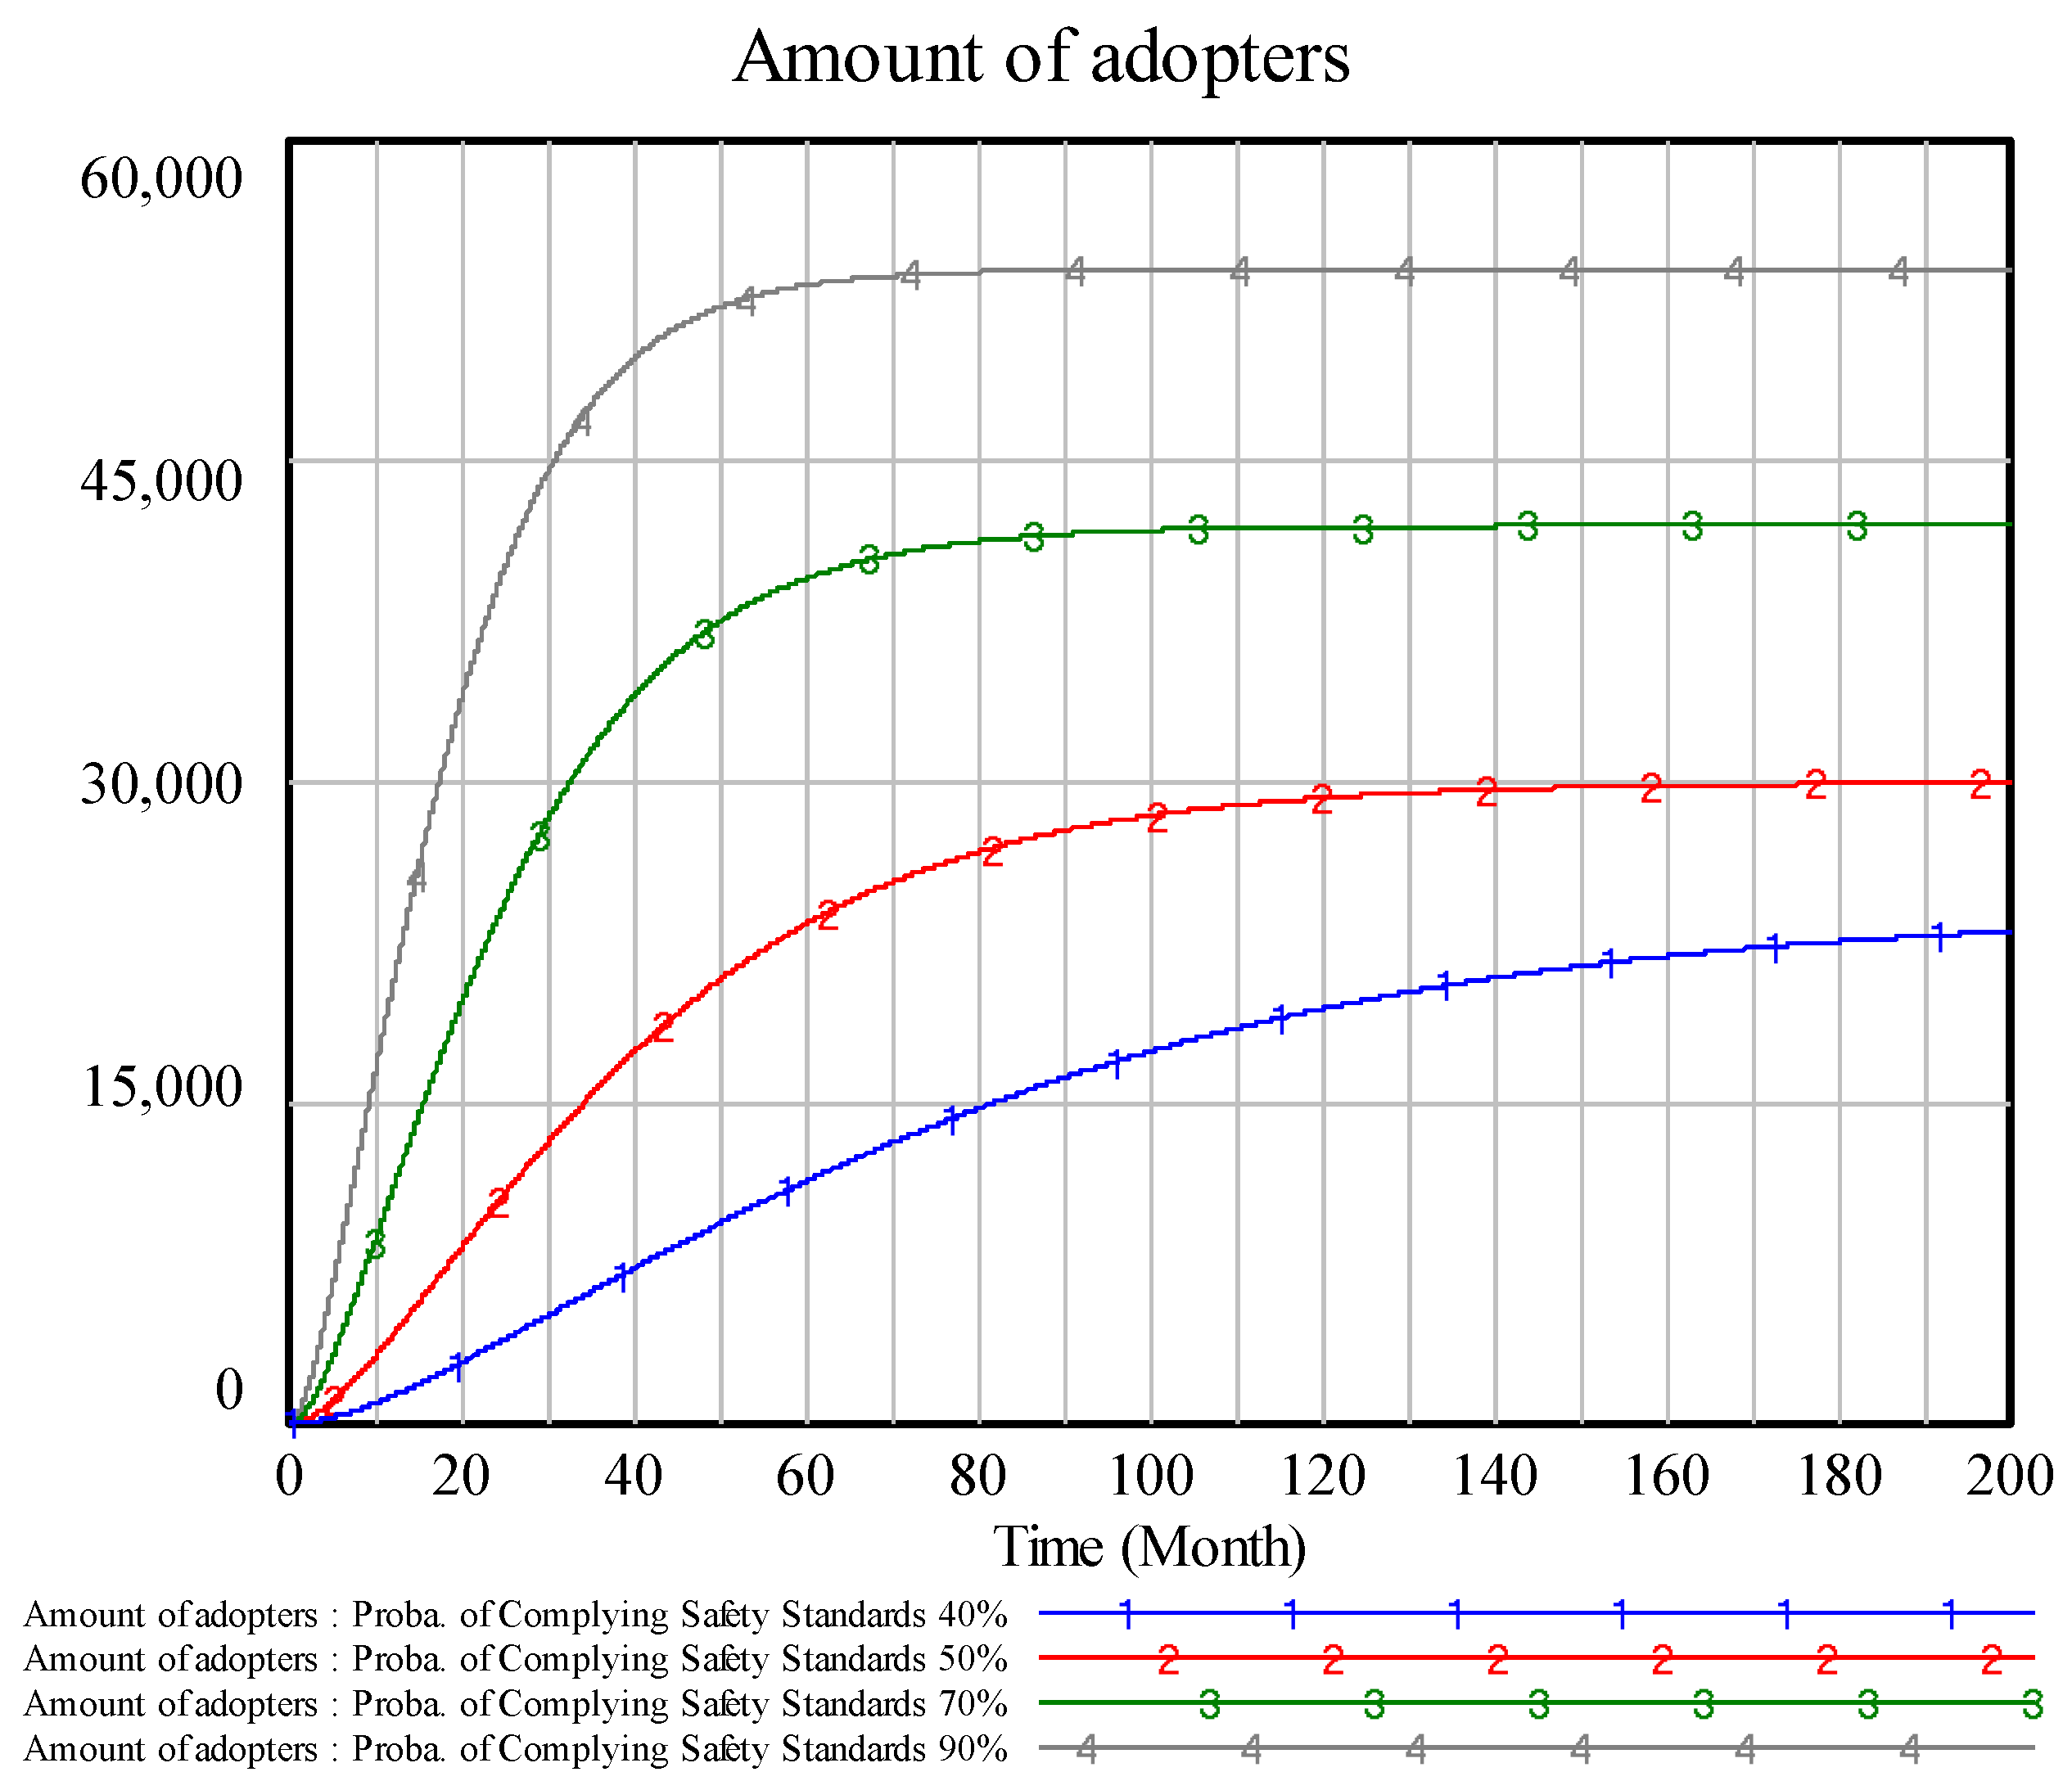
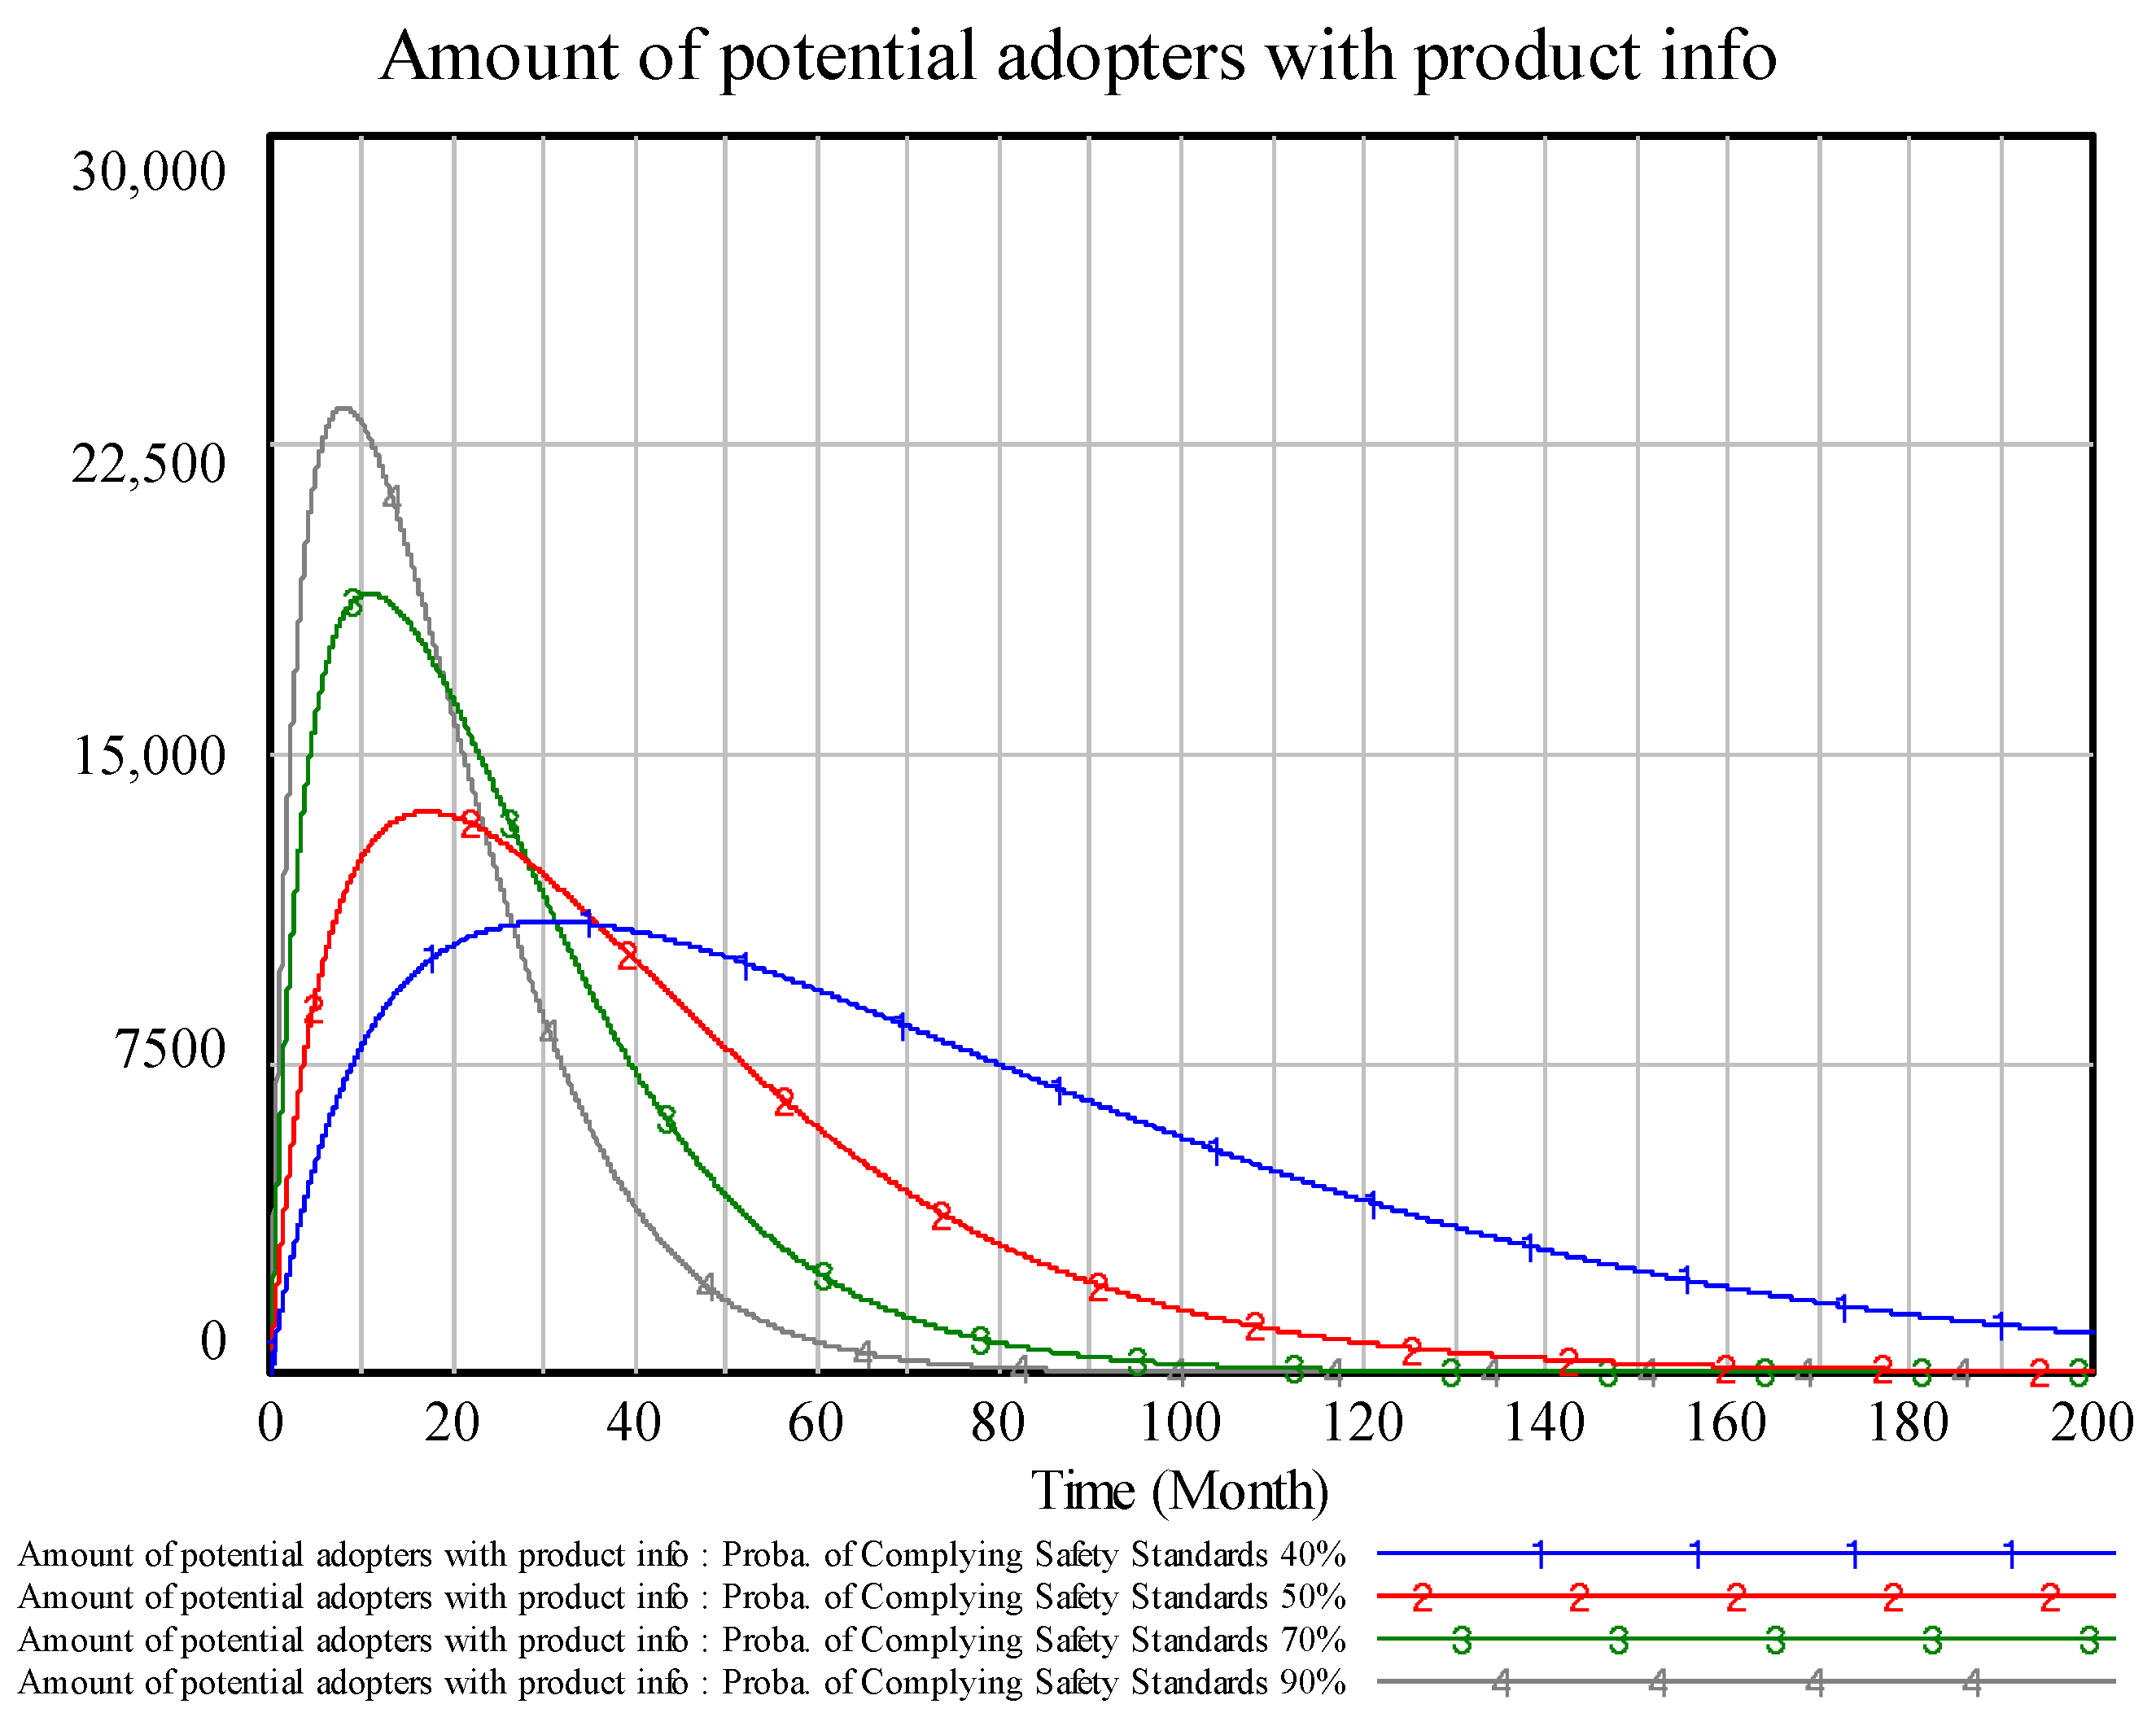
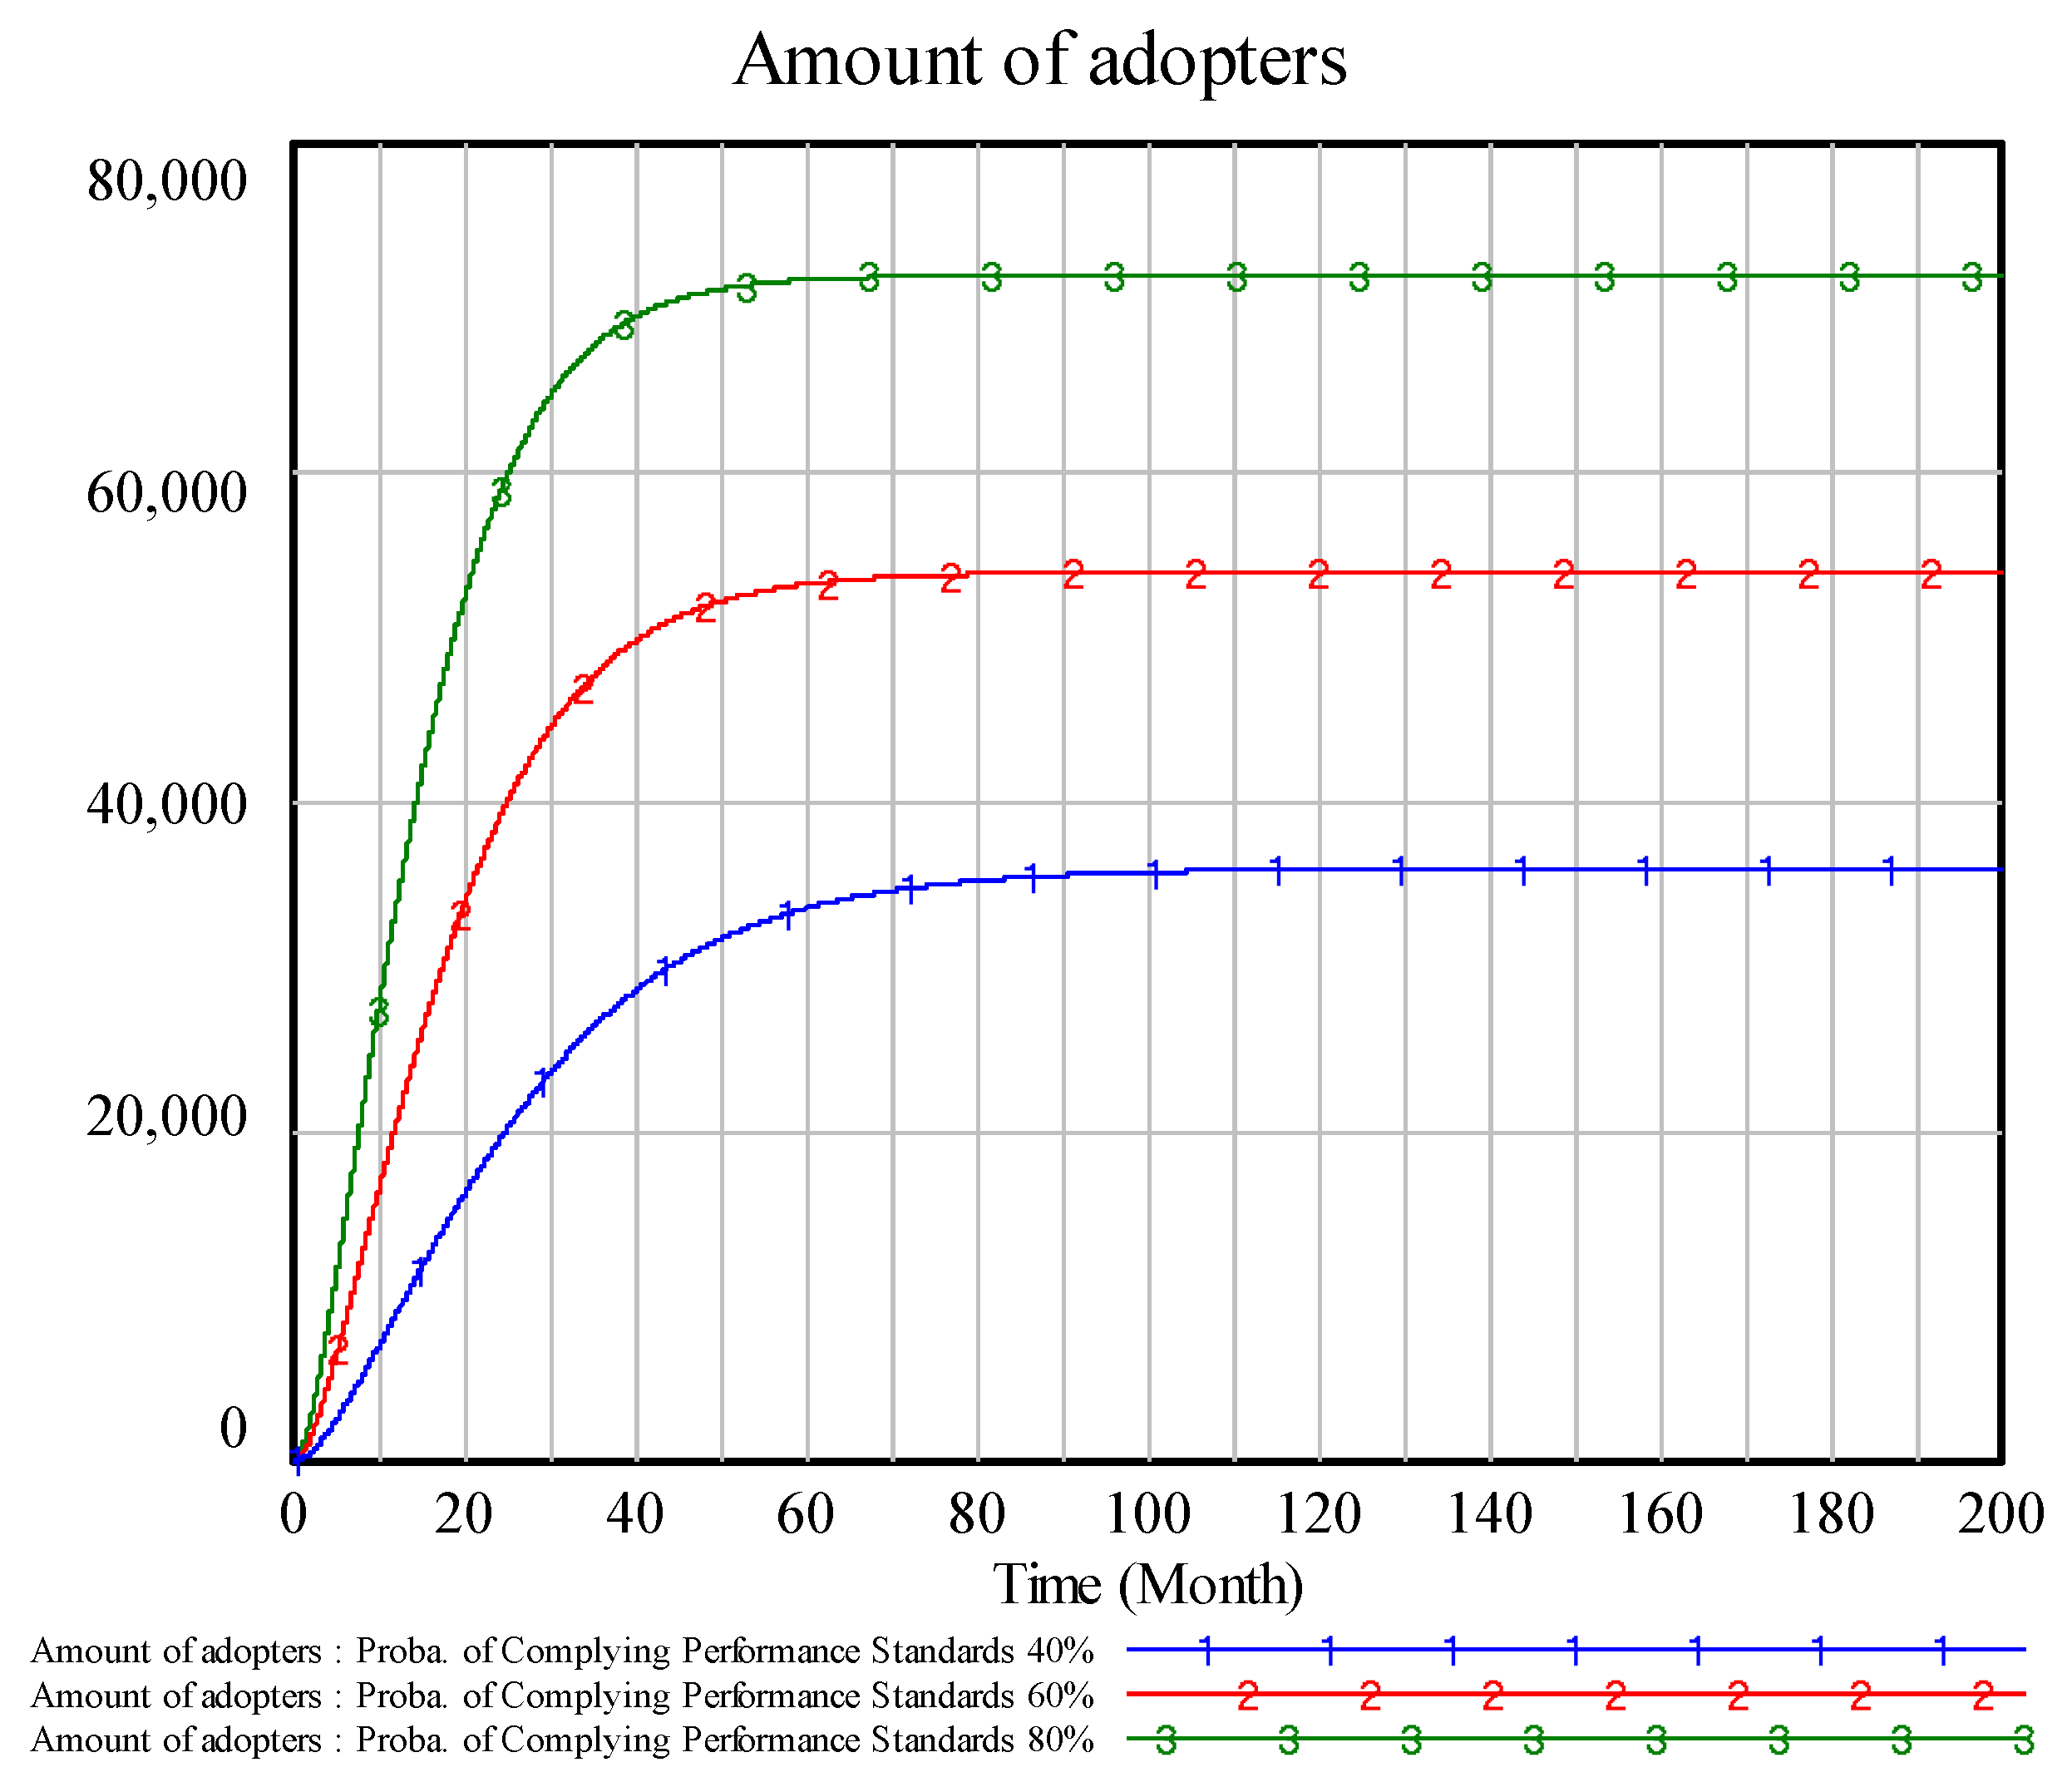
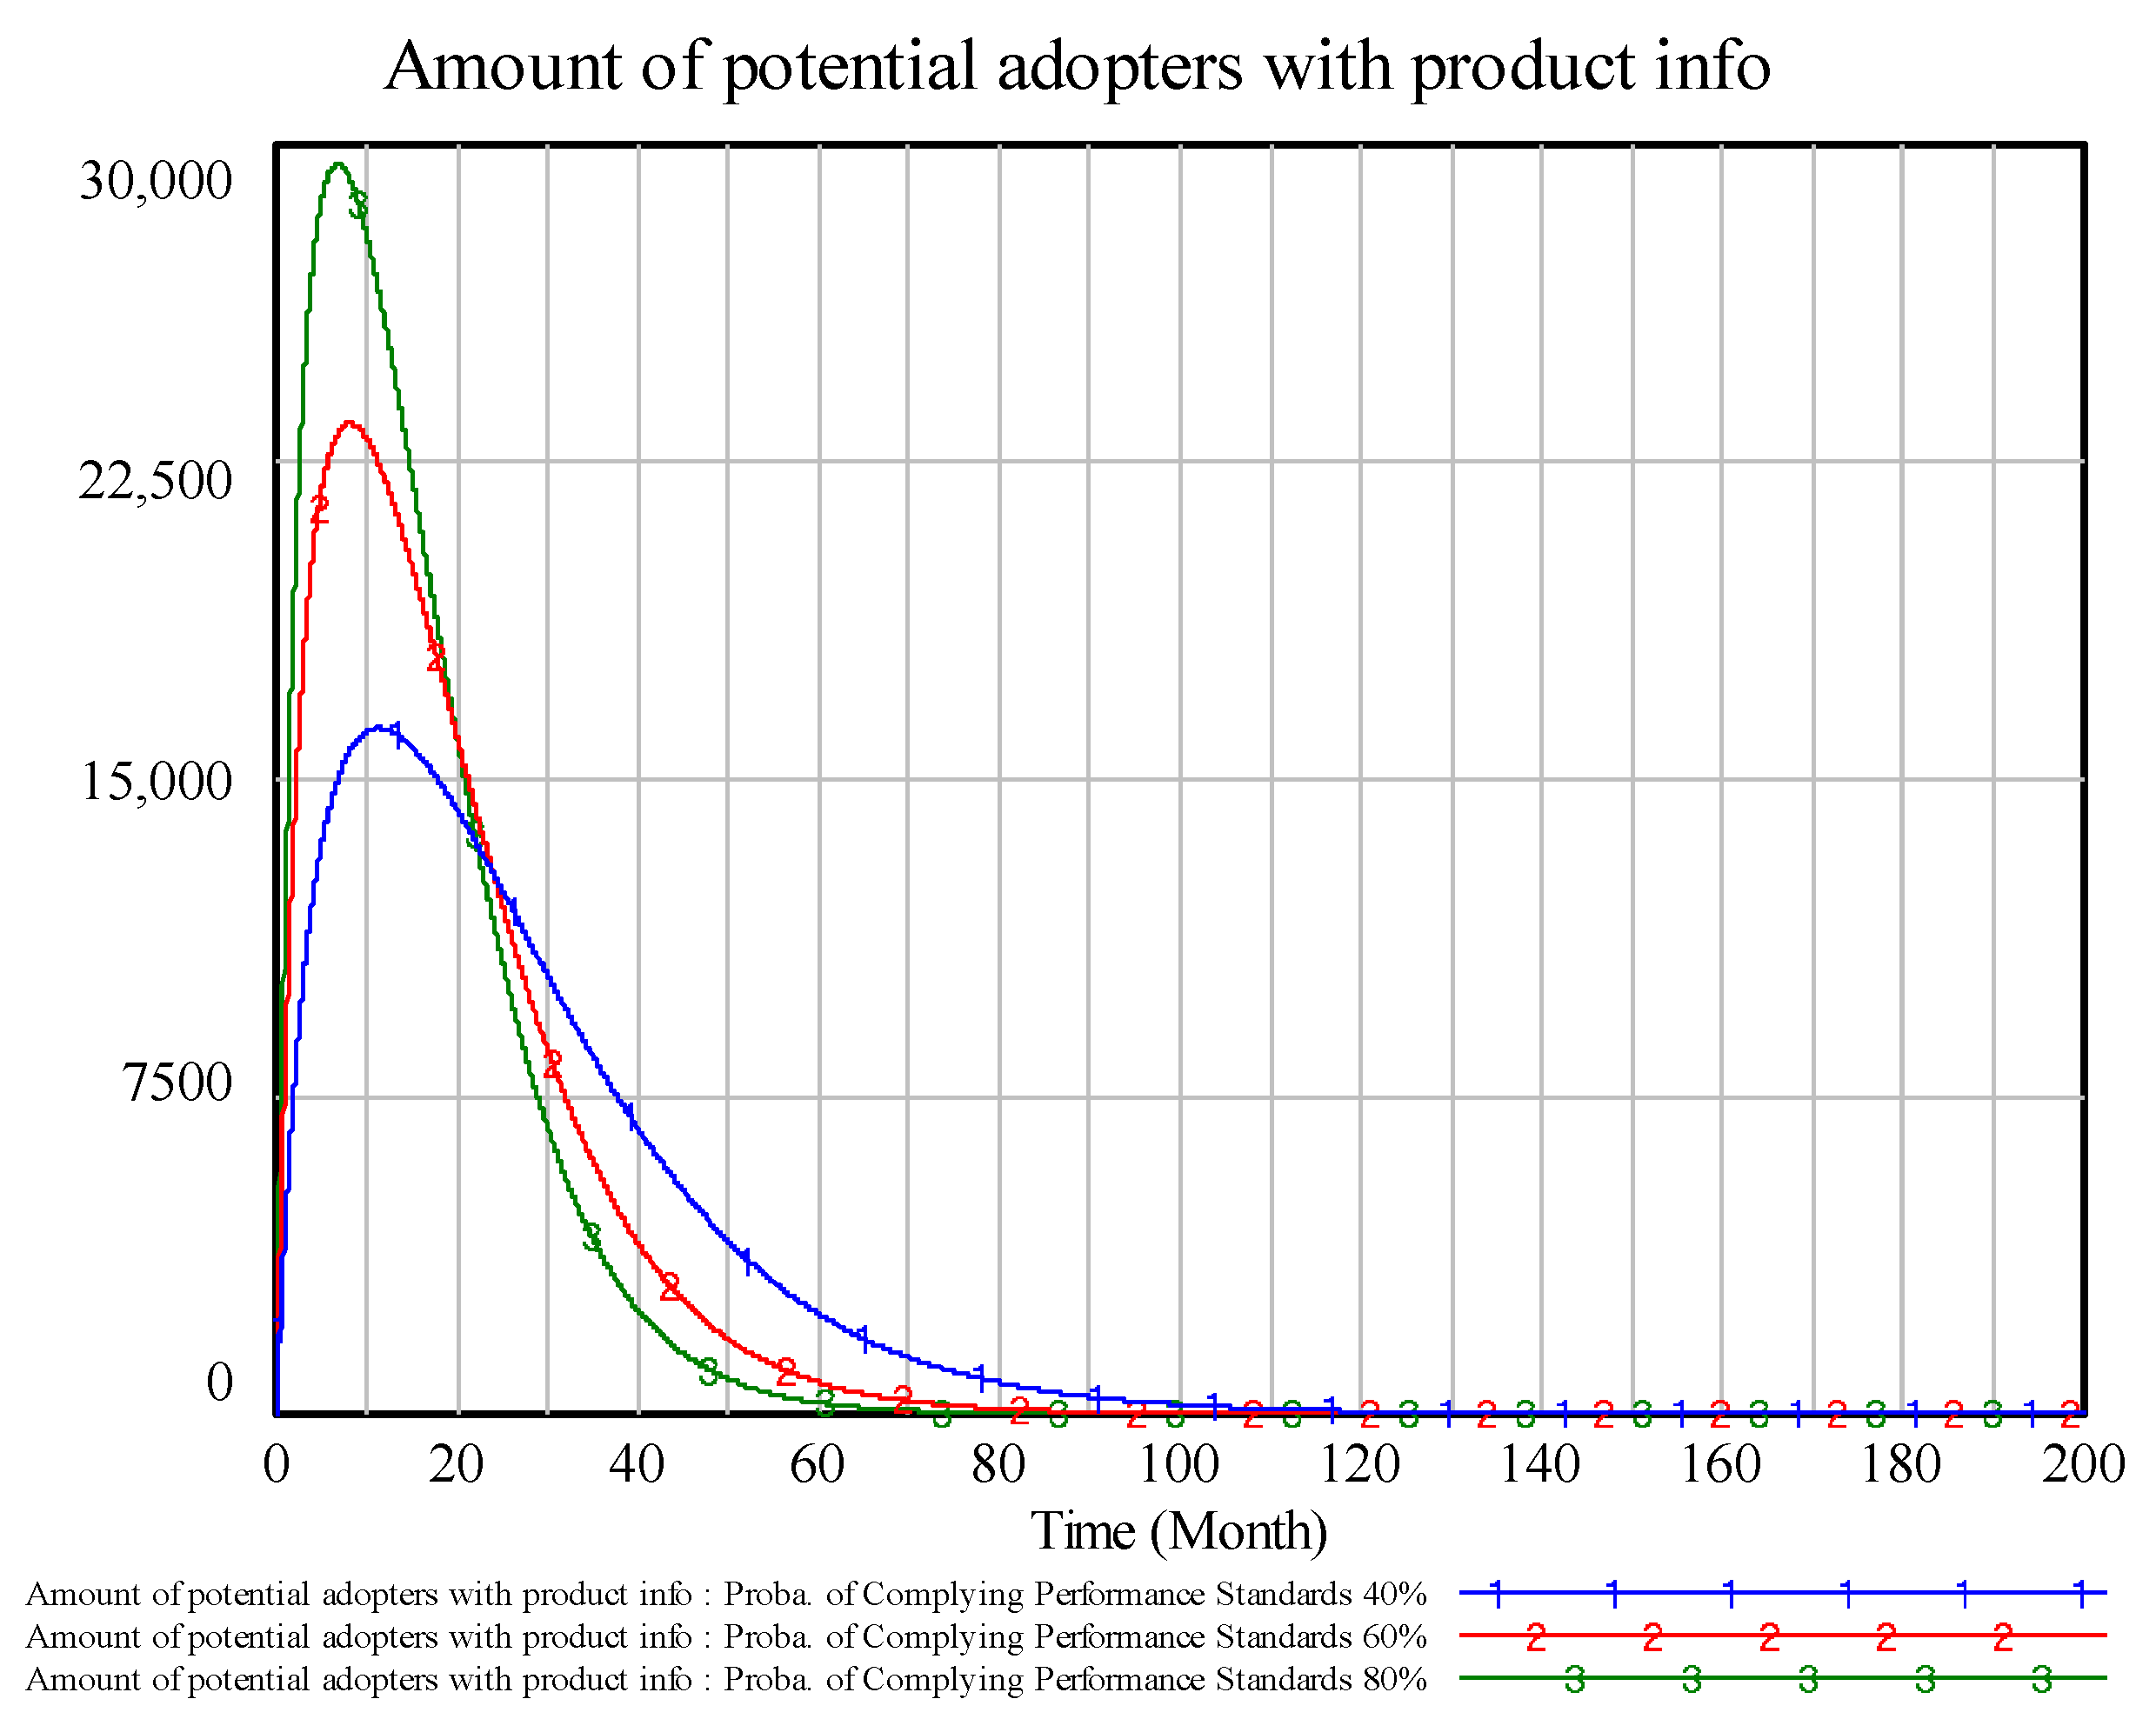
From Figure 7 and Figure 8, the diffusion depth and speed are positively related to the probability of complying with safety standards (probability of no safety issues based on safety standards) and changing the number of adopters who know the product information has a positive relationship with the factor. The factor change for innovation diffusion depth can be explained through the market access and consumer perceived risk mechanism. Decreasing probability from 90% to 40% caused significant drops in diffusion depth. This is also proven by the number of adopters who know the product information—the maximum number at 90% is more than twice that at 40%, indicating that the lower probability of complying with safety standards significantly reduces willingness of adoption and speed of adoption. Further, we found the ratio of potential consumers drops fast with product information dissemination, which means speed to transform potential consumers to actual adopters is accelerated if the product has a higher safety level.
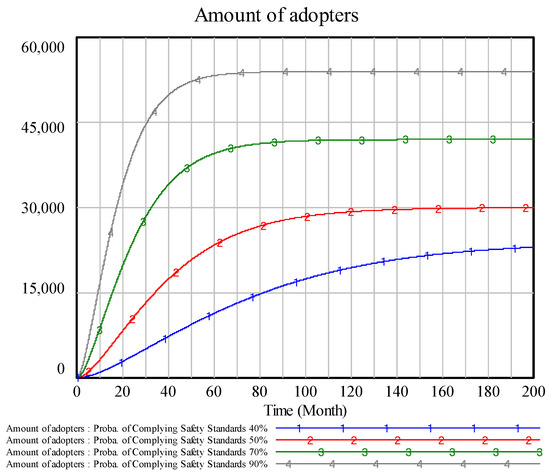
Figure 7.
Sensitivity of probability of complying with safety standards on number of adopters.
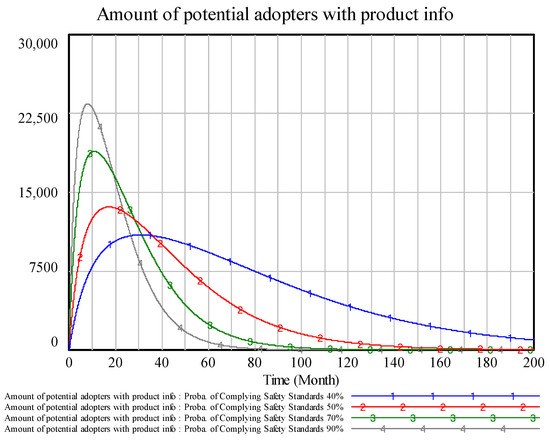
Figure 8.
Sensitivity of probability of complying with safety standards on number of potential adopters with product info.
5.3. Sensitivity Analysis of Probability of Complying with Performance Standards (Claimed Performance Advantages Based on Performance Standards)
From Figure 9 and Figure 10, probability of complying with performance standards has a positive relationship with adoption depth. With higher product performance levels, the recommendation and marketing mechanisms can be facilitated to increase the number of potential adopters that gain product information, resulting in more potential customers, as the peak number of potential adopters is almost twice at 80% compliance vs. 40%, which indicates that consumer has more trust and willingness to share product information through word-of-mouth. Further, the peak value of potential adopters is higher, which means higher product performance claims reached more potential consumers. Improving performance level is important to increase diffusion depth and numbers of potential consumers. However, the depth cannot reach the mature level, as diffusion depth is lower than probability as there are other factors influencing consumer adoption behavior.
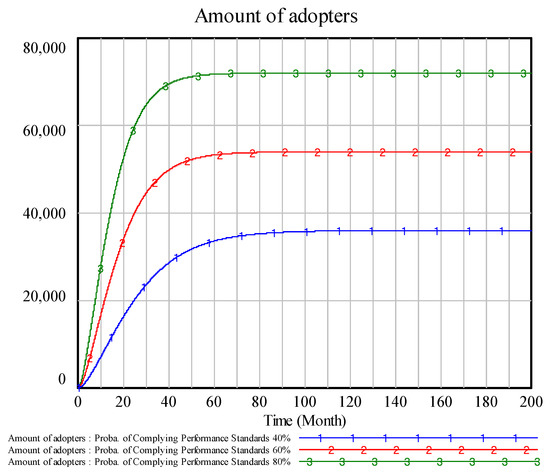
Figure 9.
Sensitivity of probability of complying with performance standards on number of adopters.
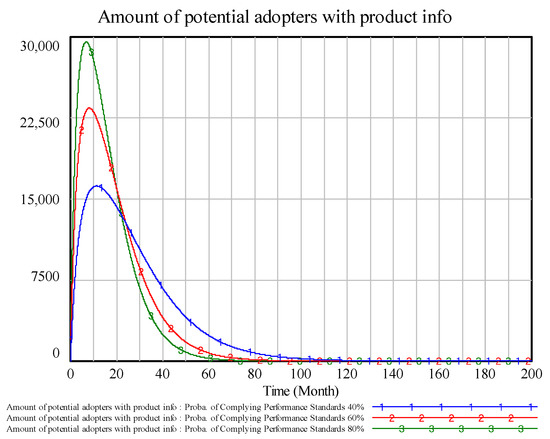
Figure 10.
Sensitivity of probability of complying with performance standards on number of potential adopters with product info.
5.4. Sensitivity Analysis of Compatibility with Existing and Future Charging Stations Based on Compatibility Standards (Complying with Compatibility Standards)
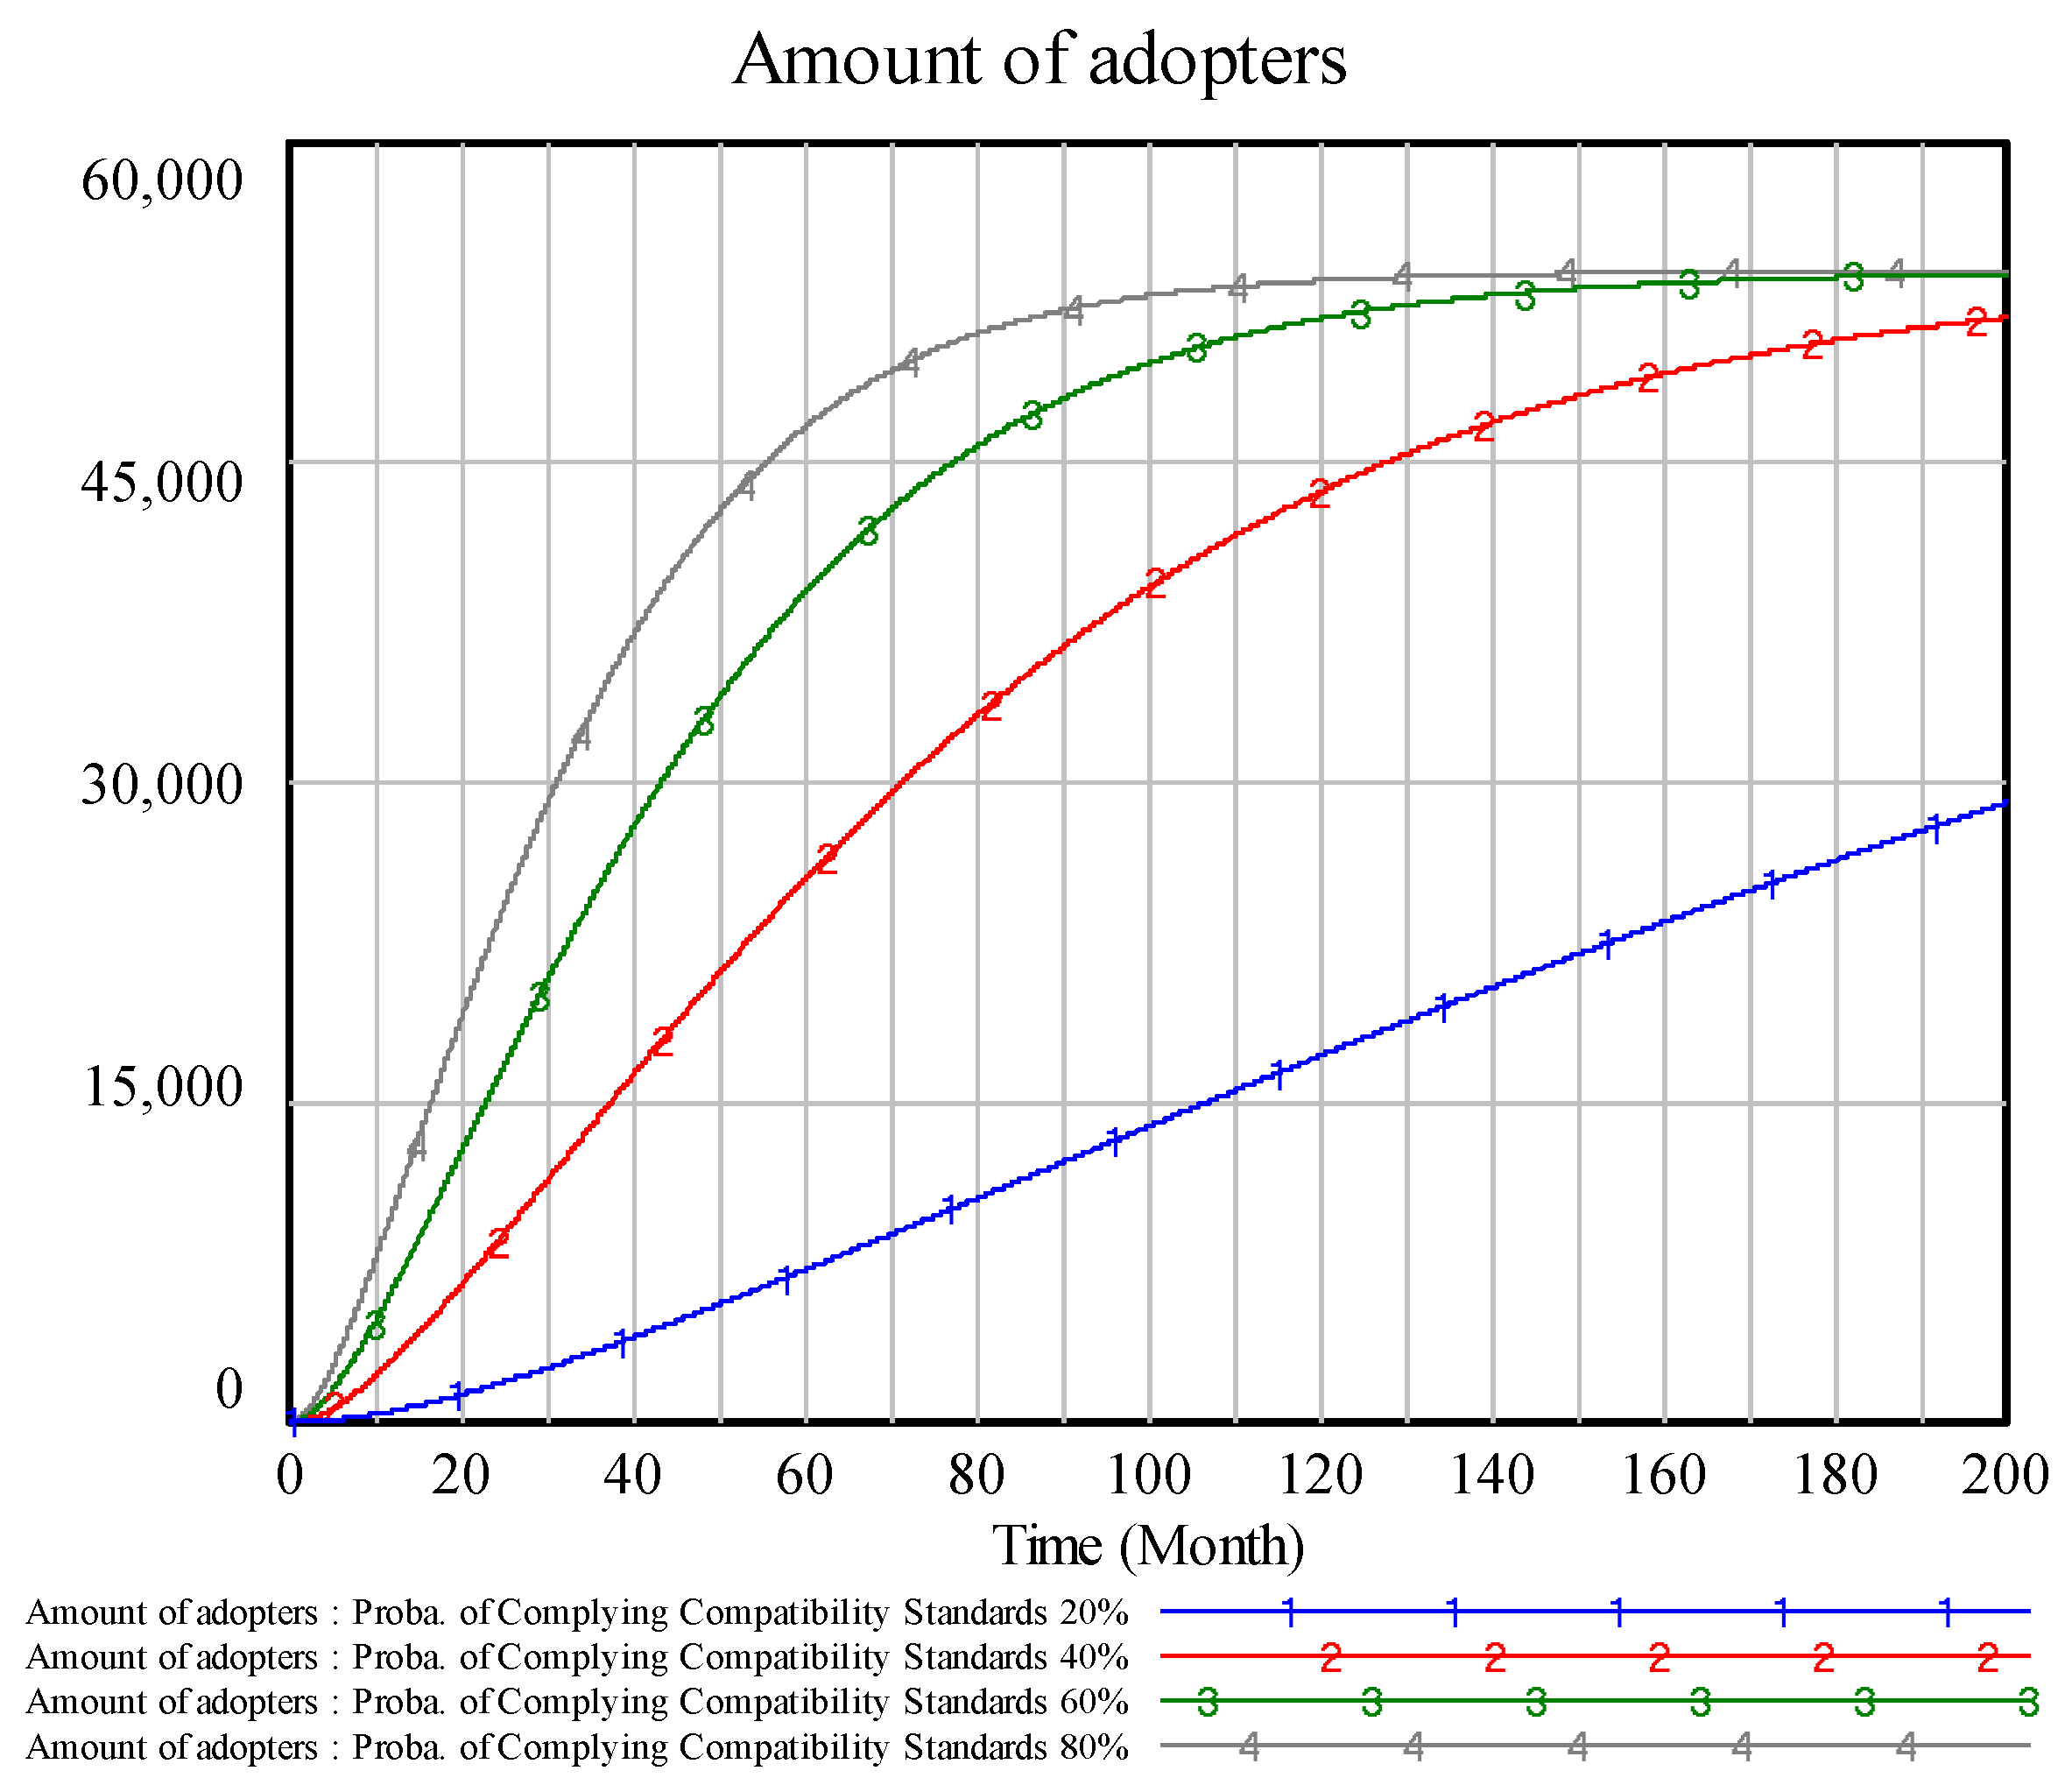
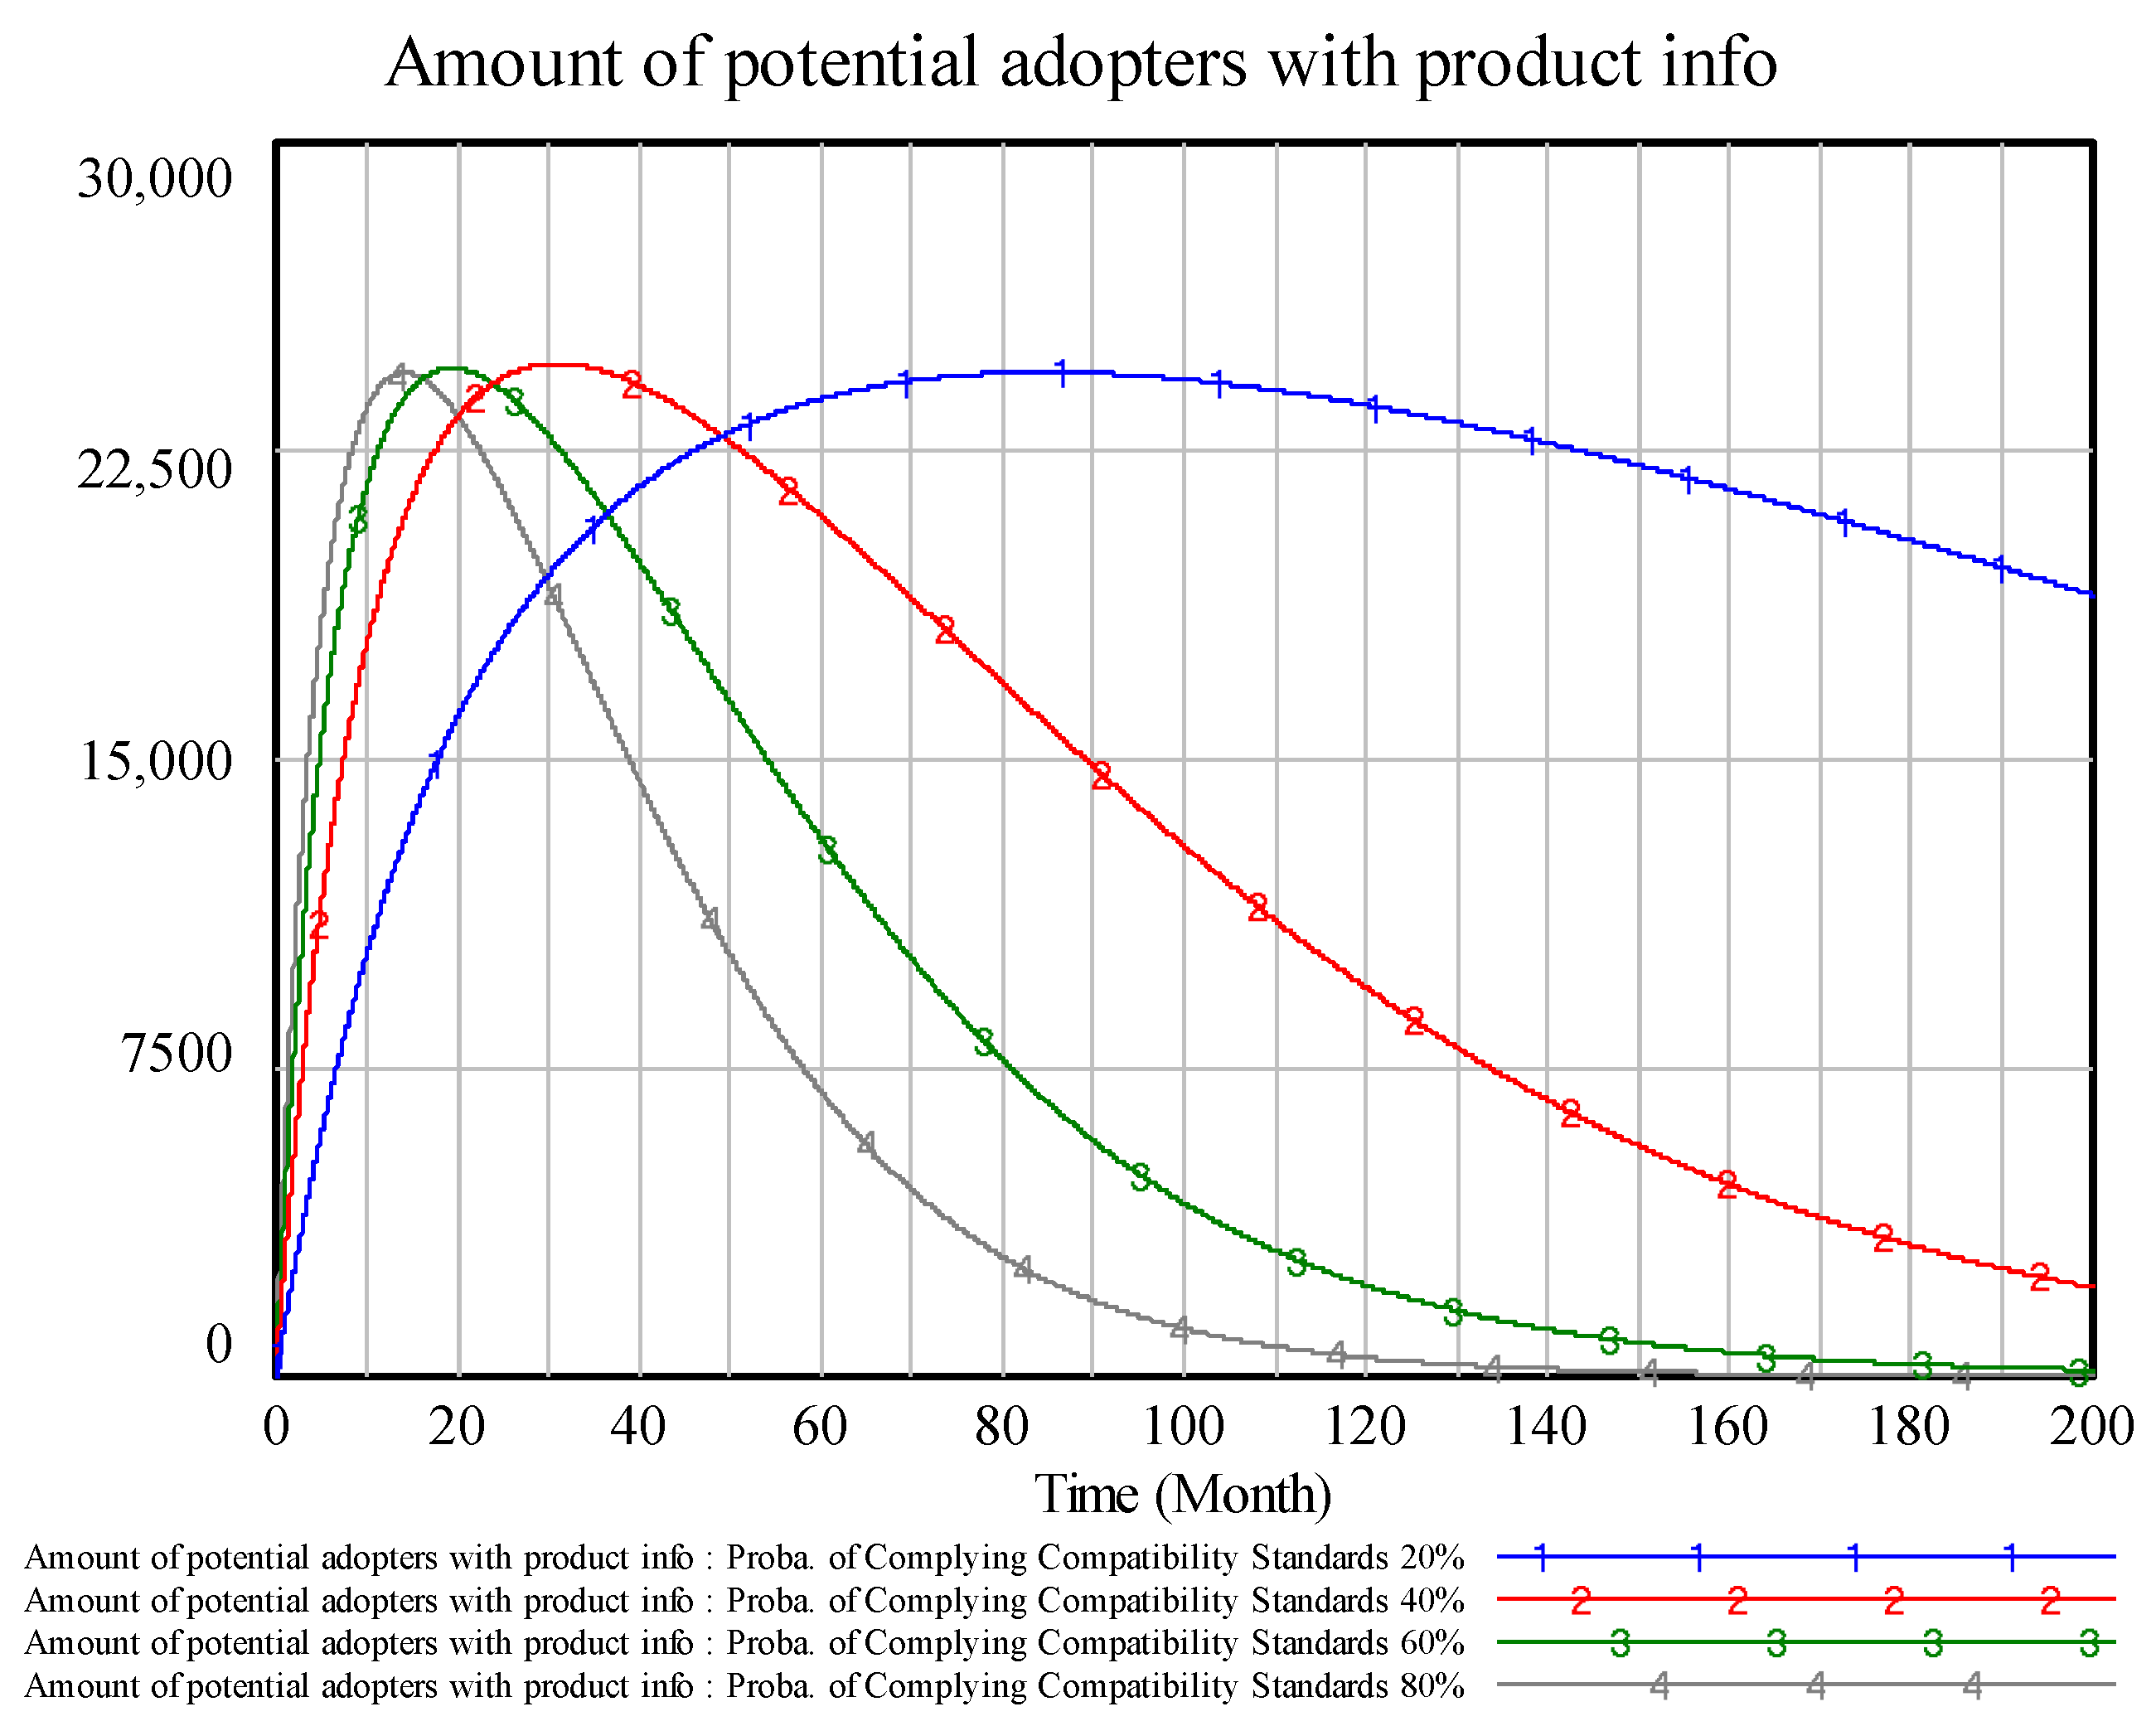
Figure 11 and Figure 12 show that compatibility compliance probability positively impacts innovation diffusion depth and diffusion speed; diffusion speed at 20% is much lower than 40–80%. Further, the rate of change for the decrease of potential consumers is much lower at higher probabilities, showing there is minimum threshold to reach expected diffusion depth. This can be explained by the factor change in the perceived network value of consumers, especially in the early stages of adoption. The compatibility influence is much higher than in the later stages, indicating that EV firm investment in compatibility could play an important role during the early competition stage. Further, for the compatibility factor 60% to 80%, innovation diffusion depth has no big difference, which means there is a high threshold above which there is not a big change of adopters. The peak value of potential gained with product information is similar, while the speed to reach the peak value is positively correlated with the factor, indicating information diffusion speed can be higher for more-compatible products, while probability level has no big effect on the maximum number of potential consumers.
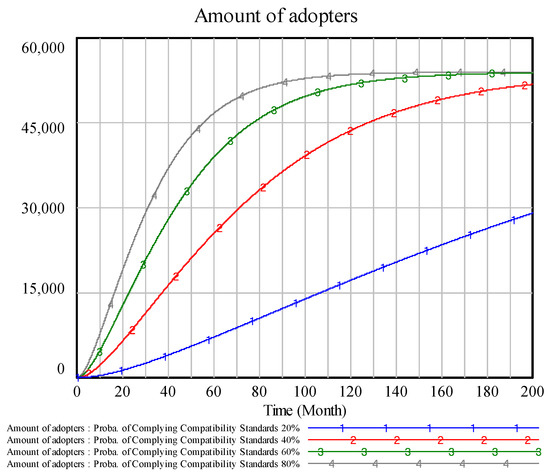
Figure 11.
Sensitivity of probability of complying with compatibility standards on number of adopters.
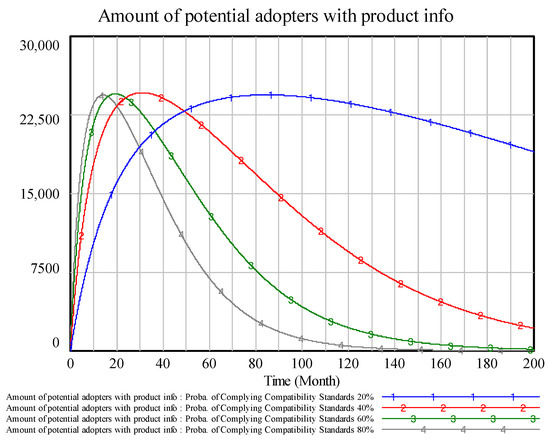
Figure 12.
Sensitivity of probability of complying with compatibility standards on number of potential adopters with product info.
6. Conclusions
As there are voluntary and mandatory standards to regulate product testing and product information data to be disclosed to consumers, it is important to identify the influence of various standards on innovation diffusion and how the mechanism of influence is connected to standards, product information and consumer adoption. Based on this study, we aim to support manufacturers and policy makers to set adequate standards and deliver appropriate quality information to consumers in order to promote product diffusion based on compliance with safety, performance and compatibility requirements to increase welfare, safety, health and the environment with better products. This paper tried to explain the influence of technical standards and consumer trust of the standards on electric vehicle adoption and innovation diffusion with a conceptual model and corresponding system dynamics model to explore the heterogeneous effects of different types of technical standards.
The major conclusions of the study include:
- (1)
- Quality attributes of EVs can be distinguished into intrinsic, measured, claimed and perceived quality attributes. Consumer trust is mainly based on the gap between claimed and actual attributes. Consumer adoption is based on perceived quality attributes based on experience and word-of-mouth. Therefore, manufacturers and policy makers will do best to represent the actual user scenario and deliver sufficient product quality information for promoting EV adoption in the long term.
- (2)
- Safety standards have a critical impact on innovation diffusion depth and speed. Safety standard market access probability is changed through technical barriers to trade, indirect effects of consumer trust, and consumer trust in safety standards and probability of complying with safety standards, which jointly affect consumers’ perceived risk. If safety standards are stringent, products encounter high barriers to access the market; however, if the requirement level is too low, consumers’ perceived risk is higher than that based on true data or actual accident history of electric vehicles. Thus, balance/trade-offs in safety standards between consumer needs, existing state-of-the-art technology, costs, risk assessment, etc. need to be taken into account for creating comprehensive and strategic policies.
- (3)
- Performance standards positively adjust the perceived quality, and improving product performance can accelerate diffusion speed and increase diffusion depth. Product performance improvement can increase consumers’ perceived quality and increase consumers’ recommendation willingness through word-of-mouth. Compared with traditionally fueled vehicles, electric vehicles have certain performance advantages and disadvantages, with range anxiety and charging time being key factors. If the performance standard threshold is increased, then consumers’ trust in performance standards and performance information is improved. On the contrary, if firms conceal relevant performance information through misleading test results, or disclose only partial performance data under the most-favorable conditions, they will lose consumer trust in the long term. Therefore, firms need to balance between technical investment and marketing claims to be competitive and win consumers’ trust for sustainable growth.
- (4)
- Compatibility standards and consumer trust in compatible installation bases such as charging facilities jointly affect the perceived network value, which positively affects adoption willingness and innovation diffusion. Due to inconsistency among different electric vehicle products, such as battery interfaces and parameters of charging devices, trust in compatibility impacts consumer adoption willingness and behavior. Consideration of compatibility standards and installation bases has a significant positive impact on innovation diffusion. It can greatly improve diffusion speed, and mutually compatible charging facilities can reduce unnecessary investment and waste of resources. Government and industry can take regulatory action to speed up the compatibility of vehicles and charging stations.
The innovation of this paper mainly includes the following aspects:
- (1)
- Based on innovation diffusion theory, TAM, Multi-Attribute Utility Theory (MAUT) and Prospect Theory, we distinguished between claimed quality attributes, intrinsic quality attributes, measured quality attributes and perceived quality attributes. We established a new Standard-Information-Behavior framework, then elaborated the conceptional relationships to explain perceived quality, perceived network value, perceived risk and consumer trust factors, to which we applied innovation diffusion theory to connect standard and consumer behavior. The factors of technical standards and consumer adoption were included in the model to explain EV production and consumption. This model can also be used as a reference for other industries and products.
- (2)
- We extended the adoption model to consider technical standards, consumer trust, product information, perceived risk, perceived quality and perceived network value, which are factors influencing adoption willingness. The adoption behavior influence mechanism due to the technical standards is clarified through the factors.
- (3)
- The intrinsic quality attributes are the inherent characteristic; the measured quality attributes are tested against the technical standards; the claimed quality attributes are based on manufacturer advertising; the perceived quality attributes are experienced quality characteristics, which are more related to intrinsic quality attributes.
- (4)
- A System Dynamics model with simulation was introduced to explain the heterogeneous effects of claimed different types of quality attributes based on technical standards on consumer adoption of EVs. The model is comprised of factors based on the conceptional mechanism based on the background theory. We explored quantitatively in detail how the different types of quality factors change consumer adoption behavior.
For the electric vehicle industry and firms, it is necessary to design and implement different technical standardization, R&D and marketing claim strategies based on the different standard types, as mandatory regulations that have been adopted (e.g., safety standards) impact market access and consumers’ perceived risk. It is critical to set up reasonable criteria to meet the minimum threshold and win consumers’ confidence in electric vehicle safety features. Regarding performance standards and consumer trust of performance claims, it is important to find the major aspects of performance to be competitive and increase the adoption willingness of consumers. For compatibility standards, consumers gain more network benefits from public charging devices that reduce range anxiety. It is critical to know the compatibility investment and return for adopters and potential adopters.
For policy makers, as settings standards involving manufacturers, etc., the study implied standards should be stringent enough to protect consumers and their surroundings, which is also important for customers’ trust in the standards and product information; also, it is important for performance information to reflect actual conditions of use, and product information shall be complete and reliable to avoid information asymmetry; it is critical for policy makers to align charging compatibility standards at both local and global levels so as to reduce redundant investment and maintenance cost, which are important factors to accelerate EV product diffusion.
Nevertheless, there are some limitations of this study. Firstly, the model and simulation are an experiment of the relationship between factors, and more empirical data, such as survey data, can be collected in future studies. Secondly, even though we considered many factors, future work can extend to other factors, such as the interaction and interplay among stakeholders, the heterogeneous decision-making behavior of consumers, the network structure of consumers, patent systems and supply chain structure [38,39]; also, it is critical to know the compatibility investment and return under competition scenarios. Therefore, considering other factors, such as the impact of network structure, competition relationship and patent licensing, is our future research direction in this area. Further, the framework and models can be extended to other products and technologies in the renewable energy arena by taking into consideration the specified standards, industry and adopters.
Author Contributions
Conceptualization, Z.Z.; Formal analysis, W.S. and M.Y.; Investigation, W.S.; Methodology, M.Y.; Project administration, Z.Z.; Resources, Z.Z.; Software, W.S.; Visualization, W.S.; Writing – original draft, W.S.; Writing – review & editing, M.Y.; Funding acquisition, Z.Z. All authors have read and agreed to the published version of the manuscript.
Funding
This research was funded by [The Science and Technology Commission of Shanghai Municipality] grant number [22692104500] and The APC was funded by [The Science and Technology Commission of Shanghai Municipality].
Institutional Review Board Statement
Not applicable.
Informed Consent Statement
Not applicable.
Data Availability Statement
The data used to support the findings of this study are included within the article.
Conflicts of Interest
The authors declare that they have no known competing financial interests or personal relationships that could have appeared to influence the work reported in this paper.
References
- Coffman, M.; Bernstein, P.; Wee, S. Electric vehicles revisited: A review of factors that affect adoption. Transp. Rev. 2017, 37, 79–93. [Google Scholar] [CrossRef]
- Bahrami, S.; Atkin, B.; Landin, A. Innovation diffusion through standardization: A study of building ventilation products. J. Eng. Technol. Manag. 2019, 54, 56–66. [Google Scholar] [CrossRef]
- Sartori, E.; Colapinto, C.; Tolotti, M. Awareness, persuasion, and adoption: Enriching the Bass model. Phys. A Stat. Mech. Its Appl. 2014, 395, 1–10. [Google Scholar] [CrossRef]
- Forrester, J.W. Industrial Dynamics; MIT Press: Cambridge, MA, USA, 1961. [Google Scholar]
- Blind, K. The economic functions of standards in the innovation process. In Handbook of Innovation and Standards; Edward Elgar Publishing: Cheltenham, UK, 2017; pp. 38–62. [Google Scholar]
- Egyedi, T.M.; Ortt, J.R. Towards a functional classification of standards for innovation research. In Handbook of Innovation and Standards; Edward Elgar Publishing: Cheltenham, UK, 2017; pp. 105–131. [Google Scholar]
- Blind, K. The Impact of Standardization and Standards on Innovation: Compendium of Evidence on Innovation Policy Intervention; Manchester Business School, University of Manchester: Manchester, UK, 2013. [Google Scholar]
- Jan, M. Domestic regulation, international standards, and technical barriers to trade. World Trade Rev. 2005, 4, 249–274. [Google Scholar] [CrossRef][Green Version]
- Tassey, G. The economic nature of knowledge embodied in standards for technology-based industries. In Routledge Handbook of the Economics of Knowledge; Routledge: London, UK, 2015; pp. 189–208. [Google Scholar]
- Rogers, E.M. The Diffusion of Innovations; Free Press: Glencoe, IL, USA, 1962. [Google Scholar]
- Bass, F.M. Comments on “A new product growth for model consumer durables the bass model”. Manag. Sci. 2004, 50 (Suppl. S12), 1833–1840. [Google Scholar] [CrossRef]
- Harrison, G.; Thiel, C. An exploratory policy analysis of electric vehicle sales competition and sensitivity to infrastructure in Europe. Technol. Forecast. Soc. Chang. 2017, 114, 165–178. [Google Scholar] [CrossRef]
- Han, L. Research on Consumer Value Perception and Purchase Behavior Intention of Private Electric Vehicles. Ph.D. Thesis, University of Science and Technology of China, Hefei, China, 2019. [Google Scholar]
- Xu, Y.; Li, L. Research on long-term diffusion of new energy vehicles considering customer perceived utility in competitive markets. Appl. Res. Comput. 2021, 5, 1482–1486. [Google Scholar] [CrossRef]
- Simsekoglu, O.; Nayum, A. Predictors of intention to buy a battery electric vehicle among conventional car drivers. Transp. Res. Part F Traffic Psychol. Behav. 2019, 60, 1–10. [Google Scholar] [CrossRef]
- Hsin, H.C.; Su, W.C. The Impact of Online Store Environment Cues on Purchase Intention Trust and Perceived Risk as a Mediator. Online Inf. Rev. 2008, 32, 818–841. [Google Scholar] [CrossRef]
- Kirmani, A.; Baumgartner, H. Reference points used in quality and value judgements. Mark. Lett. 2000, 11, 299–310. [Google Scholar] [CrossRef]
- Goerlandt, F.; Li, J.; Reniers, G. The Landscape of Risk Perception Research: A Scientometric Analysis. Sustainability 2021, 13, 13188. [Google Scholar] [CrossRef]
- Febransyah, A. Predicting Purchase Intention towards Battery Electric Vehicles: A Case of Indonesian Market. World Electr. Veh. J. 2021, 12, 240. [Google Scholar] [CrossRef]
- Sunddararaj, S.P.; Rangarajan, S.S.; Nallusamy, S.; Collins, E.R.; Senjyu, T. A Brief Survey on Important Interconnection Standards for Photovoltaic Systems and Electric Vehicles. World Electr. Veh. J. 2021, 12, 117. [Google Scholar] [CrossRef]
- Dwivedi, Y.K.; Rana, N.P.; Jeyaraj, A.; Clement, M.; Williams, M.D. Re-examining the Unified Theory of Acceptance and Use of Technology (UTAUT): Towards a Revised Theoretical Model. Inf. Syst. Front. 2019, 21, 719–734. [Google Scholar] [CrossRef]
- Davis, F.D.; Bagozzi, R.; Warshaw, P. User Acceptance of Computer Technology: A Comparison of Two Theoretical Models. Manag. Sci. 1989, 35, 982–1003. [Google Scholar] [CrossRef]
- Xia, M.; Deng, X. An Analysis of the Optimal Effect of Government in the Diffusion of Industrial General Purpose Technologies-Based on the Transformed Bass Model. J. Beijing Inst. Technol. Soc. Sci. Ed. 2019, 21, 78–86. [Google Scholar]
- Ma, Y.; Wang, Z.; Li, H.; Zhou, W. Network structure, adopters preference and Innovation diffusion: A simulation analysis of the S-D model of innovation diffusion based on the decision making process of adopters. Oper. Res. Manag. Sci. 2016, 25, 106–115. [Google Scholar] [CrossRef]
- Shi, H.; Liu, Y.; Petruzzi, N.C. Consumer heterogeneity, product quality, and distribution channels. Manag. Sci. 2013, 59, 1162–1176. [Google Scholar] [CrossRef]
- Kim, S.; Choi, J.; Yi, Y.; Kim, H. Analysis of Influencing Factors in Purchasing Electric Vehicles Using a Structural Equation Model: Focused on Suwon City. Sustainability 2022, 14, 4744. [Google Scholar] [CrossRef]
- Ferguson, M.R.; Mohamed, M.; Higgins, C.D.; Abotalebi, E.; Kanaroglou, P.S. How open are Canadian households to electric vehicles? A national latent class choice analysis with willingness-to-pay and metropolitan characterization. Transp. Res. Part D Transp. Environ. 2018, 58, 208–224. [Google Scholar] [CrossRef]
- Tversky, A.; Kahneman, D. Advances in prospect-theory-cumulative representation of uncertainty. J. Risk Uncertain. 1992, 5, 297–323. [Google Scholar] [CrossRef]
- Kahneman, D.; Tversky, A. Prospect Theory: An Analysis of Decision under Risk. Econom. J. Econom. Soc. 1979, 47, 263–291. [Google Scholar] [CrossRef]
- Hu, L.; Dong, J.; Lin, Z. Modeling charging behavior of battery electric vehicle drivers: A cumulative prospect theory based approach. Transp. Res. Part C Emerg. Technol. 2019, 102, 474–489. [Google Scholar] [CrossRef]
- Li, S.; Yao, Q.; Xu, Z.; Gao, J.; Yang, Y. Based on Prospect Theory Regional Integrated Energy Electric Vehicle Scheduling Model. In E3S Web of Conferences; EDP Sciences: Les Ulis, France, 2021; Volume 299. [Google Scholar] [CrossRef]
- Yu, Q.; Yu, Z.; Ma, D. A Multiplex Network Perspective of Innovation Diffusion: An Information-Behavior Framewor. IEEE Access 2020, 8, 36427–36440. [Google Scholar] [CrossRef]
- Hidrue Michael, K.; Parsons George, R.; Kempton, W.; Gardner Meryl, P. Willingness to pay for electric vehicles and their attributes. Resour. Energy Econ. 2011, 33, 686–705. [Google Scholar] [CrossRef]
- Chu, Y.; Zhu, T. Research on Forecast of Electric Vehicle’s Ownership in China Based on Bass Model and GM(1,1) Model. Math. Pract. Theory 2021, 51, 21–32. [Google Scholar]
- Zheng, R. Research on the Legal System and Improvement of Defective Automobile Product Recall System. Master’s Thesis, East China University of Science and Technology, Shanghai, China, 2021. [Google Scholar]
- Sun, X.; Sun, R.; Xu, S. The Network Effect of Electric Vehicles Industry: Identification and Heterogeneity Test. China Soft Sci. 2018, 4, 132–145. [Google Scholar]
- Wang, Z.; Ma, Y.; Zhang, F. Study on Technical Innovation Diffusion Model and Simulation Based on System Dynamics. Sci. Technol. Prog. Policy 2015, 32, 13–19. [Google Scholar] [CrossRef]
- Sun, W.; Zhang, Z. Promoting Electric Vehicle Cell Innovation Diffusion Considering Patent Licensing Strategy: A Combination of Evolutionary Game and Optimization Algorithm Approach. World Electr. Veh. J. 2021, 12, 95. [Google Scholar] [CrossRef]
- Sun, W.; Yuan, M.; Zhang, Z. The Evolutionary Game Analysis and Optimization Algorithm of Electric Vehicle Cell Innovation Diffusion Based on a Patent Pool Strategy. World Electr. Veh. J. 2021, 12, 251. [Google Scholar] [CrossRef]
Publisher’s Note: MDPI stays neutral with regard to jurisdictional claims in published maps and institutional affiliations. |
© 2022 by the authors. Licensee MDPI, Basel, Switzerland. This article is an open access article distributed under the terms and conditions of the Creative Commons Attribution (CC BY) license (https://creativecommons.org/licenses/by/4.0/).

