Article

Exploring New Vista of Intelligent Recommendation Framework for Tourism Industries: An Itinerary through Big Data Paradigm

1
Atria Institute of Technology, Bengaluru 560024, Karnataka, India
2
Department of Computer Science and Engineering, Manipal University, Jaipur 303007, Rajasthan, India
3
LAMIH UMR CNRS 8201, Department of Computer Science, Université Polytechnique Hauts-de-France, 59313 Valenciennes, France
4
Department of Information System and Operation Management, College of Business Administration, Kuwait University, Safat 13060, Kuwait
*
Author to whom correspondence should be addressed.
Information 2022, 13(2), 70; https://doi.org/10.3390/info13020070
Submission received: 2 November 2021 / Revised: 18 January 2022 / Accepted: 18 January 2022 / Published: 29 January 2022
(This article belongs to the Special Issue Information Retrieval, Recommender Systems and Adaptive Systems)

Abstract

:
Big Data is changing how organizations conduct operations. Data are assembled from multiple points of view through online quests, investigation of purchaser purchasing conduct, and then some, and industries utilize it to improve their net revenue and give an overall better experience to clients. Each of these organizations must figure out how to improve the general client experience and meet every client’s novel necessities, and big data helps with this cycle. Through the utilization and reviews of Big Data, travel industry organizations can study the inclinations of more modest portions of their intended interest group or even about people in some cases. In this paper, a Crow Search Optimization-based Hybrid Recommendation Model is proposed to get accurate suggestions based on clients’ preferences. The hybrid recommendation is performed by combining collaborative filtering and content-based filtering. As a result, the advantages of collaborative filtering and content-based filtering are utilized. Moreover, the intelligent behavior of Crows’ assists the proper selection of neighbors, rating prediction, and in-depth analysis of the contents. Accordingly, an optimized recommendation is always provided to the target users. Finally, performance of the proposed model is tested using the TripAdvisor dataset. The experimental results reveal that the model provides 58%, 58.5%, 27%, 24.5%, and 25.5% better Mean Absolute Error, Root Mean Square Error, Precision, Recall, and F-Measure, respectively, compared to similar algorithms.

1. Introduction

Recommender Systems (RSs) function as a specialist for people who cannot decide on the conceivably overwhelming number of choices accessible on the World Wide Web. Neighborhood-based calculations are conventional methodologies for synergistic proposals and are mainstream because of their straightforwardness and proficiency.
Nowadays, people of different age groups prefer online purchasing. The instant availability of various alternatives, feedback of common people on items, and easy accessibility from home, is the major reason for such popularity. As a result, the inconsistencies during offline purchasing have been resolved substantially. However, host sites often face “information overload” problems to keep up the enriched services. Neighborhood-based recommender frameworks utilize various sorts of likeness measures between clients or things to accomplish assorted objectives for planning an RS, for example, exactness, curiosity, and variety.
Despite that, the current likeness measures can’t oversee the information sparsity issues well, which brings about either not many co-appraised things or positively no co-evaluated things. Moreover, there are additional circumstances where just the relationship among clients and things, such as purchasing practices, exist in the type of unary evaluations, a unique instance of appraisals. Neighborhood-based recommendations are essential, as it is very likely to have the same interests as any user on the same platform. However, the current definition of similar users is purely based on the ratings of the items neglecting other essential factors in it. A new model is proposed to recommend new items based on similar user selection, which uses the Simple Matching Coefficient (SMC) technique and Jaccard Index as similarity measures [1]. To further enhance this approach, Collaborative Filtering for Java (CF4J) and Jaccard Index was used. CF4J is used to accommodate similarities between two users using different frameworks together [2]. These days, the recommendation system assumes a pivotal function in the online business stage. The recommender framework has its function in conveying more exact and solid information to specific clients. The recommender framework accumulates the client’s pertinent information and feeling or the set of the gathering [3,4].
Big Data has been utilized in different businesses around the globe and the movement business has been one of them. The movement business is the one that intensely relies on the information it gathers and now has gotten more proficient withBig Data utilization. It has changed the movement business and is presently a vital part of their everyday activities. Big Data is taking the movement business the correct way. It deals with all that a voyager anticipates from the voyaging organization he is managing. From customized offers to giving recommendations about the spots you should visit; it is the ideal partner that an explorer needs. Tourism industries deploy Big Data to enhance their customer service model more realistically. Based on the tourists’ profile data, the travel industries decide to serve and recommend the clients better based on clients’ preferences. Travel industries also adapt Artificial Intelligent-based RSs to serve the clients in a better way. Generally, RSs are considered as a major area related to information retrieval. Since the last decade, there has been tremendous demand for RSs among common people around the world. It has been widely used in various fields related to human life, e.g., E-Commerce, Entertainment, Social Networking, Education, Tourism, etc. Recommenders are proven to be advantageous to buyers as well as sellers. From the sellers’ perspective, online selling has minimized business costs, that is, transportation, inventory, and maintenance substantially. The buyers have benefited in terms of the reliability of services and high-quality recommendations. Recommender Systems (RSs) are fundamental instruments of a web-based business in creating keen choices for a person to get item proposals. Neighborhood-based methodologies are conventional strategies for community suggestions and are well known because of their effortlessness and proficiency.
RSs can be looked at as the sub-branch of the whole dynamic filtering algorithms working in the market today. The movie recommendation systems’ maximum is based on K-Means and K-NN Means algorithms as studied and observed. However, with the increasing amount of movie content and users on a specific platform, this combination isn’t considered efficient. Katarya et al. [5,6] have used FCM (fuzzy C-means), a soft clustering technique, to increase its efficiency. Recommendation Systems are used for filtering the required information from a large bucket of information for every individual. However, while filtering the information, it is also very important that the retrieved information is relevant and useful for end-use. Gray wolf optimization and fuzzy c-means techniques are used on MovieLens data clusters to achieve high precision and accuracy. Some of the popular RSs are Movie recommendation on Netflix, Music recommendation on Pandora, Product recommendation on Amazon, Tourism recommendation on Trip-advisor, the Jokes recommendation in Jester, and Social recommendation on Facebook.
Primarily, RSs utilize intelligent algorithms, that is, Collaborative Filtering, Content-based Filtering, Demographic Filtering, Social-based Filtering, Knowledge-based Filtering, and Hybrid Filtering. Nowadays, all these algorithms are deployed in some commercial recommenders used by consumers in everyday life. Collaborative filtering considers user ratings to perform filtering and as such, the recommendations are based on users’ ratings who have a similar preference level as that of the target user. On the other hand, Content-based Filtering is made with the item information (features) and user’s preference (ratings) to those items. The recommended items are similar to the ones the user has already purchased. Demographic filtering is quite similar to collaborative filtering.
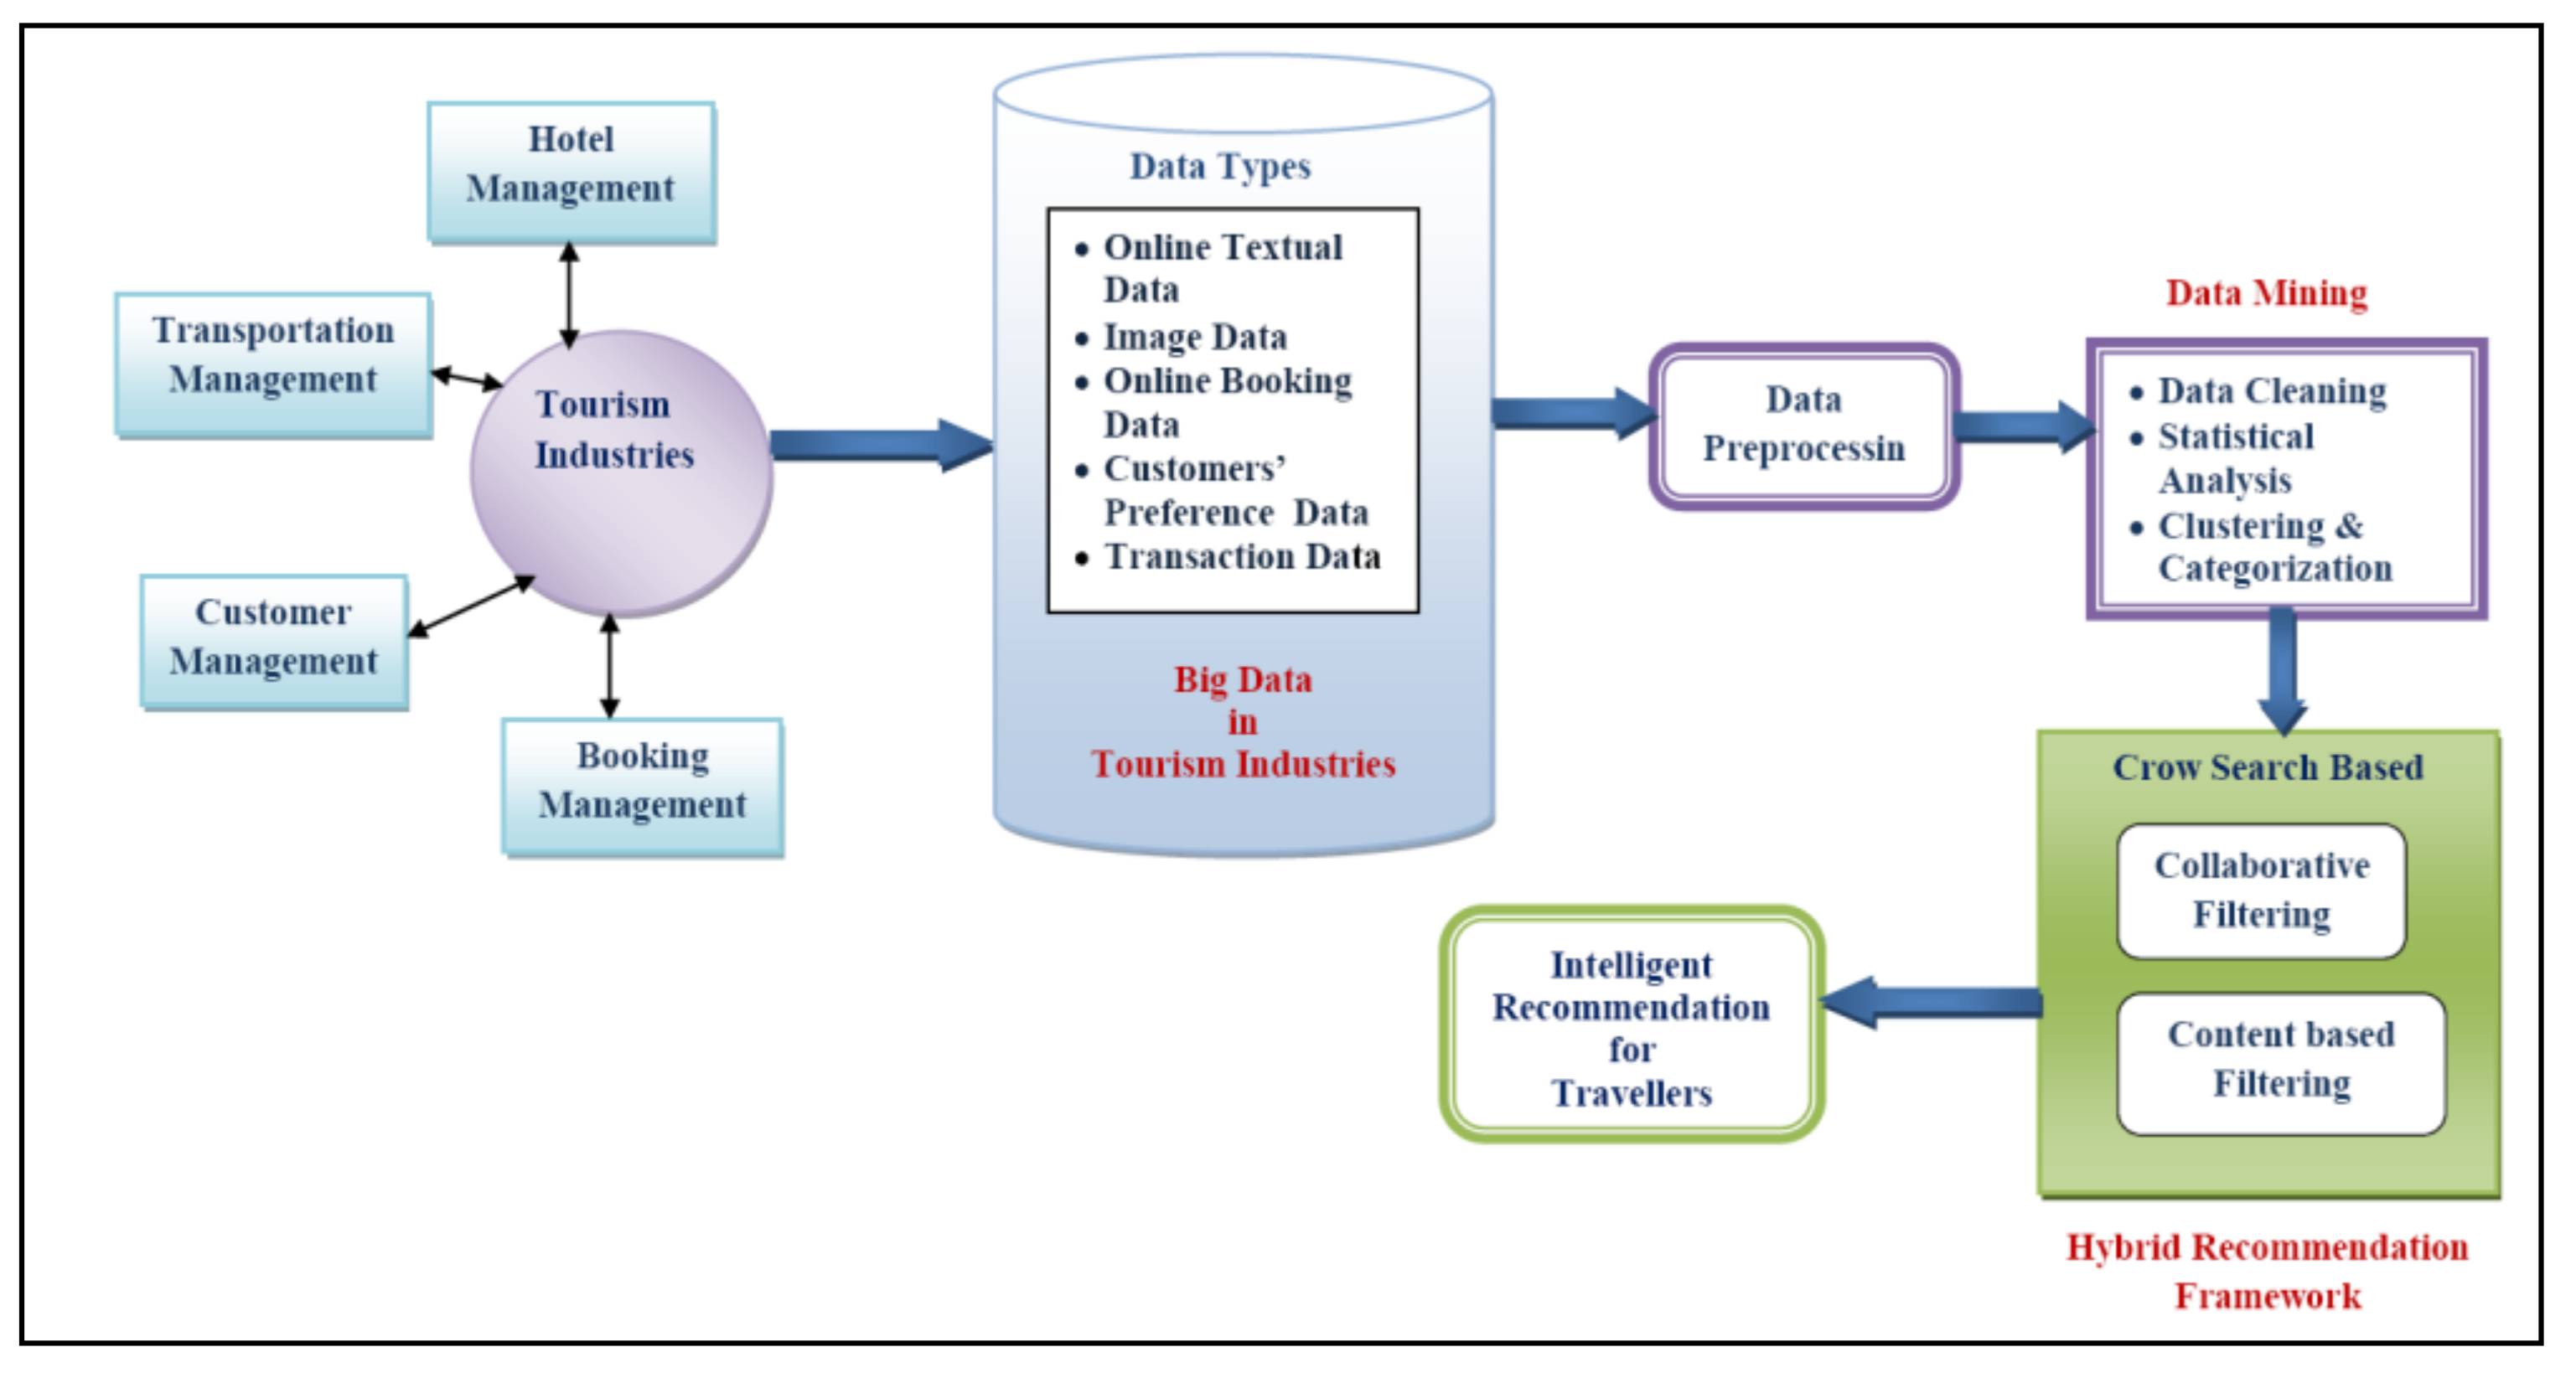
All the recommendation techniques can be deployed based on the previous data. Today, all tourism industries deploy recommendation techniques based on the concept of the Big Data model. In this paper, the concept of Big Data in the domain of tourism industries is considered. The tourism data set is analyzed first, and a structured form is made for further prediction. Crow search-based, hybrid recommendation techniques are applied to implement the proposed model. The proposed model combines collaborative and content-based filtering techniques to achieve more effective recommendations for clients in a real scenario. Finally, a comparison is performed with two different existing related works. The performance of the proposed model is also evaluated. The remaining parts of the article are organized as follows. Related Works are described in Section 2. Section 3 illustrates the relation of Big Data with Tourism Industries. Section 4 explores the proposed model and algorithm followed by data preparation in Section 5. Section 6 explores results and simulations. Furthermore, a complete discussion is given in Section 7. Finally, Section 8 depicts the conclusions of the research.

2. Related Works

Recommendation Systems (RSs) area software application that minimizes the information overload problem, filters the required information, and automatically suggests ideal items to the user. Moreover, the recommendations are displayed according to the priority. This is also known as the “Top-N” recommendation. In other words, RS deals with the prediction of users’ preferences. Isinkaye et al. [7], in their research, described the basic concepts of the recommendation system. As their paper indicates, the Internet is known as the greatest source of information for all users. However, with the regular increase in the amount of information, the number of options is also increasing. Thus, to handle this much volume it becomes necessary to filter out the required information for every user. Katarya et al. [8] described the recommendation systems work based on rating predictions on several items. It becomes equally important to focus on sequential information. To test this novel approach, an MNSBC data set was used, which contained 5000 entries per user. On the same line, to enhance the existing systems, another research was implemented on movie recommendations using K-Means and the Cukoo Search Optimization algorithm by Katarya et al. [9]. The final result was compared with the existing approaches and was found to be more precise. However, to enhance its quality, bio-inspired algae algorithms have also been used. To find the similarities between any two users’ multilevel, the Pearson Correlation Coefficient (PCC) was used [10]. Meanwhile, most music recommendation systems focus more on contextual information, such asmusic ratings and user–user interaction dynamics. A new recommendation system was proposed based on Depth First Search (DFS) and Bellmon Ford is used to recommend new suggestions based on all the factors mentioned above [11]. Another proposed movie recommendation model worked on the based similarities of two users on the same online platform. K-Means clustering was applied with bio-inspired artificial bee colony (ABC) techniques, known as the ABC-KM recommendation model [12]. The current recommendation system suffers from sparsity, coldstart, and scalability issues. Post understanding all these issues, a new model was proposed based on matrix factorization and topical-based collaborative filtering. This model was observed to be more accurate, and due to the hybrid use of techniques, it was termed the HYBRTyco model [13]. Martı’nez et al. [14] introduced a matrix factorization-based hybrid recommendation algorithm consisting of collaborative filtering and content-based filtering. Shamri et al. [15] proposed a hybrid filtering technique using the the Fuzzy-Genetic algorithm. The algorithm provides less Mean Absolute Error and more Coverage. Lee et al. [16] proposed a neural network-based optimized hybrid recommendation algorithm on the MovieLens dataset to improvise Mean Absolute Error and Scalability. Campos et al. [17] introduced a hybrid recommendation algorithm with the help of the Bayesian Network using MovieLens and IMDB datasets, providing few Mean Absolute Error. Shinde et al. [18] proposed a hybrid recommendation framework, applying the Centering–Bunching-based Clustering algorithm using the Jester dataset, resulting in less Mean Absolute Error and higher Precision, Recall, and F-Measure. Jung et al. [19] performed user behavior analysis to accomplish a hybrid recommendation. The framework was successfully validated with the EachMovie dataset’s help, providing top-n recommendations and less Mean Absolute Error. Christakou et al. [20] introduced a neural network-based two-way hybrid filtering technique. The proposed algorithm was validated using the MovieLens dataset, resulting in higher Precision and Recall. Geetha et al. [21] developed a K-Means clustering-based hybrid filtering technique. The experimental results show an accurate and personalized recommendation. Yang et al. [22] proposed a job recommendation system based on hybrid filtering. The system is validated using User-Skill, User-City, Most Recent Company, and Most Recent Job Title features. Iaquinta et al. [23] proposed a word net-based hybrid recommendation technique to optimize the electronic support system’s performance by using Each Movie dataset. The results reveal the proposed algorithm results in low Mean Absolute Error compared to the popular Pearson coefficient. Recent research by Ashami et al. [24] introduced a clustering-based approach to finding the best neighbor of the target user. The clustering is accomplished using the hybridization of the Crow Search and Uniform Crossover Algorithm and the Jester dataset is used as a test-bed for providing significantly less Mean Absolute Error. Recently, Tesfaye et al. [25] proposed a hybrid algorithm to accomplish intelligent Collaborative Filtering. The hybridization is achieved using the Crow Search Algorithm and K-Means Clustering. The MovieLens dataset is used as a test-bed and the results are promising (small Mean Absolute Error) compared to similar techniques. A new proposed model was read that used Newton’s third law of gravitation and was applied to the data set taken from the user-item matrix [26].

3. Tourism Industries: Perspectives of Big Data

The movement business is tremendous; the World Tourism Organization evaluates that it makes up about 10% of the world’s GDP and makes 1in every 11 positions. Moreover, it is an industry on the rise, with enormous future potential for overall wealth and business. Metropolitan people groups have a staggering plenitude of information accessible to them that can change the movement business’ universe. Nonetheless, having information is not adequate to have the alternative to use it enough. Metropolitan territories and the movement business players need induction to gadgets that will engage them to make significant deductions from the data. Countless finishes will help them by benefitting visitors, and, additionally, close by tenants as well. The impact of Big Data on tourism industries and the visualization of the proposed model is shown in Figure 1.
The travel industry sheets and associations in the movement business zone make a profit through information from various viewpoints. This unites analytical advancing endeavors, offering packs to re-establish for visitors’ apparent likely benefits and picking which countries to focus in on winning customers. These experiences can assist with the powerful cycle to improve business capacities. Huge parts in the development of businesses would now have the choice to settle on trained choices concerning assessment and number-driven data. Organizers are focused on expected customer gatherings at every stage in the trip organizing measure. Organizers can also broaden the ability and possibility of associations. Large amounts of information can even be utilized to predict which new things may work well in their market. They can achieve enhanced encounters that depend on the clients and their requirements. Big Data can be used as a farsighted device to figure out future models and to envision and react to voyagers’ necessities right away.

Future of Big Data in the Tourism Industry: Challenges and Scope

The movement business is presently part of the mission of different ventures that utilize information investigation in their daily tasks. Online exercises of individuals create a ton of information, such as occasion objections or purchasing rucksacks on the web.
  • While individuals produce a ton of information on the web intentionally or inadvertently, there are a few other elective information sources that the movement business can use to settle on better choices. This information helps the movement business in investigation-driven choices and could be very beneficial.
  • BigData investigation is being utilized by movement and transportation organizations all around the globe. For example, carrier administrators use data analysisto comprehend traveler’s buying and travel designs about specific socioeconomics.
  • Organizations in the travel industry area can profit from Big Data from numerous points of view that incorporates showcasing efforts, offering bundles arranged to the guest’s advantages, and to zero in on getting clients to travel.
Big Data is effectively utilized in a variety of areas in tourism. Today, travel bots are intelligent chat bots that give either computerized client administrations on sites of movement organizations or work through informing stages, such as Facebook Messenger, through associating with voyagers and help them in their appointments. These experiences can be of extraordinary assistance in the emotional cycle and change how the travel industry works. They can distinguish their expected clients and likewise expand productivity and administrations’ nature at each stage in the arranging cycle. Big Data can likewise be used as a proactive apparatus in figuring out how a new product could function well in the market.

4. Proposed Model

Today, big data is useful in the domain of tourism industries to better serve the clients in a more realistic way. In this research paper, an Intelligent Tourist Recommender System (ITRS) is proposed to guide tourists based on their preferences. The tourism industries can deploy the model to recommend the tourists regarding their entire plans. This proposed ITRS is beneficial for both tourists as well as tourism industries. To implement the ITRS model, a Big Data tourism database is used. The tourism dataset supports the ‘3V’ properties of Big Data [27,28], i.e., volume, variety, and veracity. A tourism dataset is statistically analyzed [29,30] and a balanced, structured matrix is formed to perform the prediction and recommendation. Sequential analysis is performed as a pilot survey to generate sub-matrices where all the sub-matrices are orthogonal.

4.1. Statistical Analysis

To validate the proposed model, data analysis is required. Real-time data is used as a test-bed for this model. The data is analyzed by statistical approach. Using the tourism data set as a test-bed, it is analyzed based on the user’s choice. The dataset is extremely large, with unstructured data patterns and integrity issues to deal with.
Assuming that all the records of the dataset have n number of features with their different parameters’ value as u 1 , u 2 , ........ , u n , the dataset is continuous then determines the density function φ ( u 1 , u 2 , ..... , u n ) for selecting the data sample randomly. A small sample of data, Δ v , belongs around the data points u 1 , u 2 , ........ , u n . In the dataset, the values of users’ choices are categorized and near each other.
To get the whole dataset to equilibrium, the users with a high frequency of traveling are distributed with possible equidistribution over the whole dataset with kinematic restriction. The users with a high frequency of traveling will influence their co-centric neighbors. The first target is to distinguish the users who travel very frequently through any third-party travel agencies and determine the users with similar choices. The proposed model is validated using the tourism dataset as a test-bed. The tourism dataset is unstructured and contains noisy data. Thus, the first thing is to filter the dataset and structure through an analysis. The data sample of frequent users of position u 1 , u 2 , ........ , u n have E ( u 1 , u 2 , .... u m ) . The mean of frequent users per sample is determined as
E U d v = d
where, dv indicates the unit volume of the sample dataset and d denotes the entire dataset.
φ is determined and evaluates the degree of similarities for each sample distribution using a uniform distribution. Since the pattern of a dataset of tourism industries is Big Data, a high degree of similarities is required to find more similar users. To determine the entropy of the sample, Equation (2) is used.
U log u d v
Then, the solution of Equation (2) is maximized using Equation (1).
The optimum selection of data sample U, for which U log u d v is maximized and subjected to E U d v = d , is determined using Equation (3).
U = e ϕ E + μ = β e ϕ E
where β is selected such that U d v = 1 .
Using the inequality
U log u q d v 0
the sample data, Δ v , are selected randomly from the whole dataset for every iteration. For any two alternative densities, the inequality in Equation (4) will be defined as
U log u d v p log q d v = U ( ϕ E + μ ) d v = ( ϕ d + μ )
where U denotes the data samples.
The variable U will have unity if incident of Equation (5) is applied for Equation (1).
The data samples of frequent users are considered for the tourism industries. The degree of travel frequency is different for the different data samples. The sampling distribution is deployed to transform the degree of travel frequency for different samples, as per linear transformation Y = B U , U Y .
If B is considered a non-singular matrix, then
D Y D U = B   is   a   positive   sign
As per the relational equation, the relation between the users is defined as Equation (7):
d y 1 d y 2 ......... d y n =   B d u 1 d u 2 ...... d u n
As per Equation (6),
d Y = B d U B   is   an   orthogonal   matrix   and   B = 1
Y = BU which transforms into a quadratic form
U I U Y I Y ( U μ ) ( U μ ) ( Y η ) ( Y η )   where ,   μ = mean   and   η = B μ
The dissimilarity between frequent users and rear users is firmly determined and a threshold value is evaluated by using a partitioning matrix.
B = B 1 . . . B k   where ,   B i = n i × n a n d n i = n
The partitioning matrix in Equation (10) is partitioned into 
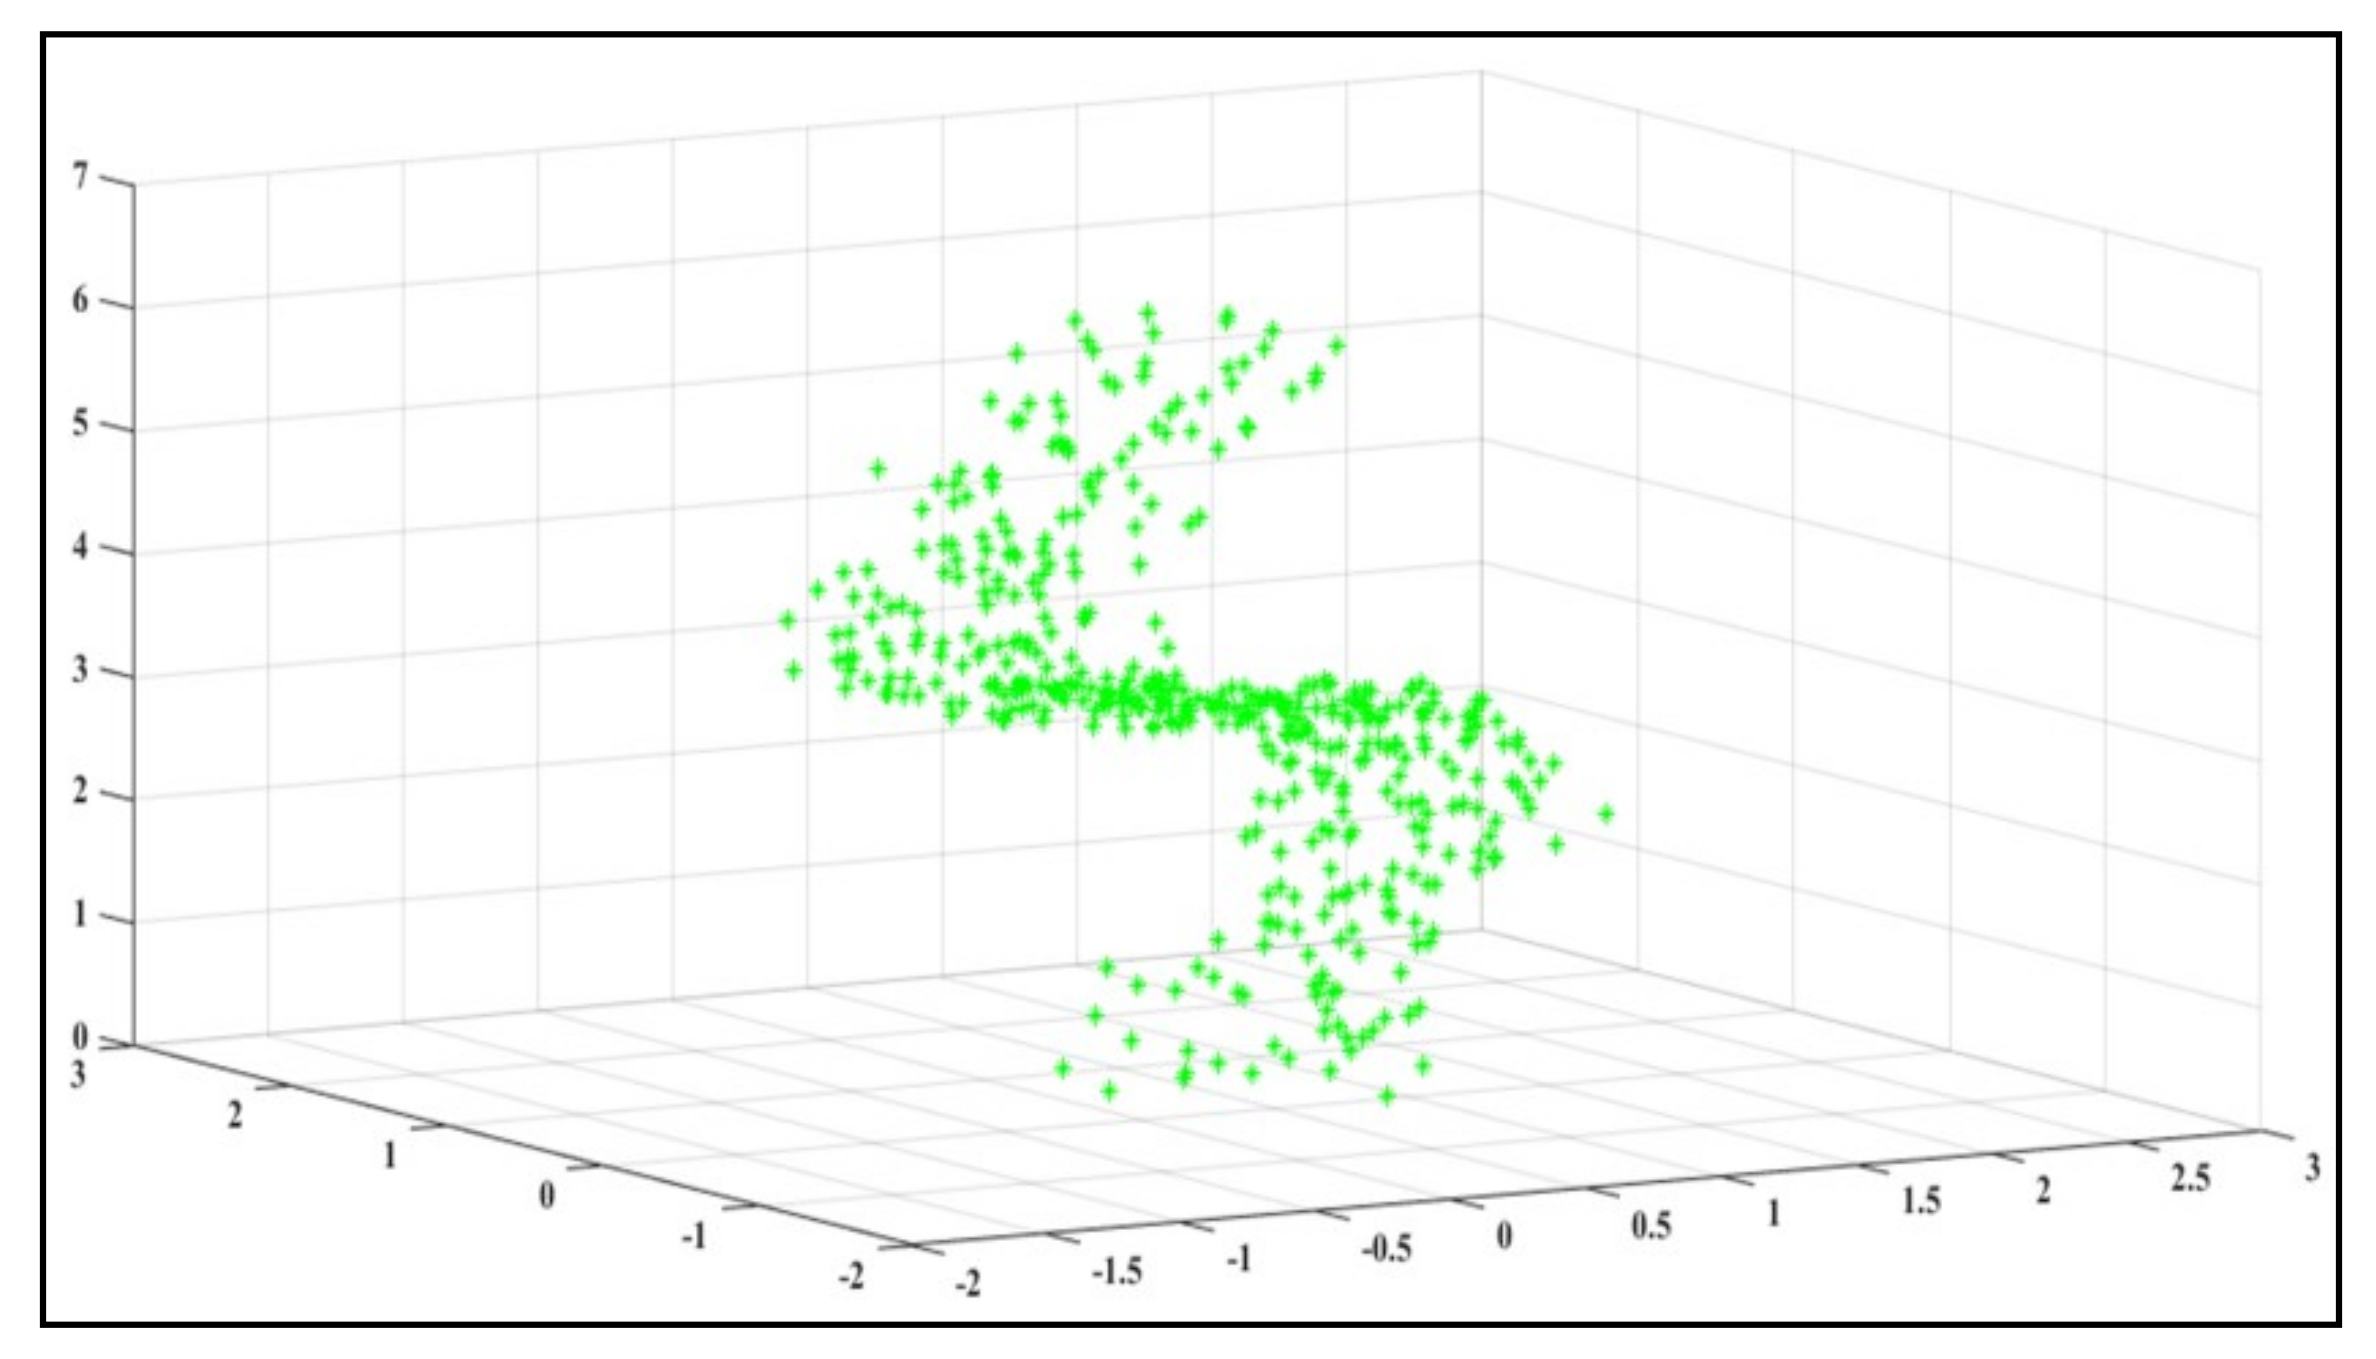
kth sub-matrices where all the sub-matrices are orthogonal to each other but are not orthogonal by themselves. This is a pilot statistical analysis for the data. After statistical analysis, the dataset is visualized in Figure 2. The visualization of the dataset in Figure 2 represents the distributions of the data points. Data analysis is performed by using Algorithm 1.
Algorithm 1: Data analysis for grouping similar data
 Begin
Step 1:   Initialize   n   data   sample   with   density   function   φ , and
initialize   a   small   sample   of   data ,   Δ v , which belongs around the n number of features
Step 2:   Set   n   data   samples   of   frequent   users   of   position   u 1 , u 2 , ........ , u n   have E ( u 1 , u 2 , .... u m )
Step 3:   Determine   the   mean   of   frequent   users   per   sample   as   E U d v = d
Step 4:   Determine   the   entropy   of   the   sample   data   as U log u d v
Step 5:   At   the   maximum   value   of U log u d v ,   determine   the   optimum   selection   of   data   samples   U   as   U = e ϕ E + μ = β e ϕ E
Step 6: Randomly select the data sample to determine any two alternative densities by applying
U log u d v p log q d v = Z ( φ E + μ ) d v = ( φ d + μ )
Step 7: Sampling distribution is deployed to transform the degree of travel frequency for different samples
Step 8: The interrelated differential elements are defined as
d y 1 d y 2 ......... d y n = B d u 1 d u 2 ...... d u n
Step 9: Determine dissimilarity between frequent users and rear users as
d Y = B d U B   is   an   orthogonal   matrix   and   B = 1 ,
U I U Y I Y
( U μ ) ( U μ ) ( Y η ) ( Y η )   where ,   η = B μ
B = B 1 . . B k
 End

4.2. Computational Analysis

As per the concept of Big Data, the tourism dataset has a large number of dimension values as a matrix form with some known coefficients. If Y and α denote the column vectors of the variables, y i and the parameter α j can be represented as a matrix notation.
Y = X α + ε ,   E ( ε ) = 0   and   D ( ε ) = σ 2 I E ( Y ) = X α ,   D ( Y ) = σ 2 I
where D denotes the dispersion, and I stands for the unit matrix of order n. The objective of this analysis is to estimate the unknown parameter α j based on the observations of y i . In this research, the user’s choice is estimated based on their other profile data.
Now, established correlations among all observations of the different sample can be deduced by Equation (12):
E ( Y ) = X α D ( Y ) = σ 2 T ,   T 0
where, T is supposed to be a known matrix and both α and σ 2 are unknown.

4.3. Proposed Collaborative Filtering Approach

Once the statistical analysis is completed, a new Collaborating Filtering [31,32,33,34,35,36,37] approach is proposed, which is used for the purpose of recommendation. In fact, a memory-based collaborative filtering approach is applied to determine the users who are similar to the target user. The proposed collaborative filtering helps to effectively predict user feedback based on the feedback of like-minded users. Therefore, it performs in-depth analysis of user profiles. As a result, sparsity and scalability problems are substantially minimized with respect to the dataset chosen in this research. Technically, the proposed approach consists of finding a new similarity measure, a threshold to determine the similar users, and the rating prediction technique. The proposed approach is as follows:
Assuming the total number of users is defined as n and the total number of hotels is m where n , m > 0 , the dimension of the data set is n × m .
Let us consider that the user gives a rating for t number of hotels among m.
The rating of each user is determined by R in Equation (13):
R = t m log j = 1 m r j
where r and t indicate the rating of each hotel and number of hotels, respectively.
Similarly, it computes the rating for n number of users as R 1 , R 2 , ...... , R n .
Rating R is used to determine each user’s similarity index with respect to the remaining users in the dataset. The similarity index R s i m is evaluated using Equation (14).
R s i m i , j = t ln R i R i j m i = 1 t R i R j 1 j t
A hotel dataset is used with n number of users giving a rating. If the user does not visit any hotel, they do not provide any rating for that hotel.
Suppose the user rates for t number of hotels among m number of hotels. Thus, t m is always true. Among the t number of ratings, the minimum and maximum rating values are provided by the particular user. The users rate the hotel within a certain range of rating values. If the rating values are out of the range, then these values will be discarded. The threshold value R T h is evaluated by Equation (15):
R T h = 1 m i = 1 n t i M R i L R i
where m t .
LR and MR denote the lowest rating value and highest rating value respectively.
Now, compare the similarity index with the threshold value to predict the future’s rating if the user does not provide it priorly. The predicted rating is determined by Equation (16).
R ( P r e d i c t ) i = L R i 1 + M R i L R i R T h R s i m i

4.4. Proposed Content-Based Filtering Approach

The filtering process becomes more effective when the preferences of users are considered. The recommendation technique, which considers the preferences of a user, is known as content-based filtering [38,39,40,41]. In this paper, a new content-based filtering approach is proposed. The proposed approach helps to discern user preferences in a novel way. As a result, more personalized, content-based filtering is performed. The proposed approach considers the items recommended by the collaborative filtering algorithm. Successively, the modified Jaccard similarity coefficient is employed for the content-based filtering. The proposed approach is as follows:
Suppose there are n numbers of users, and the similarity index of k number of users are nearest to a threshold value. Using Equation (16), the value of the predicted Rating R P r e d i c t is evaluated.
Assuming k n and R P r e d i c t R T h , it is not confirmed that the corresponding hotel will be recommended to that user who did not rate the particular hotel previously. The user, who did not visit a particular hotel H i previously, did not rate the hotel H i . The proposed model will decide that the hotel H i will be recommended to that user for future use. The recommendation will be made not only based on the values of R s i m , R T h , and R P r e d i c t but also the features of the hotel. Therefore, the recommendation pattern is a hybrid model of collaborative and content-based filtering.
Let there be z numbers of features.
Suppose A a 1 , a 2 , ..... , a z Preferred features by the users
B b 1 , b 2 , ...... , b z Target features of the unrated hotel
In Equation (17), the Jaccard similarity coefficient is applied to find out the recommendation Index R I
R I = ln J i = 1 z A i , B i R P r e d i c t
where J i = 1 z ( A i , B i ) = a 1 , a 2 , .... , a z b 1 , b 2 , ..... , b z a 1 , a 2 , .... , a z b 1 , b 2 , .... , b z The unrated hotel will be recommended using Equation (18).
i f R I R T h O t h e r w i s e R e c o m m e n d e d n o t R e c o m m e n d e d
The proposed model will make the expert decision that either the unrated hotel will be recommended or not based on Equation (18).

4.5. Crow Search Algorithm-based Hybrid Recommendation Model

The Crow Search Algorithm (CSA) is a population-based, bio-inspired algorithm proposed by Askarzadeh [42]. It describes the movement of crows in search for food.
In this paper, a CSA-based recommendation model is proposed to perform optimized hybrid recommendation. As a result, the problems related to traditional collaborative-content hybrids are minimized substantially. On the other hand, the proposed model is the basis for ITRS. Herein, the intelligent food searching (exploration and exploitation) of crows assists to identify the relevant parameters of recommendation. Moreover, the movements of crows ensure optimized recommendation. To provide the recommendations, an analogy between CSA and parameters of the model is considered. Successively, the position update rule of CSA is applied to find the recommendation threshold. The analogy between CSA and the parameters of the model is shown in Table 1.

Proposed Hybrid Recommendation Algorithm

The CSA-based hybrid recommendation model is defined in Algorithm 2:
Algorithm 2: CSA based Hybrid Recommendation
Begin
Step 1: Normalize the rating of target user using Equation (13)
Step 2: Find the similar users with respect to the target user using Equation (14)
Step 3: Designate a user as neighbor whose similarity is greater than the threshold of similarity
Step 4: Compute the first threshold for recommendation using Equation (15)
Step 5: Find the second threshold for recommendation using the position update rule of CSA
Step 6: Predict the rating of target user using Equation (16)
Step 7: If the predicted rating is ≥ the first threshold and second threshold, then go to step 8
Step 8: Predict the rating of target user (content-based filtering) using Equation (17)
Step 9: Recommend to the target user using Equation (18)
End

5. Data Preparation

The TripAdvisor [43] dataset has been used to accomplish experimentation for the proposed model. The dataset is comprised of 29,799 reviews of 21,851 unique customers. The reviews were collected from September 2007 to September 2009, including every hotel from all regions of Ireland. In addition to the survey text, each audit accompanies a lodging identifier, a general rating, and discretionary viewpoint explicit appraisals for the accompanying seven angles: Rooms, Cleanliness, Value, Service, Location, Check-in, and Business. All review-level appraisals are on a discrete ordinal scale from 1 to 5 (with 1 demonstrating that a viewpoint’s explicit rating was not given by the commentator).
The proposed model is also validated by two more datasets as well. The Datafiniti’s Business dataset [44] has been used for validation purposes. It consists of 10,000 reviews of users to the 2000 hotels in the United States. The dataset is made up of several attributes, such as hotel id, name, address rating, reviews, and username. The user reviews basically contain textual descriptions describing the user experience. On the other hand, user ratings are numeric values in the range between 1 and 5. Moreover, TripAdvisor hotel review datasets contributed by Barkha Bansal has also been considered for validation purposes [45]. It consists of 20,491 reviews as well as ratings of users. The user reviews are textual information depicting user experience, whereas, user ratings are numeric values between 1 and 5.
Table 2 contains a sample of 15 customer ratings from the TripAdvisor dataset. The value of customer ratings lies between 1 and 5. Moreover, the customer preferences towards other amenities, e.g., rooms and cleanliness, are also mentioned in the dataset. The collection of ratings helps to accurately learn individual profiles. In other words, the proposed model could be trained well. As a result, the overfitting and the underfitting problems are avoided.

6. Results and Simulations

The tourism dataset is used as a test-bed to validate the proposed model. The data set is very large and has an imbalanced structure. As such, statistical analysis is performed to fit the dataset of the proposed model, and the simulation results are shown in Figure 2.
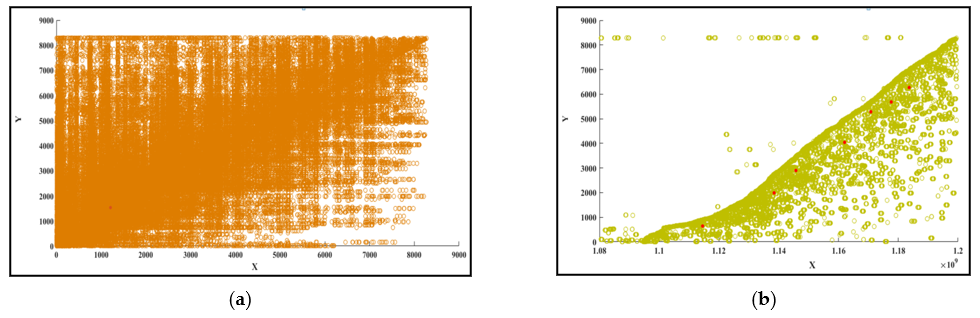
The original data set, before the statistical analysis shown in Figure 2a, has data patterns that are unstructured and have some missing data fields. After the statistical analysis, the dataset is filtered and freed from noise data. As per the requirement, the data is filtered by the analysis. The filtered and structured dataset is shown in Figure 2b. The required data values are all in a single group other than noise data. In Figure 2b, the required data points are shown in the high-density section. After data analysis, a collaborative filtering technique is applied to find out the users’ similarities based on their preferences. 
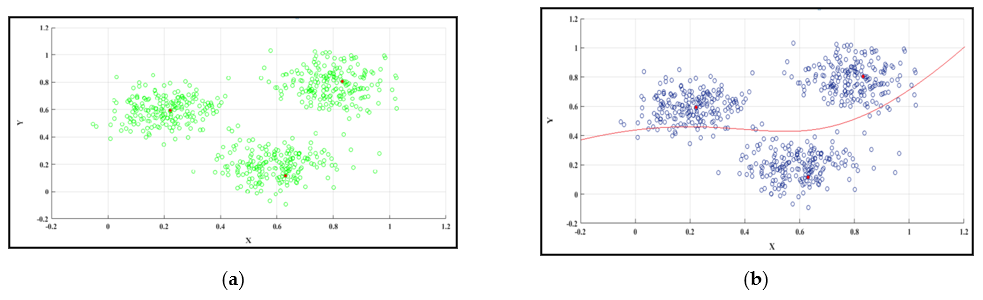
Figure 3 shows the grouping of the users as per their preferences. In this research, the applied data set is divided into three different subgroups by the collaborative filtering technique. Every user has a similarity index concerning other remaining users in a group. Figure 3a shows three different groups derived from the applied structured test-bed data set. A threshold value is derived from selecting the group whose similarity index is very near to the threshold value. The threshold value is shown in Figure 3b. Every group has its similarity index value, which is the mean of the group members’ all similarity index.
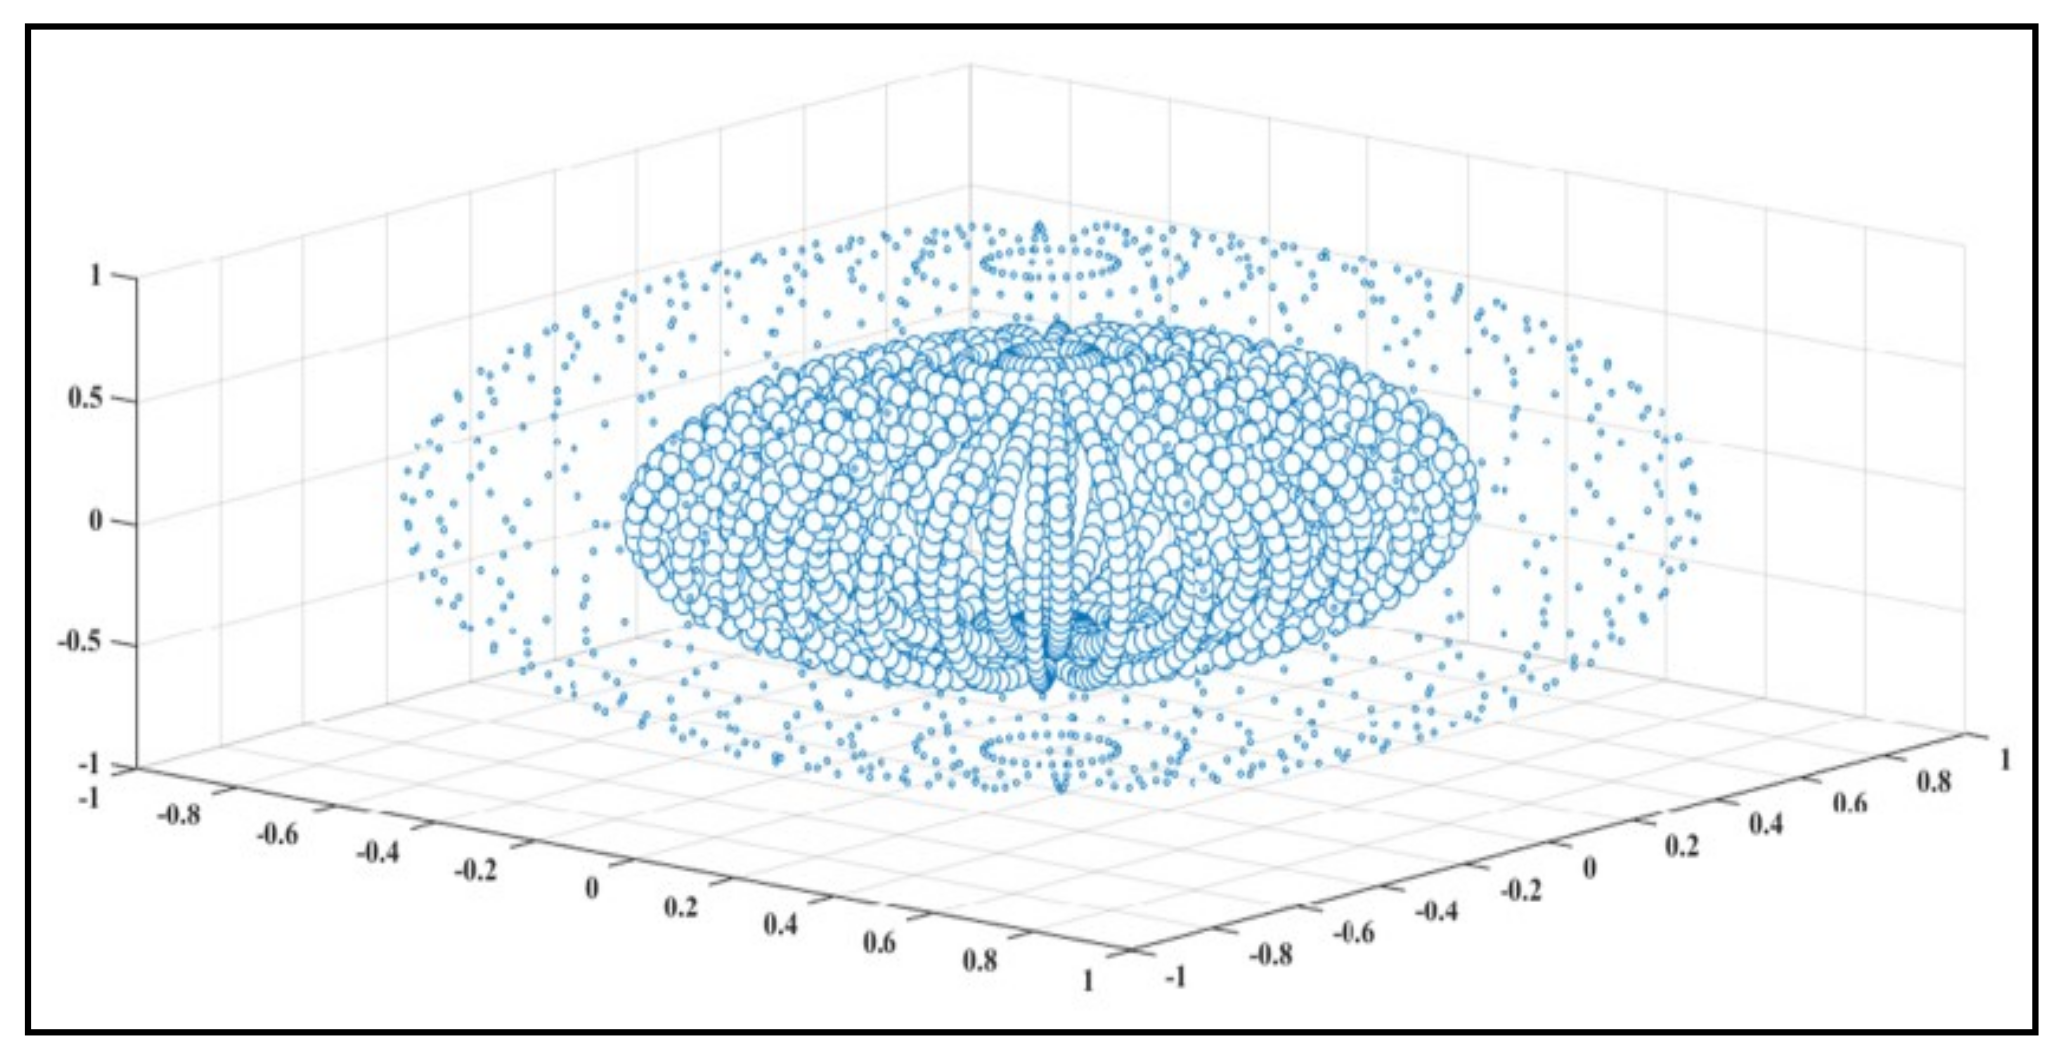
Based on the similarity index, the item will be recommended to the neighbors of the same group. Figure 4 shows that the similarity index value is gradually decreased outward from the center value. The users who belong near the center have similar preferences. After each iteration, the error is determined. The Mean Absolute Error (MAE) and Root Mean Squared Error (RMSE) are determined from the dataset after deploying the proposed methodology. Table 2 and Table 3 show the MAE and RMSE respectively, based on the rating of the users.
Table 3 depicts MAE’s related to the proposed model. To begin with, 500, 1000, 2000, 3000, 4000, and 5000 user ratings are considered for validation purposes. Consecutively, the target user’s rating on unseen items is predicted. The experimental result demonstrates that the proposed model provides small MAE on large data samples. Moreover, after a few iterations, MAE becomes unchanged.
Table 4 exhibits the RMSE’s obtained from the proposed model. At first, 500, 1000, 2000, 3000, 4000, and 5000 user ratings were considered for experimentation. Successively, target user preference is predicted on unrated items. The experimental results reveal that the proposed model provides less RMSE for the large data samples. On the other hand, RMSE rapidly decreased as the number of user ratings increased. Therefore, the proposed model is practically deployable whenever numerous ratings are involved. After the minimization of errors, a similarity index of all users in a group is evaluated and shown in Figure 4.
The simulation in Figure 4 describes the distribution of the similarity index for a particular group. Based on this similarity index, a new item will be recommended in the future for users in the same group. But, in a real scenario, collaborative filtering is not always sufficient for recommendations to users. The proposed model is designed based on hybrid recommendation systems. Collaborative filtering is visualized in Figure 4. To achieve a higher level of accuracy, content-based filtering is also applied. After deploying content-based filtering, an effective result is achieved for a recommendation.
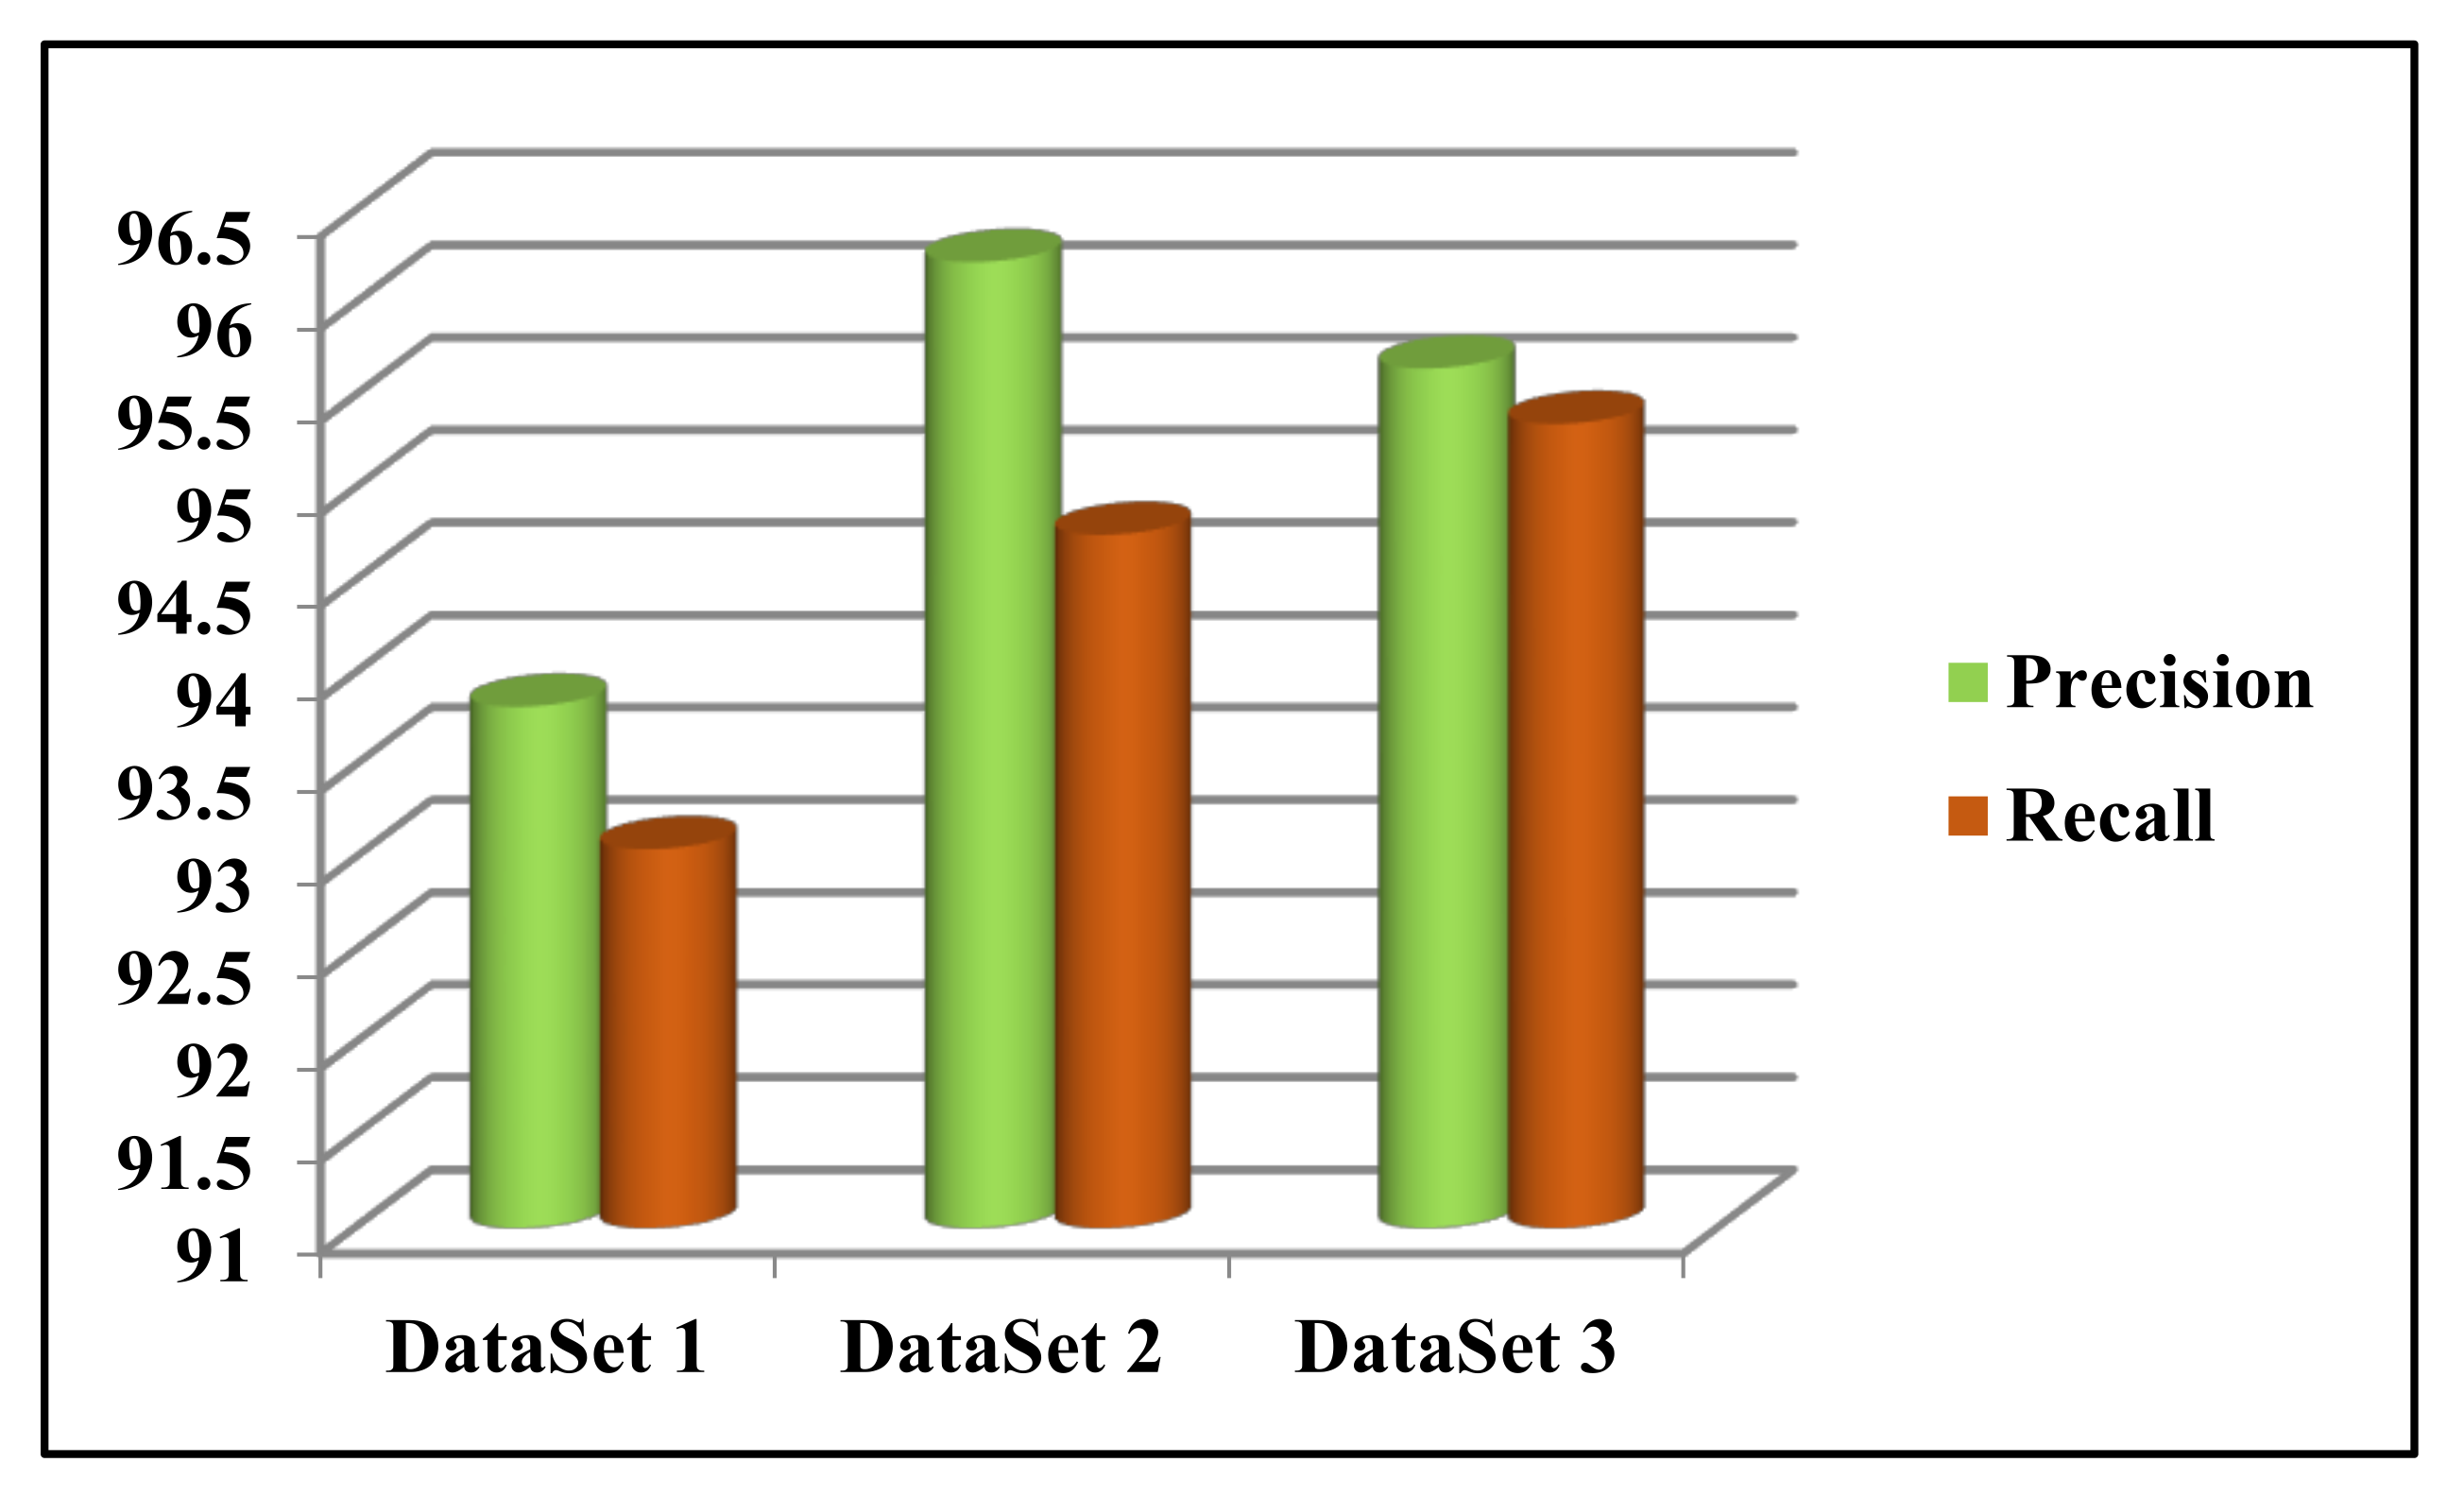
Figure 5 describes the effective result of a recommendation. A new item will not be recommended for all the same groups of users with the same similarity index. The new item is only recommended for the users who have the same similarity index and have prior similar content choices. After determining the effective optimized recommendation, performance metrics of the model are measured with various sampling data. The result of the performance metrics [46] is shown in Figure 5.
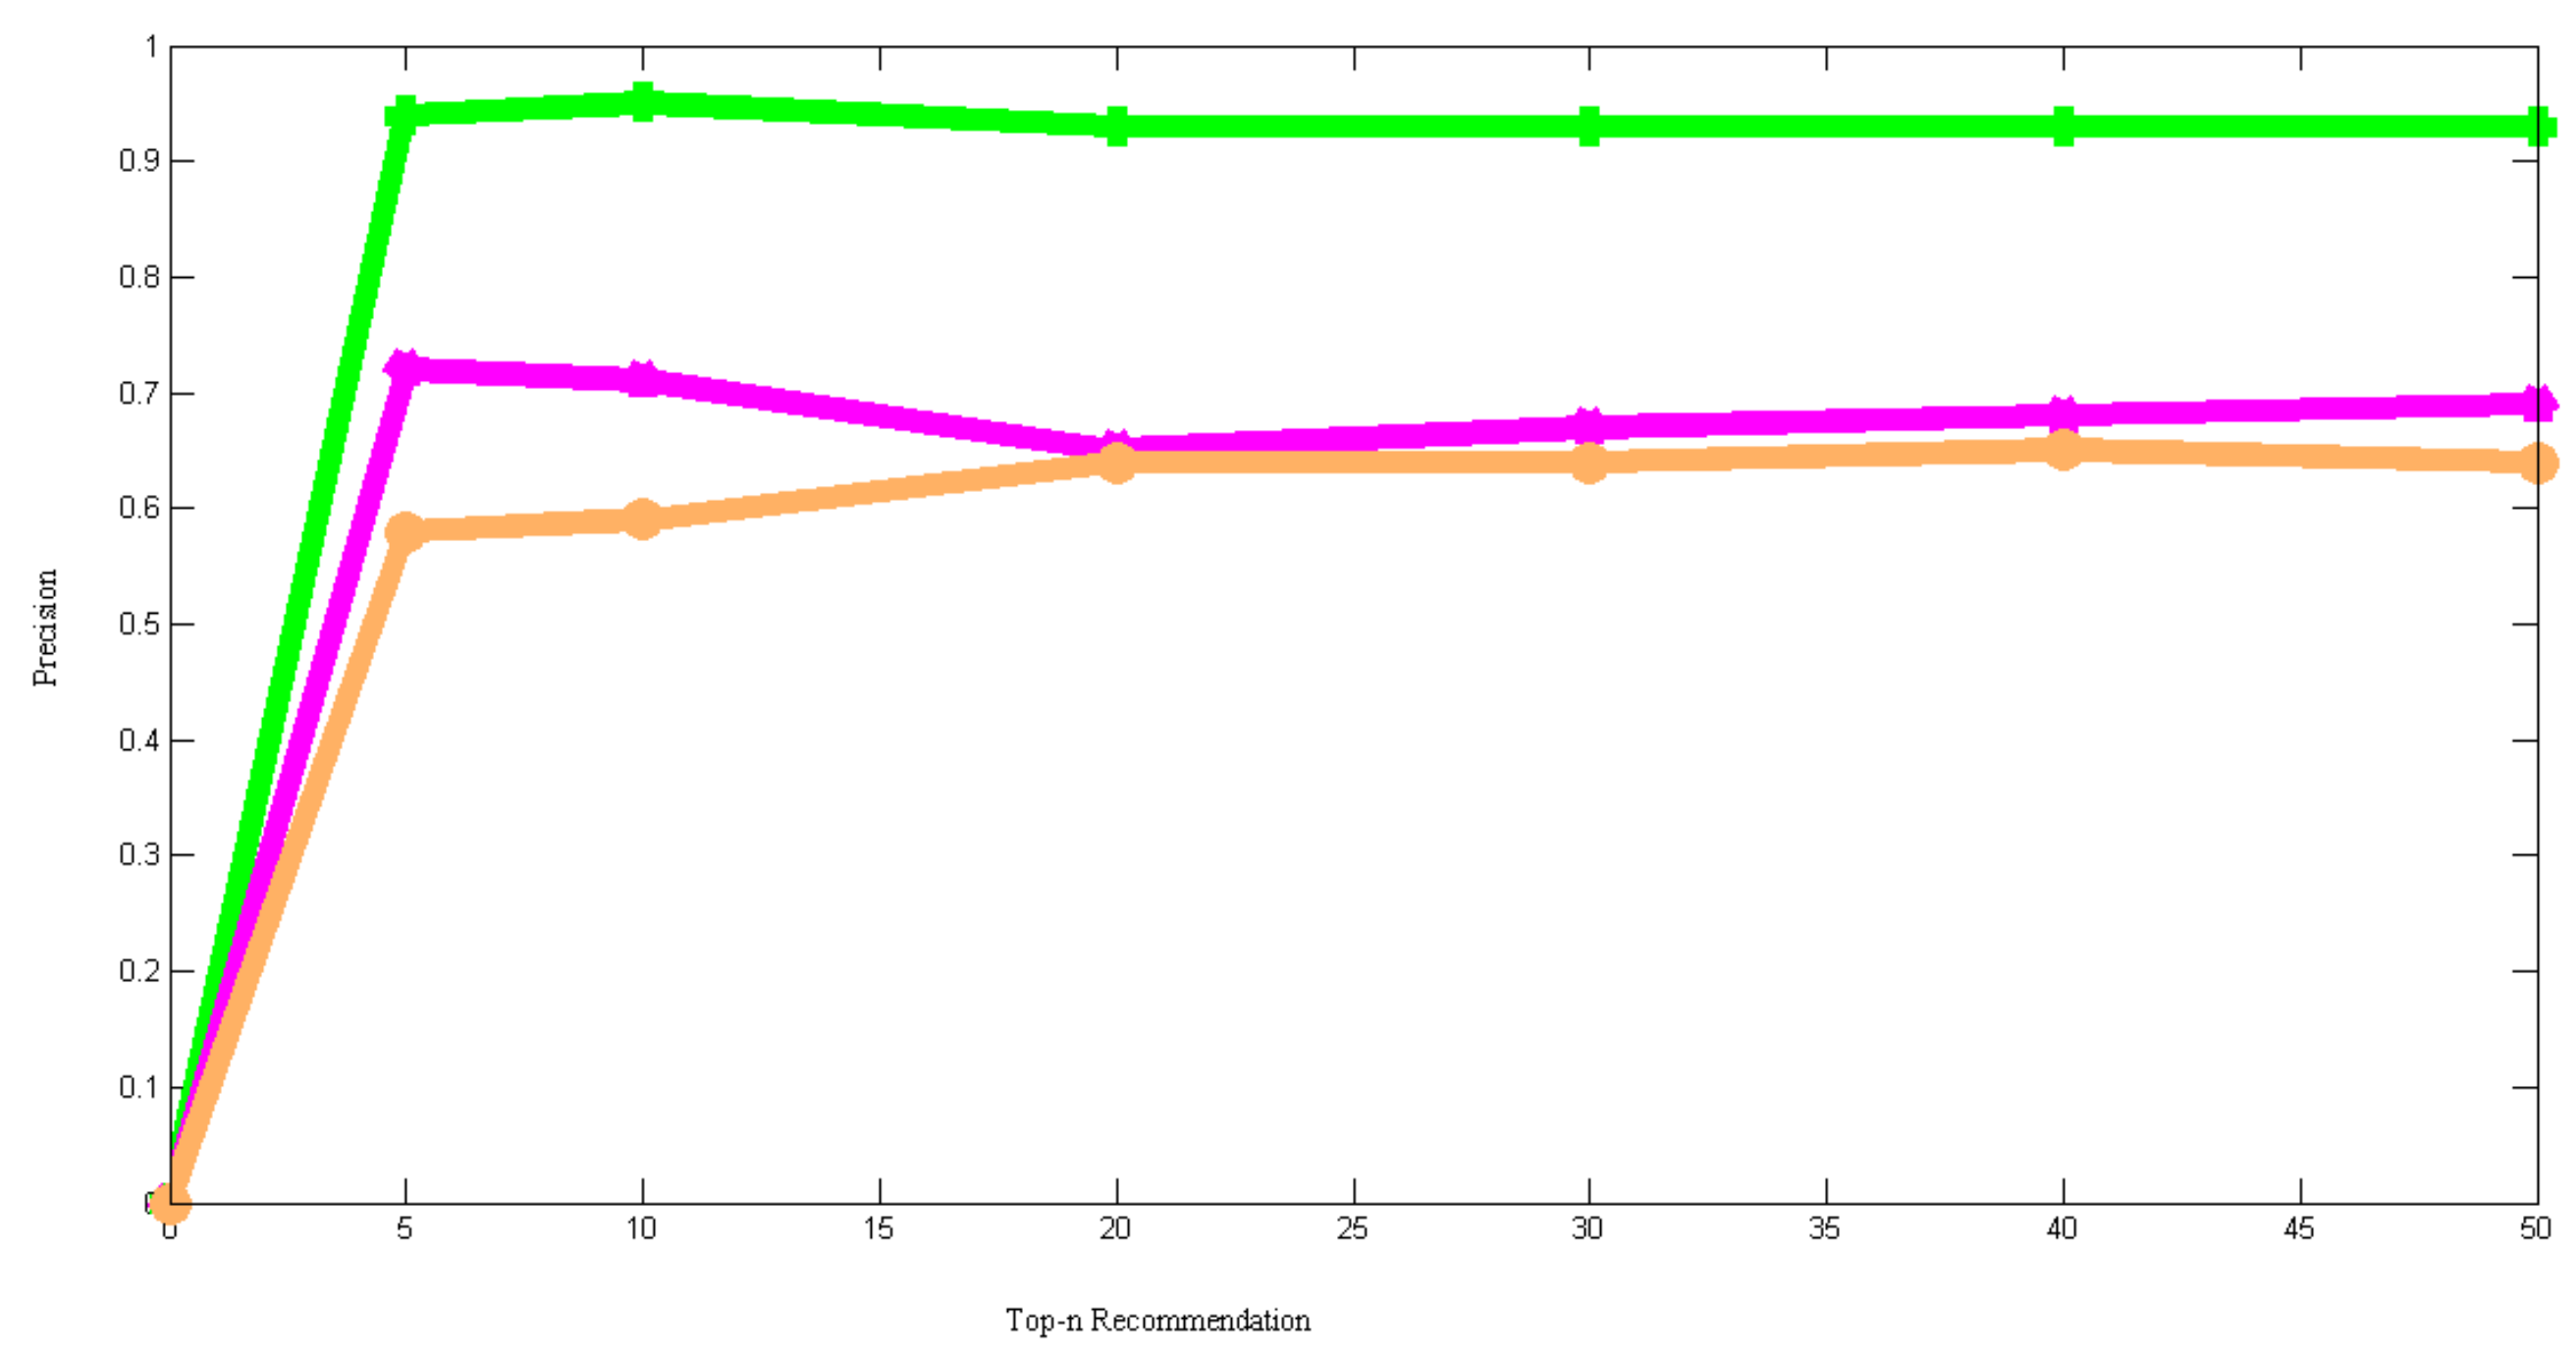
Table 5 demonstrates a comparison of precision between the proposed model, HCSUC, Tesfaye et al., collaborative filtering, content-based filtering, collaborative-content hybrid filtering, and particle swarm optimization (PSO)-based collaborative-content hybrid filtering considering different top n recommendation sets. The effectiveness of the models is devised with the help of true positive and false positive recommendations. The experimental results reveal that the proposed model provides an average precision of 93.5%. Meanwhile, HCSUC results have an average precision of 68.6%. On the other hand, the recommendation model of Tesfaye et al., collaborative filtering, content-based filtering, collaborative-content hybrid, and PSO-based hybrid filtering provides an average precision of 62.3%, 62.5%, 62%, 63.5%, and 69%, respectively. Therefore, the experimental results reveal that the proposed model is better than other models in terms of precision.
Figure 6 shows a comparison between the proposed model, HCSUC, and Tesfaye et al. considering the precision values. The X-axis and Y-axis in the graph represent the size of the topn set and precision. The proposed model, HCSUC, and Tesfaye et al. are indicated by the greenline, violet line, and brown line in the graph. The figure describes that the proposed model outperforms the existing algorithms.
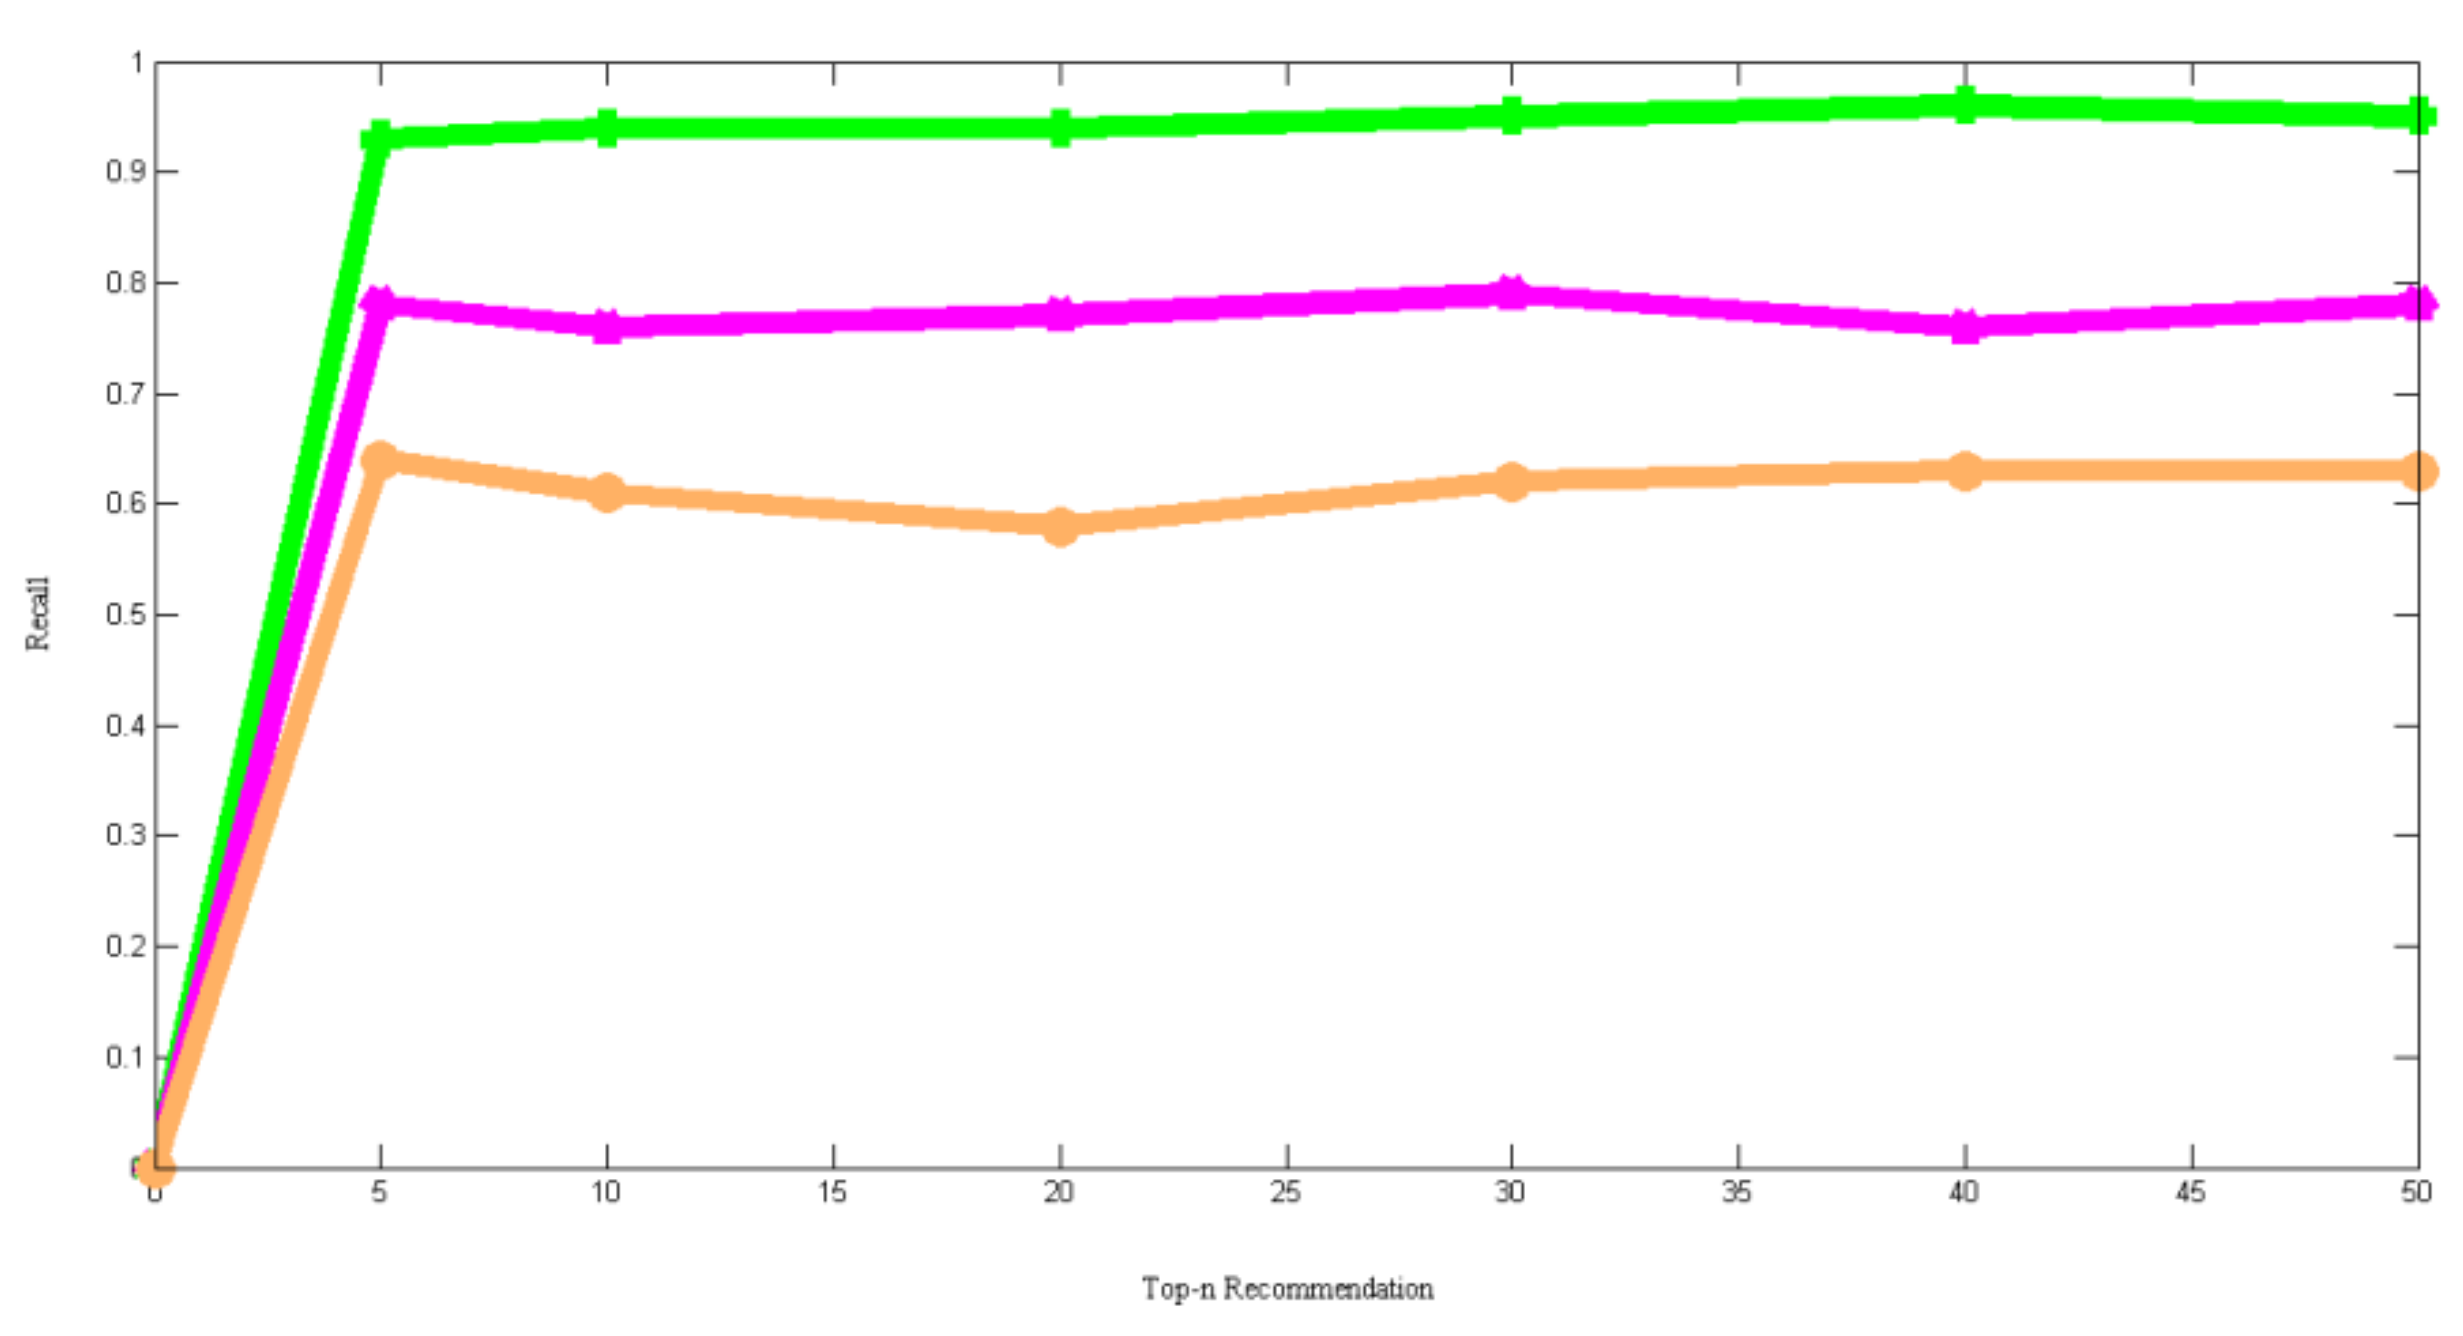
Table 6 shows a comparison of recall values between the proposed model and popular recommendation models. The size of recommendation sets is varied up to 50 recommendations in order to make a correct decision. Subsequently, the true positive, and false negative recommendations in those models have been identified. The experimental results presented in the table shows that the proposed model provides an average recall of 94.5%. On the other hand, recent recommendation models, such as HCSUC and Tesfaye et al. provides an average recall of 77.3% and 62.3%. Traditional recommendation models, such as collaborative filtering, content-based filtering, collaborative-content hybrid, and PSO-based hybrid filtering provides an average recall of 62.3%, 63.8%, 65.6%, and 63.6%. Therefore, it is evident from the experimental results that the proposed model is very accurate in providing personalized recommendation.
Figure 7 shows a comparison between the proposed model, HCSUC, and Tesfaye et al., considering the recall. The X-axis and Y-axis in the graph represent the size of the top-n set and recall. On the other hand, the proposed model, HCSUC, and Tesfaye et al. are indicated by the green line, violet line, and brown line in the graph. The figure shows that the proposed model is better than existing algorithms.
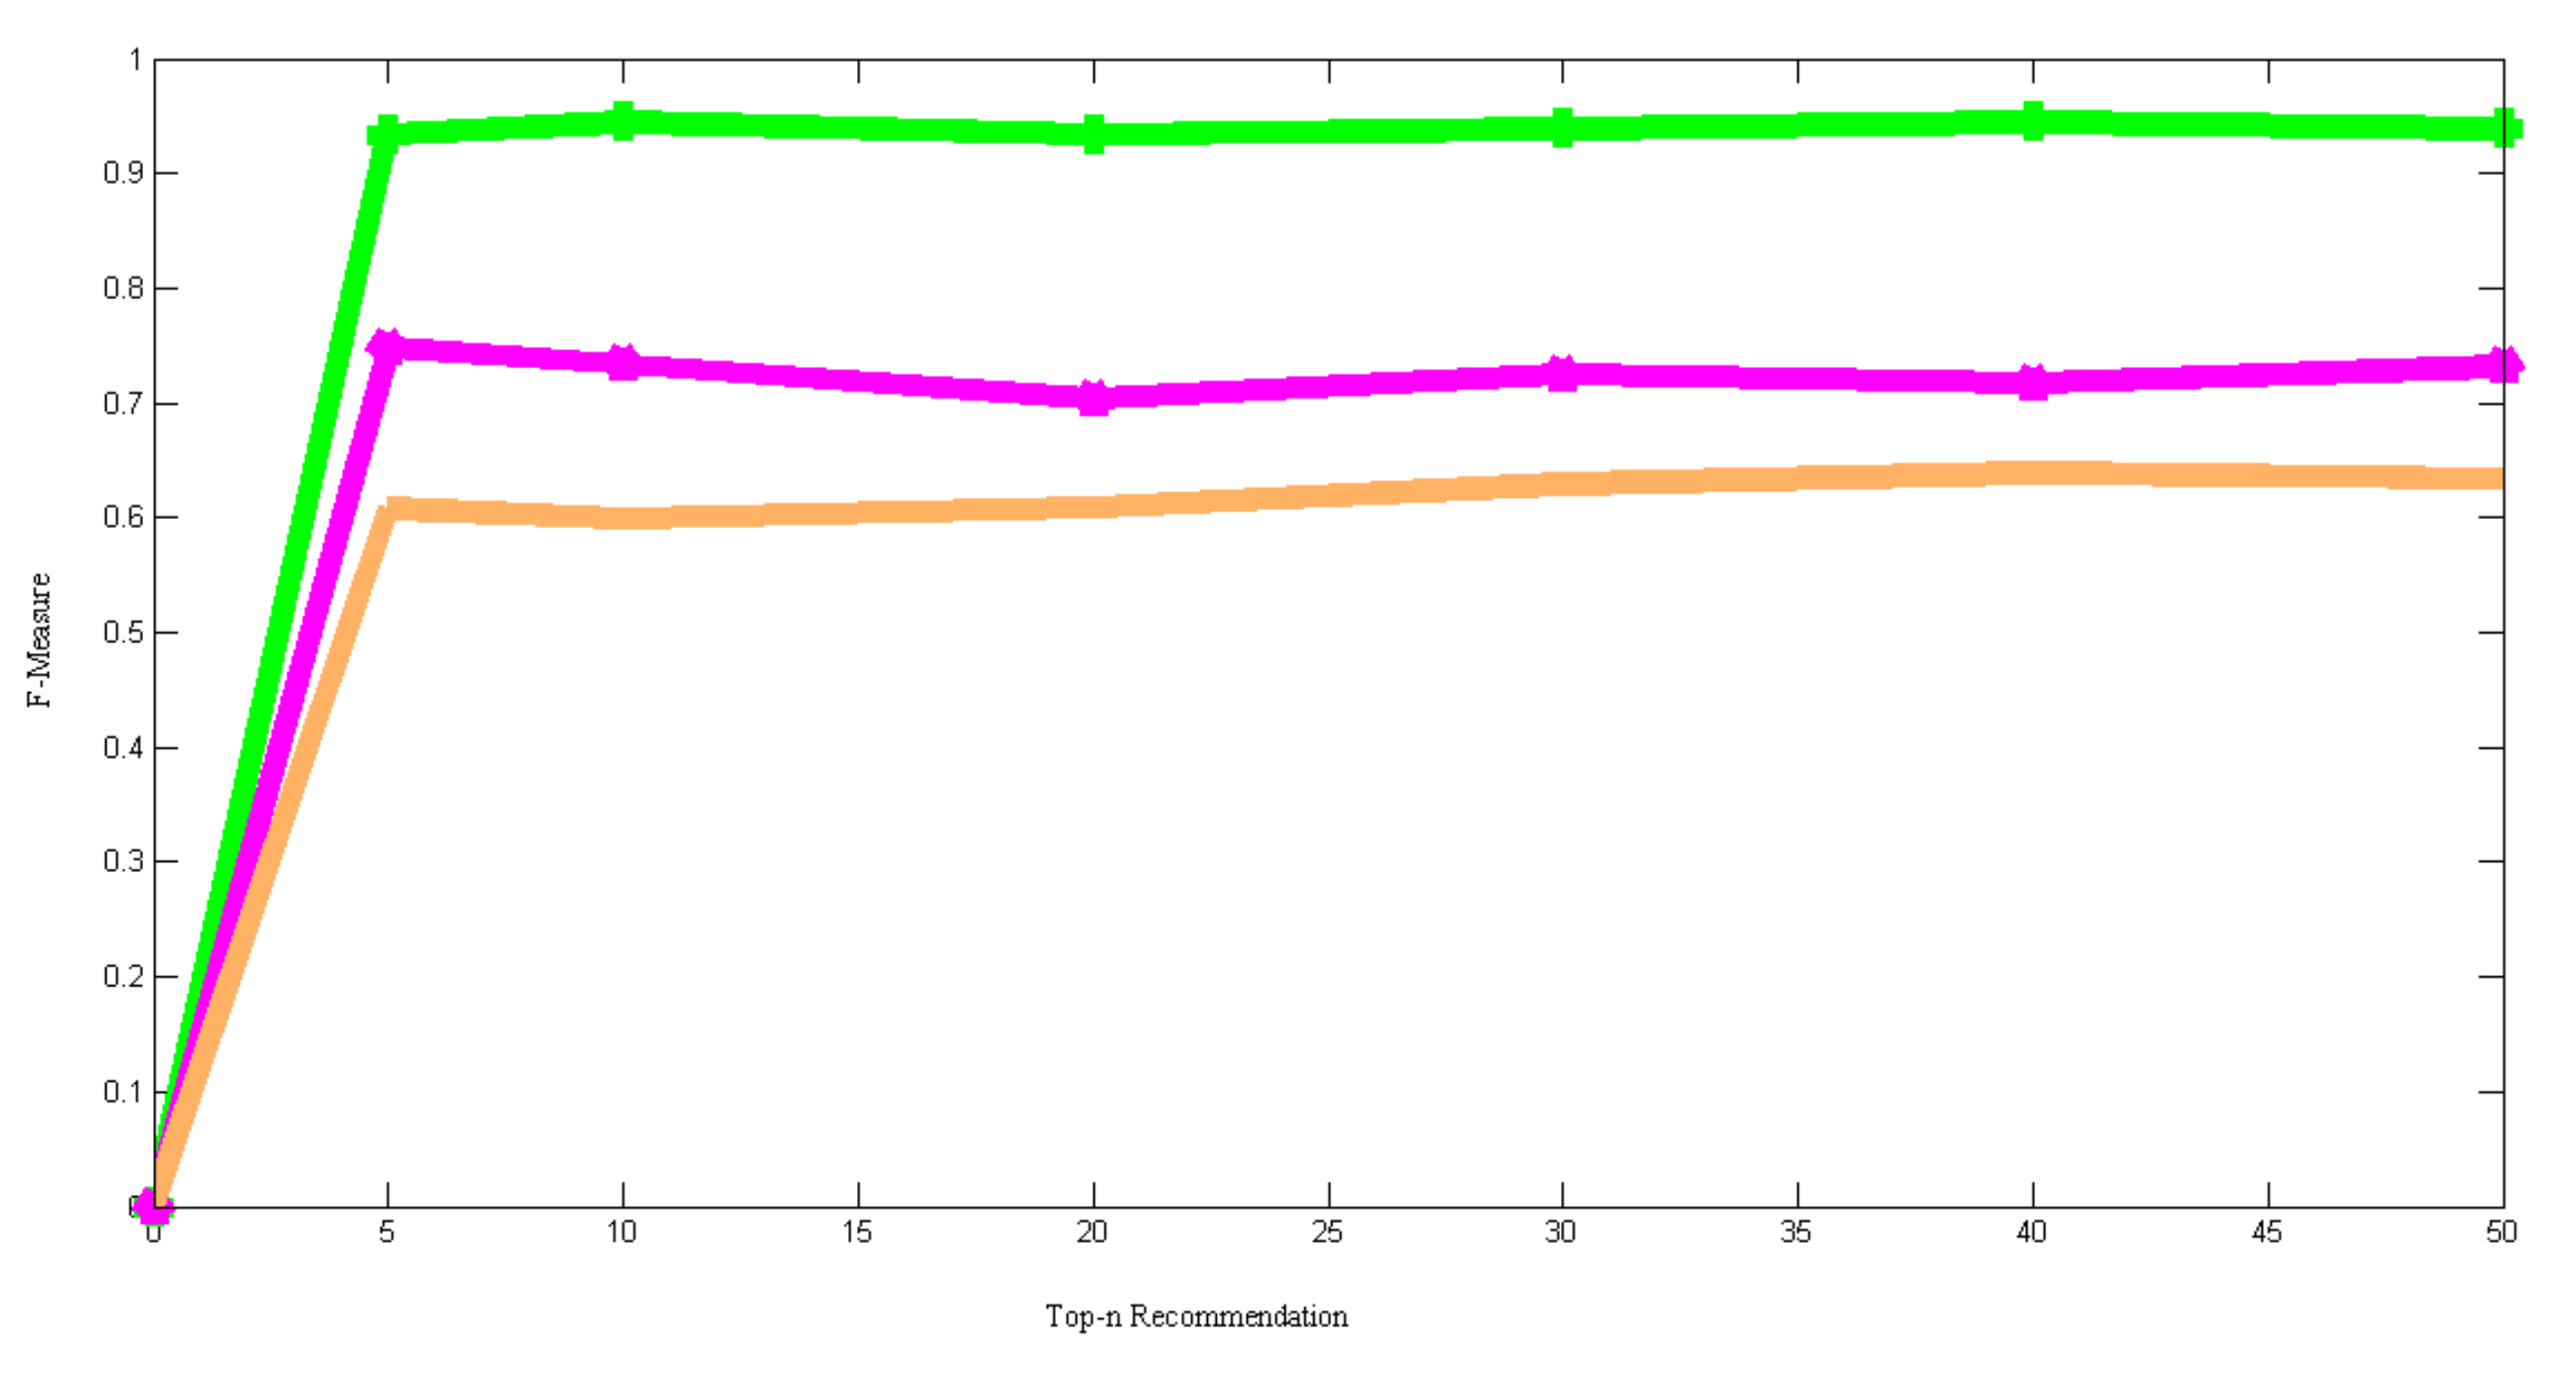
Table 7 demonstrates a comparison of F-Measure values between the proposed model and other similar models. The precision and recall of the models are considered for the computation of F-Measure. The results reveal that the proposed model provides an average F-Measure of 93.3%. Meanwhile, the F-Measure of the recently proposed identical models, such as HCSUC and Tesfaye et al., drastically decreases in each iteration of testing. On the other hand, traditional recommendation models like collaborative filtering, content-based filtering, collaborative-content hybrid, and PSO-based hybrid filtering results average F-Measure of up to 68.1%. Therefore, it is clear from the experimental results that the proposed model performs well while providing personalized recommendations according to their user profile.
Figure 8 demonstrates a comparison of F-measure between the proposed model, HCSUC, and Tesfaye et al. The X-axis and Y-axis in the graph represent the size of the topn set and F-measure. On the other hand, the proposed model, HCSUC, and Tesfaye et al. are indicated by the green line, violet line, and brown color line, respectively. The figure represents that the proposed model performs better than the existing algorithms
Table 8 shows a comparison of precision between the proposed model and other related models. The experimental results demonstrate the proposed model provides a precision of 93.5%. Meanwhile, recent research works on HCSUC and Tesfaye et al. achieve a precision of 60.3% and 57.8%. On the other hand, popular recommendation models, such as collaborative filtering, content-based filtering, collaborative-content hybrid, and PSO-based hybrid filtering, provide precision levels of 60.8%, 61.3%, 66%, and 71% respectively. Therefore, results show that the proposed model is more accurate in identifying true positive and false positive recommendations compared to the other models.
Table 9 represents a comparison of recall between the proposed model, recent recommendation models, and traditional recommendation models. The experimental results reveal the proposed model provides a recall of 96.6%. Meanwhile, HCSUC and Tesfaye et al., provide an average recall of 60% and 71% respectively. On the other hand, collaborative filtering, content-based filtering, collaborative-content hybrid, and PSO-based hybrid filtering provides an average recall of 61.6%, 67.6%, 74.1%, and 76.6%, respectively. Therefore, it is evident from the results that the proposed model is more correct in identifying true positive and false negative recommendations.
Table 10 represents a comparison of F-Measure values between the proposed model, and different recommendation models considering the testing sets. The experimental results reveal that the proposed model provides an F-Measure of 94.3%. Meanwhile, recommendation models, namely HCSUC and Tesfaye et al., provide an average F-Measure of 59.5% and 61.1%, respectively. Traditional recommendation models, such as collaborative filtering, content-based filtering, collaborative-content hybrid, and PSO-based hybrid filtering provide F-Measures of 60%, 63.6%, 69.3%, and 73.1%, respectively. Therefore, the experimental results demonstrate that the proposed model provides better recommendations compared to other models.
Table 11 compares the precision of the proposed models, HCSUC and Tesfaye et al., collaborative filtering, content-based filtering, collaborative-content hybrid filtering, and particle swarm optimization (PSO)-based collaborative-content hybrid filtering when the recommendation set has various sizes. The experiment is carried out with a recommendation set size of 5, 10, 20, 30, 40, and 50, respectively. The testing sets are used to verify seven recommendation models at first. Following that, suggestions for genuine positives and false positives are calculated. Finally, the models’ accuracy is determined by counting the number of true positive and false positive suggestions. The suggested model has an average accuracy of 96.3%, according to the experimental findings. HCSUC, on the other hand, achieves an average accuracy of 76.1%. The Tesfaye et al. recommendation model, collaborative filtering, content-based filtering, collaborative-content hybrid, and PSO-based hybrid filtering, on the other hand, has an average precision of 72.3%, 61.1%, 67.3%, 80.3%, and 64.1%. As a consequence of the experimental data, it is obvious that the suggested model outperforms similar models in terms of precision.
Table 12 compares recall values for the proposed models, HCSUC, Tesfaye et al., collaborative filtering, content-based filtering, collaborative-content hybrid filtering, and particle swarm optimization (PSO)-based collaborative-content hybrid filtering with different recommendation set sizes. The experiment is performed with the recommended size set of 5, 10, 20, 30, 40, and 50, correspondingly. To begin, the testing sets are used to validate seven recommendation models. The real positive and false negative suggestions are reviewed in order. Finally, the recall of models is assessed by considering true positive and false negative suggestions. According to the testing results, the suggested model has an average recall of 94.5%. HCSUC, on the other hand, has an average recall of 69.6%. Similarly, on the other hand, the recommendation model of Tesfaye et al., collaborative filtering, content-based filtering, collaborative-content hybrid, and PSO-based hybrid filtering results an average recall of 73.5%, 66.3%, 69.5%, 83.1%, and 71%, respectively. Therefore, it is evident from the experiment that the proposed model outperforms other models in terms of recall.
Table 13 compares F-Measure values for collaborative filtering, content-based filtering, collaborative-content hybrid filtering, and particle swarm optimization (PSO)-based collaborative-content hybrid filtering with respect to different sizes of the recommendation set between the proposed model, HCSUC, and Tesfaye et al., collaborative filtering, content-based filtering, collaborative-content hybrid filtering, and particle swarm optimization (PSO)-based collaborative-content hybrid filter. The experiment is performed with the size of the suggestion set to 5, 10, 20, 30, 40, and 50. To begin, the testing sets are used to verify seven recommendation models. Then the models’ accuracy and recall are determined. Finally, the models’ F-Measure is calculated by combining accuracy and recall. The suggested model has an average F-Measure of 94.5 percent, according to the experimental findings. The average F-Measure for the HCSUC recommendation model is 72.1%. The Tesfaye et al. recommendation model, collaborative filtering, content-based filtering, collaborative-content hybrid, and PSO-based hybrid filtering, on the other hand, achieves an average F-Measure of 72.5%, 63.0%, 67.8%, 81.1%, and 65%, respectively. As a consequence of the experimental findings, it is clear that the suggested model outperforms current methods in terms of F-Measure.

6.1. Performance Analysis

To evaluate the proposed model’s efficiency, performance analysis is derived based on the different parameters of the confusion matrix. In this research paper, a four-fold cross-validation technique is applied to the given data sets. The ratio of the training and testing dataset are selected as various ratios for four iterations. The precision and recall values for dataset 1, dataset 2, and dataset 3 are shown in Table 14, Table 15 and Table 16 respectively. after every iteration, the error is corrected to enhance the model more accurately. The proposed model is applied for a good recommendation for users based of their preferences.
The data sets are validated by the proposed model through four-fold cross-validation techniques. The values of the performance metrics are different for four different strategies. The mean of the performance index for four different strategies is graphically shown in Figure 9 for three different datasets.

6.2. Analytical Comparison

To measure the proposed model’s efficiency, a comparison is performed with two recent research studies that deal with the crow search-based hybrid recommendation algorithm. The comparisons are shown in Table 17 and Table 18. The evaluation of efficiency is carried out using standard performance metrics, that is, Mean Absolute Error (MAE) and Root Mean Square Error (RMSE).
Table 17 shows a comparison between the proposed model, HCSUC, Tesfaye et al., collaborative filtering, content-based filtering, collaborative-content hybrid filtering, and particle swarm optimization (PSO)-based collaborative-content hybrid filtering with respect to MAE. To begin, the dataset’s 500,1000,2000,3000, 4000, and 5000 user ratings are considered for rating prediction. Then, on unseen objects, the users’ ratings are anticipated. Finally, MAE is calculated by subtracting the difference between the expected and actual ratings. The suggested model yields an average MAE of 0.23, according to the experimental results. HCSUC and TESFAYE et al., on the other hand, has MAEs of 0.75 and 0.86, respectively. Collaborative filtering, content-based filtering, collaborative-content hybrid filtering, and PSO-based hybrid filtering, on the other hand, had average MAEs of 0.63, 0.54, 0.53, and 0.58, respectively. As a consequence, the experimental findings show that the suggested model outperforms the existing alternatives.
Table 18 compares collaborative filtering, content-based filtering, collaborative-content hybrid filtering, and particle swarm optimization (PSO)-based collaborative-content hybrid filtering using the proposed model, HCSUC, and Tesfaye et al. RMSE is more accurate than MAE for detecting prediction mistakes. To begin, user ratings of 500, 1000, 2000, 3000, 4000, and 5000 are picked from the dataset. The users’ ratings on unrated things are consistently anticipated. Finally, the RMSE is calculated based on the normalized difference between the expected and actual ratings. The suggested model has an average RMSE of 0.33, according to the experimental results. HCSUC and TESFAYE et al., on the other hand, report average RMSE as0.86 and 0.97, respectively. On the other hand, collaborative filtering, content-based filtering, collaborative-content hybrid, and PSO-based hybrid filtering results in an average RMSE of 0.64, 0.57, 0.61, and 0.71, respectively. As a consequence, the preceding data show that the suggested model is more efficient than similar techniques.

7. Discussion

In this paper, a personalized recommendation system is introduced for tourists. Tourism recommendation is one of the areas in which little research has been done so far. However, the number of online tourism recommenders and users’ interest towards such recommenders has increased exponentially over the years. To overcome this, the proposed model provides more accurate recommendations in less time and helps increase the popularity of recommender sites. Moreover, the objective of this research is not only to deliver recommendations according to user profiles, but to also suggest high quality recommendations at any given point in time. On the other hand, the model effectively deals with new users providing accurate recommendations based on minimal information from users. In order to keep user interest intact, the model ensures diversified recommendations within a short span of time. The model suggested in this paper is easily deployable in mobile devices, group recommenders, distributed systems, contextual recommenders, and Internet of Things devices. The proposed idea can be solicited in social recommenders as well. Social recommenders help to get the features from social networking sites and recommendation systems. The features ensure proper execution of filtering process and to overcome the problems in recommendation systems. The benefit of having a social recommender is bi-focal. Firstly, proposed collaborative filtering helps to identify the most similar users of the target user using the data available in social sites. Thereafter, proposed content-based filtering envisages relevant content. Moreover, the model is capable of identifying communities from social recommenders and matching communal interests with the user profile. The recommenders consisting of such intelligent capabilities is very useful for industrial applications and researchers. The rating prediction technique proposed in this paper also minimizes the data sparsity and cold start problem. Technically, the proposed system uses a Big Data tourism dataset to analyze the customers’ choices. A sequential statistical analysis is performed, and the Big Data tourism data set is structured to fit the requirement of the model. The proposed model is an intelligent recommender system that consists of collaborative and content-based filtering to achieve an accurate result. Due to this, ITRS encompasses the advantages of constituent algorithms. As a result, drawbacks of the constituent algorithm are substantially minimized. Therefore, the system could be deployed, providing suggestions of various products. From the above discussion, it is evident that the proposed model is not only made up of a flawless framework but also offers various services. However, the research work has some drawbacks that are detrimental to the performance. Some of the major drawbacks of the proposed model are proper aggregation function, filtering schemes containing user contexts, dealing with change of user preference, handling sentiment analysis of users, trivial analysis of user contents, recommendations based on numeric preferences, systematic security protocols, plenty of historical ratings, and numerous redundant features for content-based filtering.

8. Conclusions

The rapid development of the web and its applications has been significant for recommender systems. Applied in different spaces, recommender frameworks were intended to create proposals, for example, for things or administrations depending on client interests. A big data tourism dataset is used for filtering the users to whom tourist industries recommend in the future. Statistical analysis is performed by a sequential pilot survey that divides the data into three different groups. The groups are formed based on users’ preferences and the content of their desired items. Crow search-based hybrid recommendation techniques, combined with collaborative and content-based filtering, is deployed to achieve the desired result. Hybrid filtering techniques are implemented within the proposed model to achieve recommendation accuracy. Three different real datasets are used to validate the proposed model. The proposed model is also compared with two different existing studies. The performance of the proposed model is determined by applying a four-fold cross-validation system. The overall Precision and Recall of the proposed model are 95.23% and 94.38%, respectively. To enhance the proposed model’s performance and achieve a higher level of recommendation accuracy, a context-based recommendation will be considered in future research.

Author Contributions

Conceptualization, A.R. and M.S.; methodology, M.S. and A.R.; software, A.R.; validation: M.S.; formal analysis, H.A.; investigation, M.A.; resources, H.A.; data curation, M.S., A.R., and M.A.; writing—original draft preparation, A.R., M.S. and H.A.; writing—review and editing, H.A. and M.A. All authors have read and agreed to the published version of the manuscript.

Funding

This research received no external funding.

Institutional Review Board Statement

Not applicable.

Informed Consent Statement

Not applicable.

Data Availability Statement

Three different datasets are used in this research: Tripadvisor, Available online: http://www.tripadvisor.com (accessed on 1 November 2021), Data.world, Available online: https://data.world/datafiniti/hotel-reviewsz (accessed on 1 November 2021), Zenodo, Available online: https://zenodo.org/record/1219899#.YWaztBpBxPY (accessed on 1 November 2021).

Conflicts of Interest

The authors declare no conflict of interest.

References

  1. Verma, V.; Aggarwal, R.K. A New Similarity Measure Based on Simple Matching Coefficient for Improving the Accuracy of Collaborative Recommendations. Int. J. Inf. Technol. Comput. Sci. 2019, 6, 37–49. [Google Scholar] [CrossRef]
  2. Verma, V.; Aggarwal, R.K. Accuracy Assessment of Similarity Measures in Collaborative Recommendations Using CF4J Framework. Int. J. Mod. Educ. Comput. Sci. 2019, 5, 41–53. [Google Scholar] [CrossRef]
  3. Bobadilla, F.O.; Hernando, A.; Gutiérrez, A. Recommender systems survey. Knowl.-Based Syst. 2013, 46, 109–132. [Google Scholar] [CrossRef]
  4. Ortegaa, F.; Hernandob, A.; Bobadillab, J.; Kang, J.H. Recommending items to a group of users using matrix factorization-based collaborative filtering. Inf. Sci. 2016, 345, 313–324. [Google Scholar] [CrossRef]
  5. Katarya, R.; Verma, O.P. A collaborative recommender system enhanced with particle swarm optimization technique. Multimed. Tools Appl. 2016, 75, 9225–9239. [Google Scholar] [CrossRef]
  6. Katarya, R.; Verma, O.P. Recommender system with grey wolf optimizer and FCM. Neural Comput. Appl. 2018, 30, 1679–1687. [Google Scholar] [CrossRef]
  7. Isinkaye, F.O.; Folajimi, Y.O.; Ojokoh, B.A. Recommendation systems: Principles, methods and evaluation. Egypt. Inform. J. 2015, 16, 261–273. [Google Scholar] [CrossRef] [Green Version]
  8. Katarya, R.; Verma, O.P. An effective web page recommender system with fuzzy c-mean clustering. Multimed. Tools Appl. 2017, 76, 21481–21496. [Google Scholar] [CrossRef]
  9. Katarya, R.; Verma, O.P. An effective collaborative movie recommender system with cuckoo search. Egypt. Inform. J. 2017, 18, 105–112. [Google Scholar] [CrossRef] [Green Version]
  10. Sandeep, M.K.; Prabhu, J. Hybrid Model for Movie Recommendation System Using Fireflies and Fuzzy C-Means. Int. J. Web Portals 2019, 11, 1–13. [Google Scholar]
  11. Behera, R.N.; Saha, P.L.; Chakraborty, A.; Dash, S. Hybrid Movie Recommendation System based on PSO based Clustering. Int. J. Control Theory Appl. 2017, 10, 41–49. [Google Scholar]
  12. Yadav, D.K.; Katarya, R. Study on Recommender System using Fuzzy Logic. In Proceedings of the Second International Conference on Computing Methodologies and Communication (ICCMC), Erode, India, 15–16 February 2018; pp. 50–54. [Google Scholar]
  13. Chandak, M.; Girase, S.; Mukhopadhyay, D. Introducing Hybrid Technique for Optimization of Book Recommender System. In Proceedings of the International Conference on Advanced Computing Technologies and Applications (ICACTA-2015), Mumbai, India, 26–27 March 2015; Volume 45, pp. 23–31. [Google Scholar]
  14. Belén Barragáns-Martínez, A.B.; Costa-Montenegro, E.; Burguillo, J.C.; Rey-López, M.; Mikic-Fonte, F.A.; Peleteiro, A. A hybrid content-based and item-based collaborative filtering approach to recommend TV programs enhanced with singular value decomposition. Inf. Sci. 2010, 180, 4290–4311. [Google Scholar] [CrossRef]
  15. Al-Shamri, M.Y.H.; Bharadwaj, K.K. Fuzzy-genetic approach to recommender systems based on a novel hybrid user model. Expert Syst. Appl. 2008, 35, 1386–1399. [Google Scholar] [CrossRef]
  16. Lee, M.; Woo, Y. A hybrid recommender system combining collaborative filtering with neural network. Lect. Notes Comput. Sci. 2002, 2347, 531–534. [Google Scholar]
  17. de Campos, L.M.; Fernández-Luna, J.M.; Huete, J.F.; Rueda-Morales, M.A. Combining content-based and collaborative recommendations: A hybrid approach based on Bayesian networks. Int. J. Approx. Reason. 2010, 51, 785–799. [Google Scholar] [CrossRef] [Green Version]
  18. Shinde, S.K.; Kulkami, U. Hybrid personalized recommender system using Centering–Bunching based clustering algorithm. Expert Syst. Appl. 2012, 39, 1381–1387. [Google Scholar] [CrossRef]
  19. Jung, K.Y.; Park, D.H.; Lee, J.H. Hybrid Collaborative Filtering and Content-Based Filtering for Improved Recommender System. In Lecture Notes in Computer Science, Proceedings of the International Conference on Computational Science—ICCS 2004, Kraków, Poland, 6–9 June 2004; Bubak, M., van Albada, G.D., Sloot, P.M.A., Dongarra, J., Eds.; Springer: Berlin/Heidelberg, Germany, 2004; Volume 3036, pp. 295–302. [Google Scholar] [CrossRef] [Green Version]
  20. Christakou, C.; Vrettos, S.; Stafylopatis, R. A hybrid movie recommender system based on neural networks. Int. J. Artif. Intell. Tools 2007, 16, 771–792. [Google Scholar] [CrossRef]
  21. Geetha, G.; Safa, M.; Fancy, C.; Saranya, D. A Hybrid Approach using Collaborative filtering and Content based Filtering for Recommender System. In Proceedings of the National Conference on Mathematical Techniques and its Applications 2018, Kattankulathur, India, 5–6 January 2018; pp. 1–7. [Google Scholar] [CrossRef] [Green Version]
  22. Yanga, S.; Korayemb, M.; AlJadda, K.; Grainger, T.; Natarajana, S. Combining content-based and collaborative filtering for job recommendation system: A cost-sensitive Statistical Relational Learning approach. Knowl.-Based Syst. 2017, 136, 37–45. [Google Scholar] [CrossRef]
  23. Iaquinta, L.; Gentile, A.L.; Lops, P.; de Gemmis, M.; Semeraro, G. A Hybrid Content-Collaborative Recommender System Integrated into an Electronic Performance Support System. In Proceedings of the Seventh International Conference on Hybrid Intelligent Systems, Kaiserlautern, Germany, 17–19 September 2007; pp. 47–52. [Google Scholar] [CrossRef]
  24. El-Ashmawi, W.H.; Ali, A.F.; Slowik, A. Hybrid crow search and uniform crossover algorithm-based clustering for top-N recommendation system. Neural Comput. Appl. 2020, 33, 7145–7164. [Google Scholar] [CrossRef]
  25. Tesfaye, E.; Pooja, R.A. Intelligent Collaborative Recommender System by Crow Search Algorithm and K-Means algorithm. Int. J. Recent Technol. Eng. 2019, 8, 2. [Google Scholar]
  26. Verma, V.; Aggarwal, R.K.; Rajesh, A. New Similarity Measure Based on Gravitational Attraction for Improving the Accuracy of Collaborative Recommendations. Int. J. Intell. Syst. Appl. 2020, 2, 44–53. [Google Scholar] [CrossRef]
  27. Ajah, I.A.; Nweke, H.F. Big Data and Business Analytics: Trends, Platforms, Success Factors and Applications. Big Data Cogn. Comput. 2019, 3, 32. [Google Scholar] [CrossRef] [Green Version]
  28. Pyne, S.; Rao, B.P.; Rao, S.B. Big Data Analytics: Views from Statistical and Computational Perspectives. In Big Data Analytics; Springer: New Delhi, India, 2016; pp. 1–10. [Google Scholar]
  29. Little, R.; Rubin, D. Statistical Analysis with Missing Data, 3rd ed.; Wiley Series in Probability and Statistics; Wiley: Hoboken, NJ, USA, 2019. [Google Scholar]
  30. Xu, H.; Fan, G.; Li, K. Improved Statistical Analysis Method Based on Big Data Technology. In Proceedings of the International Conference on Computer Network, Electronic and Automation (ICCNEA), Xi’an, China, 23–25 September 2017. [Google Scholar]
  31. Keshavan, R.H.; Montanari, A.; Sewoong, O. Matrix completion from a few entries. IEEE Trans. Inf. Theory 2010, 56, 2980–2998. [Google Scholar] [CrossRef]
  32. Adomavicius, G.; Tuzhilin, A. Toward the Next Generation of Recommender Systems: A Survey of the State-of-the-Art and Possible Extensions. IEEE Trans. Knowl. Data Eng. 2005, 17, 734–749. [Google Scholar] [CrossRef]
  33. Stern, D.H.; Herbrich, R.; Graepel, T. Matchbox: Large scale online bayesian recommendations. In Proceedings of the 18th International Conference on World Wide Web, Madrid, Spain, 20–24 April 2009; pp. 111–120. [Google Scholar]
  34. Zhang, P.; Zhang, Z.; Tian, T.; Wang, Y. Collaborative filtering recommendation algorithm integrating time windows and rating predictions. Appl. Intell. 2019, 49, 3146–3157. [Google Scholar] [CrossRef]
  35. Jiang, L.; Cheng, Y.; Yang, L.; Li, J.; Yan, H.; Wang, X. A trust-based collaborative filtering algorithm for E-commerce recommendation system. J. Ambient. Intell. Humaniz. Comput. 2019, 10, 3023–3034. [Google Scholar] [CrossRef] [Green Version]
  36. Ricci, F.; Rokach, L.; Shapira, B. Recommender Systems: Introduction and Challenges. In Recommender Systems Handbook, 2nd ed.; Ricci, F., Rokach, L., Shapira, B., Eds.; Springer: Boston, MA, USA, 2015; pp. 1–36. [Google Scholar]
  37. Herlocker, J.L.; Konstan, J.A.; Terveen, L.G.; Riedl, J.T. Evaluating collaborative filtering recommender systems. ACM Trans. Inf. Syst. 2004, 22, 5–53. [Google Scholar] [CrossRef]
  38. Kumar, I.P.; Sambangi, S. Content Based Apparel Recommendation System for Fashion Industry. Int. J. Eng. Adv. Technol. 2019, 8, 509–516. [Google Scholar]
  39. Nieves, E.H. New Approach to Recommend Banking Products Through a Hybrid Recommender System. In Proceedings of the International Symposium on Ambient Intelligence, Ambient Intelligence—Software and Applications, ISAmI 2020, L’Aquila, Italy, 7–9 October 2020; Advances in Intelligent Systems and Computing; Springer: Berlin/Heidelberg, Germany, 2021; Volume 1239, pp. 262–266. [Google Scholar]
  40. Burke, R. Hybrid recommender systems: Survey and experiments. User Model User-Adapt. Interact 2002, 12, 331–370. [Google Scholar] [CrossRef]
  41. Friedman, N.; Geiger, D.; Goldszmidt, M. Bayesian network classifiers. Mach Learn. 1997, 29, 131–163. [Google Scholar] [CrossRef] [Green Version]
  42. Askarzadeh, A. A novel metaheuristic method for solving constrained engineering optimization problems: Crow search algorithm. Comput. Struct. 2016, 169, 1–12. [Google Scholar] [CrossRef]
  43. Tripadvisor. Available online: http://www.tripadvisor.com (accessed on 26 August 2020).
  44. Data.world. Available online: https://data.world/datafiniti/hotel-reviewsz (accessed on 26 August 2020).
  45. Zenodo. Available online: https://zenodo.org/record/1219899#.YWaztBpBxPY (accessed on 26 August 2020).
  46. Powers, D.M.W. Evaluation: From precision, recall and f-measure to roc, informedness, markedness & correlation. J. Mach. Learn. Technol. 2011, 2, 37–63. [Google Scholar]
Figure 1. Impact of Big Data and Visualization of the Proposed Model.
Information 13 00070 g001
Figure 2. Visualization of the testbed data analysis. (a) Visualization of the unstructured data set, (b) Visualization of the structured data set.
Information 13 00070 g002
Figure 3. Divided the data set based on a collaborative filtering technique. (a) Three different groups based on collaborative filtering, (b) Determine a threshold value to select the group.
Information 13 00070 g003
Figure 4. Distribution of similarity index for all users in a group.
Information 13 00070 g004
Figure 5. Effective hybrid recommendation.
Information 13 00070 g005
Figure 6. Precision according to the Topn Recommendation.
Information 13 00070 g006
Figure 7. Recall according to the Topn Recommendation.
Information 13 00070 g007
Figure 8. F-Measure according to the Topn Recommendation.
Information 13 00070 g008
Figure 9. Value of performance metrics for the proposed model.
Information 13 00070 g009
Table 1. Analogy between the parameters of CSA and parameters of the proposed model.
SL No.CSAProposed Model
1CrowA hotel
2PositionMean rating of neighbors to a hotel
3IterationTotal number of hotels with respect to a place
4DimensionAn attribute of the hotel
5MemorySet of Topn ratings
6Fitness FunctionMean of non-neighbors’ ratings to a hotel—Mean of neighbors’ ratings to a hotel
7Flight LengthTotal number of neighbors who rated a hotel
8Awareness Probability m o d e   o f   n e i g h b o r s '   r a t i n g s   m o d e   o f   T o p   n   r a t i n g s  
Table 2. Sample Customer Ratings to Monaco Seattle Hotel.
Rating to the Attributes Of Hotel
Sl No.Customer Name Overall RatingPriceRoomsLocationCleanlinessFront DeskServiceBusiness Service
1Selizabethm4545455−1
2IndieLady4545455−1
3Hilobb444345−14
4Chianti_girl2455555555
5MauiDiver22335223
6Tulane86 32455135
7Kstenger5555555−1
8CantwaitNy55555543
9MarbleJac44455554
10Smashers55555555
11Kiwiwannabe4445445−1
12Chiliwidle43454323
13Trinzeon54445555
14ATudorQuene55555555
15BearAndPenguin32334531
Table 3. MAE according to the sizes of the testing sets.
Number of User RatingsProposed Model
5000.23
10000.25
20000.26
30000.22
40000.22
50000.22
Table 4. RMSE according to the sizes of the testing sets.
Number of User RatingsProposed Model
5000.38
10000.33
20000.35
30000.32
40000.33
50000.32
Table 5. Precision according to the Topn Recommendation (Considering Dataset 1 [43]).
Size of Topn RecommendationPrecision
Proposed ModelHCSUCTesfaye et al.Collaborative Filtering Content-Based Filtering Hybrid Filtering PSO-Based Hybrid Filtering
50.940.720.580.630.640.670.73
100.950.710.590.650.620.660.71
200.930.650.640.680.630.640.7
300.930.670.640.620.650.630.68
400.930.680.650.590.60.610.67
500.930.690.640.580.580.60.65
Table 6. Recall according to the Topn Recommendation (Considering Dataset 1 [43]).
Size of Topn RecommendationRecall
Proposed ModelHCSUCTesfaye et al.Collaborative FilteringContent-Based Filtering Hybrid FilteringPSO-Based Hybrid Filtering
50.930.780.580.650.680.690.73
100.940.760.590.650.670.630.73
200.940.770.640.650.670.640.68
300.950.790.640.650.640.640.67
400.960.760.650.620.640.620.65
500.950.780.640.610.640.60.65
Table 7. F-Measure according to the Topn Recommendation (Considering Dataset 1 [43]).
Size of Topn RecommendationF-Measure
Proposed ModelHCSUCTesfaye et al.Collaborative FilteringContent-Based Filtering Hybrid FilteringPSO-Based Hybrid Filtering
50.930.740.600.630.650.670.73
100.940.730.590.650.640.640.71
200.930.700.600.660.640.640.68
300.930.720.620.630.640.630.67
400.940.710.630.60.610.610.65
500.930.730.630.590.60.60.65
Table 8. Precision according to the Topn Recommendation (Considering Dataset 2 [44]).
Size of Topn RecommendationPrecision
Proposed ModelHCSUCTesfaye et al.Collaborative Filtering Content-Based FilteringHybrid Filtering PSO-Based Hybrid Filtering
50.950.610.670.670.680.690.78
100.940.650.590.650.680.670.75
200.940.610.560.610.680.640.73
300.930.570.550.580.580.660.71
400.920.570.550.580.550.670.67
500.930.610.550.560.510.630.62
Table 9. Recall according to the Topn Recommendation (Considering Dataset 2 [44]).
Size of Topn RecommendationRecall
Proposed ModelHCSUCTesfaye et al.Collaborative FilteringContent-Based Filtering Hybrid FilteringPSO-Based Hybrid Filtering
50.960.630.650.690.730.780.85
100.960.580.660.670.710.760.82
200.970.520.680.660.70.730.77
300.970.620.730.610.680.740.74
400.960.610.780.550.630.730.72
500.980.640.760.520.610.710.7
Table 10. F-Measure according to the Topn Recommendation (Considering Dataset 2 [44]).
Size of Topn RecommendationF-Measure
Proposed ModelHCSUCTesfaye et al.Collaborative FilteringContent-Based Filtering Hybrid FilteringPSO-Based Hybrid Filtering
50.950.610.650.670.70.730.81
100.940.610.520.650.690.710.78
200.950.560.610.630.680.680.74
300.940.590.620.590.620.690.72
400.930.580.640.560.580.690.69
500.950.620.630.530.550.660.65
Table 11. Precision according to the Topn Recommendation (Considering Dataset 3 [45]).
Size of Topn RecommendationPrecision
Proposed ModelHCSUCTesfaye et al.Collaborative FilteringContent-Based FilteringHybrid FilteringPSO-Based Hybrid Filtering
50.960.740.730.680.710.770.68
100.960.770.710.650.730.820.68
200.960.770.710.630.760.850.66
300.960.760.730.620.670.860.63
400.970.760.730.560.590.780.62
500.970.770.730.530.580.740.58
Table 12. Recall according to the Topn Recommendation (Considering Dataset 3 [45]).
Size of Topn RecommendationRecall
Proposed ModelHCSUCTesfaye et al.Collaborative FilteringContent-Based Filtering Hybrid FilteringPSO-Based Hybrid Filtering
50.950.660.730.730.760.820.74
100.940.670.730.710.740.850.73
200.940.670.740.680.730.860.71
300.940.710.740.670.680.880.68
400.950.730.740.620.650.810.66
500.950.740.730.570.610.770.62
Table 13. F-Measure according to the Topn Recommendation (Considering Dataset 3 [45]).
Size of Topn RecommendationF-Measure
Proposed ModelHCSUCTesfaye et al.Collaborative FilteringContent-Based Filtering Hybrid FilteringPSO-Based Hybrid Filtering
50.950.690.730.70.730.790.7
100.940.710.710.670.730.830.65
200.940.710.720.650.740.850.68
300.940.730.730.640.670.860.65
400.950.740.730.580.610.790.63
500.950.750.730.540.590.750.59
Table 14. Value for Recall and Precision at 4 different training and testing strategies for dataset 1 [43].
Training
and Testing Strategy
Strategy 1 (50–50%)Strategy 2 (60–40%)Strategy 3 (70–30%)Strategy 4 (80–20%)
Recall91.694.594.594.68
Precision92.390.693.595.82
Table 15. Value for Recall and Precision at 4 different training and testing strategies for dataset 2 [44].
Training
and Testing Strategy
Strategy 1 (50–50%)
Strategy 2 (60–40%)Strategy 3 (70–30%)
Strategy 4 (80–20%)
Recall96.996.296.695.2
Precision94.594.793.596.3
Table 16. Value for Recall and Precision at 4 different training and testing strategies for dataset 3 [45].
Training
and Testing Strategy
Strategy 1 (50–50%)Strategy 2 (60–40%)Strategy 3 (70–30%)
Strategy 4 (80–20%)
Recall96.194.494.597.6
Precision95.293.596.396.4
Table 17. Comparison of MAE with the proposed model and existing studies.
Number of User RatingsMAE
Proposed ModelHCSUCTesfaye et al.Collaborative FilteringContent-Based Filtering Hybrid FilteringPSO-Based Hybrid Filtering
5000.230.740.850.570.480.430.56
10000.250.780.860.590.520.480.57
20000.260.790.860.610.540.520.57
30000.220.730.860.650.570.550.55
40000.220.720.870.680.580.590.62
50000.220.770.890.690.60.630.64
Table 18. Comparison of RMSE with the proposed model and existing studies.
Number of User RatingsRMSE
Proposed ModelHCSUCTesfaye et al.Collaborative FilteringContent-Based FilteringHybrid FilteringPSO-Based Hybrid Filtering
5000.380.840.970.620.530.560.66
10000.330.820.980.630.560.580.67
20000.350.860.930.630.570.590.71
30000.320.880.980.640.580.630.73
40000.330.880.980.670.60.660.76
50000.320.880.980.70.620.680.77
Publisher’s Note: MDPI stays neutral with regard to jurisdictional claims in published maps and institutional affiliations.

