Abstract
In general, automation involves less human intervention, which leads to dependence on preprogrammed machines and processes that operate continually and carry out numerous tasks. This leads to predictable repeating behavior that can be used to advantage. Due to the incorporation of the Internet of Things into such automated processes, these cyber–physical systems are now vulnerable to cyberattacks, the patterns of which can be difficult to identify and understand. Wastewater treatment plants (WTPs) can be challenging to run, but the treatment process is essential since drinking water and water that can be recycled are extremely important to obtain. The increasing susceptibility of WTPs to cyberattacks brought on by exploitation of their weaknesses poses a further challenge. Understanding system weaknesses and potential exploits is necessary for securing such cyber–physical systems. An attack graph utilization and visualization approach for WTPs is presented in this paper. A formal modeling and encoding of the system were carried out using a structural framework (AADL). The system model was then continuously checked by a model-checker called JKind against security requirements to create attack routes, which were then merged into an attack graph using a tool called GraphViz.
1. Introduction
Physical damage, bioterrorism, chemical contamination, and cyberattack are the four main categories under which risks to a water or wastewater infrastructure are categorized [1]. Security for Industrial Control Systems (ICS) has become more crucial. Recent assaults have demonstrated that securing control systems insufficiently could have catastrophic effects on society [2].
A formal approach is suggested by [3] for examining the security of Industrial Control Systems (ICS), both before and after they are put into use. A model of the control system is analyzed to identify system vulnerabilities using a knowledge-based method. The logic theory’s rules are based on ICS security standards and guidelines and vulnerability databases.
A typical Wastewater Treatment Plant was examined by [4] from the perspective of energy use, and a cryptographic mechanism for guaranteeing data privacy was suggested. Reference [2] presents a modification to the Systems Modeling Language (SysML) that enables the extraction of vulnerabilities from a model of an industrial control system. The SysML model of a control system was then used as the input for a formal reasoning tool. By designating specific components as compromised and using the ensuing analysis to determine the effects of assaults on these components on system security as a whole, the control system’s security can be strengthened. However, the logic principles that discern system vulnerabilities from component ones have not thus far been fully implemented.
A technique is suggested by [5] for installing automation systems in water treatment facilities that prioritize security and industrial systems that follow the ISA99 automation safety criteria. The suggested system’s implementation is predicated on the idea of standardization, documenting of practices, tools, and methodologies, as well as the construction of indicators, records, and a comprehensive awareness-raising process. This methodology may play an initial role in the implementation process of a certain enterprise, though it is unlikely to be able to fully satisfy the requirements of a certain firm.
The current cyber-security research was reviewed by [6] with an eye toward enhancing the safety of water supply and wastewater assortment and treatment apparatuses, which are essential components of the national infrastructure. In order to explore the security of non-drinking water facilities, more research is needed to create testbeds, simulations, and databases.
The review study of [7] emphasizes the intricate interactions between water portion, water variety, and community for six popular water management strategies, highlighting the growing urge to examine water security in a more unified way.
A thorough report is presented by [8] on the knowledge base on water utility incidents, and recommendations are provided for risk management and analysis. Due to a lack of data, training, and priority within such facilities, risk analysis techniques are only occasionally used. Utility companies can increase security by implementing clever solutions. Work is required to identify system vulnerabilities and defense mechanisms against them.
The water and wastewater industry faces many specific difficulties when choosing and putting into practice security countermeasures [9]. The main difficulties are: (1) the growing interconnection of their business and control system networks; (2) the wide range of proprietary industrial control equipment used; (3) the abundance of cyber-security awareness; and (4) the various ways in which the supplier may intend to achieve this awareness.
According to an analysis of external threats to industrial infrastructure, wastewater treatment plant (WTP) facilities may be the target of attackers with malevolent intent who want to obstruct the treatment process’ regular operations [10]. In terms of cyber-attacks, the third most frequently attacked industry is the water industry [11]. Many such attacks, however, either go unreported or are not discovered until it is too late. Industrial control systems (ICS) have incorporated the Internet of Things (IoT) to increase and improve the capability of the control and sensing elements to guarantee and ensure the seamless integration of both systems. Connecting various components improves efficiency, control, and production capacity, which in turn necessitates layers of autonomous cyber–physical systems, increasing the reliability of the process of supplying safe water [6].
The attackers of wastewater treatment facilities are drawn to target certain companies due to their location or particular subdivision. The installations that use field level devices for the treatment of wastewater are the main worry since they are susceptible to manipulation and tampering [12].
State of Art
Wastewater treatment plants may have undisclosed cybersecurity vulnerabilities due to their sophistication, and they therefore make desirable targets for cyber-attacks. A thorough understanding of the networked system vulnerabilities and their correlations is necessary to prevent such attacks and defend the essential construction networks. These vulnerabilities can be misused to harm a system, causing significant impairment or the loss of crucial data.
Attack graphs are pictorial data frameworks that depict each possible attack scenario that an attacker might use to corrupt a system, typically in the pattern of a lineup of attack incidents. When an attack graph has been established for a system, it is possible to comprehend complicated vulnerabilities at a system level that can be derived from weaknesses in individual elements and, as a result, to estimate the security risk of the system as a whole.
In the literature, the modeling of attack graphs has been investigated for the analysis of cyber–physical systems. For example, an algorithm was developed by [13] for the smart grid using Python and the Jupyter Notebook. The technique involves the construction of a model-based attack graph. A formal description of the system features is first produced, as in our approach. Components, connectivity, vulnerabilities, resources, and pre- and post-attack scenarios are included. The state, pre-, and post-condition matrices are built as three separate matrices. Following this, these matrices are encoded in order to learn more about potential grid attacks.
Reachability hyper-graph clustering was conducted by [14] to direct the distributed search process used to create an attack graph. Additionally, they provide a robust attack template and network model to create chains of vulnerability exploitation. By comparing privileges that have already been expanded (searched) in shared memory with the prerequisites of the vulnerability or information source, it is possible to determine the exploitability of each vulnerability or information source in software applications that an attacker is currently able to access. In our approach, the architecture analysis and design language (AADL) model’s pre and post conditions for attacker actions serve to capture behavioral rules.
A new method for creating attack graphs is suggested by [15] based on vulnerability correlation. The attack graph model primarily consists of two components: vulnerability context, which defines the feature details of the vulnerability, and ICS network analogous depiction, which establishes the formal depiction of target network resources. The complexity of their approach can be expressed as O (n × m2), where n is the number of nodes and m is the number of flaws for every node.
The attack graph generating framework MulVAL was introduced by [16] for organizational networks. MulVAL is a logic-based security analyzer that automates information collection by installing host-based scanners, and it simulates the linkages among software flaws and network layouts. The suggested methodology illustrates particular industrial communication schemes while taking into account the physical network designs. However, it only covers a limited portion of the predicates while our scheme supports more general security requirements (confidentiality, integrity, and availability).
Threat modeling is a methodological approach used to identify and rank potential threats that could have an impact on the architectural artifacts and design level of a software system, as presented by the Microsoft Threat Modeling Tool (MTMT) [17]. Based on the interactions between different data flow diagrams (DFD) over a trust boundary, several possible dangers might be hypothesized. The number of possible risks recognized depends on the DFD’s abstraction level. Threats will also vary according to the particular DFD elements chosen in the threat modeling tool. In order to enable developers to create effective DFDs that accurately describe an application with trust boundaries established at the proper locations, information should be made available prior to analysis.
Cyber-attacks have been examined using a variety of attack modeling demonstration approaches, such as the diamond model, the kill chain, and the attack graph [18]. Every technique is distinct and analyses an identical attack carried out using a variety of methods. For instance, according to the diamond model, if the capabilities or infrastructure of the target are lower than the adversary’s, the adversary can exploit the target, but if the target has greater infrastructure and capability than the adversary, an assault activity will fail. The kill chain technique, on the contrary, outlines the specific steps of an assault. The target has the chance to stop the assault chain if it is discovered in any of the initial phases, even if the adversary takes infrastructure and capabilities into account prior starting any assault. The target must be made aware of the attack chain as a result. An attack graph approach identifies many routes that could breach any firm network architecture. Every route may indicate some information concerning a vulnerability. The attack graph approach can assist in securing a complicated networked system from any prospective cyber-attack. However, manually creating the attack graph is time-consuming and prone to mistakes because the graph can have hundreds of nodes, especially in the case of a big network.
A threat modeling strategy is suggested by [19] for industrial cyber–physical systems (ICPS). The process entails categorizing ICPS assets according to their level of importance before analyzing the cyber security flaws, threats, risks, effects, and remedies. To achieve end-to-end threat modeling, the methodology makes use of the digital twin and smart manufacturing techniques. However, to virtualize probable attack scenarios and visualize the effects on data design variables, augmented reality (AR) and virtual reality (VR) are required for the ICPS virtual design.
Our main contribution is a representation of the attack graph, which contains all possible attack scenarios against a WTP. This requires taking into account the system design, risks, and security concerns. The system model was encoded using a simple descriptive language (AADL) which helped capture behavioral rules through establishing pre and post requirements for attacker incidents. Our method creates an attack graph by combining the attack paths into one graph using GraphViz after continuously checking the system model with JKind checker to produce attack paths. The generated graph can be used by designers to decide which cyber-attack defenses work best. The novelty of this work lies in modeling threats against WTPs using attack graphs that capture the interdependencies between the system’s components when assessing the overall security of the system as opposed to other schemes in which it is impossible to prove that interactions between parts of a system that are each resistant to a threat do not make the system susceptible to a threat, such as the Microsoft Threat Modeling Tool (MTMT). Our scheme can also capture various security requirements encoded as computational tree logic (CTL) expressions as opposed to the limited security properties supported by other schemes such as the MulVAL scheme.
2. System Architecture
2.1. Water Treatment Process (WTP)
Figure 1 depicts the architecture of the entire system as well as the wastewater treatment process. Its components and structures are as follows.
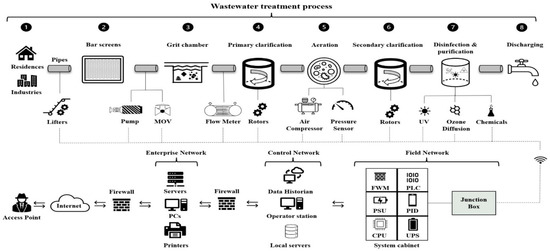
Figure 1.
System Architecture for Wastewater Treatment Plant (WTP).
- Water collection: to get the water to the treatment facility, it is collected from residences and businesses and carried there using trucks or sewage pipes [20].
- Screening procedure: bar screens are used [21] to filter out any inorganic particles present in the wastewater stream, as well as trash, toys, papers, firearms, and other detritus.
- Gritting process: in order to remove heavier inorganic grit particles from the water, such as sand, silt, clay, coffee grounds, etc., a grit chamber [22] must be used.
- Primary clarifiers: These are employed to separate the wastewater’s organic components [23]. A rotating skimmer pushes floatable solids such as grease and oil into collection trough teeth at the edges of the tank and lets the water pass through while holding back the floating debris, oil, and fat. Water flows through circular basins called sedimentation tanks, where the repulsion slows the flow rate to aid the settling process. Settable solids create sludge by sinking to the angled bottom of the tank, which is then scraped into a sludge pit by scraper arms.
- Aeration: In this procedure, wastewater is infused with beneficial bacteria. These microorganisms may eat biodegradable substances such as soap, food, human waste, and detergents [24]. To provide the oxygen that these beneficial bacteria need to survive, air is pumped through the mixture.
- Secondary clarifiers: Like the primary clarifiers [25], these remove clumps that drop to the bottom of the tank. Because these clumps still contain active microbes, they can be employed again throughout the aeration process.
- Disinfection and purification: The processed water travels through pipes and pumps to the disinfection process, which is the last step. In order to eradicate the microorganisms, this technique calls for the use of ultraviolet (UV) emissions [26] inside the tank. These emissions subject the water to ultraviolet light.
- Discharging: this step involves transferring the water to other treatment facilities, rivers, or natural areas for additional testing and purification [27].
2.2. WTP Topology
In Figure 1, the plant levels are displayed. Using Ethernet cables or Wi-Fi connections, each level is connected in turn from left to right as an incoming and an outgoing communication signal. This is a collection of the plant’s features:
- Enterprise Level (E): In charge of overseeing workplace operations, plant finances, input on general performance, and data gathered from other plant levels. Personal computers (PCs), printers, and servers are included in this level [28]. A firewall (FW) is positioned between the outside access point (AP) and the enterprise network (EN) and monitors network traffic to block any unauthorized access or suspicious activity.
- Control Network Level (C): This level is made up of numerous components that handle incoming data from the field level network and manage terminals, network access, remote management, servers, and backups [6]. Wi-Fi connections are used to link it to the enterprise level. The C level is made up of three main parts:
- The Operator Station (OS) processes incoming data from the field network devices using supervision interfaces for the operators and engineering staff [29].
- Data Historian (DH): this program is designed to handle time series data events that are logged and recorded [30] for a variety of internal plant processes.
- Local Servers (LSs): In the event of rare occurrences [31] such as data corruption or illegal cyber activity, these save all data and backups offered by the field level devices.
- Field Level (F): this includes the following items:
- System Cabinet (SC): This serves as a link between the junction box and the control network (CN) level [32]. It uses communication modules to send and receive data to and from the sensors and actuators through the junction box. It includes the following elements:
- Power supply units (PSUs): These devices give modules power, including central processing units (CPUs) and programmable logic controllers (PLCs) [33]. When there are abrupt surges or blackouts, this module is responsible for turning on and adjusting the incoming and outgoing power supplies and providing feedback.
- Uninterrupted Power Supply (UPS): this gadget is plugged into the infrastructure cabinet and provides power if there is a malfunction or damage to the power supply units [34].
- Central Processing Unit (CPU): this component processes incoming data signals to carry out specific commands in response to input from field instruments [35].
- Programmable Logic Controller (PLC): after the CPU has processed the data, the PLC processes the given data as inputs, runs the program that has been written inside of it, and outputs the results according to the input data and programmed logic [36].
- Firewall Module (FWM): this limits access to network resources [37].
- Proportional Integral Derivative Module (PID): this is a control loop mechanism [38] that automatically calculates the errors between a desired set point and a measured process field variable and performs corrections as needed.
- Junction Box: This device, also known as a fieldbus junction box, transmits signals from field devices to the system cabinet [39].
- Industrial communication protocols such as Modbus, Profinet, and DNP3 are used by sensors and actuators in the field including pumps, flow meters and pressure sensors, motors and valves, ultraviolet radiators, ozone diffusers, and chemical releasers. They use transmitters that are included with the sensors or actuators to wirelessly communicate signals to the junction box. All incoming transmission signals from the sensors and actuators are gathered by the junction box and then forwarded to the system cabinet for computation. Feedback signals are transmitted from the system cabinet’s firewall module to the control network, where incoming data is displayed, processed, saved, and managed. The enterprise network handles the control network’s processed data, which is transferred after passing through a firewall that guards against illegal access from anyone without access rights.
2.3. Vulnerabilities and Types of Attacks
Because each level in the WTP is connected to the others, a firewall is installed between them to isolate them in the event of a cyber-attack. The plant has three vulnerabilities that have been identified. The first is commercial off-the-shelf (COTS) vulnerability in the PCs, PLCs, sensors, and actuators that are available in the plant [40]. The second vulnerability is firmware, which has to do with the instruments’ operating systems and updates. The third is a computer software vulnerability known as a zero-day vulnerability [41]. The vulnerabilities can be used to launch numerous types of attacks using a variety of tactics, including:
- Intelligence Gathering (IG): This can be done by gathering information that is open to the public and can be obtained without the need for special access. For the other type, specifications and data concerning the COTS- and Internet of Things (IoT)-run equipment would need to be gathered [42].
- Man-in-the-Middle (MITM): The attacker stands between the two parties as a sort of intermediary. Gaining access to the plant network opens the door to this kind of attack [43].
- Denial-of-Service (DoS): By inundating the victim or its surrounding structure with Internet traffic, the attacker disrupts the flow of traffic on a target server, resource, or network [44].
- Phishing (PH): this is a type of social engineering in which an attacker sends a false message with the goal of tricking a victim into disclosing sensitive information [45].
- Malware Injection (MI): This is the use of reconnaissance attacks by hackers to gather information and data about the network architecture and protocols [46]. As a result, the attackers will have the ability to modify and manipulate system commands as well as remote plant process units.
- Zero-Day Exploit (0-DAY): hackers can destroy networks, data, and applications by taking advantage of zero-day vulnerabilities.
3. Attack Graph Implementation
3.1. Official Description of the WTP
The following list of system characteristics is provided:
- Attack starting point with root privileges is set at (AP) (static).
- Elements of Enterprise Network, EN; parameter en ∈ [PC, SE, PR] (static).
- Elements of Control Network level, CN; parameter cn ∈ [HD, OS, LS] (static).
- Elements at the Field Network level, FN; parameter fn ∈ [PLC, Sen, Act] (static).
- System connectedness, L ⊆ [EN × EN, EN × CN, CN × CN, CN × FN]; lij = 1 if component i and component j are fastened.
- Vulnerabilities V: Boolean υi = 1 if host i has susceptibility υ ∈ {COTS, Zero-Day, firmware}.
- Attacks A; parameter a ∈ {IG, MITM, DoS, PH, MI, 0-DAY}.
- Attack incidences, AI ⊆ A × {EN × EN, EN × CN, CN × CN, CN × FN}; named aij ≡ host i ambushes host j.
- Attack Permission P on host/device j ∈ [EN, CN, FN]; parameter pj ∈ {none, root}.
- Info K, Boolean kj = 1 if attacker discloses information about host j.
- Data Manipulation G, parameter gj = 1 if the attacker was successful in changing j’s data.
- Hardware administration H on appliance i ∈ {CN, FN}; Boolean hi = 1 if an attacker manages to control the device’s firmware.
- Attack pre-requirements:
- Pre(IGij) ≡ (lij = 1) ⋀ (pi = none).
- Pre(MITMij) ≡ (lij = 1) ⋀ (pi = root) ⋀ (hi = 1).
- Pre(DoSij) ≡ (lij = 1) ⋀ (pi = root) ⋀ (COTSj = 1 ⋁ firmwarej = 1).
- Pre(PHij) ≡ (lij = 1) ⋀ (pi = root) ⋀ (Ǝy ∈ EN: (ky = 1)).
- Pre(MIij) ≡ (lij = 1) ⋀ (pi = root) ⋀ (COTSj = 1 ⋁ firmwarej = 1) ⋀ (Ǝy ∈ {CN, FN}: ky = 1).
- Pre(0-DAYij) ≡ (lij = 1) ⋀ (Zero-Dayj = 1) ⋀ (Ǝy ∈ {CN, FN}: ky = 1) ⋀ (pi = root).
- Attack post-requirements:
- Post(IGij) ≡ (kj = 1).
- Post(MITMij) ≡ (kj = 1) ⋀ (gj = 1) ⋀ (pj = root) ⋀ (hj = 1).
- Post(DoSij) ≡ (kj = 1) ⋀ (gj = 1) ⋀ (pj = root) ⋀ (hj = 1).
- Post(PHij) ≡ (kj = 1) ⋀ (pj = root).
- Post(MIij) ≡ (kj = 1) ⋀ (gj = 1) ⋀ (pj = root).
- Post(0-DAYij) ≡ (pj = root).
- Preliminary status: pAP = root ⋀ (Ɐj ∈ {EN, CN, FN}: pj = none ⋀ (kj = gj = hj = 0)).
- Security indicator α demonstrates the attacker’s failure to hack WTP. The indicator’s computational tree logic (CTL) expression is as follows:α ≡ AG((hFN = 0), that is AG(¬ (hFN = 1)).
3.2. Attack Scenario Generation
The WTP’s design in the official description was encoded by adapting AADL inside the Osate environment as depicted in Figure 2. The assume guarantee reasoning environment (AGREE) annex plug-in, in which the variables or constants are defined locally, constrains the AADL model. The AGREE plug-in interfaces with the model checker JKind and converts the AADL + Annex models and security indicators to Lustre. JKind is an infinite-state model checker designed to evaluate a system’s alleged safety properties using the Lustre data flow synchronous programming language for real-time systems. Every time the system is executed, the JKind uses a back-end satisfiability modulo theory (SMT) solver to verify that a system model conforms with a particular temporal logic characteristic. A counter example (CE) is a faulty operation in which a security indicator is not met. This CE includes a series of attack incidences—one true at a time—that undermines the system through breaching α. Thus, it is expressed as an attack scenario.
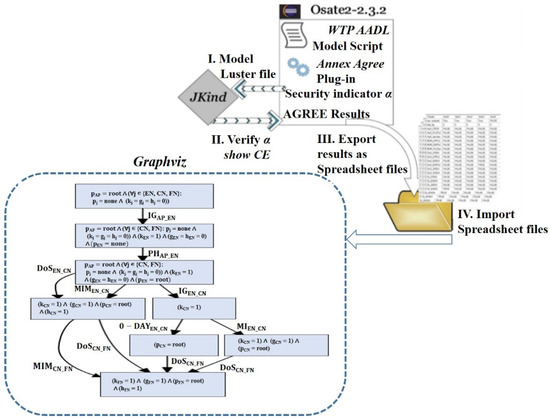
Figure 2.
Workflow for constructing cyberattack scenarios (attack graph).
According to the provided security indicator α, the attacker’s objective is to take over field network devices and compromise the system by doing so. The spreadsheet for CE 1 (IG_APEN → PH_APEN → DOS_ENCN → MITM_CNFN) produced by the JKind model checker is depicted in Figure 3. It is carried out as follows. The attacker is initially assumed to have root privilege on the access point (AP), giving him or her access to the enterprise network and enabling the start of intelligence gathering (IG_APEN), i.e., the gathering of data such as IP addresses, firmware of the devices on the enterprise network, and their hardware components. Once the attacker has this information, he/she conducts a phishing assault (PH_APEN) against the enterprise network (EN) from the access point. In order to bypass the firewall that is connected to the control network (CN), a denial of service (DOS_ENCN) attack is then launched from the enterprise network by taking advantage of COTS and firmware vulnerabilities. By this time, the attacker has amassed enough knowledge and root access to initiate (MITM_CNFN), allowing him/her to act as a conduit between field network devices and the control network while spying on incoming and outgoing traffic. As a result, users are unable to access the PLC, which allows data to be changed on the field network and disrupts the system.
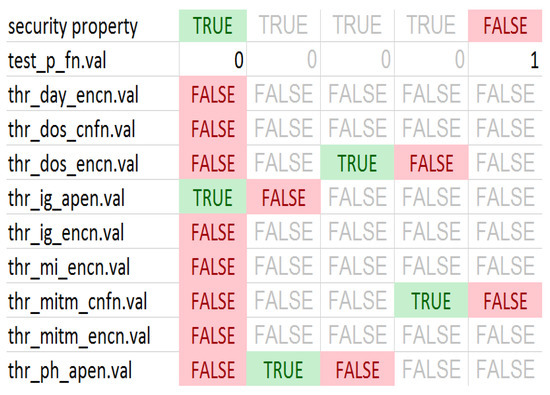
Figure 3.
Delivered counter example.
The indicator under study α is programmed in disjunction with the created CE 1, that is (α ∨ CE 1). A new CE is generated that satisfies ¬ (α ∨ CE 1) ¬ α ∧ ¬ CE 1. Five additional CEs were discovered by repeating this procedure. Excel data spread sheets can be imported from the created CEs. The attack graph (union of CEs) is graphically displayed using the Graphviz tool utilizing the exported CEs as seen in Figure 4.
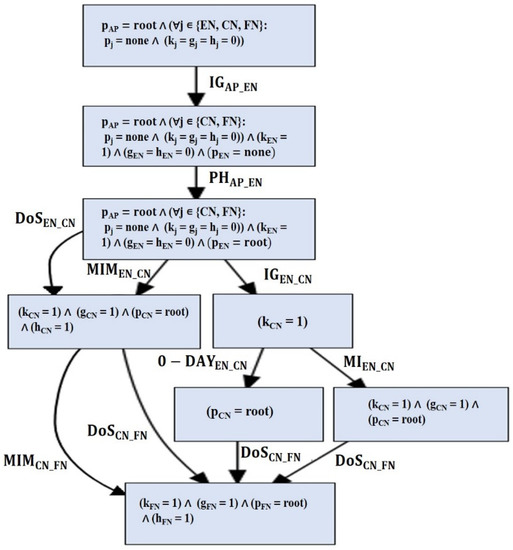
Figure 4.
Attack graph produced for the WTP.
The nodes in the graph describe the evolution of the system state as captured by the dynamic parameters that change with each attacks incidence. These parameters are: attacker permissions, information discloser, data manipulation, and hardware control. The topological features are considered fixed/static in the system architecture. These parameters are: system components, connectedness, and inherited vulnerabilities. Each transition represents an attack incidence. In the initial node, the attacker is assumed to have no permission on any system components (except the access point), no data discloser, no data manipulation, and no control over the device’s firmware. Any route from the starting node to the ending node is an attack scenario in which the attacker gains control over the field devices.
4. Discussion
In Figure 3 it can be seen that the DoS incidence appears in each attack path in the graph due to COTS flaws in CN devices and firmware flaws in FN devices. Additionally, it is impossible to successfully undertake a MITM attack against the FN devices without first performing a DoS or MITM attack against the CN devices. Therefore, if the assets can be utilized to strengthen the OS of the devices and address these vulnerabilities, this could prevent violations of property security. For instance, implementing an intrusion detection system (IDS) that monitors the incoming and outgoing traffic within the Enterprise network, as shown in Figure 5, would be one detection approach for enhancing the security of the WTP. An alarm would be sounded, and a distress signal might be issued, to alert the operator that a security breach has occurred. The operator would then perform the necessary countermeasures to reduce the threat.
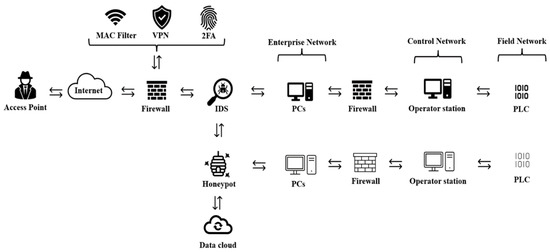
Figure 5.
Implementing enhanced network security.
Including the MAC filtering addresses [47] security measure will increase the privacy and keenness of the WTP network and help to anticipate future unauthorized connections. The installation of a virtual private network (VPN) [48] that is suited for nearby and farther access will augment the keenness of the endeavor network and help to anticipate any unauthorized access. Moreover, executing two factor authentication (2FA) [49] to get to assets on the plant network, as opposed to utilizing the outdated strategy of simply entering a username and password, can increase the resiliency and keenness of the network. Additionally, a honeypot can be deployed to act as snare for assailants that attempt to breach the network [50].
According to the created attack graph, artificial intelligence (AI) approaches can be employed to effectively highlight the subsystems’ vulnerabilities. Security designers can choose the worst-case attack scenario (with the fewest actions) that can harm the plant the most by utilizing reinforcement learning. This is accomplished by giving the attack instances numerical values based on the common vulnerability scoring system (CVSS).
We examined a further model-based threat modeling technique to validate our scheme. The Microsoft Threat Modeling Tool (MTMT) [51] is a freely accessible, easy-to-use application. It may be used by software developers to design their systems and examine possible assaults by utilizing weaknesses. The tool generates a well-organized feedback report describing the security resistance of each component to potential attacks. Figure 6 shows the whole system architecture, along with the elements that are available and their connections using a data flow diagram (DFD).
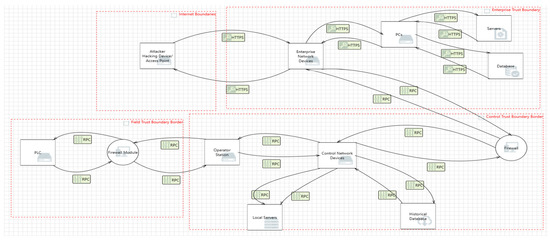
Figure 6.
The WTP system architecture, utilizing the Microsoft Threat Modeling Tool (MTMT). RPC: Remote Procedure Calls, HTTPS: Hypertext Transfer Protocol Secure.
Data flows, data stores, processes, and interactors are all included in the DFD, and trust boundaries are used for threat modeling. Using the physical elements that the plant had available and the various types of connections it used for traffic, the program was used to display the plant’s elements and connections, and to evaluate prospective attacks.
The STRIDE approach, which refers to spoofing, tampering, repudiation, information disclosure, denial of service, and elevation of privilege per interaction, is used by the MTMT tool to apply threat modeling techniques. It is a method for classifying a wide range of dangers and for describing in detail the kinds of relationships between components and mitigating features so that they can be matched to the property that the software recognizes and mitigate the threat. A “checklist” of specific dangers that must be accounted for is given by STRIDE for each mapping between a general threat classification and a DFD element type. Figure 7 depicts a sample of such a report and lists the name of the attack, the potential mitigation measures, and the priority.
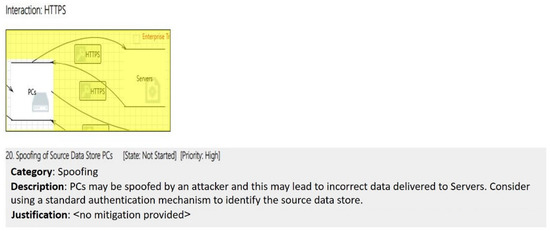
Figure 7.
A portion of the MTMT report.
The analysis table, each component and connection type, the mitigating condition, the type of attack, and a description are all displayed by the software. Figure 8 provides specifics. The software advises re-establishing network access controls and undertaking risk assessments to lessen the threat. Figure 9 depicts a case of a threat that has been minimized.
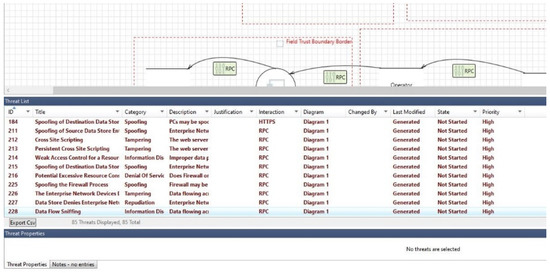
Figure 8.
An image of the threat list in the MTMT program.
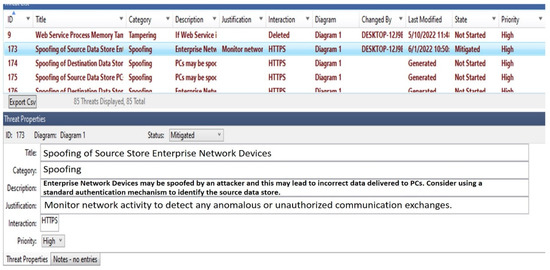
Figure 9.
Reduced threat.
We executed both the MTMT and our approach on a typical PC with a 2.8 GHz Intel Core i7 processor and 8 GB of memory. They are knowledge-based approaches, demanding prior understanding of the system model. Components, connectivity, assets, resources, vulnerabilities, attacker capabilities, and security requirements are all included in this. Formal determination of the system architecture model’s correctness determine how accurate the two schemes are. The STRIDE takes time since it analyzes the DFD element by element in comparison with a set of threats to which they are vulnerable [51]. It is therefore impossible to prove that interactions between parts of a system that are each resistant to a threat do not make the system susceptible to a threat. As a result of the assumptions made for the system under examination, it also generates a fairly long list of threats that the developer must prune.
The interdependencies between the system’s components are considered by our scheme when assessing the overall security of the system. The JKind checker was utilized to verify the system model under the security feature of interest, and the produced attack cases are shown graphically using the Graphviz tool. The AADL model’s pre and post requirements for attacker incidents helped to capture behavioral rules. Our scheme’s drawback is that it necessitates the system model’s accessibility. The relationship between the pre- and post-requirement number, the attack incidence number, and the dynamic state variables is linear [52]. The complexity of the model size and the security requirement length is polynomial [53].
5. Conclusions
Critical infrastructure, including the water supply, is becoming increasingly vulnerable to cyber–physical security threats. This work describes the implementation of a model-based attack graph and the visualization of a wastewater treatment plant (WTP) using the JKind model checker. Microsoft’s threat modeling tool (MTMT) was also examined. This allows the software architect to create a WTP system and to analyze and visualize any security holes and potential attacks based on the way that components are connected. Additionally, a report is produced, including a thorough analysis and recommendations for rebuilding the system to handle security issues. The level of abstraction used by the DFD, along with the appropriate placement of trust boundaries, determines how many potential dangers are acknowledged. Our findings demonstrate the requirement for managerial improvements, such as skills evaluation and suitable training to fill any gaps. The study of mitigation techniques and the utilization of artificial intelligence in calculating the worst-case attack scenario in which an attacker can inflict the highest degree of harm with the fewest attacks are among the aspects that need to be investigated going forward.
Author Contributions
Conceptualization, M.I. and A.A.-W.; methodology, M.I.; software, M.I. and A.A.-W.; validation, A.A.-W.; formal analysis, M.I.; investigation, A.A.-W.; resources, M.I. and A.A.-W.; data curation, A.A.-W.; writing—original draft preparation, M.I. and A.A.-W.; writing—review and editing, M.I.; visualization, A.A.-W.; supervision, M.I.; project administration, M.I.; funding acquisition, M.I. All authors have read and agreed to the published version of the manuscript.
Funding
This research was funded by the Deanship of Graduate Studies and Scientific Research at the German Jordanian University, Seed fund SATS 03/2020.
Data Availability Statement
All data are contained within the article.
Acknowledgments
The authors would like to acknowledge the Deanship of Graduation Studies and Scientific Research at the German Jordanian University for the Seed fund SATS 03/2020.
Conflicts of Interest
The authors declare no conflict of interest.
References
- Gerston, J. Water and Wastewater Utilities Enhance System Security. Available online: https://twri.tamu.edu/media/3885/volume-27-december-2002.pdf (accessed on 20 September 2022).
- Lemaire, L.; Lapon, J.; Decker, B.D.; Naessens, V. A SysML Extension for Security Analysis of Industrial Control Systems. Available online: https://ucl.scienceopen.com/document_file/341d79cf-3e6e-4778-9994-73bdd4222907/ScienceOpen/001_Lemaire.pdf (accessed on 20 September 2022).
- Lemaire, L.; Vossaert, J.; Jansen, J.; Naessens, V. A logic-based framework for the security analysis of Industrial Control Systems. Autom. Control Comput. Sci. 2017, 51, 114–123. [Google Scholar] [CrossRef]
- Stanculescu, M.; Badea, C.A.; Marinescu, I.; Andrei, P.; Drosu, O.; Andrei, H. Vulnerability of SCADA and security solutions for a waste water treatment plant. In Proceedings of the 11th International Symposium on Advanced Topics in Electrical Engineering (ATEE), Bucharest, Romania, 28–30 March 2019. [Google Scholar]
- Azevedo, M.T.; Martins, A.B.; Kofuji, S.T. ISA99-Security Standards in water treatment plants. In Proceedings of the Water/Wastewater Automatic Controls Symposium, Orlando, FL, USA, 6–8 August 2013. [Google Scholar]
- Tuptuk, N.; Hazell, P.; Watson, J.; Hailes, S. A Systematic Review of the State of Cyber-Security in Water Systems. Water 2021, 13, 81. [Google Scholar] [CrossRef]
- Gunda, T.; Hess, D.; Hornberger, G.M.; Worland, S. Water security in practice: The quantity-quality-society nexus. Water Secur. 2018, 6, 100022. [Google Scholar] [CrossRef]
- Grigg, N.S. Water Utility Security: Multiple Hazards and Multiple Barriers. J. Infrastruct. Syst. 2003, 9, 81–88. [Google Scholar] [CrossRef]
- Panguluri, S.; Phillips, W.; Cusimano, J. Protecting water and wastewater infrastructure from cyber attacks. Front. Earth Sci. 2011, 5, 406–413. [Google Scholar] [CrossRef]
- Iaiani, M.; Moreno, V.C.; Reniers, G.; Tugnoli, A.; Cozzani, V. Analysis of events involving the intentional release of hazardous substances from industrial facilities. Reliab. Eng. Syst. Saf. 2021, 212, 107593. [Google Scholar] [CrossRef]
- Hassanzadeh, A.; Rasekh, A.; Galelli, S.; Aghashahi, M.; Taormina, R.; Ostfeld, A.; Banks, K. A review of cybersecurity incidents in the water sector. arXiv 2020, arXiv:2001.11144. [Google Scholar] [CrossRef]
- Ackerman, G.; Abhayaratne, P.; Bale, J.; Bhattacharjee, A.; Blair, C.; Hansell, L.; Jayne, A.; Kosal, M.; Lucas, S.; Moran, K.; et al. Assessing Terrorist Motivations for Attacking Critical Infrastructure; Lawrence Livermore National Lab.: Livermore, CA, USA, 2006. [Google Scholar] [CrossRef]
- Ibrahim, M.; Elhafiz, R. Security Analysis of Smart Grids. Secur. Commun. Netw. 2022, 2022, 7199301. [Google Scholar] [CrossRef]
- Kaynar, K.; Sivrikaya, F. Distributed attack graph generation. In IEEE Transactions on Dependable and Secure Computing; IEEE Computer Society Press: Los Alamitos, CA, USA, 2015; Volume 13, pp. 519–532. [Google Scholar]
- Stan, O.; Bitton, R.; Ezrets, M.; Dadon, M.; Inokuchi, M.; Ohta, Y.; Yamada, Y.; Yagyu, T.; Elovici, Y.; Shabtai, A. Extending Attack Graphs to Represent Cyber-Attacks in Communication Protocols and Modern IT Networks. IEEE Trans. Dependable Secur. Comput. 2020, 19, 1936–1954. [Google Scholar] [CrossRef]
- Feng, Y.; Sun, G.; Liu, Z.; Wu, C.; Zhu, X.; Wang, Z.; Wang, B. Attack Graph Generation and Visualization for Industrial Control Network. In Proceedings of the 2020 39th Chinese Control Conference (CCC), Shenyang, China, 27–29 July 2020; pp. 7655–7660. [Google Scholar] [CrossRef]
- Imano, M.; Yuan, X. Evaluating the effectiveness of microsoft threat modeling tool. In Proceedings of the 2015 Information Security Curriculum Development Conference, Kennesaw, GA, USA, 10 October 2015. [Google Scholar]
- Al-Mohannadi, H.; Mirza, Q.; Namanya, A.; Awan, I.; Cullen, A.; Disso, J. Cyber-Attack Modeling Analysis Techniques: An Overview. In Proceedings of the 4th International Conference on Future Internet of Things and Cloud Workshops, Vienna, Austria, 22–24 August 2016. [Google Scholar]
- Jbair, M.; Ahmad, B.; Maple, C.; Harrison, R. Threat modelling for industrial cyber physical systems in the era of smart manufacturing. Comput. Ind. 2022, 137, 103611. [Google Scholar] [CrossRef]
- PCS 7 Water Unit Template—External Pump Station of a Wastewater Treatment Plant (WWTP) with S7-300. Available online: https://support.industry.siemens.com/cs/document/109481486/pcs-7-water-unit-template-%E2%80%93-external-pump-station-of-a-wastewater-treatment-plant-(wwtp)-?dti=0&lc=en-CR (accessed on 8 August 2022).
- Water and Wastewater Treatment Solutions for Wastewater and Drinking Water Treatment. Available online: https://www.phoenixcontact.com/assets/downloads_ed/global/web_dwl_promotion/5177187_EN_HQ_water_management_LoRes.pdf (accessed on 8 August 2022).
- U.S. Department of Homeland Security. Characteristics and common vulnerabilities infrastructure category: Community wastewater treatment facilities. In Protective Security Division Department of Homeland Security DRAFT—Version 1; U.S. Department of Homeland Security: Williston, VT, USA, 2004. [Google Scholar]
- Abdelrahman, A.M.; Aras, M.F.; Cicekalan, B.; Fakioglu, M.; Cingoz, S.; Basa, S.; Guven, H.; Ozgun, H.; Ozturk, I.; Koyuncu, I.; et al. Primary and A-sludge treatment by anaerobic membrane bioreactors in view of energy-positive wastewater treatment plants. Bioresour. Technol. 2022, 351, 126965. [Google Scholar] [CrossRef] [PubMed]
- Instrumentation for the Water & Wastewater Industries Enhanced Plant Performance, Efficiency, and Reliability. Available online: https://library.e.abb.com/public/4c9318456366bf77c1257b1a005b4fcf/PB_WaterIndustry_Issue%201-low.pdf (accessed on 8 August 2022).
- Abbasi, N.; Ahmadi, M.; Naseri, M. Quality and cost analysis of a wastewater treatment plant using GPS-X and CapdetWorks simulation programs. J. Environ. Manag. 2021, 284, 111993. [Google Scholar] [CrossRef] [PubMed]
- The Water Research Commission. Handbook for the Operation of Water Treatment Works; Schutte, K., Ed.; The Water Institute of Southern Africa: Randjespark, South Africa, 2006. [Google Scholar]
- Baruth, E.E. American Water Works Association American Society of Civil Engineers. In Water Treatment Plant Design; American Water Works Association: Denver, CO, USA, 2005. [Google Scholar]
- Calvo, I.; Etxeberria-Agiriano, I.; Iñigo, M.A.; González-Nalda, P. Key Vulnerabilities of Industrial Automation and Control Systems and Recommendations to Prevent Cyber-Attacks. Int. J. Online Eng. 2016, 12, 9–16. [Google Scholar] [CrossRef]
- Shen, J.; Feng, D. Vulnerability analysis of CSP based on stochastic game theory. J. Control Sci. Eng. 2016, 2016, 4147251. [Google Scholar] [CrossRef]
- Zhu, W.; Wang, Z.; Zhang, Z. Renovation of Automation System Based on Industrial Internet of Things: A Case Study of a Sewage Treatment Plant. Sensors 2020, 20, 2175. [Google Scholar] [CrossRef]
- Iaiani, M.; Tugnoli, A.; Bonvicini, S.; Cozzani, V. Analysis of Cybersecurity-related Incidents in the Process Industry. Reliab. Eng. Syst. Saf. 2021, 209, 107485. [Google Scholar] [CrossRef]
- Guruprakash, S.; Rajendra, S.; Singh, P. Automation and supply of distributed control systems for crude oil field industries. Int. Res. J. Eng. Technol. IRJET 2020, 7, 6155–6161. [Google Scholar]
- Pongswatd, S.; Smerpitak, K.; Asadi, F.; Thepmanee, T. Design of PLC-based system for linearity output voltage of AC–DC converter. Energy Rep. 2021, 8, 972–978. [Google Scholar] [CrossRef]
- Fan, Y.; Qian, F.; Huang, Y.; Sifat, I.; Zhang, C.; Depasquale, A.; Wang, L.; Li, B. Miniature microbial fuel cells integrated with triggered power management systems to power wastewater sensors in an uninterrupted mode. Appl. Energy 2021, 302, 117556. [Google Scholar] [CrossRef]
- Vadi, S.; Bayindir, R.; Toplar, Y.; Colak, I. Induction motor control system with a Programmable Logic Controller (PLC) and Profibus communication for industrial plants—An experimental setup. ISA Trans. 2021, 122, 459–471. [Google Scholar] [CrossRef]
- Rais, M.H.; Awad, R.A.; Lopez, J., Jr.; Ahmed, I. Memory forensic analysis of a programmable logic controller in industrial control systems. Forensic Sci. Int. Digit. Investig. 2022, 40, 301339. [Google Scholar] [CrossRef]
- Okhravi, H.; Sheldon, F.T.; Haines, J. Data Diodes in Support of Trustworthy Cyber Infrastructure and Net-Centric Cyber Decision Support. In Optimization and Security Challenges in Smart Power Grids. Energy Systems; Springer: Berlin/Heidelberg, Germany, 2013; pp. 203–216. [Google Scholar] [CrossRef]
- Lin, Q.; Yuan, Y.; Zan, F.; Lu, H.; Wang, Z.; Guo, G. A novel online analyzer for accurate and rapid measurement of volatile fatty acids in anaerobic wastewater treatment. J. Environ. Sci. 2022, 122, 72–82. [Google Scholar] [CrossRef]
- Petersena, S.; Myhrea, B.; Røstumb, J. CCWIWireless instrumentation for the water and wastewater industry. In Proceedings of the 12th International Conference on Computing and Control for the Water Industry, Perugia, Italy, 2–4 September 2013. [Google Scholar]
- Longueira-Romero, Á.; Iglesias, R.; Flores, J.L.; Garitano, I. A Novel Model for Vulnerability Analysis through Enhanced Directed Graphs and Quantitative Metrics. Sensors 2022, 22, 2126. [Google Scholar] [CrossRef] [PubMed]
- Tran, H.; Campos-Nanez, E.; Fomin, P.; Wasek, J. Cyber resilience recovery model to combat zero-day malware attacks. Comput. Secur. 2016, 61, 19–31. [Google Scholar] [CrossRef]
- Elvis, E.Y.-B.; Elvis, A.-B. Cyber-Security Intelligence Gathering: Issues with Knowledge Management. In Cyber Security and Threats: Concepts, Methodologies, Tools, and Applications; IGI Global: Hershey, PA, USA, 2018. [Google Scholar]
- Khelif, M.A.; Lorandel, J.; Romain, O.; Regnery, M.; Baheux, D.; Barbu, G. Toward a hardware man-in-the-middle attack on PCIe bus. Microprocess. Microsystems 2020, 77, 103198. [Google Scholar] [CrossRef]
- Ramtin, A.R.; Nain, P.; Menasche, D.S.; Towsley, D.; de Souza, E. Fundamental scaling laws of covert DDoS attacks. Perform. Eval. 2021, 151, 102236. [Google Scholar] [CrossRef]
- Qabajeh, I.; Thabtah, F.; Chiclana, F. A recent review of conventional vs. automated cybersecurity anti-phishing techniques. Comput. Sci. Rev. 2018, 29, 44–55. [Google Scholar] [CrossRef]
- Huda, S.; Abawajy, J.; Al-Rubaie, B.; Pan, L.; Hassan, M.M. Automatic extraction and integration of behavioural indicators of malware for protection of cyber–physical networks. Futur. Gener. Comput. Syst. 2019, 101, 1247–1258. [Google Scholar] [CrossRef]
- Sari, R.D.; Supiyandi, S.; Siahaan, A.P.U. A Review of IP and MAC Address Filtering in Wireless Network Security. Int. J. Sci. Res. Sci. Technol. 2017, 3, 470–473. [Google Scholar] [CrossRef]
- Jaha, A.A.; Ben Shatwan, F.; Ashibani, M. Proper Virtual Private Network (VPN) Solution. In Proceedings of the 2008 The Second International Conference on Next Generation Mobile Applications, Services, and Technologies, Cardiff, UK, 16–19 September 2008; pp. 309–314. [Google Scholar] [CrossRef]
- Nath, A.; Mondal, T. Issues and Challenges in Two Factor Authentication Algorithms. Int. J. Latest Trends Eng. Technol. 2016, 6, 318–327. [Google Scholar]
- Jain, Y.K.; Singh, S. Honeypot based Secure Network System. Int. J. Comput. Sci. Eng. 2021, 3, 612–620. [Google Scholar]
- Scandariato, R.; Wuyts, K.; Joosen, W. A descriptive study of Microsoft’s threat modeling technique. Requir. Eng. 2013, 20, 163–180. [Google Scholar] [CrossRef]
- Al Ghazo, A.; Ibrahim, M.; Ren, H.; Kumar, R. A2G2V: Automatic Attack Graph Generation and Visualization and Its Ap-plications to Computer and SCADA Networks. IEEE Trans. Syst. Man Cybern Syst. 2019, 50, 3488–3498. [Google Scholar] [CrossRef]
- Schnoebelen, P. The Complexity of Temporal Logic Model Checking. Adv. Modal Log. 2002, 4, 35–79. [Google Scholar]


Publisher’s Note: MDPI stays neutral with regard to jurisdictional claims in published maps and institutional affiliations. |
© 2022 by the authors. Licensee MDPI, Basel, Switzerland. This article is an open access article distributed under the terms and conditions of the Creative Commons Attribution (CC BY) license (https://creativecommons.org/licenses/by/4.0/).